Exploring the Molecular Mechanism of the Drug-Treated Breast Cancer Based on Gene Expression Microarray

 ,
,  and
and 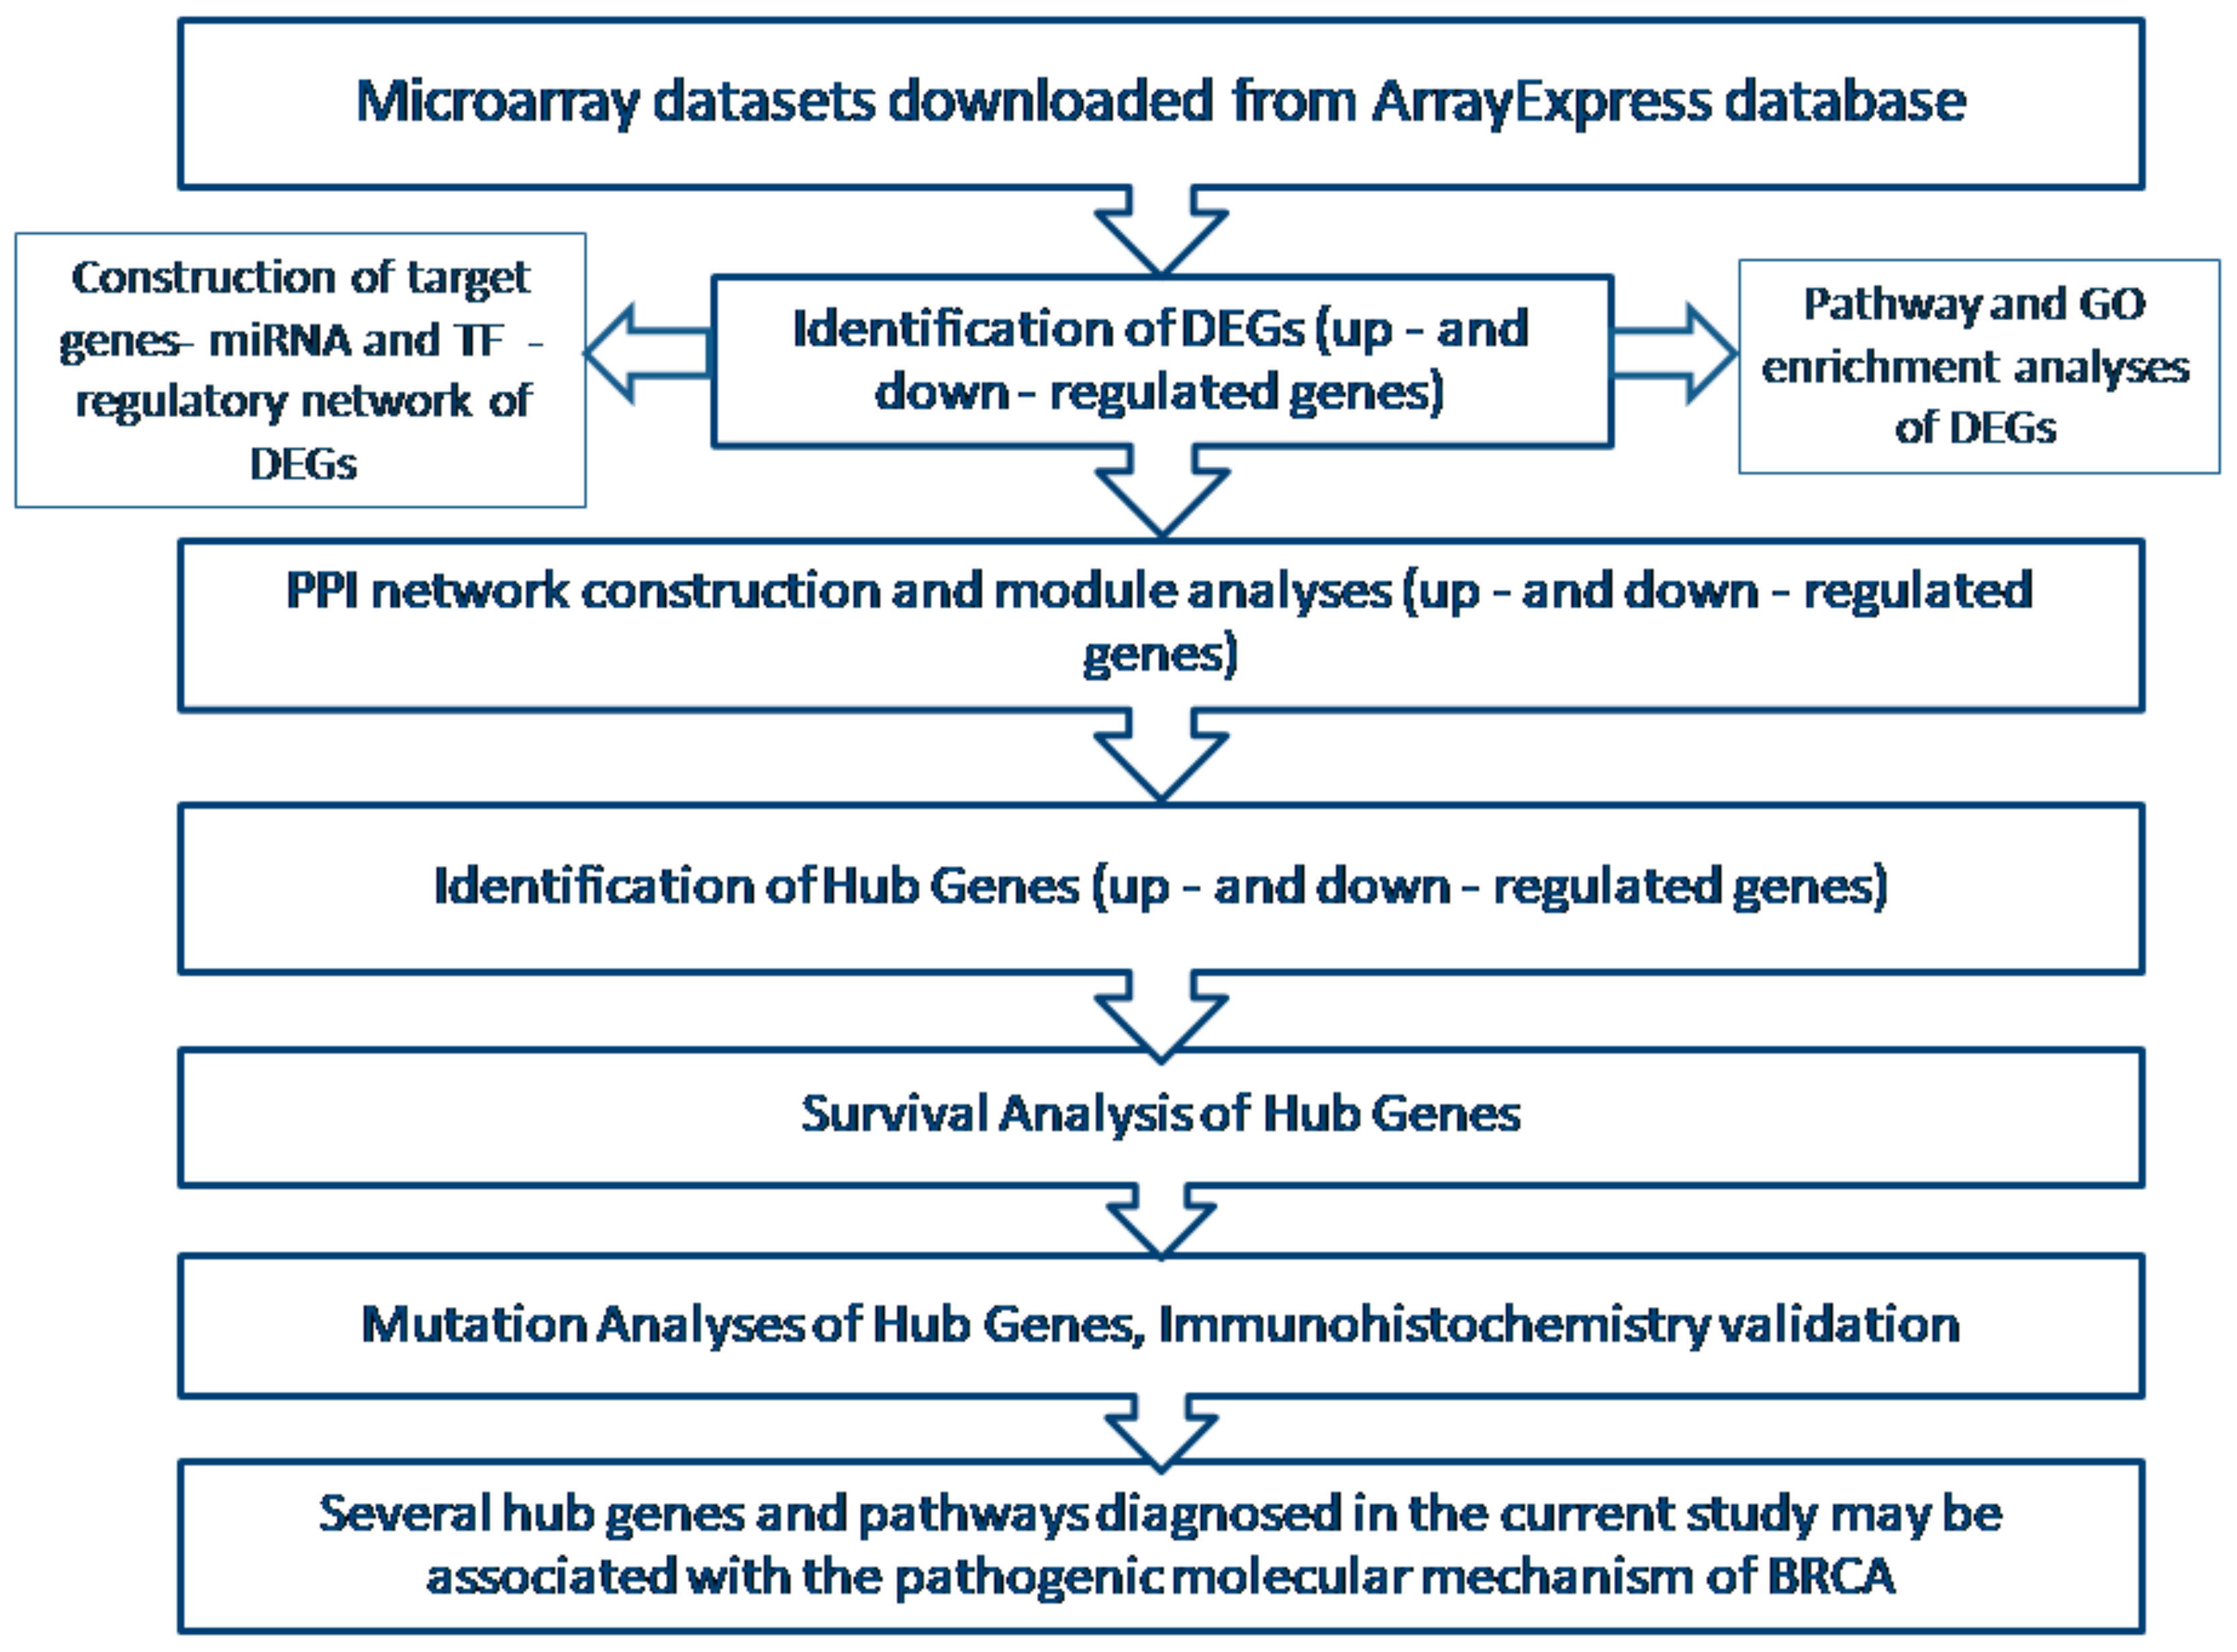
Abstract
1. Introduction
2. Materials and Methods
2.1. Agilent Microarray Data
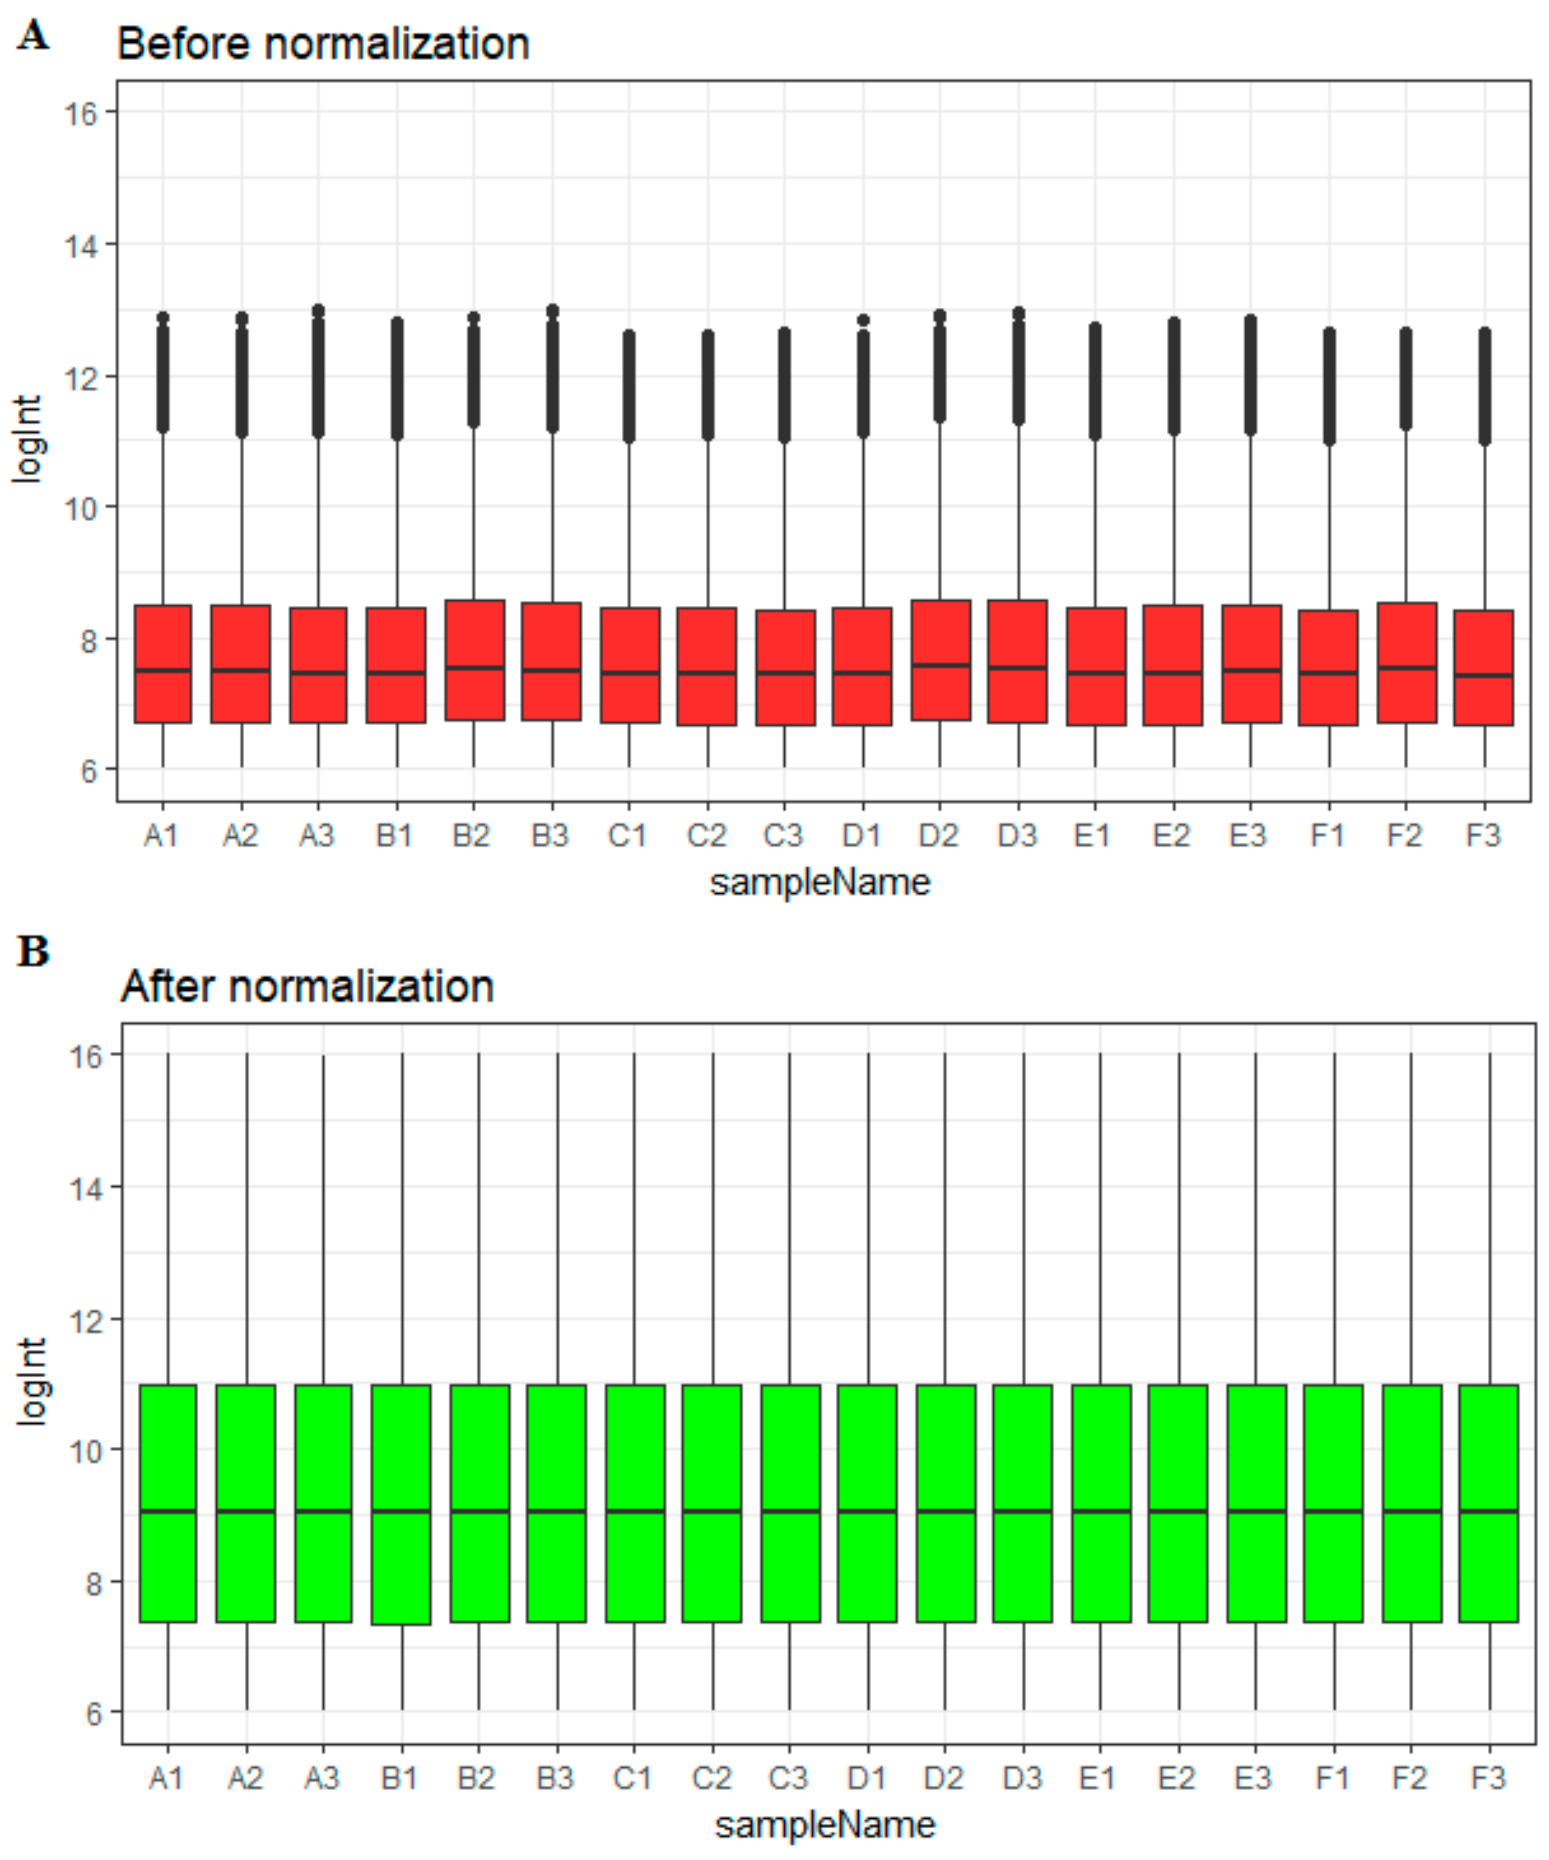
2.2. Data Preprocessing
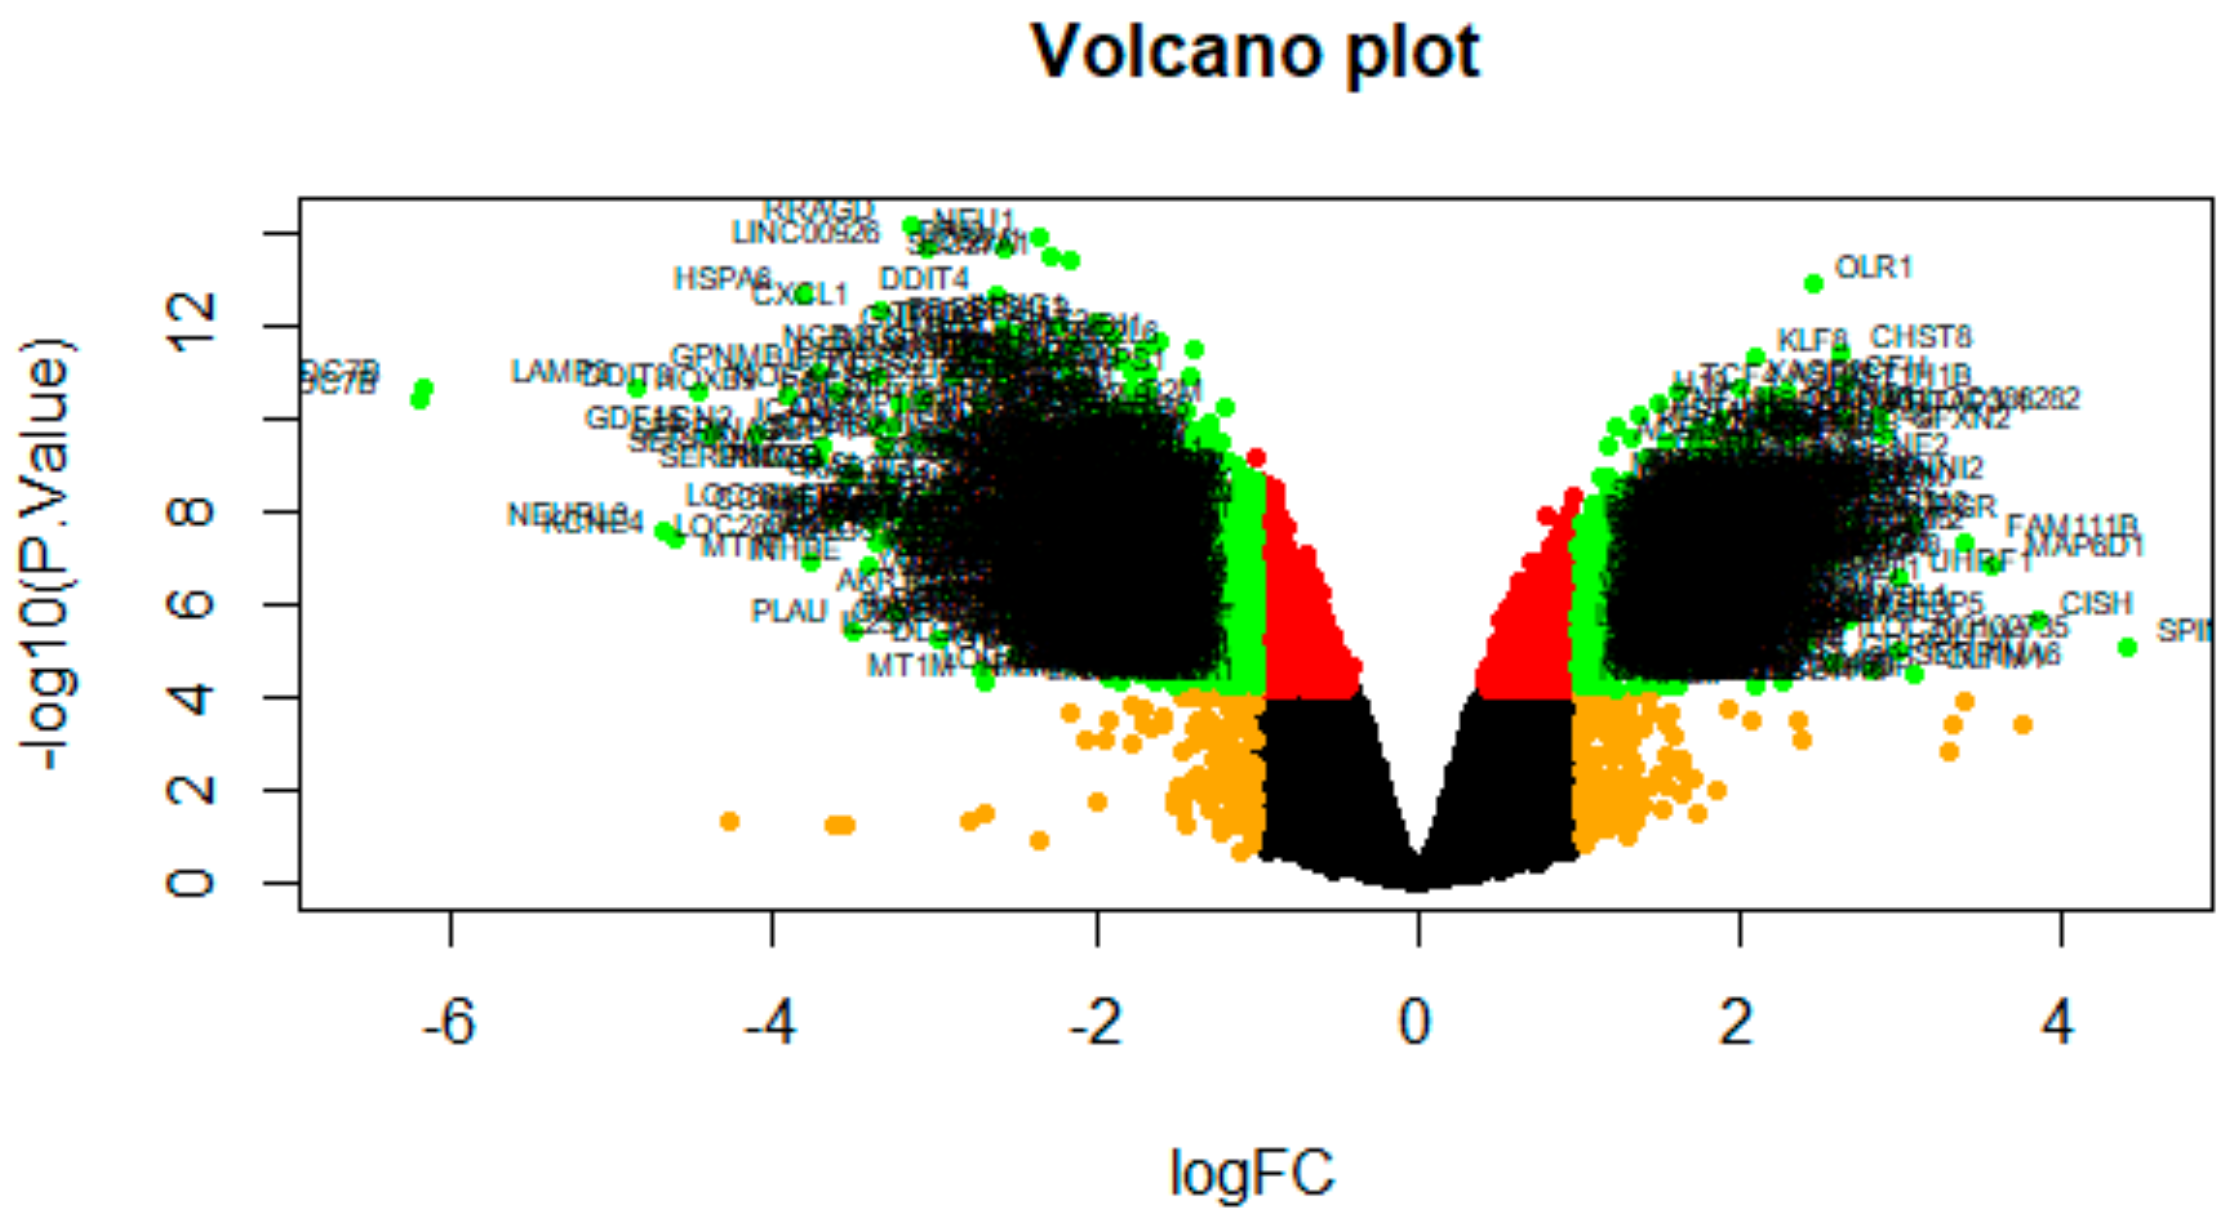
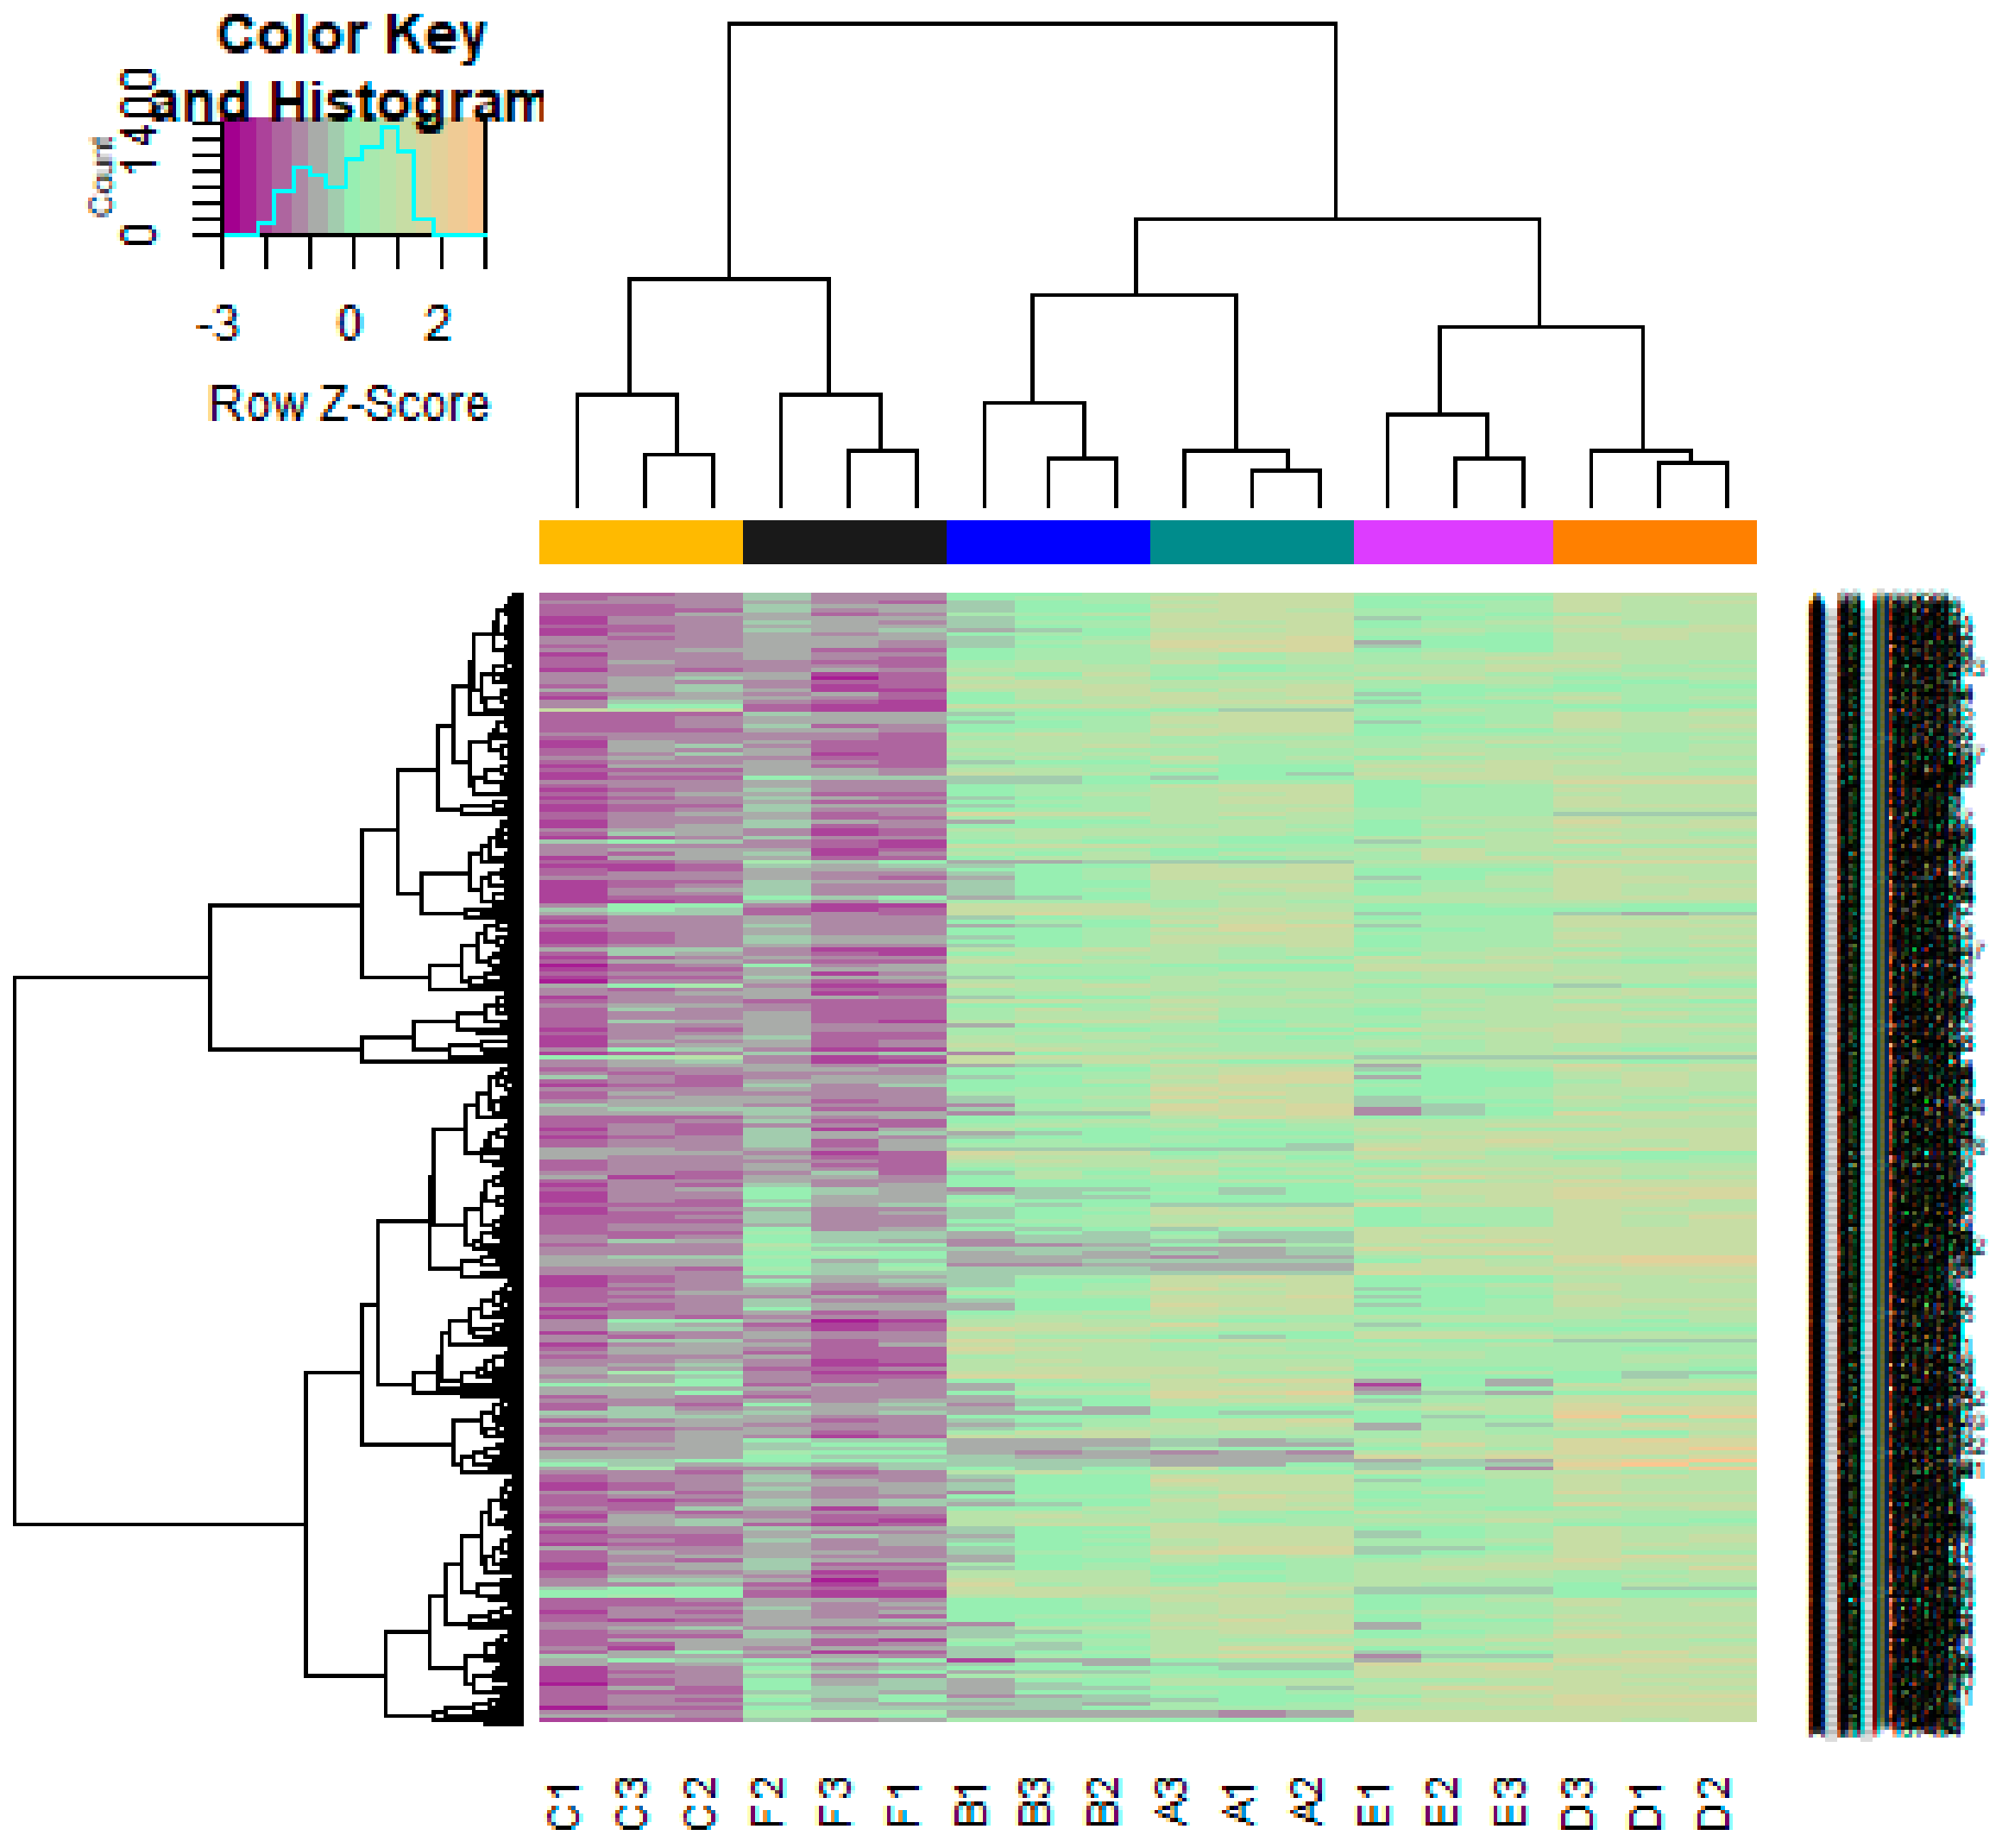
2.3. Identification of DEGs
2.4. Pathway Enrichment Analyses of DEGs
2.5. Gene Ontology (GO) Enrichment Analysis
2.6. PPI Network Construction and Module Analysis
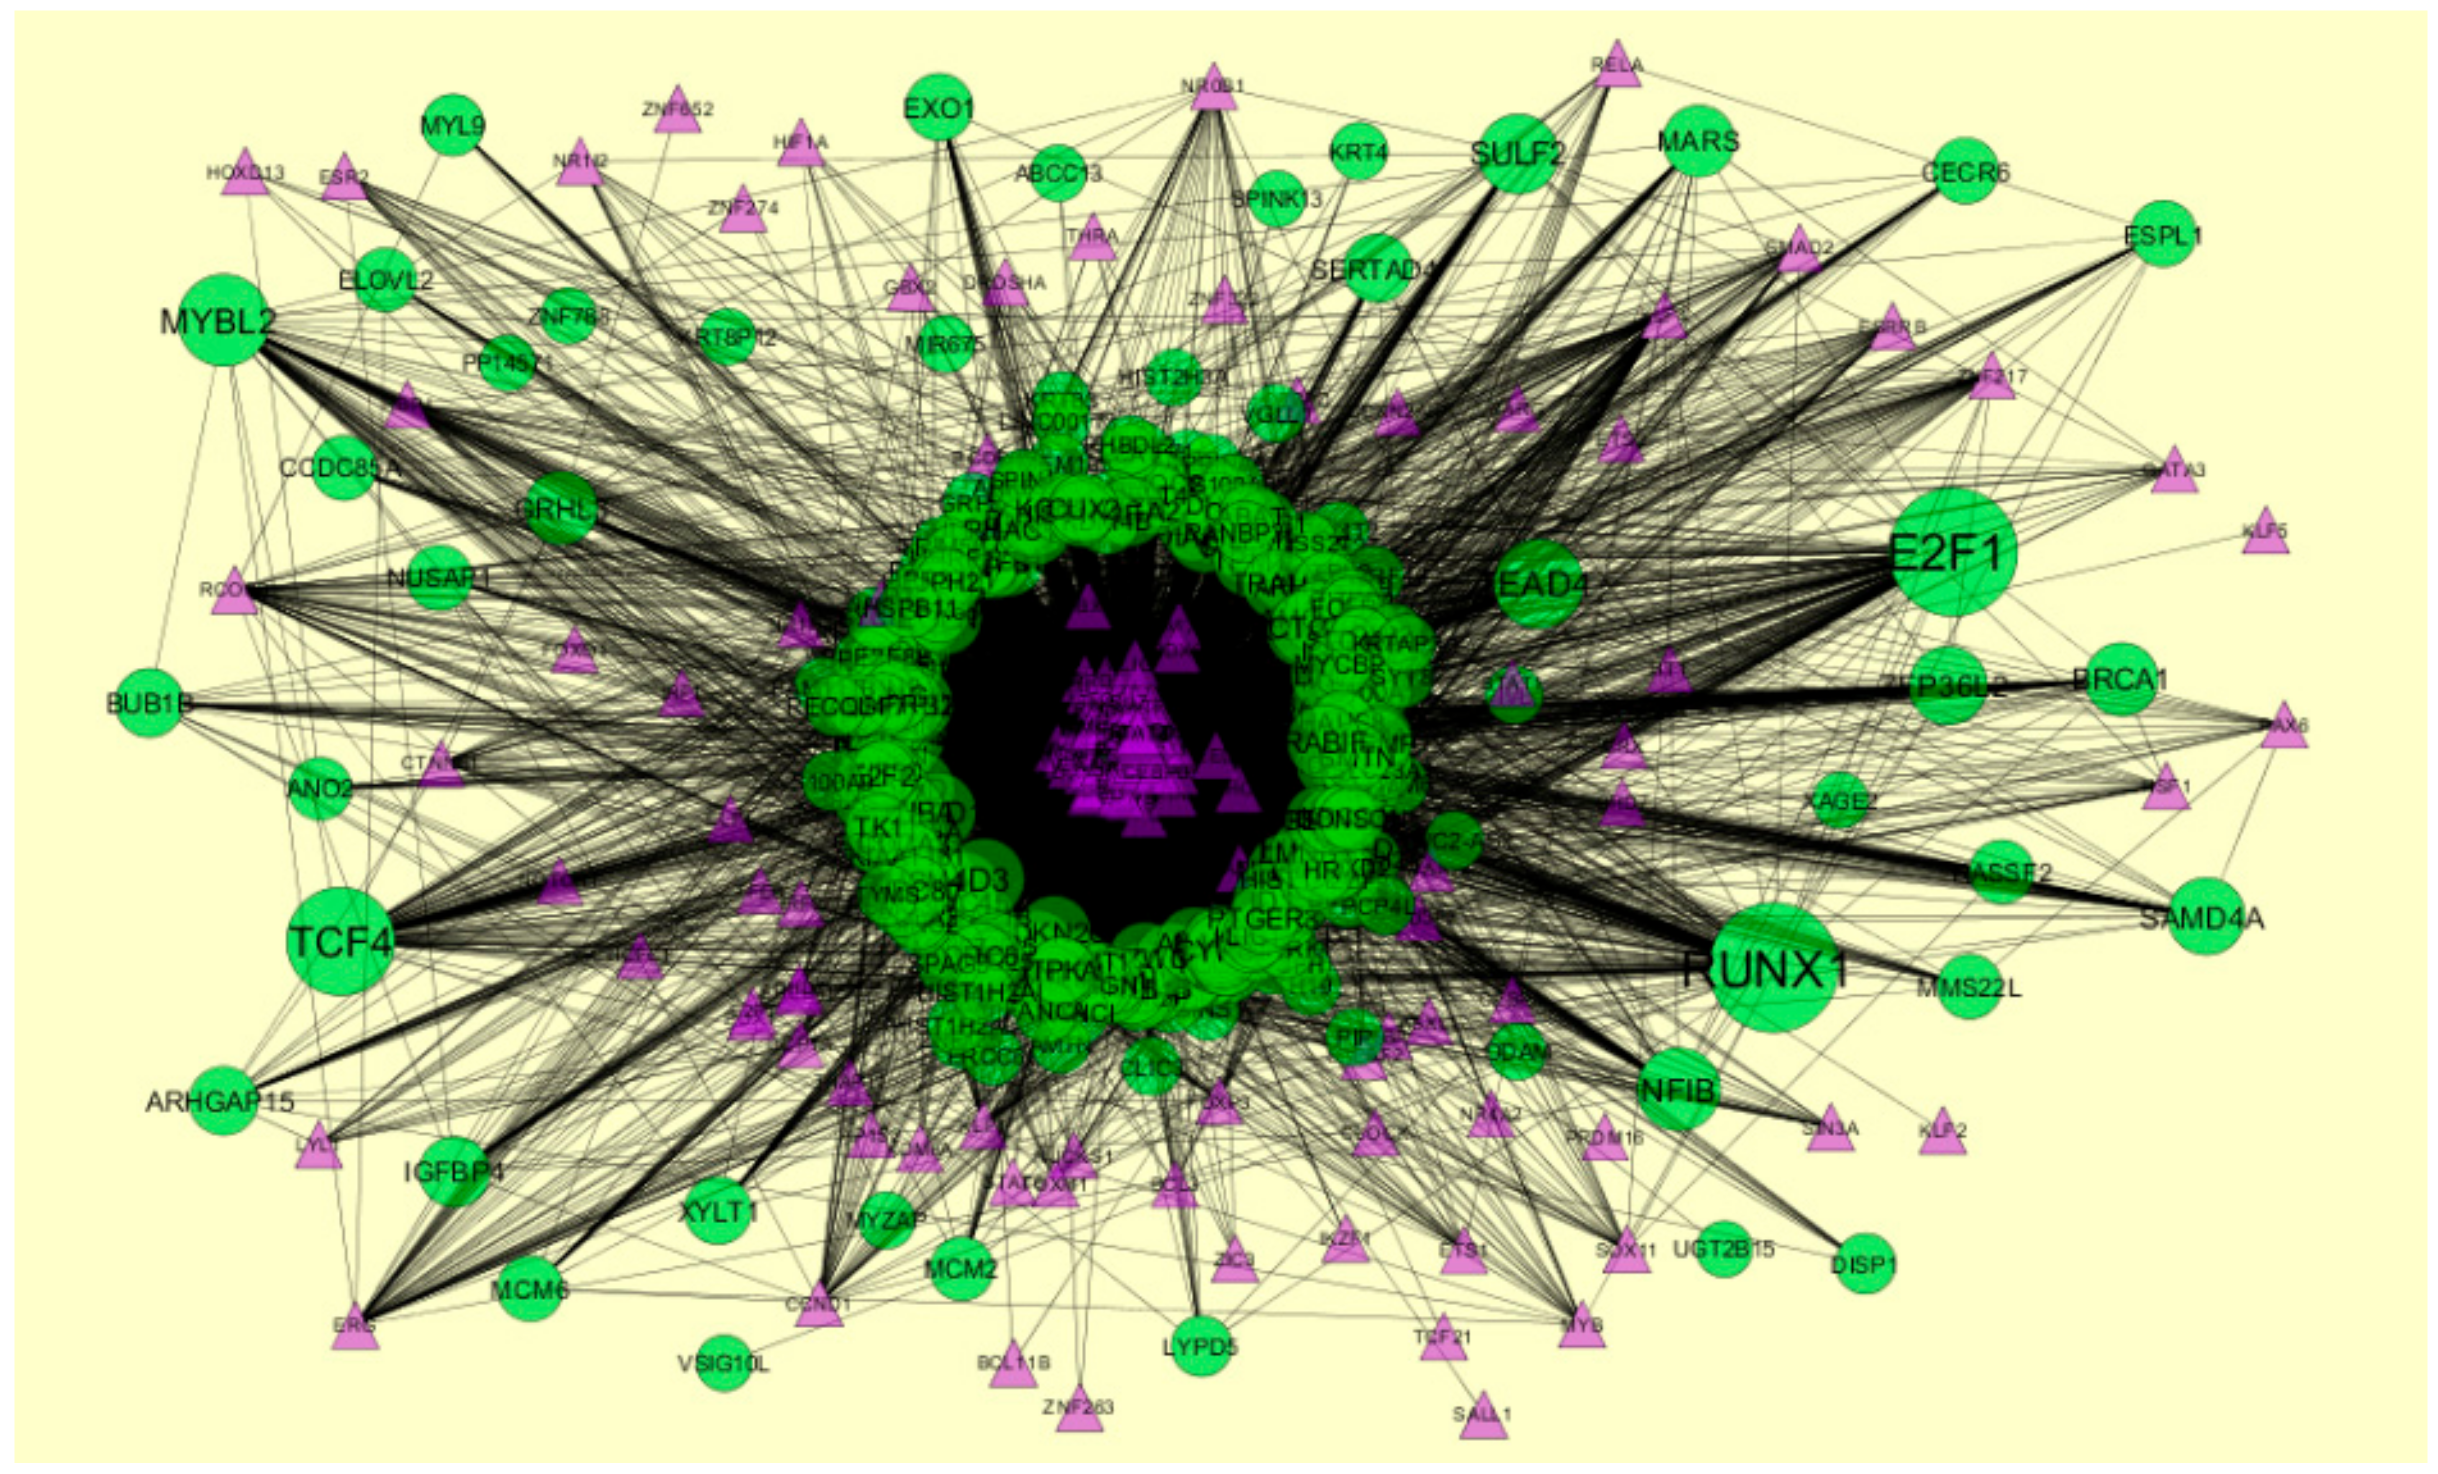
2.7. Construction of Target Genes-miRNA Regulatory Network
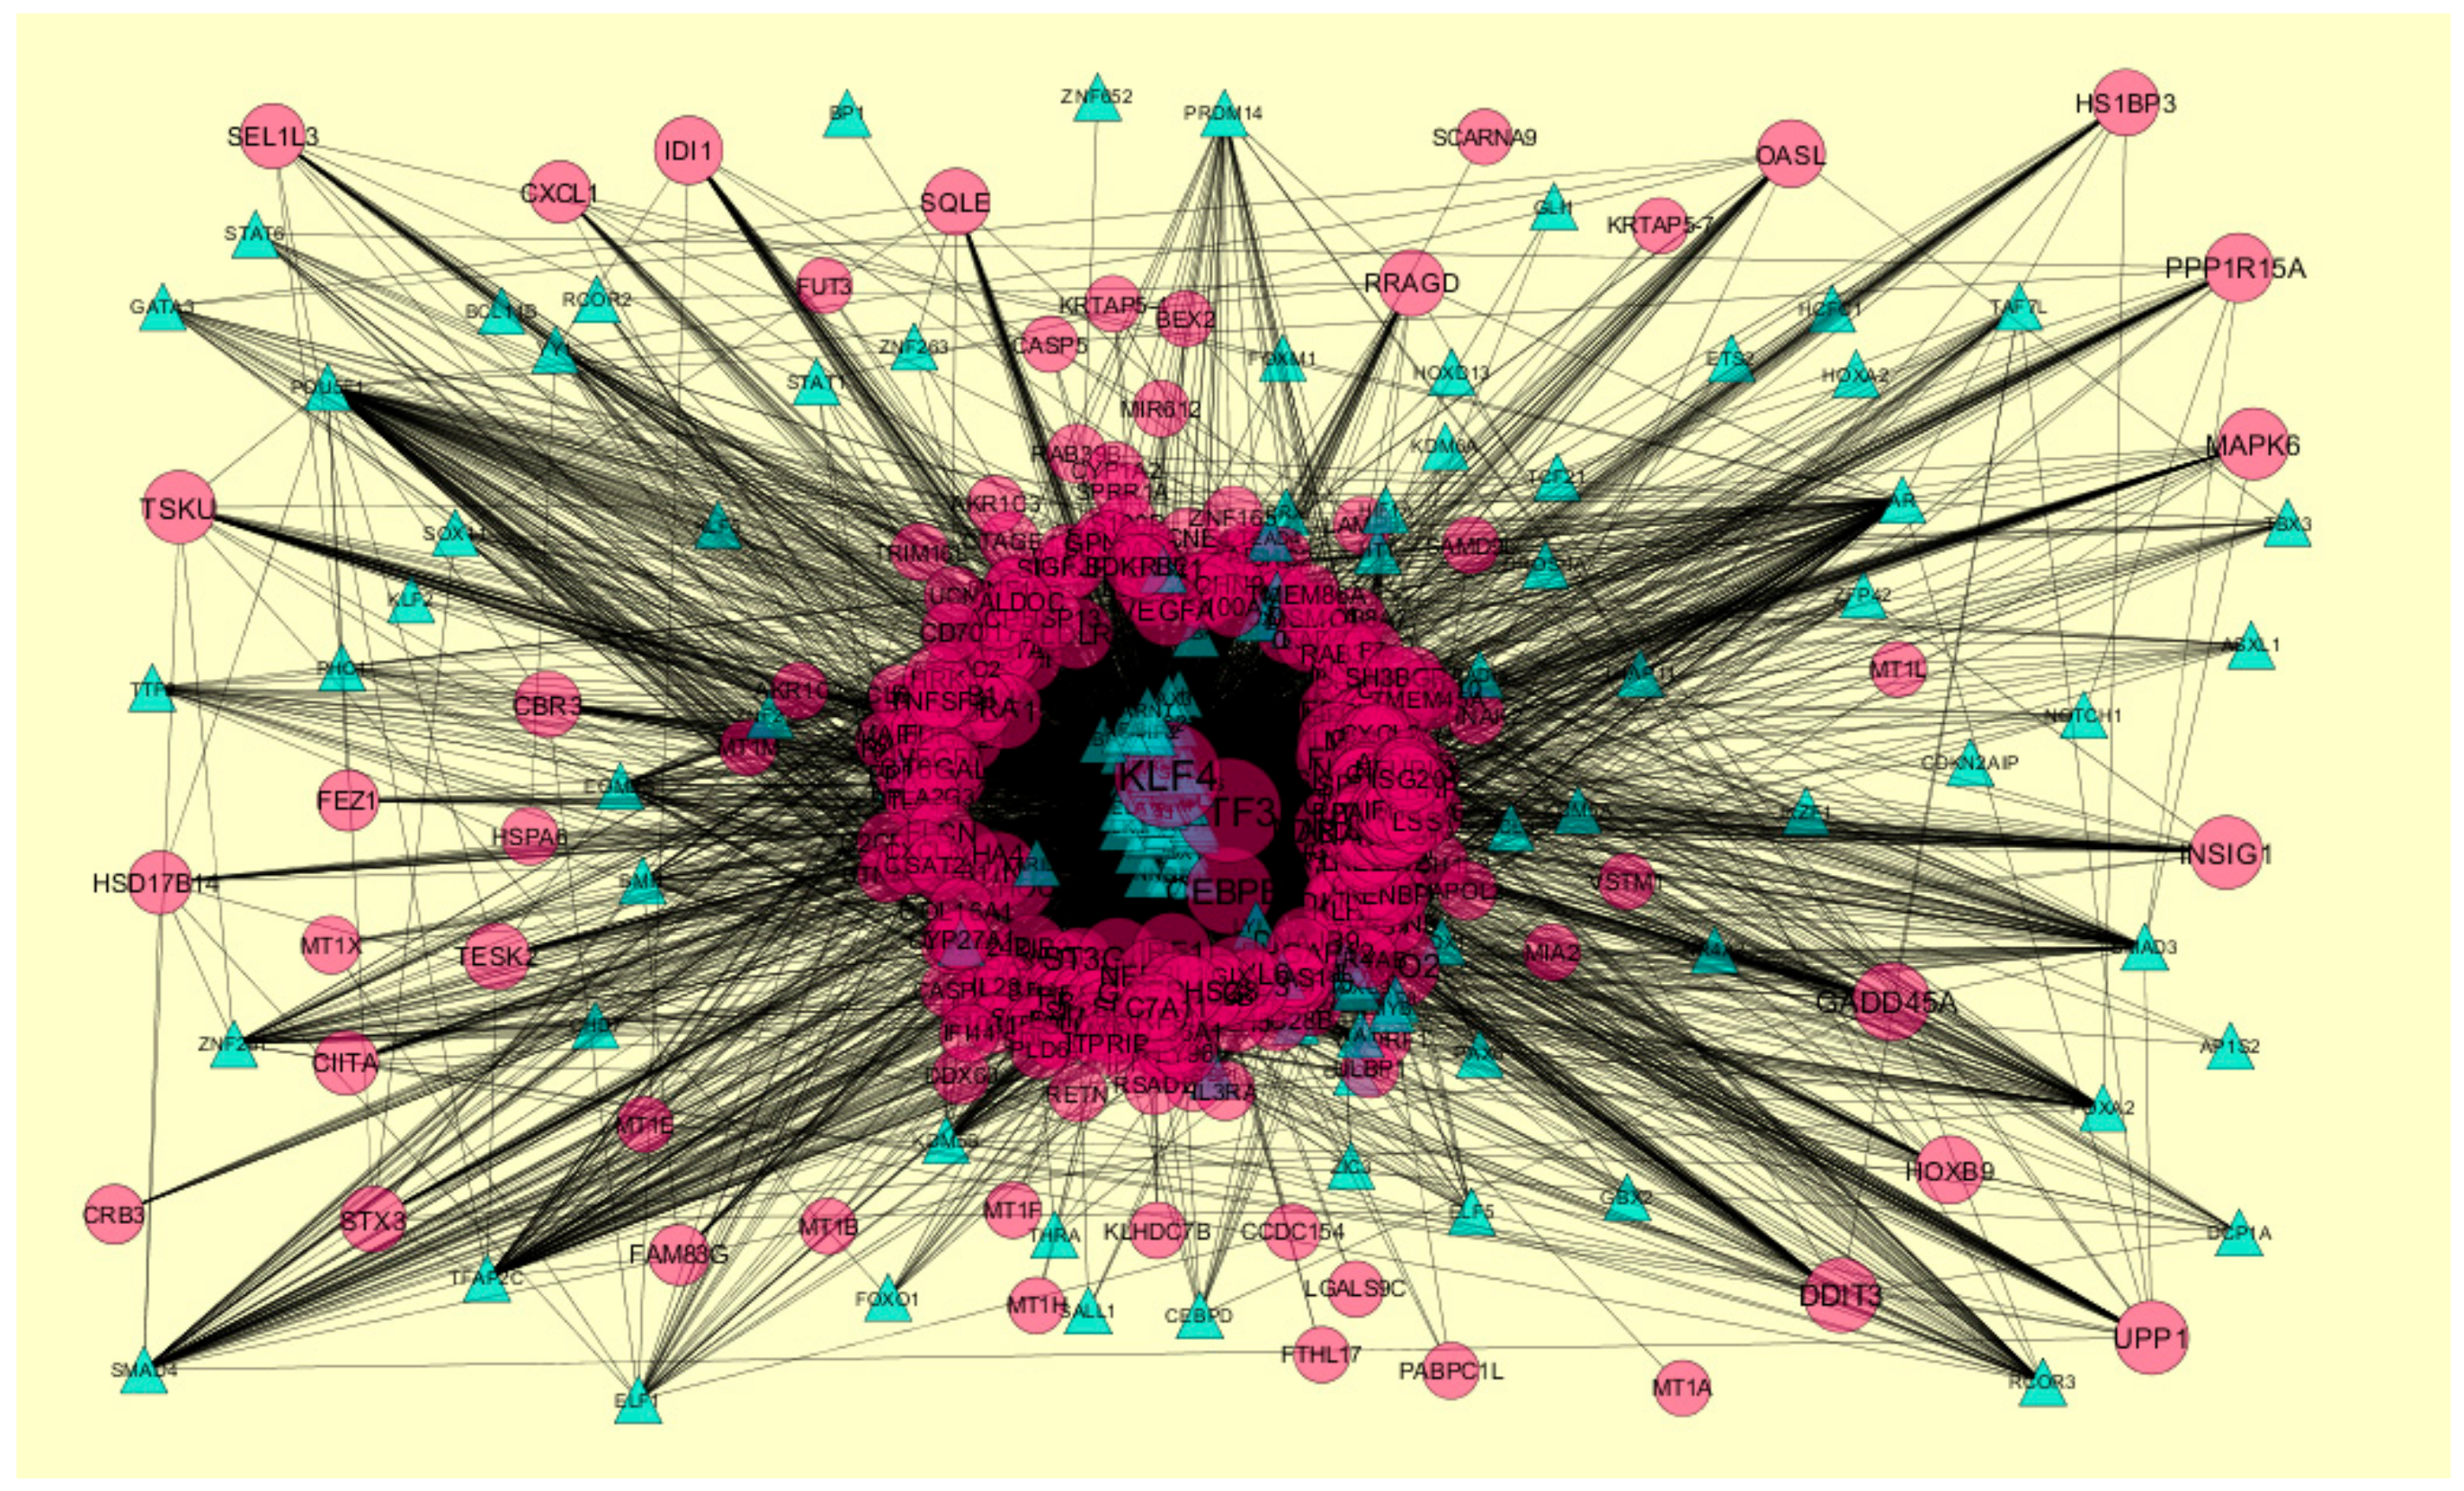
2.8. Construction of Target Genes-TF Regulatory Network
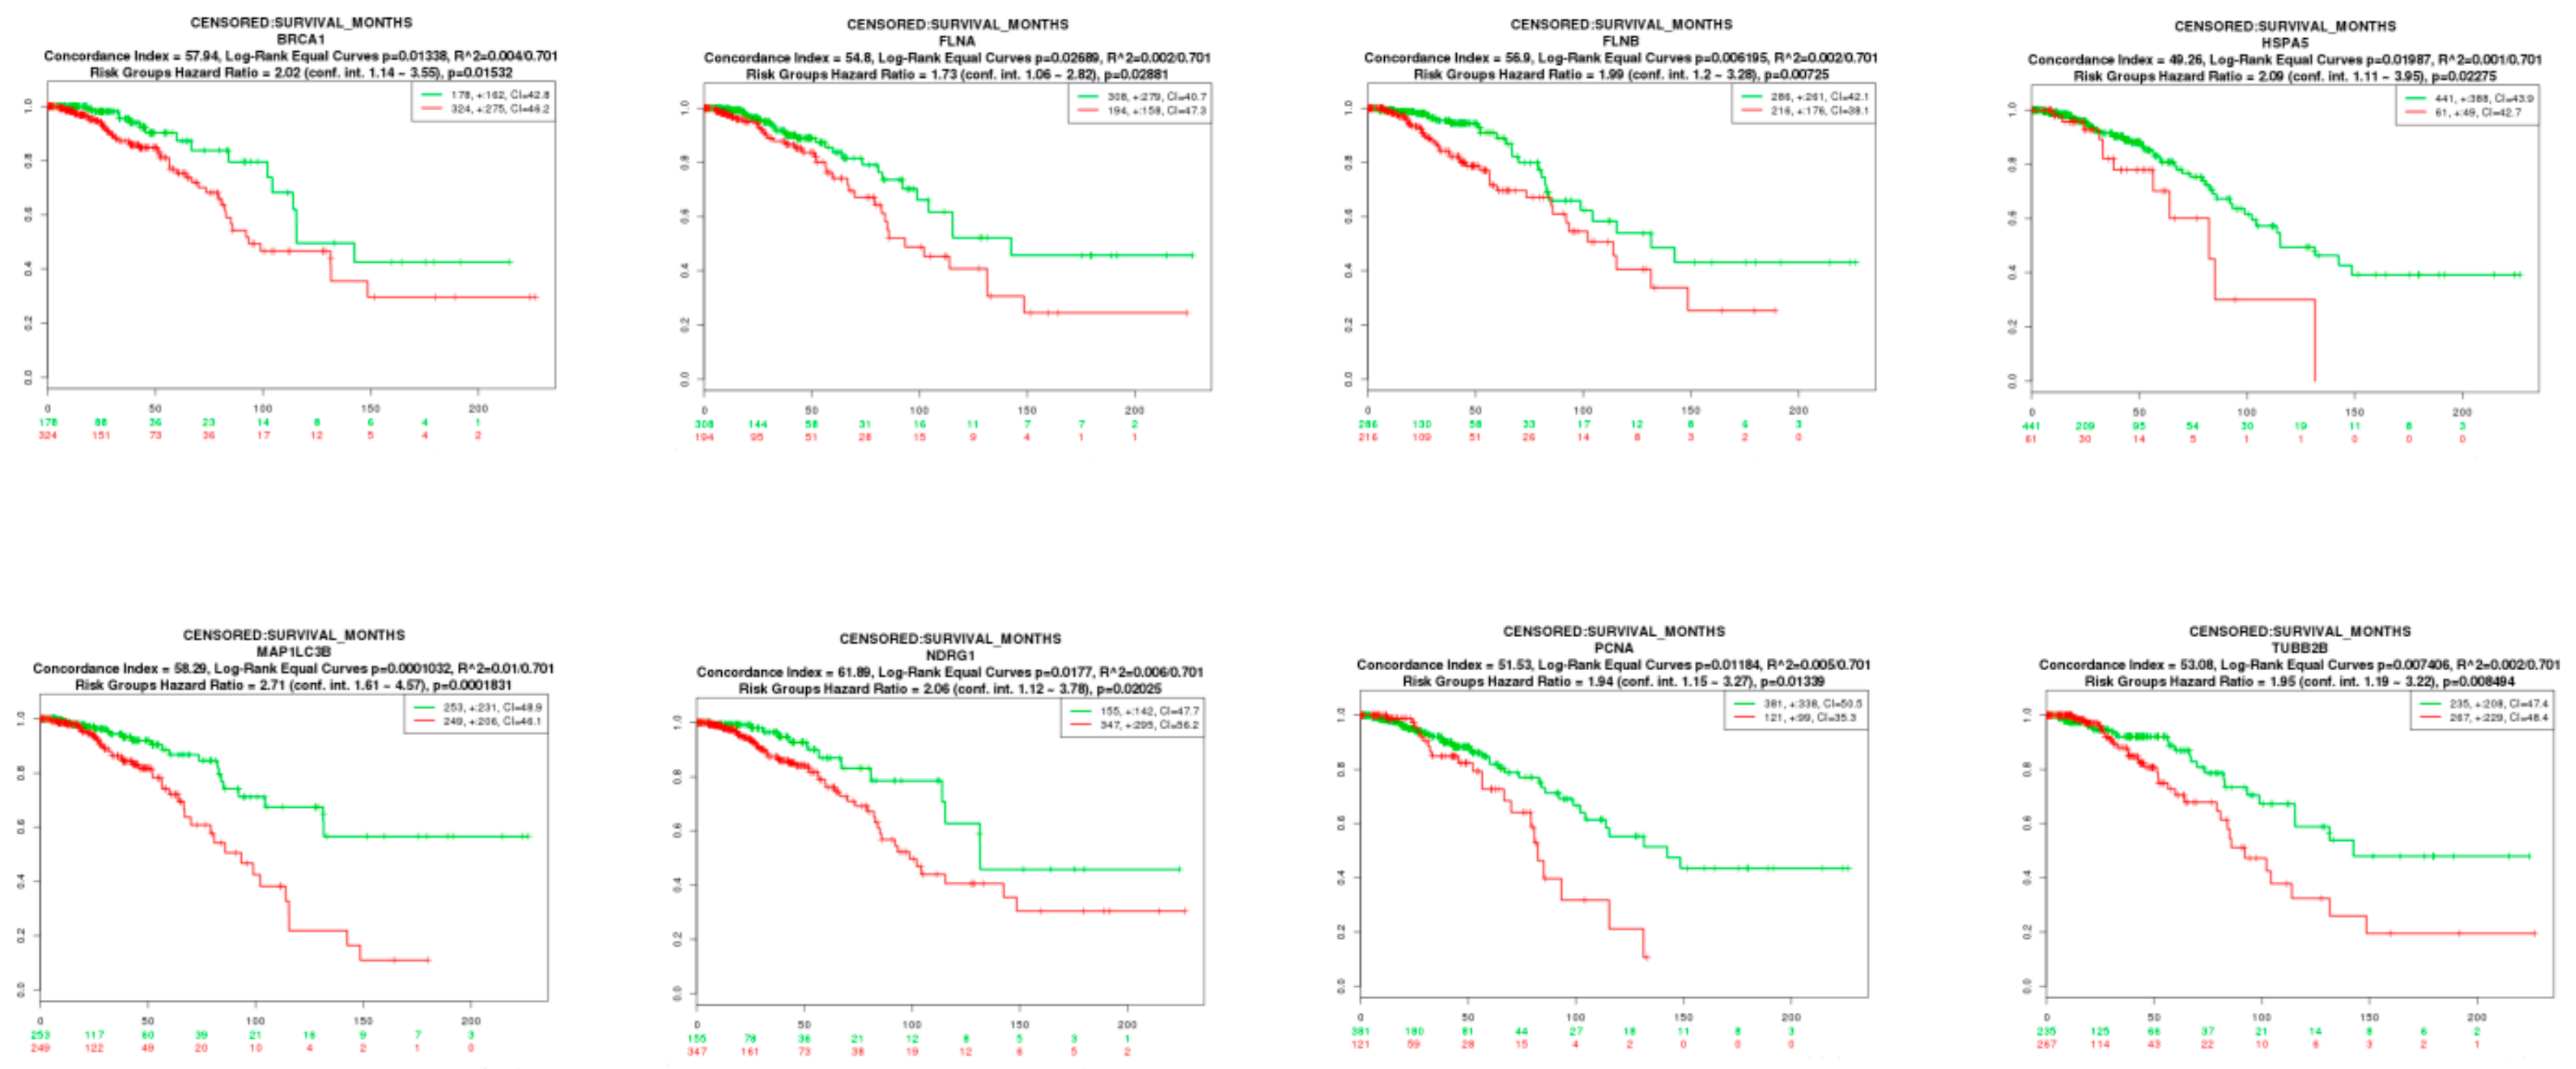
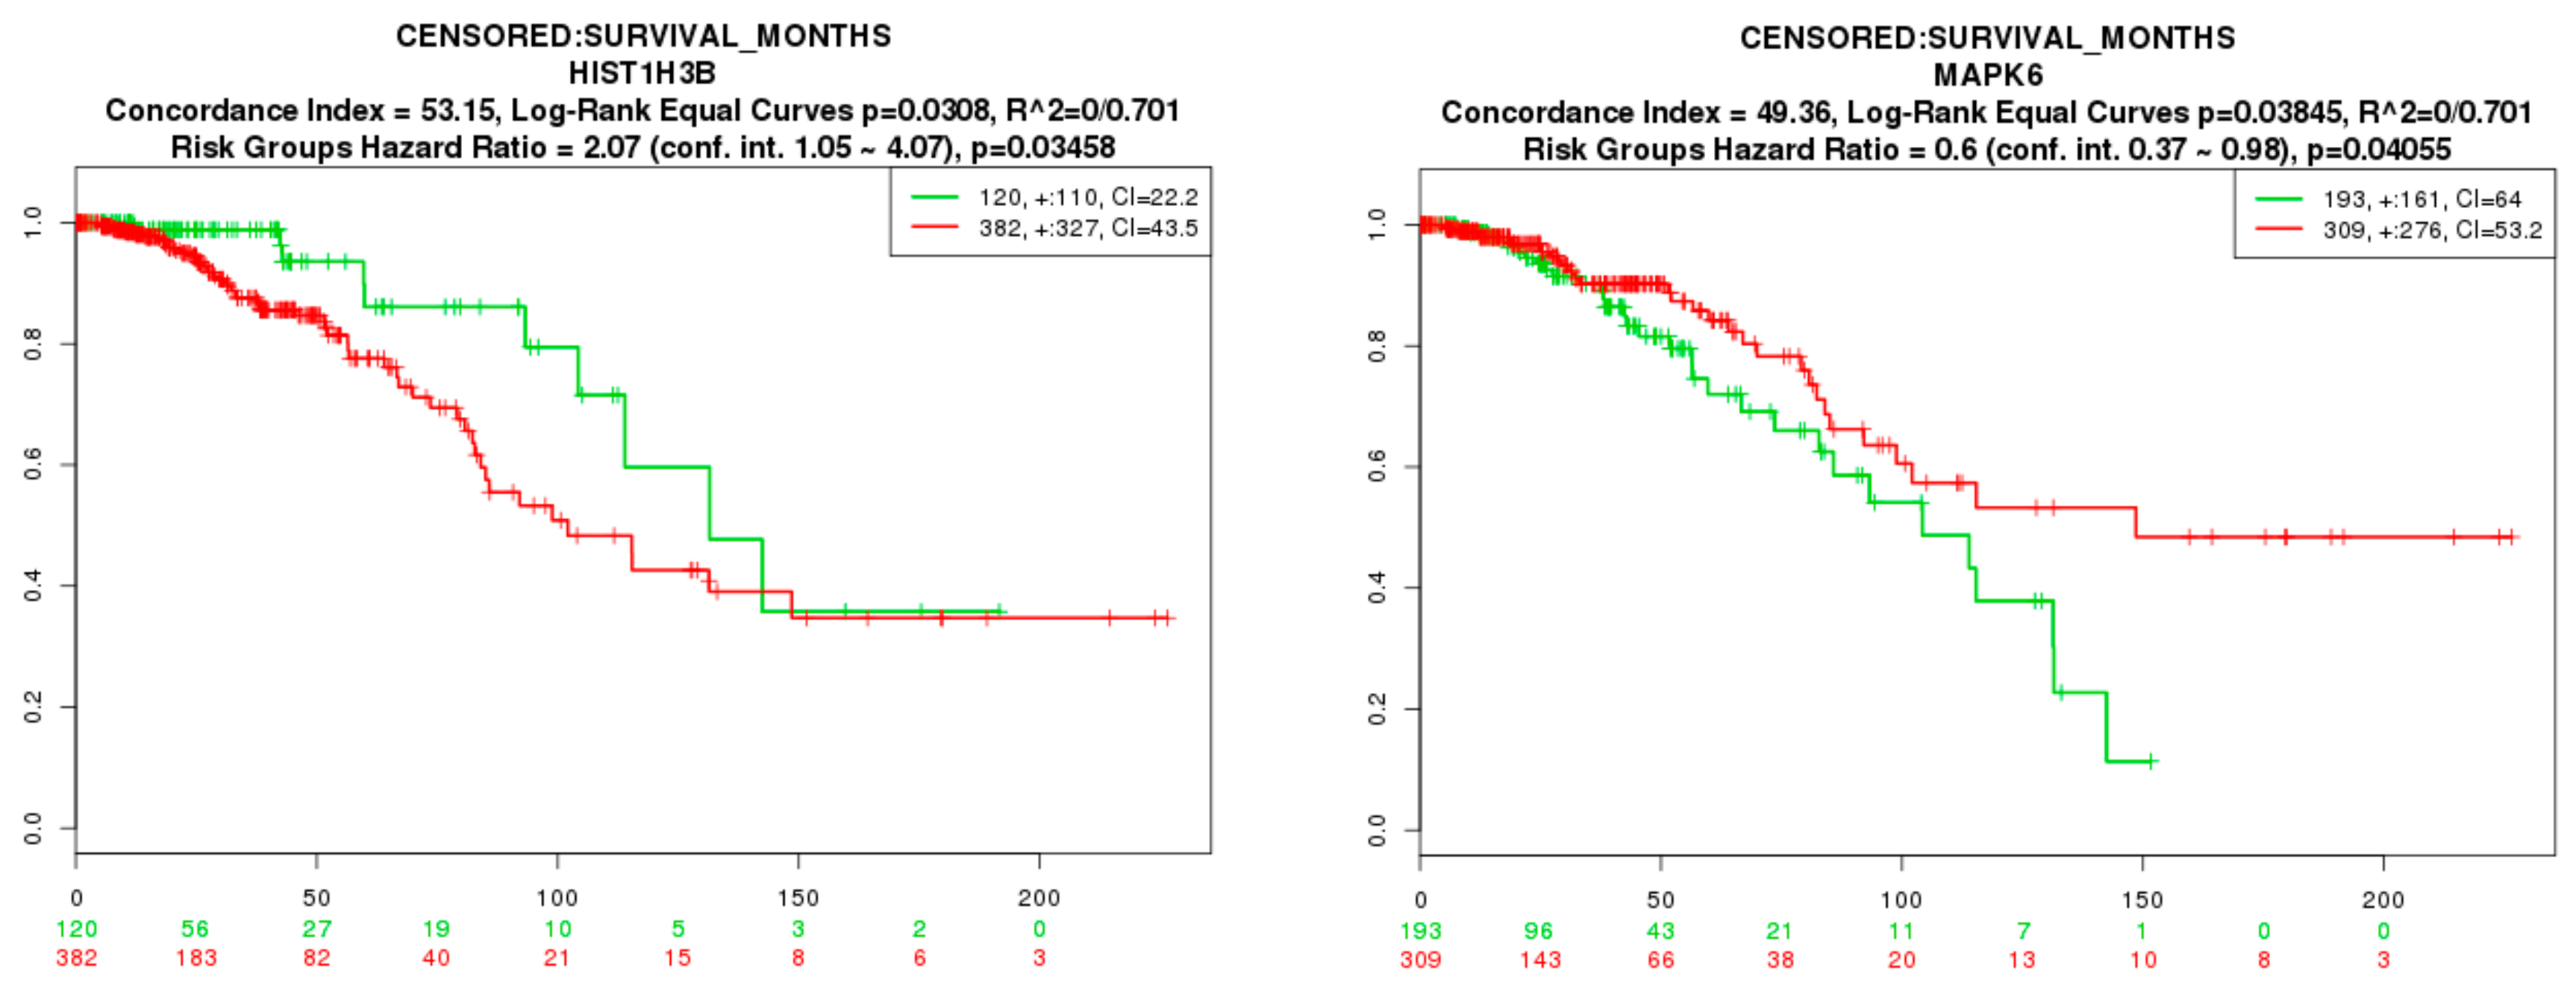
2.9. Survival Analysis of Hub Genes
2.10. Validation of Hub Genes
2.11. Mutation Analysis of Hub Genes
3. Results
3.1. Data Preprocessing
3.2. Identification of DEGs
3.3. Pathway Enrichment Analysis
3.4. Gene Ontology (GO) Enrichment Analysis
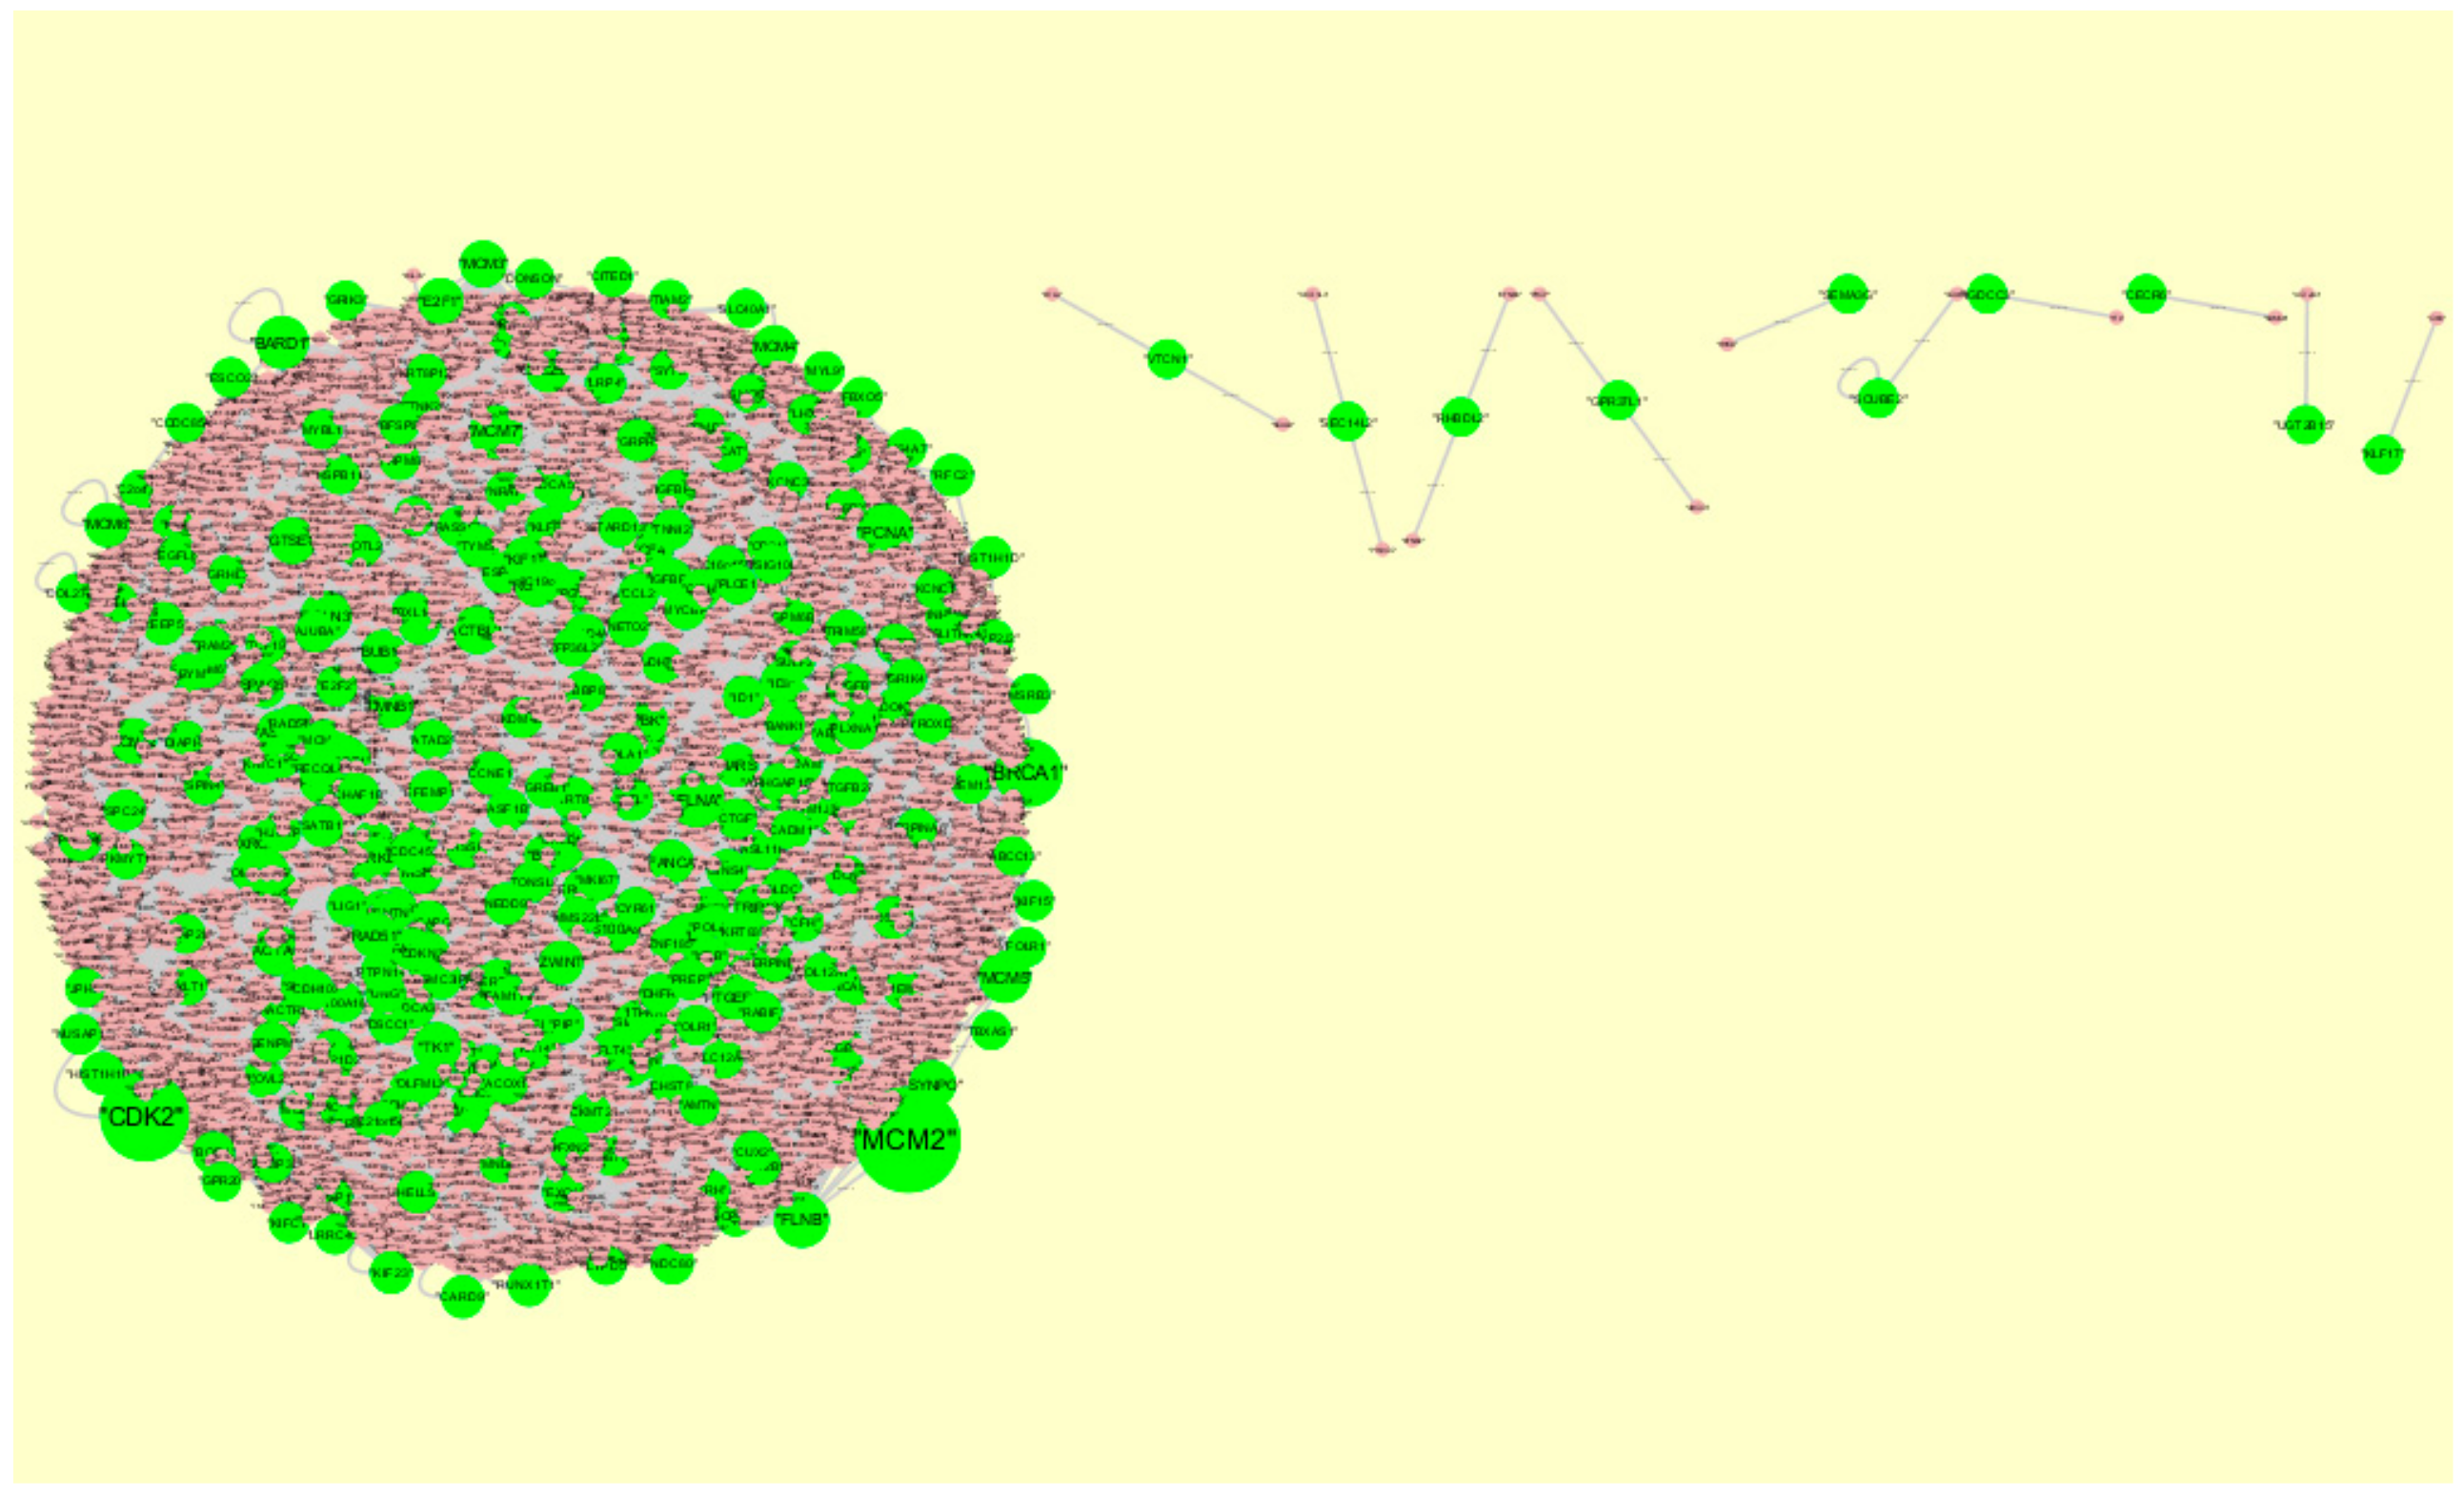
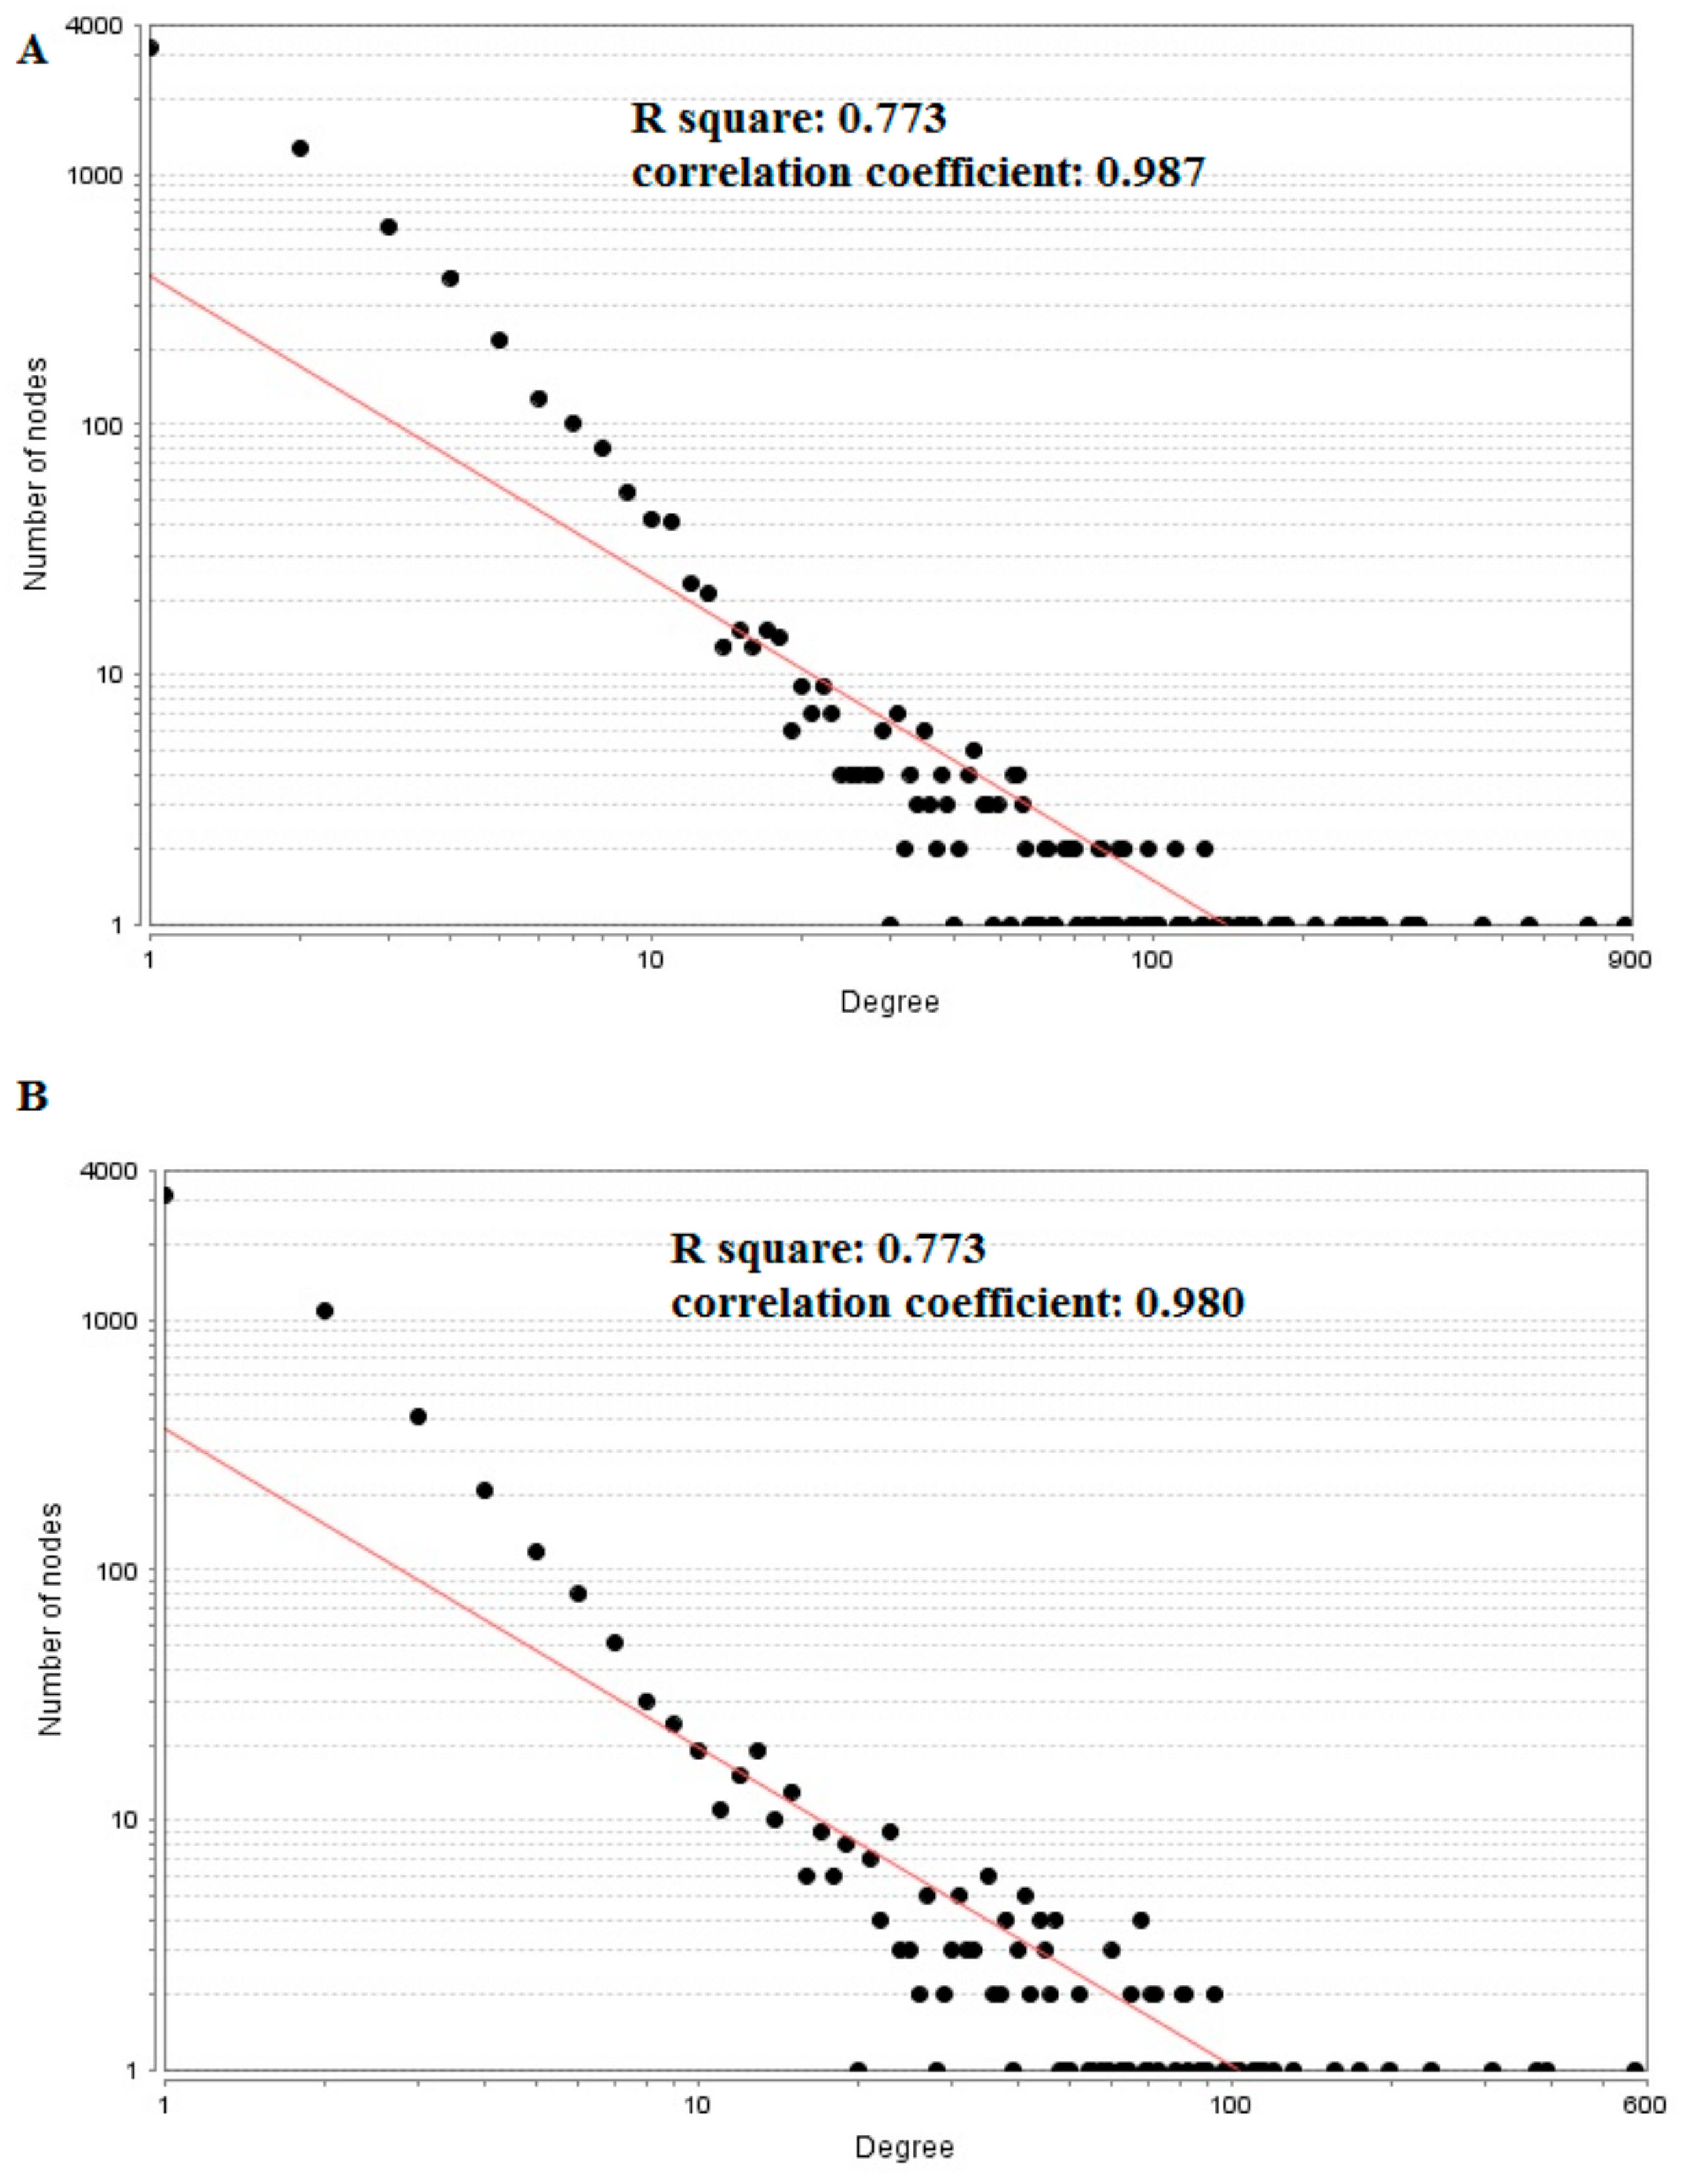
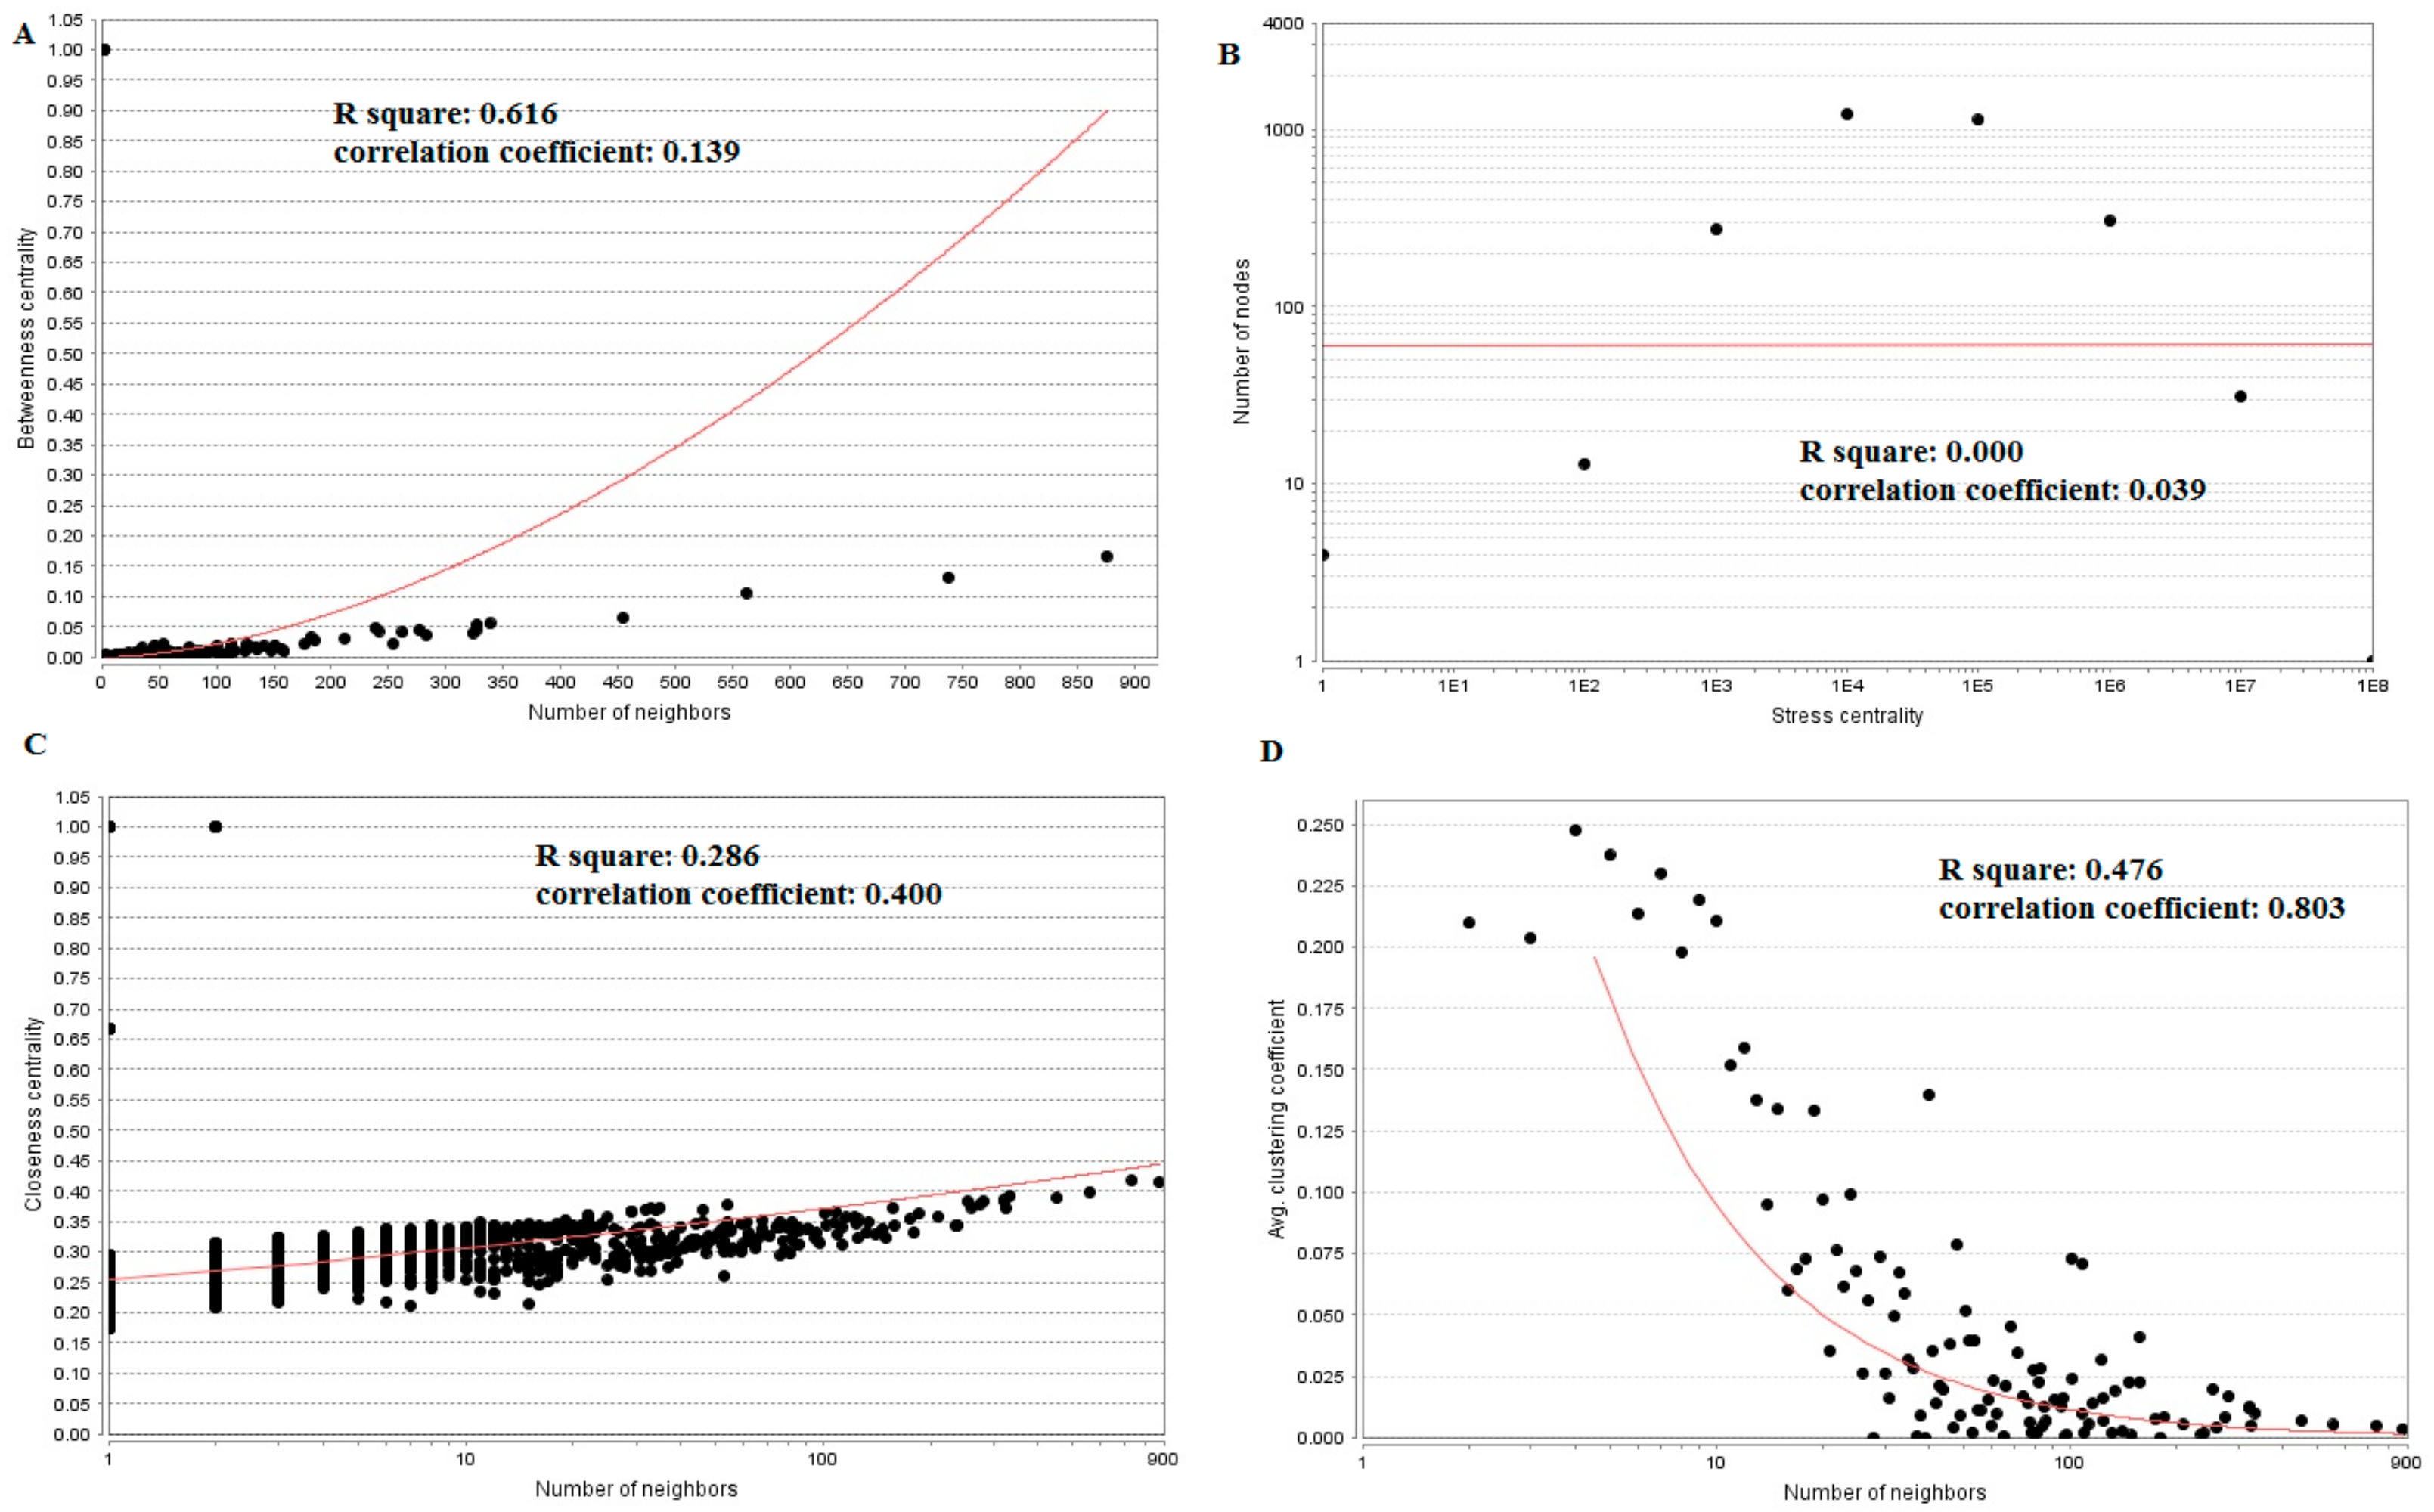
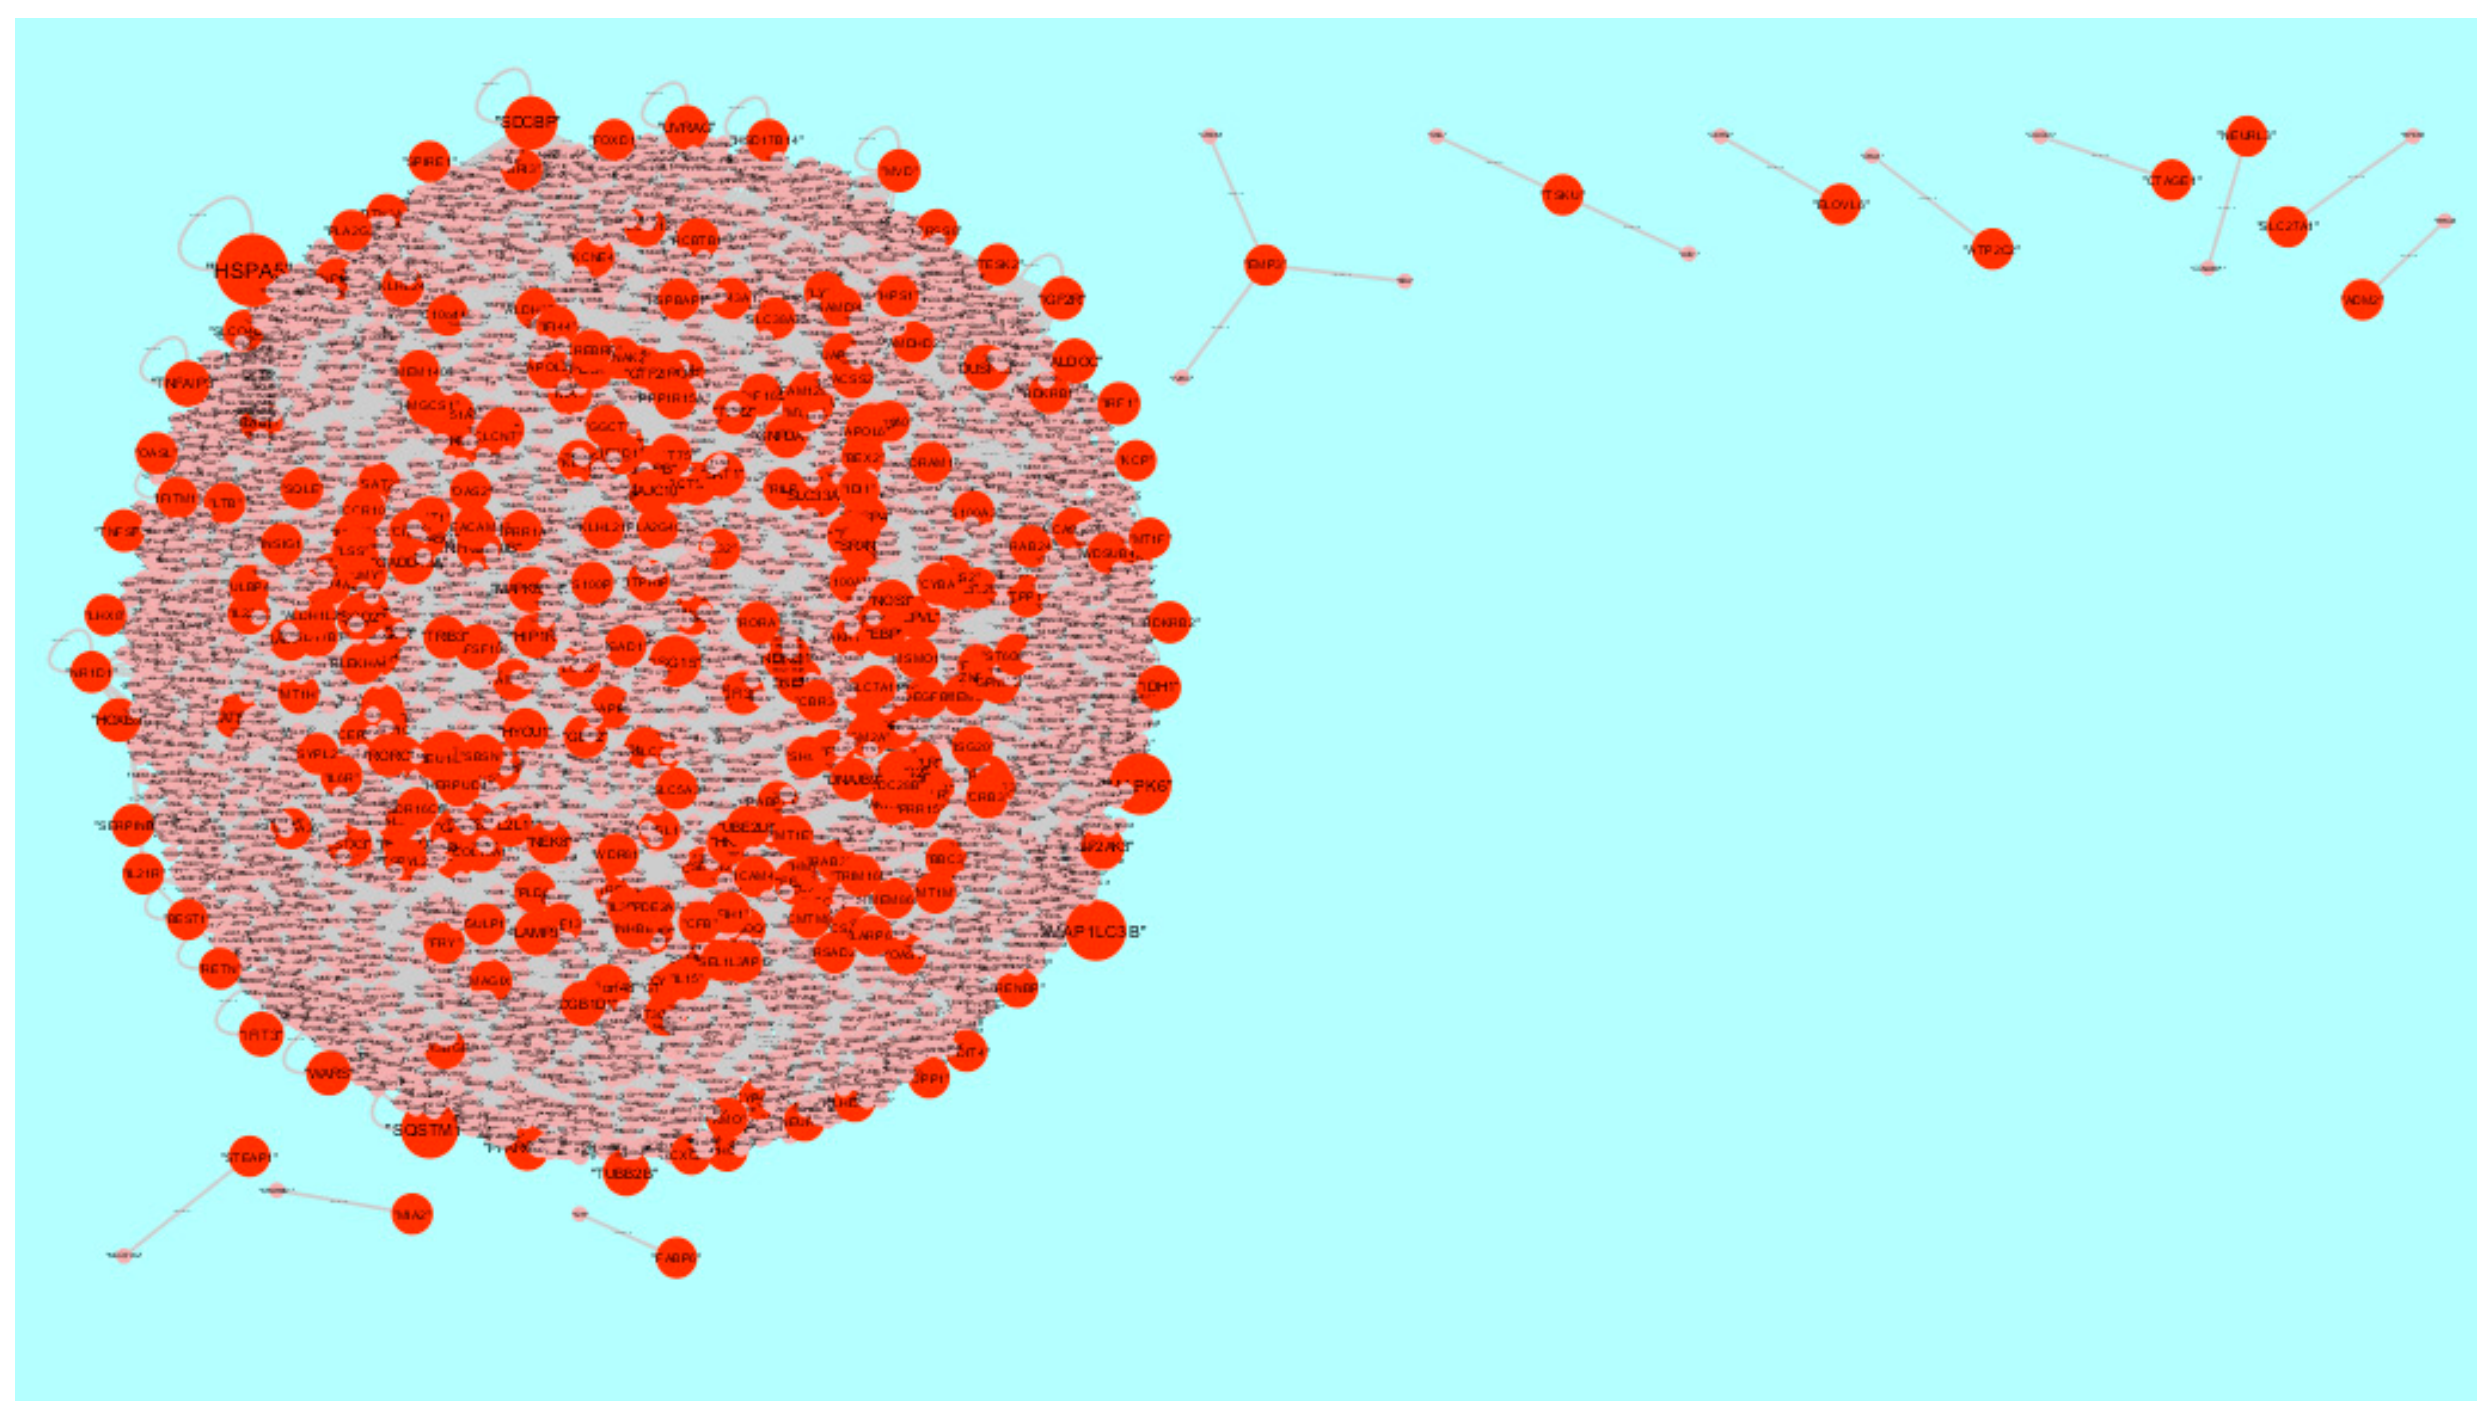
3.5. PPI Network Construction and Topology Analysis
3.6. Module Analysis
3.7. Construction of the Target Genes-miRNAInteraction Network
3.8. Construction of the Target Genes-TF Interaction Network
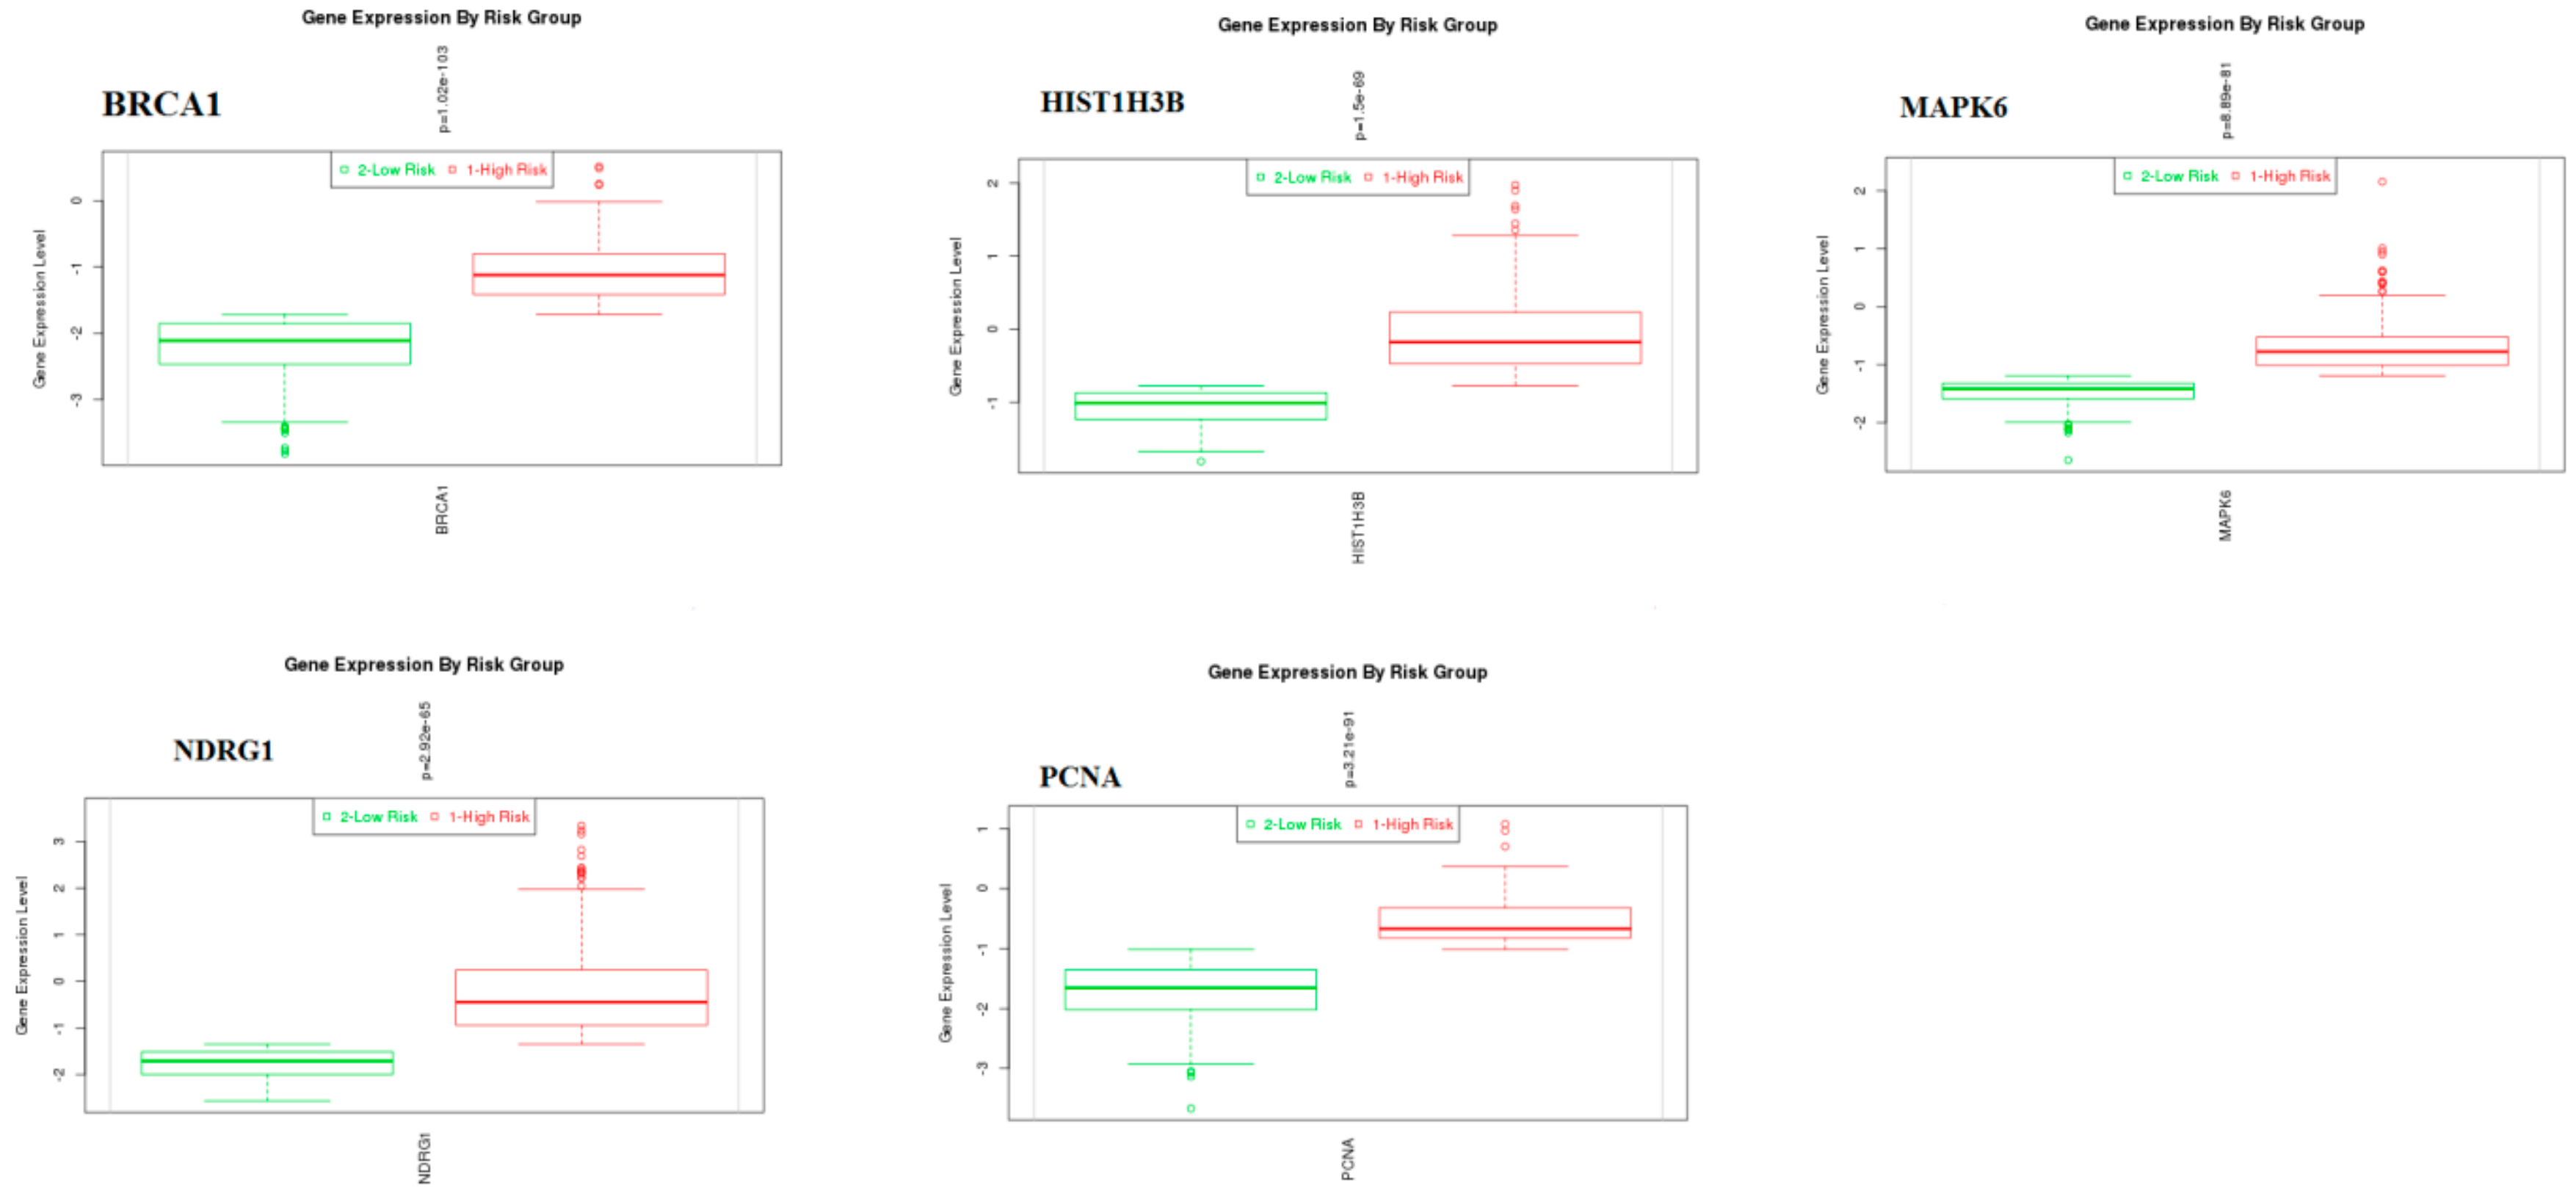
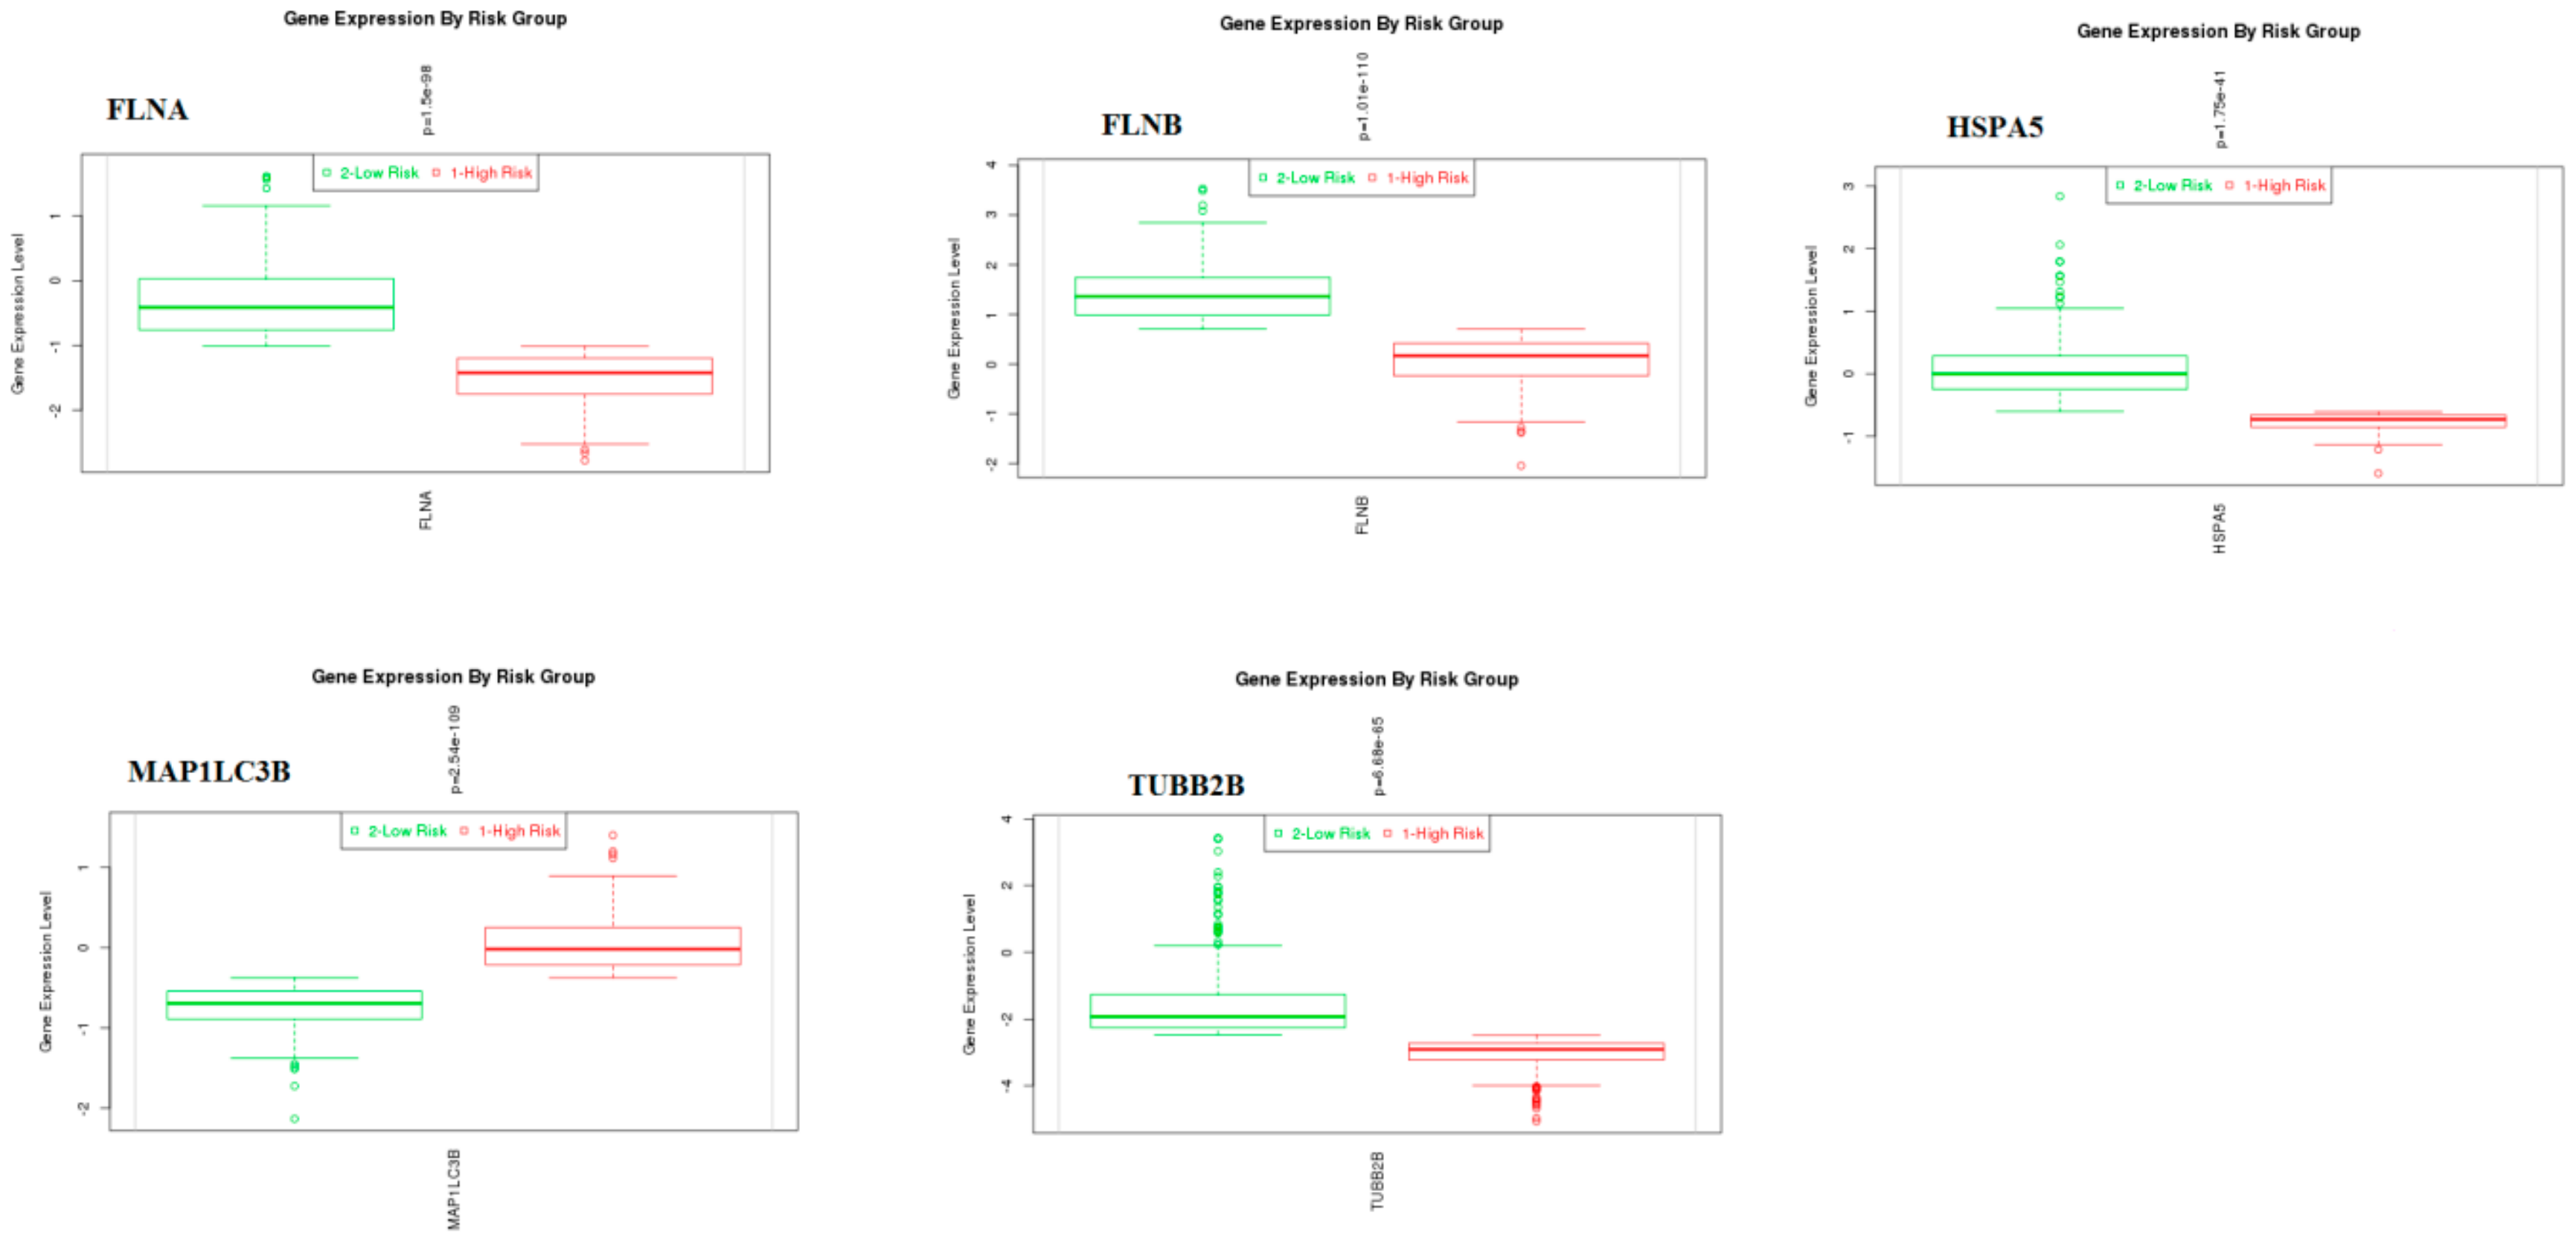
3.9. Survival Analysis of Hub Genes
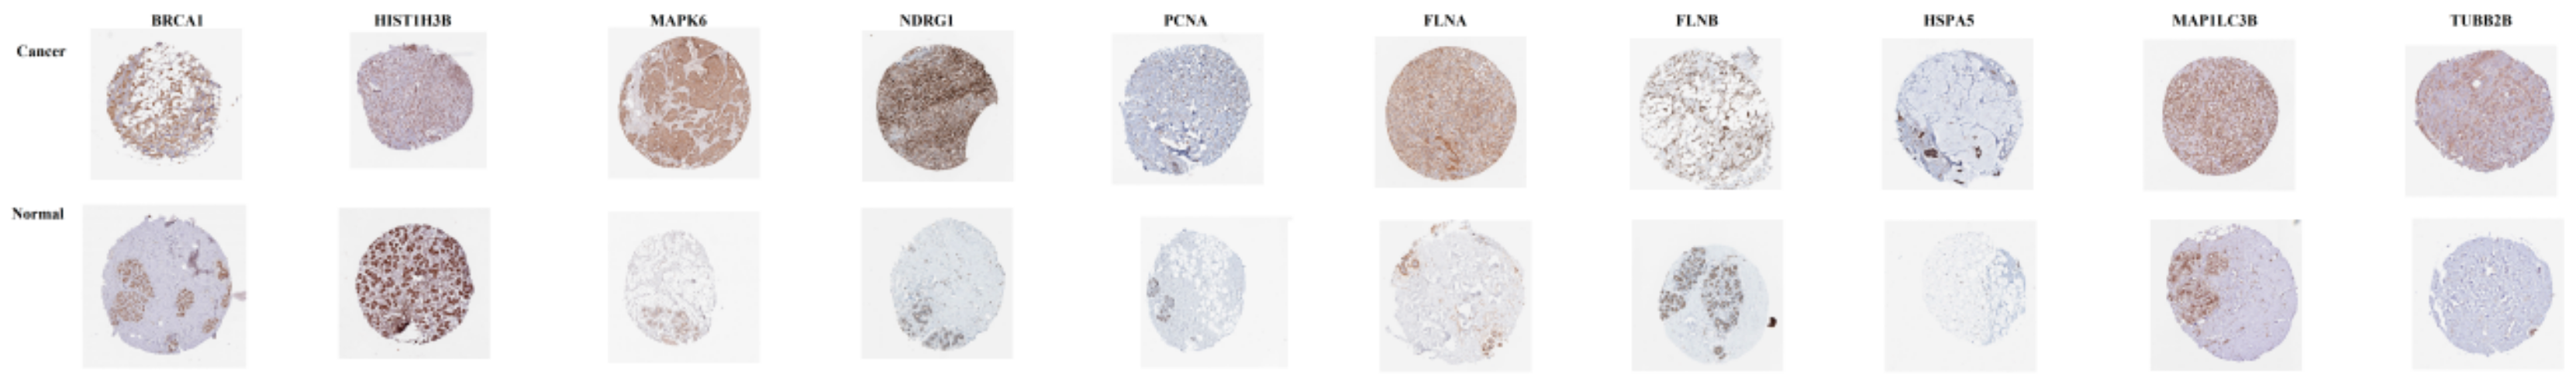
3.10. Validation of Hub Genes
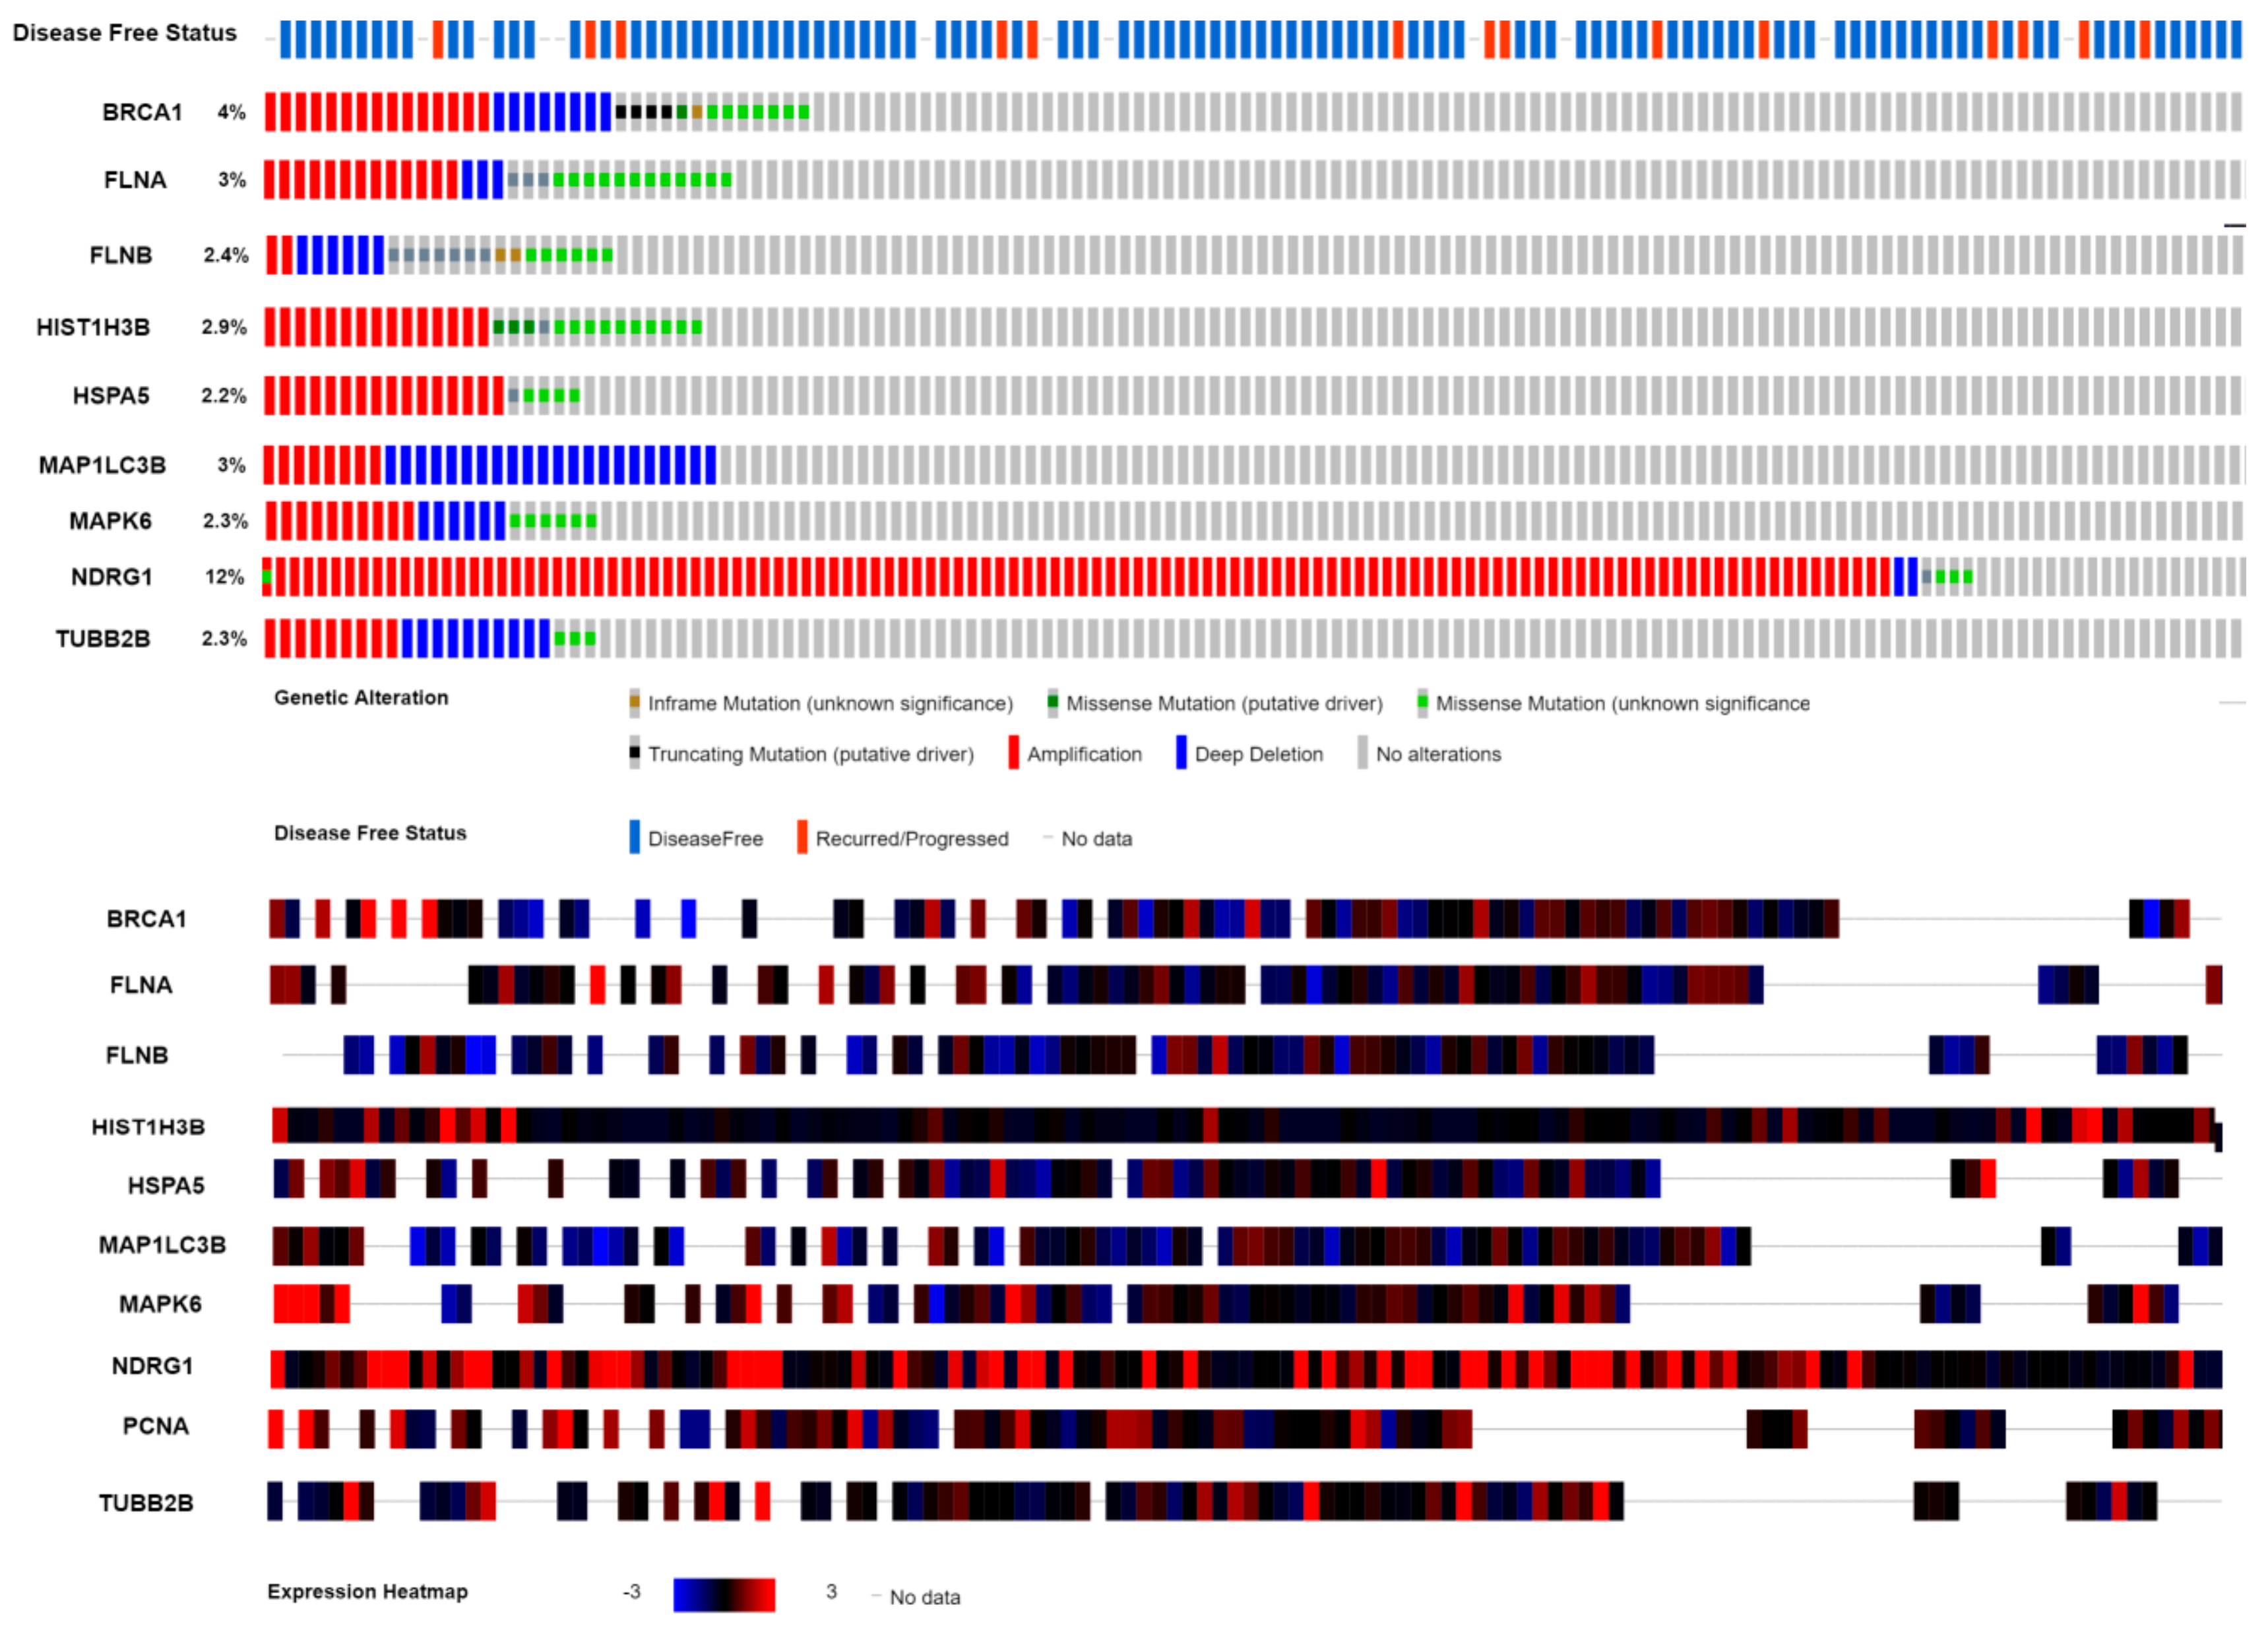
3.11. Mutation Analysis of Hub Genes
4. Discussion
5. Conclusions
Supplementary Materials
Author Contributions
Acknowledgments
Availability of Data and Materials
Conflicts of Interest
References
- O’Brien, K.M.; Cole, S.R.; Tse, C.K.; Perou, C.M.; Carey, L.A.; Foulkes, W.D.; Dressler, L.G.; Geradts, J.; Millikan, R.C. Intrinsic breast tumor subtypes, race, and long-term survival in the Carolina Breast Cancer Study. Clin. Cancer Res. 2010, 16, 6100–6110. [Google Scholar] [CrossRef] [PubMed]
- Bray, F.; Ferlay, J.; Soerjomataram, I.; Siegel, R.L.; Torre, L.A.; Jemal, A. Global cancer statistics 2018: GLOBOCAN estimates of incidence and mortality worldwide for 36 cancers in 185 countries. CA Cancer J. Clin. 2018, 68, 394–424. [Google Scholar] [CrossRef] [PubMed]
- Ferlay, J.; Colombet, M.; Soerjomataram, I.; Mathers, C.; Parkin, D.M.; Piñeros, M.; Znaor, A.; Bray, F. Estimating the global cancer incidence and mortality in 2018: GLOBOCAN sources and methods. Int. J. Cancer 2019, 144, 1941–1953. [Google Scholar] [CrossRef] [PubMed]
- Fields, R.C.; Jeffe, D.B.; Trinkaus, K.; Zhang, Q.; Arthur, C.; Aft, R.; Dietz, J.R.; Eberlein, T.J.; Gillanders, W.E.; Margenthaler, J.A. Surgical resection of the primary tumor is associated with increased long-term survival in patients with stage IV breast cancer after controlling for site of metastasis. Ann. Surg. Oncol. 2007, 14, 3345–3351. [Google Scholar] [CrossRef] [PubMed]
- Schnitt, S.J.; Abner, A.; Gelman, R.; Connolly, J.L.; Recht, A.; Duda, R.B.; Eberlein, T.J.; Mayzel, K.; Silver, B.; Harris, J.R. The relationship between microscopic margins of resection and the risk of local recurrence in patients with breast cancer treated with breast-conserving surgery and radiation therapy. Cancer 1994, 74, 1746–1751. [Google Scholar] [CrossRef]
- Høst, H.; Brennhovd, I.O.; Loeb, M. Postoperative radiotherapy in breast cancer—Long-term results from the Oslo study. Int. J. Radiat. Oncol. Biol. Phys. 1986, 12, 727–732. [Google Scholar] [CrossRef]
- Smith, I.C.; Heys, S.D.; Hutcheon, A.W.; Miller, I.D.; Payne, S.; Gilbert, F.J.; Ah-See, A.K.; Eremin, O.; Walker, L.G.; Sarkar, T.K.; et al. Neoadjuvant chemotherapy in breast cancer: Significantly enhanced response with docetaxel. J. Clin. Oncol. 2002, 20, 1456–1466. [Google Scholar] [CrossRef] [PubMed]
- Shapiro, S.; Farmer, R.D.; Stevenson, J.C.; Burger, H.G.; Mueck, A.O.; Gompel, A. Does hormone replacement therapy (HRT) cause breast cancer? An application of causal principles to three studies. J. Fam. Plann. Reprod. Health Care 2013, 39, 80–88. [Google Scholar] [CrossRef] [PubMed]
- Fendly, B.M.; Kotts, C.; Vetterlein, D.; Lewis, G.D.; Winget, M.; Carver, M.E.; Watson, S.R.; Sarup, J.; Saks, S.; Ullrich, A.; et al. The extracellular domain of HER2/neu is a potential immunogen for active specific immunotherapy of breast cancer. J. Biol. Response Mod. 1990, 9, 449–455. [Google Scholar] [PubMed]
- Cuzick, J.; Stewart, H.; Rutqvist, L.; Houghton, J.; Edwards, R.; Redmond, C.; Peto, R.; Baum, M.; Fisher, B.; Host, H.; et al. Cause-specific mortality in long-term survivors of breast cancer who participated in trials of radiotherapy. J. Clin. Oncol. 1994, 12, 447–453. [Google Scholar] [CrossRef]
- Ross, J.S.; Fletcher, J.A.; Bloom, K.J.; Linette, G.P.; Stec, J.; Symmans, W.F.; Pusztai, L.; Hortobagyi, G.N. Targeted therapy in breast cancer: The HER-2/neu gene and protein. Mol. Cell. Proteom. 2004, 3, 379–398. [Google Scholar] [CrossRef] [PubMed]
- Mego, M.; Mani, S.A.; Cristofanilli, M. Molecular mechanisms of metastasis in breast cancer--clinical applications. Nat. Rev. Clin. Oncol. 2010, 7, 693–701. [Google Scholar] [CrossRef] [PubMed]
- Zhong, Q.; Chen, C.F.; Li, S.; Chen, Y.; Wang, C.C.; Xiao, J.; Chen, P.L.; Sharp, Z.D.; Lee, W.H. Association of BRCA1 with the hRad50-hMre11-p95 complex and the DNA damage response. Science 1999, 285, 747–750. [Google Scholar] [CrossRef] [PubMed]
- Wang, N.; Wang, Z.Y.; Mo, S.L.; Loo, T.Y.; Wang, D.M.; Luo, H.B.; Yang, D.P.; Chen, Y.L.; Shen, J.G.; Chen, J.P. Ellagic acid, a phenolic compound, exerts anti-angiogenesis effects via VEGFR-2 signaling pathway in breast cancer. Breast Cancer Res. Treat. 2012, 134, 943–955. [Google Scholar] [CrossRef] [PubMed]
- Gong, L.; Li, Y.; Nedeljkovic-Kurepa, A.; Sarkar, F.H. Inactivation of NF-kappaB by genistein is mediated via Akt signaling pathway in breast cancer cells. Oncogene 2013, 22, 4702–4709. [Google Scholar] [CrossRef] [PubMed]
- Serra, V.; Scaltriti, M.; Prudkin, L.; Eichhorn, P.J.; Ibrahim, Y.H.; Chandarlapaty, S.; Markman, B.; Rodriguez, O.; Guzman, M.; Rodriguez, S.; et al. PI3K inhibition results in enhanced HER signaling and acquired ERK dependency in HER2-overexpressing breast cancer. Oncogene 2011, 30, 2547–2557. [Google Scholar] [CrossRef]
- Ghayad, S.E.; Vendrell, J.A.; Ben Larbi, S.; Dumontet, C.; Bieche, I.; Cohen, P.A. Endocrine resistance associated with activated ErbB system in breast cancer cells is reversed by inhibiting MAPK or PI3K/Akt signaling pathways. Int. J. Cancer 2010, 126, 545–562. [Google Scholar] [CrossRef]
- Lemée, F.; Bergoglio, V.; Fernandez-Vidal, A.; Machado-Silva, A.; Pillaire, M.J.; Bieth, A.; Gentil, C.; Baker, L.; Martin, A.L.; Leduc, C.; et al. DNA polymerase theta up-regulation is associated with poor survival in breast cancer, perturbs DNA replication, and promotes genetic instability. Proc. Natl. Acad. Sci. USA 2010, 107, 13390–13395. [Google Scholar] [CrossRef]
- Gillett, C.; Fantl, V.; Smith, R.; Fisher, C.; Bartek, J.; Dickson, C.; Barnes, D.; Peters, G. Amplification and overexpression of cyclin D1 in breast cancer detected by immunohistochemical staining. Cancer Res. 1994, 54, 1812–1817. [Google Scholar]
- Kolesnikov, N.; Hastings, E.; Keays, M.; Melnichuk, O.; Tang, Y.A.; Williams, E.; Dylag, M.; Kurbatova, N.; Brandizi, M.; Burdett, T.; et al. ArrayExpress update—Simplifying data submissions. Nucleic Acids Res. 2015, 43, D1113–D1116. [Google Scholar] [CrossRef]
- Ritchie, M.E.; Phipson, B.; Wu, D.; Hu, Y.; Law, C.W.; Shi, W.; Smyth, G.K. Limma powers differential expression analyses for RNA-sequencing and microarray studies. Nucleic Acids. Res. 2015, 43, e47. [Google Scholar] [CrossRef] [PubMed]
- Efron, B.; Tibshirani, R. Empirical bayes methods and false discovery rates for microarrays. Genet. Epidemiol. 2002, 23, 70–86. [Google Scholar] [CrossRef] [PubMed]
- Chen, J.; Bardes, E.E.; Aronow, B.J.; Jegga, A.G. ToppGene Suite for gene list enrichment analysis and candidate gene prioritization. Nucleic Acids Res. 2009, 37, W305–W311. [Google Scholar] [CrossRef] [PubMed]
- Caspi, R.; Altman, T.; Dreher, K.; Fulcher, C.A.; Subhraveti, P.; Keseler, I.M.; Kothari, A.; Krummenacker, M.; Latendresse, M.; Mueller, L.A.; et al. The MetaCyc database of metabolic pathways and enzymes and the BioCyc collection of pathway/genome databases. Nucleic Acids Res. 2016, 44, D471–D480. [Google Scholar] [CrossRef] [PubMed]
- Tanabe, M.; Kanehisa, M. Using the KEGG database resource. Curr. Protoc. Bioinform. 2012. [Google Scholar] [CrossRef]
- Schaefer, C.F.; Anthony, K.; Krupa, S.; Buchoff, J.; Day, M.; Hannay, T.; Buetow, K.H. PID: The Pathway Interaction Database. Nucleic Acids Res. 2009, 37, D674–D679. [Google Scholar] [CrossRef] [PubMed]
- Sidiropoulos, K.; Viteri, G.; Sevilla, C.; Jupe, S.; Webber, M.; Orlic-Milacic, M.; Jassal, B.; May, B.; Shamovsky, V.; Duenas, C.; et al. Reactome enhanced pathway visualization. Bioinformatics 2017, 33, 3461–3467. [Google Scholar] [CrossRef] [PubMed]
- Dahlquist, K.D.; Salomonis, N.; Vranizan, K.; Lawlor, S.C.; Conklin, B.R. GenMAPP, a new tool for viewing and analyzing microarray data on biological pathways. Nat. Genet. 2002, 31, 19–20. [Google Scholar] [CrossRef]
- Subramanian, A.; Tamayo, P.; Mootha, V.K.; Mukherjee, S.; Ebert, B.L.; Gillette, M.A.; Paulovich, A.; Pomeroy, S.L.; Golub, T.R.; Lander, E.S.; et al. Gene set enrichment analysis: A knowledge-based approach for interpreting genome-wide expression profiles. Proc. Natl. Acad. Sci. USA 2005, 102, 15545–15550. [Google Scholar] [CrossRef]
- Mi, H.; Huang, X.; Muruganujan, A.; Tang, H.; Mills, C.; Kang, D.; Thomas, P.D. PANTHER version 11: Expanded annotation data from Gene Ontology and Reactome pathways, and data analysis tool enhancements. Nucleic Acids Res. 2017, 45, D183–D189. [Google Scholar] [CrossRef]
- Petri, V.; Jayaraman, P.; Tutaj, M.; Hayman, G.T.; Smith, J.R.; De Pons, J.; Laulederkind, S.J.; Lowry, T.F.; Nigam, R.; Wang, S.J.; et al. The pathway ontology—Updates and applications. J. Biomed. Semant. 2014, 5, 7. [Google Scholar] [CrossRef] [PubMed]
- Jewison, T.; Su, Y.; Disfany, F.M.; Liang, Y.; Knox, C.; Maciejewski, A.; Poelzer, J.; Huynh, J.; Zhou, Y.; Arndt, D.; et al. SMPDB 2.0: Big improvements to the Small Molecule Pathway Database. Nucleic Acids Res. 2014, 42, D478–D484. [Google Scholar] [CrossRef] [PubMed]
- Cheng, L.; Lin, H.; Hu, Y.; Wang, J.; Yang, Z. Gene function prediction based on the Gene Ontology hierarchical structure. PLoS ONE 2014, 9, e107187. [Google Scholar] [CrossRef] [PubMed]
- Alanis-Lobato, G.; Andrade-Navarro, M.A.; Schaefer, M.H. HIPPIE v2.0: Enhancing meaningfulness and reliability of protein-protein interaction networks. Nucleic Acids Res. 2017, 45, D408–D414. [Google Scholar] [CrossRef] [PubMed]
- Orchard, S.; Ammari, M.; Aranda, B.; Breuza, L.; Briganti, L.; Broackes-Carter, F.; Campbell, N.H.; Chavali, G.; Chen, C.; del-Toro, N.; et al. The MIntAct project--IntAct as a common curation platform for 11 molecular interaction databases. Nucleic Acids Res. 2014, 42, D358–D363. [Google Scholar] [CrossRef] [PubMed]
- Chatr-Aryamontri, A.; Oughtred, R.; Boucher, L.; Rust, J.; Chang, C.; Kolas, N.K.; O’Donnell, L.; Oster, S.; Theesfeld, C.; Sellam, A.; et al. The BioGRID interaction database: 2017 update. Nucleic Acids Res. 2017, 45, D369–D379. [Google Scholar] [CrossRef]
- Keshava Prasad, T.S.; Goel, R.; Kandasamy, K.; Keerthikumar, S.; Kumar, S.; Mathivanan, S.; Telikicherla, D.; Raju, R.; Shafreen, B.; Venugopal, A.; et al. Human Protein Reference Database—2009 update. Nucleic Acids Res. 2009, 37, D767–D772. [Google Scholar] [CrossRef]
- Licata, L.; Briganti, L.; Peluso, D.; Perfetto, L.; Iannuccelli, M.; Galeota, E.; Sacco, F.; Palma, A.; Nardozza, A.P.; Santonico, E.; et al. MINT, the molecular interaction database: 2012 update. Nucleic Acids Res. 2012, 40, D857–D861. [Google Scholar] [CrossRef]
- Isserlin, R.; El-Badrawi, R.A.; Bader, G.D. The Biomolecular Interaction Network Database in PSI-MI 2.5. Database 2011, 2011, baq037. [Google Scholar] [CrossRef]
- Pagel, P.; Kovac, S.; Oesterheld, M.; Brauner, B.; Dunger-Kaltenbach, I.; Frishman, G.; Montrone, C.; Mark, P.; Stümpflen, V.; Mewes, H.W.; et al. The MIPS mammalian protein-protein interaction database. Bioinformatics 2005, 21, 832–834. [Google Scholar] [CrossRef]
- Salwinski, L.; Miller, C.S.; Smith, A.J.; Pettit, F.K.; Bowie, J.U.; Eisenberg, D. The Database of Interacting Proteins: 2004 update. Nucleic Acids Res. 2004, 32, D449–D451. [Google Scholar] [CrossRef] [PubMed]
- Shannon, P.; Markiel, A.; Ozier, O.; Baliga, N.S.; Wang, J.T.; Ramage, D.; Amin, N.; Schwikowski, B.; Ideker, T. Cytoscape: A software environment for integrated models of biomolecular interaction networks. Genome Res. 2003, 3, 2498–2504. [Google Scholar] [CrossRef] [PubMed]
- Przulj, N. Biological network comparison using graphlet degree distribution. Bioinformatics 2007, 23, e177–e183. [Google Scholar] [CrossRef] [PubMed]
- Hahn, M.W.; Kern, A.D. Comparative genomics of centrality and essentiality in three eukaryotic protein-interaction networks. Mol. Biol. Evol. 2005, 22, 803–806. [Google Scholar] [CrossRef] [PubMed]
- Zhuang, D.Y.; Jiang, L.; He, Q.Q.; Zhou, P.; Yue, T. Identification of hub subnetwork based on topological features of genes in breast cancer. Int. J. Mol. Med. 2015, 35, 664–674. [Google Scholar] [CrossRef] [PubMed]
- Ozgür, A.; Vu, T.; Erkan, G.; Radev, D.R. Identifying gene-disease associations using centrality on a literature mined gene-interaction network. Bioinformatics 2008, 24, i277–i285. [Google Scholar] [CrossRef]
- Stelzl, U.; Worm, U.; Lalowski, M.; Haenig, C.; Brembeck, F.H.; Goehler, H.; Stroedicke, M.; Zenkner, M.; Schoenherr, A.; Koeppen, S.; et al. A human protein-protein interaction network: A resource for annotating the proteome. Cell 2005, 122, 957–968. [Google Scholar] [CrossRef]
- Zaki, N.; Efimov, D.; Berengueres, J. Protein complex detection using interaction reliability assessment and weighted clustering coefficient. BMC Bioinform. 2013, 14, 163. [Google Scholar] [CrossRef]
- Sethupathy, P.; Corda, B.; Hatzigeorgiou, A.G. TarBase: A comprehensive database of experimentally supported animal microRNA targets. RNA 2006, 12, 192–197. [Google Scholar] [CrossRef]
- Chou, C.H.; Shrestha, S.; Yang, C.D.; Chang, N.W.; Lin, Y.L.; Liao, K.W.; Huang, W.C.; Sun, T.H.; Tu, S.J.; Lee, W.H.; et al. miRTarBase update 2018: A resource for experimentally validated microRNA-target interactions. Nucleic Acids Res. 2018, 46, D296–D302. [Google Scholar] [CrossRef]
- Xia, J.; Benner, M.J.; Hancock, R.E. NetworkAnalyst—Integrative approaches for protein-protein interaction network analysis and visual exploration. Nucleic Acids Res. 2014, 42, W167–W174. [Google Scholar] [CrossRef] [PubMed]
- Lachmann, A.; Xu, H.; Krishnan, J.; Berger, S.I.; Mazloom, A.R.; Ma’ayan, A. ChEA: Transcription factor regulation inferred from integrating genome-wide ChIP-X experiments. Bioinformatics 2010, 26, 2438–2444. [Google Scholar] [CrossRef] [PubMed]
- Aguirre-Gamboa, R.; Gomez-Rueda, H.; Martínez-Ledesma, E.; Martínez-Torteya, A.; Chacolla-Huaringa, R.; Rodriguez-Barrientos, A.; Tamez-Peña, J.G.; Treviño, V. SurvExpress: An online biomarker validation tool and database for cancer gene expression data using survival analysis. PLoS ONE 2013, 8, e74250. [Google Scholar] [CrossRef] [PubMed]
- Uhlén, M.; Fagerberg, L.; Hallström, B.M.; Lindskog, C.; Oksvold, P.; Mardinoglu, A.; Sivertsson, Å.; Kampf, C.; Sjöstedt, E.; Asplund, A.; et al. Proteomics. Tissue-based map of the human proteome. Science 2015, 347, 1260419. [Google Scholar] [CrossRef] [PubMed]
- Gao, J.; Aksoy, B.A.; Dogrusoz, U.; Dresdner, G.; Gross, B.; Sumer, S.O.; Sun, Y.; Jacobsen, A.; Sinha, R.; Larsson, E.; et al. Integrative analysis of complex cancer genomics and clinical profiles using the cBioPortal. Sci. Signal. 2013, 6, pl1. [Google Scholar] [CrossRef] [PubMed]
- Yager, J.D.; Davidson, N.E. Estrogen carcinogenesis in breast cancer. N. Engl. J. Med. 2006, 354, 270–282. [Google Scholar] [CrossRef] [PubMed]
- Jordan, V.C. Tamoxifen: A most unlikely pioneering medicine. Nat. Rev. Drug Discov. 2003, 2, 205–213. [Google Scholar] [CrossRef] [PubMed]
- Veer, L.J.; Dai, H.; Vijver, M.J.; He, Y.D.; Hart, A.A.; Mao, M.; Peterse, H.L.; van der Kooy, K.; Marton, M.J.; Witteveen, A.T.; et al. Gene expression profiling predicts clinical outcome of breast cancer. Nature 2002, 415, 530–536. [Google Scholar] [CrossRef]
- Wang, H.Y.; Wang, W.; Liu, Y.W.; Li, M.Y.; Liang, T.Y.; Li, J.Y.; Hu, H.M.; Lu, Y.; Yao, C.; Ye, Y.Y.; et al. Role of KCNB1 in the prognosis of gliomas and autophagy modulation. Sci. Rep. 2017, 7, 14. [Google Scholar] [CrossRef]
- Duan, S.; Gong, B.; Wang, P.; Huang, H.; Luo, L.; Liu, F. Novel prognostic biomarkers of gastric cancer based on gene expression microarray: COL12A1, GSTA3, FGA and FGG. Mol. Med. Rep. 2018, 18, 3727–3736. [Google Scholar] [CrossRef]
- Dong, L.; Li, Z.; Xue, L.; Li, G.; Zhang, C.; Cai, Z.; Li, H.; Guo, R. DIAPH3 promoted the growth, migration and metastasis of hepatocellular carcinoma cells by activating beta-catenin/TCF signaling. Mol. Cell Biochem. 2018, 438, 183–190. [Google Scholar] [CrossRef] [PubMed]
- Murase, R.; Abe, Y.; Takeuchi, T.; Nabeta, M.; Imai, Y.; Kamei, Y.; Kagawa-Miki, L.; Ueda, N.; Sumida, T.; Hamakawa, H.; et al. Serum autoantibody to sideroflexin 3 as a novel tumor marker for oral squamous cell carcinoma. Proteom. Clin. Appl. 2008, 2, 517–527. [Google Scholar] [CrossRef] [PubMed]
- Zhang, W.C.; Shyh-Chang, N.; Yang, H.; Rai, A.; Umashankar, S.; Ma, S.; Soh, B.S.; Sun, L.L.; Tai, B.C.; Nga, M.E.; et al. Glycine decarboxylase activity drives non-small cell lung cancer tumor-initiating cells and tumorigenesis. Cell 2012, 148, 259–272. [Google Scholar] [CrossRef] [PubMed]
- Du, F.; Sun, L.; Chu, Y.; Li, T.; Lei, C.; Wang, X.; Jiang, M.; Min, Y.; Lu, Y.; Zhao, X.; et al. DDIT4 promotes gastric cancer proliferation and tumorigenesis through the p53 and MAPK pathways. Cancer Commun. 2018, 38, 45. [Google Scholar] [CrossRef] [PubMed]
- Kaneda, A.; Kaminishi, M.; Nakanishi, Y.; Sugimura, T. Reduced expression of the insulin-induced protein 1 and p41 Arp2/3 complex genes in human gastric cancers. Int. J. Cancer 2002, 100, 57–62. [Google Scholar] [CrossRef] [PubMed]
- Hur, H.; Kim, Y.B.; Ham, I.H.; Lee, D. Loss of ACSS2 expression predicts poor prognosis in patients with gastric cancer. J. Surg. Oncol. 2015, 112, 585–591. [Google Scholar] [CrossRef] [PubMed]
- Niess, H.; Camaj, P.; Mair, R.; Renner, A.; Zhao, Y.; Jäckel, C.; Nelson, P.J.; Jauch, K.W.; Bruns, C.J. Overexpression of IFN-induced protein with tetratricopeptide repeats 3 (IFIT3) in pancreatic cancer: Cellular “pseudoinflammation” contributing to an aggressive phenotype. Oncotarget 2015, 6, 3306–3318. [Google Scholar] [CrossRef] [PubMed]
- Hong, S.B.; Oh, H.; Valera, V.A.; Stull, J.; Ngo, D.T.; Baba, M.; Merino, M.J.; Linehan, W.M.; Schmidt, L.S. Tumor suppressor FLCN inhibits tumorigenesis of a FLCN-null renal cancer cell line and regulates expression of key molecules in TGF-beta signaling. Mol. Cancer 2010, 9, 160. [Google Scholar] [CrossRef]
- Xie, M.; Sun, M.; Zhu, Y.N.; Xia, R.; Liu, Y.W.; Ding, J.; Ma, H.W.; He, X.Z.; Zhang, Z.H.; Liu, Z.J.; et al. Long noncoding RNA HOXA-AS2 promotes gastric cancer proliferation by epigenetically silencing P21/PLK3/DDIT3 expression. Oncotarget 2015, 6, 33587–33601. [Google Scholar] [CrossRef]
- Tamir, A.; Gangadharan, A.; Balwani, S.; Tanaka, T.; Patel, U.; Hassan, A.; Benke, S.; Agas, A.; D’Agostino, J.; Shin, D.; et al. The serine protease prostasin (PRSS8) is a potential biomarker for early detection of ovarian cancer. J. Ovarian Res. 2016, 9, 20. [Google Scholar] [CrossRef]
- Wang, X.; Lu, H.; Urvalek, A.M.; Li, T.; Yu, L.; Lamar, J.; DiPersio, C.M.; Feustel, P.J.; Zhao, J. KLF8 promotes human breast cancer cell invasion and metastasis by transcriptional activation of MMP9. Oncogene 2011, 30, 1901–1911. [Google Scholar] [CrossRef] [PubMed]
- Ravindranath, A.; Yuen, H.F.; Chan, K.K.; Grills, C.; Fennell, D.A.; Lappin, T.R.; El-Tanani, M. Wnt-β-catenin-Tcf-4 signaling-modulated invasiveness is dependent on osteopontin expression in breast cancer. Br. J. Cancer 2011, 105, 542–551. [Google Scholar] [CrossRef] [PubMed]
- Berteaux, N.; Lottin, S.; Monté, D.; Pinte, S.; Quatannens, B.; Coll, J.; Hondermarck, H.; Curgy, J.J.; Dugimont, T.; Adriaenssens, E. H19 mRNA-like noncoding RNA promotes breast cancer cell proliferation through positive control by E2F1. J. Biol. Chem. 2005, 280, 29625–29636. [Google Scholar] [CrossRef] [PubMed]
- Kim, S.K.; Jung, W.H.; Koo, J.S. Differential expression of enzymes associated with serine/glycine metabolism in different breast cancer subtypes. PLoS ONE 2014, 9, e101004. [Google Scholar] [CrossRef] [PubMed]
- Divella, R.; Daniele, A.; Savino, E.; Palma, F.; Bellizzi, A.; Giotta, F.; Simone, G.; Lioce, M.; Quaranta, M.; Paradiso, A.; et al. Circulating levels of transforming growth factor-βeta (TGF-β) and chemokine (C-X-C motif) ligand-1 (CXCL1) as predictors of distant seeding of circulating tumor cells in patients with metastatic breast cancer. Anticancer Res. 2013, 33, 1491–1497. [Google Scholar] [PubMed]
- Izrailit, J.; Berman, H.K.; Datti, A.; Wrana, J.L.; Reedijk, M. High throughput kinase inhibitor screens reveal TRB3 and MAPK-ERK/TGFβ pathways as fundamental Notch regulators in breast cancer. Proc. Natl. Acad. Sci. USA 2013, 110, 1714–1719. [Google Scholar] [CrossRef] [PubMed]
- Shpyleva, S.I.; Tryndyak, V.P.; Kovalchuk, O.; Starlard-Davenport, A.; Chekhun, V.F.; Beland, F.A.; Pogribny, I.P. Role of ferritin alterations in human breast cancer cells. Breast Cancer Res. Treat. 2011, 126, 63–71. [Google Scholar] [CrossRef]
- Tripathi, M.K.; Chaudhuri, G. Down-regulation of UCRP and UBE2L6 in BRCA2 knocked-down human breast cells. Biochem. Biophys. Res. Commun. 2005, 328, 43–48. [Google Scholar] [CrossRef]
- Malinowska, K.; Cavarretta, I.T.; Susani, M.; Wrulich, O.A.; Uberall, F.; Kenner, L.; Culig, Z. Identification of mu-crystallin as an androgen-regulated gene in human prostate cancer. Prostate 2009, 69, 1109–1118. [Google Scholar] [CrossRef]
- Wang, H.; Tong, L.; Wei, J.; Pan, W.; Li, L.; Ge, Y.; Yuan, Q.; Zhou, C.; Yang, M. The ALDH7A1 genetic polymorphisms contribute to development of esophageal squamous cell carcinoma. Tumour Biol. 2014, 35, 12665–12670. [Google Scholar] [CrossRef]
- Koh, V.; Kwan, H.Y.; Tan, W.L.; Mah, T.L.; Yong, W.P. Knockdown of POLA2 increases gemcitabine resistance in lung cancer cells. BMC Genom. 2016, 17, 1029. [Google Scholar] [CrossRef] [PubMed]
- Li, D.; Li, R.; Zhang, J.; Li, K.; Wu, Y. Association Between the LIG1 Polymorphisms and Lung Cancer Risk: A Meta-analysis of Case-Control Studies. Cell Biochem. Biophys. 2015, 73, 381–387. [Google Scholar] [CrossRef] [PubMed]
- Chiu, C.F.; Tsai, M.H.; Tseng, H.C.; Wang, C.L.; Tsai, F.J.; Lin, C.C.; Bau, D.T. A novel single nucleotide polymorphism in ERCC6 gene is associated with oral cancer susceptibility in Taiwanese patients. Oral Oncol. 2008, 44, 582–586. [Google Scholar] [CrossRef] [PubMed]
- Ashkavandi, Z.J.; Najvani, A.D.; Tadbir, A.A.; Pardis, S.; Ranjbar, M.A.; Ashraf, M.J. MCM3 as a novel diagnostic marker in benign and malignant salivary gland tumors. Asian Pac. J. Cancer Prev. 2013, 14, 3479–3482. [Google Scholar] [CrossRef] [PubMed]
- Murphy, N.; Ring, M.; Heffron, C.C.; King, B.; Killalea, A.G.; Hughes, C.; Martin, C.M.; McGuinness, E.; Sheils, O.; O’Leary, J.J. p16INK4A, CDC6, and MCM5: Predictive biomarkers in cervical preinvasive neoplasia and cervical cancer. J. Clin. Pathol. 2005, 58, 525–534. [Google Scholar] [CrossRef] [PubMed]
- Qu, K.; Wang, Z.; Fan, H.; Li, J.; Liu, J.; Li, P.; Liang, Z.; An, H.; Jiang, Y.; Lin, Q.; et al. MCM7 promotes cancer progression through cyclin D1-dependent signaling and serves as a prognostic marker for patients with hepatocellular carcinoma. Cell Death Dis. 2017, 8, e2603. [Google Scholar] [CrossRef] [PubMed]
- Sun, C.; Huang, S.; Ju, W.; Hou, Y.; Wang, Z.; Liu, Y.; Wu, L.; He, X. Elevated DSN1 expression is associated with poor survival in patients with hepatocellular carcinoma. Hum. Pathol. 2018, 81, 113–120. [Google Scholar] [CrossRef]
- Valle, L.; Hernández-Illán, E.; Bellido, F.; Aiza, G.; Castillejo, A.; Castillejo, M.I.; Navarro, M.; Seguí, N.; Vargas, G.; Guarinos, C.; et al. New insights into POLE and POLD1 germline mutations in familial colorectal cancer and polyposis. Hum. Mol. Genet. 2014, 23, 3506–3512. [Google Scholar] [CrossRef]
- Platz, A.; Hansson, J.; Ringborg, U. Screening of germline mutations in the CDK4, CDKN2C and TP53 genes in familial melanoma: A clinic-based population study. Int. J. Cancer 1998, 78, 13–15. [Google Scholar] [CrossRef]
- Castel, D.; Philippe, C.; Calmon, R.; Le Dret, L.; Truffaux, N.; Boddaert, N.; Pagès, M.; Taylor, K.R.; Saulnier, P.; Lacroix, L.; et al. Histone H3F3A and HIST1H3B K27M mutations define two subgroups of diffuse intrinsic pontine gliomas with different prognosis and phenotypes. Acta Neuropathol. 2015, 130, 815–827. [Google Scholar] [CrossRef]
- Li, J.; Wang, J.; Yu, J.; Zhao, Y.; Dong, Y.; Fan, Y.; Li, N.; Zhang, Y.; Wang, Y. Knockdown of POLE2 expression suppresses lung adenocarcinoma cell malignant phenotypes in vitro. Oncol. Rep. 2018, 40, 2477–2486. [Google Scholar] [CrossRef] [PubMed]
- Wang, M.; Xie, T.; Wu, Y.; Yin, Q.; Xie, S.; Yao, Q.; Xiong, J.; Zhang, Q. Identification of RFC5 as a novel potential prognostic biomarker in lung cancer through bioinformatics analysis. Oncol. Lett. 2018, 16, 4201–4210. [Google Scholar] [CrossRef] [PubMed]
- Astbury, K.; McEvoy, L.; Brian, H.; Spillane, C.; Sheils, O.; Martin, C.; O’Leary, J.J. MYBL2 (B-MYB) in cervical cancer: Putative biomarker. Int. J. Gynecol. Cancer 2011, 21, 206–212. [Google Scholar] [CrossRef] [PubMed]
- Chen, J.; Chen, H.; Yang, H.; Dai, H. SPC25 upregulation increases cancer stem cell properties in non-small cell lung adenocarcinoma cells and independently predicts poor survival. Biomed. Pharmacother. 2018, 100, 233–239. [Google Scholar] [CrossRef] [PubMed]
- Kato, T.; Wada, H.; Patel, P.; Hu, H.P.; Lee, D.; Ujiie, H.; Hirohashi, K.; Nakajima, T.; Sato, M.; Kaji, M.; et al. Overexpression of KIF23 predicts clinical outcome in primary lung cancer patients. Lung Cancer 2016, 92, 53–61. [Google Scholar] [CrossRef]
- Zhang, Q.; Su, R.; Shan, C.; Gao, C.; Wu, P. Non-SMC Condensin I Complex, Subunit G (NCAPG) is a Novel Mitotic Gene Required for Hepatocellular Cancer Cell Proliferation and Migration. Oncol. Res. 2018, 26, 269–276. [Google Scholar] [CrossRef] [PubMed]
- Wang, S.; Liu, B.; Zhang, J.; Sun, W.; Dai, C.; Sun, W.; Li, Q. Centromere protein U is a potential target for gene therapy of human bladder cancer. Oncol. Rep. 2017, 38, 735–744. [Google Scholar] [CrossRef]
- Chen, H.; Zhang, L.; He, W.; Liu, T.; Zhao, Y.; Chen, H.; Li, Y. ESCO2 knockdown inhibits cell proliferation and induces apoptosis in human gastric cancer cells. Biochem. Biophys. Res. Commun. 2018, 496, 475–481. [Google Scholar] [CrossRef]
- Gavin, E.J.; Song, B.; Wang, Y.; Xi, Y.; Ju, J. Reduction of Orc6 expression sensitizes human colon cancer cells to 5-fluorouracil and cisplatin. PLoS ONE 2008, 3, e4054. [Google Scholar] [CrossRef]
- Subhash, V.V.; Tan, S.H.; Tan, W.L.; Yeo, M.S.; Xie, C.; Wong, F.Y.; Kiat, Z.Y.; Lim, R.; Yong, W.P. GTSE1 expression represses apoptotic signaling and confers cisplatin resistance in gastric cancer cells. BMC Cancer 2015, 15, 550. [Google Scholar] [CrossRef]
- Zhu, P.; Jin, J.; Liao, Y.; Li, J.; Yu, X.Z.; Liao, W.; He, S. A novel prognostic biomarker SPC24 up-regulated in hepatocellular carcinoma. Oncotarget 2015, 6, 41383–41397. [Google Scholar] [CrossRef] [PubMed]
- Liu, L.; Wu, J.; Wang, S.; Luo, X.; Du, Y.; Huang, D.; Gu, D.; Zhang, F. PKMYT1 promoted the growth and motility of hepatocellular carcinoma cells by activating beta-catenin/TCF signaling. Exp. Cell Res. 2017, 358, 209–216. [Google Scholar] [CrossRef] [PubMed]
- Jia, H.; Song, L.; Cong, Q.; Wang, J.; Xu, H.; Chu, Y.; Li, Q.; Zhang, Y.; Zou, X.; Zhang, C.; et al. The LIM protein AJUBA promotes colorectal cancer cell survival through suppression of JAK1/STAT1/IFIT2 network. Oncogene 2017, 36, 2655–2666. [Google Scholar] [CrossRef] [PubMed]
- Gonzalez, M.A.; Pinder, S.E.; Callagy, G.; Vowler, S.L.; Morris, L.S.; Bird, K.; Bell, J.A.; Laskey, R.A.; Coleman, N. Minichromosome maintenance protein 2 is a strong independent prognostic marker in breast cancer. J. Clin. Oncol. 2003, 21, 4306–4313. [Google Scholar] [CrossRef] [PubMed]
- Juríková, M.; Danihel, Ľ.; Polák, Š.; Varga, I. Ki67, PCNA, and MCM proteins: Markers of proliferation in the diagnosis of breast cancer. Acta Histochem. 2016, 118, 544–552. [Google Scholar] [CrossRef] [PubMed]
- Zhou, J.; Zhang, W.W.; Peng, F.; Sun, J.Y.; He, Z.Y.; Wu, S.G. Down regulation of hsa_circ_0011946 suppresses the migration and invasion of the breast cancer cell line MCF-7 by targeting RFC3. Cancer Manag. Res. 2018, 10, 535–544. [Google Scholar] [CrossRef] [PubMed]
- Putluri, N.; Maity, S.; Kommagani, R.; Creighton, C.J.; Putluri, V.; Chen, F.; Nanda, S.; Bhowmik, S.K.; Terunuma, A.; Dorsey, T.; et al. Pathway-centric integrative analysis identifies RRM2 as a prognostic marker in breast cancer associated with poor survival and tamoxifen resistance. Neoplasia 2014, 16, 390–402. [Google Scholar] [CrossRef] [PubMed]
- Naushad, S.M.; Reddy, C.A.; Kumaraswami, K.; Divyya, S.; Kotamraju, S.; Gottumukkala, S.R.; Digumarti, R.R.; Kutala, V.K. Impact of hyperhomocysteinemia on breast cancer initiation and progression: Epigenetic perspective. Cell Biochem. Biophys. 2014, 68, 397–406. [Google Scholar] [CrossRef]
- Byrski, T.; Gronwald, J.; Huzarski, T.; Grzybowska, E.; Budryk, M.; Stawicka, M.; Mierzwa, T.; Szwiec, M.; Wisniowski, R.; Siolek, M.; et al. Pathologic complete response rates in young women with BRCA1-positive breast cancers after neoadjuvant chemotherapy. J. Clin. Oncol. 2010, 28, 375–379. [Google Scholar] [CrossRef]
- Cowan, K.H.; Goldsmith, M.E.; Levine, R.M.; Aitken, S.C.; Douglass, E.; Clendeninn, N.; Nienhuis, A.W.; Lippman, M.E. Dihydrofolate reductase gene amplification and possible rearrangement in estrogen-responsive methotrexate-resistant human breast cancer cells. J. Biol. Chem. 1982, 257, 15079–15086. [Google Scholar]
- Soria-Bretones, I.; Sáez, C.; Ruíz-Borrego, M.; Japón, M.A.; Huertas, P. Prognostic value of CtIP/RBBP8 expression in breast cancer. Cancer Med. 2013, 2, 774–783. [Google Scholar] [CrossRef] [PubMed]
- Han, S.; Park, K.; Bae, B.N.; Kim, K.H.; Kim, H.J.; Kim, Y.D.; Kim, H.Y. E2F1 expression is related with the poor survival of lymph node-positive breast cancer patients treated with fluorouracil, doxorubicin and cyclophosphamide. Breast Cancer Res. Treat. 2003, 82, 11–16. [Google Scholar] [CrossRef] [PubMed]
- Gao, T.; Han, Y.; Yu, L.; Ao, S.; Li, Z.; Ji, J. CCNA2 is a prognostic biomarker for ER+ breast cancer and tamoxifen resistance. PLoS ONE 2014, 9, e91771. [Google Scholar] [CrossRef] [PubMed]
- Luo, Q.; Li, X.; Li, J.; Kong, X.; Zhang, J.; Chen, L.; Huang, Y.; Fang, L. MiR-15a is underexpressed and inhibits the cell cycle by targeting CCNE1 in breast cancer. Int. J. Oncol. 2013, 43, 1212–1218. [Google Scholar] [CrossRef] [PubMed][Green Version]
- He, Q.; Zou, L.; Zhang, P.A.; Lui, J.X.; Skog, S.; Fornander, T. The clinical significance of thymidine kinase 1 measurement in serum of breast cancer patients using anti-TK1 antibody. Int. J. Biol. Markers 2000, 15, 139–146. [Google Scholar] [CrossRef] [PubMed]
- Pegoraro, S.; Ros, G.; Ciani, Y.; Sgarra, R.; Piazza, S.; Manfioletti, G. A novel HMGA1-CCNE2-YAP axis regulates breast cancer aggressiveness. Oncotarget 2015, 6, 19087–19101. [Google Scholar] [CrossRef]
- Cangi, M.G.; Cukor, B.; Soung, P.; Signoretti, S.; Moreira, G.; Ranashinge, M.; Cady, B.; Pagano, M.; Loda, M. Role of the Cdc25A phosphatase in human breast cancer. J. Clin. Investig. 2000, 106, 753–761. [Google Scholar] [CrossRef]
- Nakayama, S.; Torikoshi, Y.; Takahashi, T.; Yoshida, T.; Sudo, T.; Matsushima, T.; Kawasaki, Y.; Katayama, A.; Gohda, K.; Hortobagyi, G.N.; et al. Prediction of paclitaxel sensitivity by CDK1 and CDK2 activity in human breast cancer cells. Breast Cancer Res. 2009, 11, R12. [Google Scholar] [CrossRef]
- Hu, Z.; Huang, G.; Sadanandam, A.; Gu, S.; Lenburg, M.E.; Pai, M.; Bayani, N.; Blakely, E.A.; Gray, J.W.; Mao, J.H. The expression level of HJURP has an independent prognostic impact and predicts the sensitivity to radiotherapy in breast cancer. Breast Cancer Res. 2010, 12, R18. [Google Scholar] [CrossRef]
- Choschzick, M.; Lebeau, A.; Marx, A.H.; Tharun, L.; Terracciano, L.; Heilenkötter, U.; Jaenicke, F.; Bokemeyer, C.; Simon, R.; Sauter, G.; et al. Overexpression of cell division cycle 7 homolog is associated with gene amplification frequency in breast cancer. Hum. Pathol. 2010, 41, 358–365. [Google Scholar] [CrossRef]
- Bièche, I.; Vacher, S.; Lallemand, F.; Tozlu-Kara, S.; Bennani, H.; Beuzelin, M.; Driouch, K.; Rouleau, E.; Lerebours, F.; Ripoche, H.; et al. Expression analysis of mitotic spindle checkpoint genes in breast carcinoma: Role of NDC80/HEC1 in early breast tumorigenicity, and a two-gene signature for aneuploidy. Mol. Cancer 2011, 10, 23. [Google Scholar] [CrossRef] [PubMed]
- Capdevila-Busquets, E.; Badiola, N.; Arroyo, R.; Alcalde, V.; Soler-López, M.; Aloy, P. Breast cancer genes PSMC3IP and EPSTI1 play a role in apoptosis regulation. PLoS ONE 2015, 10, e0115352. [Google Scholar] [CrossRef] [PubMed]
- Rantala, J.K.; Edgren, H.; Lehtinen, L.; Wolf, M.; Kleivi, K.; Vollan, H.K.; Aaltola, A.R.; Laasola, P.; Kilpinen, S.; Saviranta, P.; et al. Integrative functional genomics analysis of sustained polyploidy phenotypes in breast cancer cells identifies an oncogenic profile for GINS2. Neoplasia 2010, 12, 877–888. [Google Scholar] [CrossRef] [PubMed]
- Finetti, P.; Guille, A.; Adelaide, J.; Birnbaum, D.; Chaffanet, M.; Bertucci, F. ESPL1 is a candidate oncogene of luminal B breast cancers. Breast Cancer Res. Treat. 2014, 147, 51–59. [Google Scholar] [CrossRef] [PubMed]
- Karppinen, S.M.; Heikkinen, K.; Rapakko, K.; Winqvist, R. Mutation screening of the BARD1 gene: Evidence for involvement of the Cys557Ser allele in hereditary susceptibility to breast cancer. J. Med. Genet. 2004, 41, e114. [Google Scholar] [CrossRef] [PubMed]
- Prokofyeva, D.; Bogdanova, N.; Dubrowinskaja, N.; Bermisheva, M.; Takhirova, Z.; Antonenkova, N.; Turmanov, N.; Datsyuk, I.; Gantsev, S.; Christiansen, H.; et al. Nonsense mutation p.Q548X in BLM, the gene mutated in Bloom’s syndrome, is associated with breast cancer in Slavic populations. Breast Cancer Res. Treat. 2013, 137, 533–539. [Google Scholar] [CrossRef] [PubMed]
- Myrie, K.A.; Percy, M.J.; Azim, J.N.; Neeley, C.K.; Petty, E.M. Mutation and expression analysis of human BUB1 and BUB1B in aneuploid breast cancer cell lines. Cancer Lett. 2000, 152, 193–199. [Google Scholar] [CrossRef]
- Mahadevappa, R.; Neves, H.; Yuen, S.M.; Bai, Y.; McCrudden, C.M.; Yuen, H.F.; Wen, Q.; Zhang, S.D.; Kwok, H.F. The prognostic significance of Cdc6 and Cdt1 in breast cancer. Sci. Rep. 2017, 7, 985. [Google Scholar] [CrossRef]
- Wong, A.K.; Pero, R.; Ormonde, P.A.; Tavtigian, S.V.; Bartel, P.L. RAD51 interacts with the evolutionarily conserved BRC motifs in the human breast cancer susceptibility gene brca2. J. Biol. Chem. 1997, 272, 31941–31944. [Google Scholar] [CrossRef]
- Khongkow, P.; Gomes, A.R.; Gong, C.; Man, E.P.; Tsang, J.W.; Zhao, F.; Monteiro, L.J.; Coombes, R.C.; Medema, R.H.; Khoo, U.S.; et al. Paclitaxel targets FOXM1 to regulate KIF20A in mitotic catastrophe and breast cancer paclitaxel resistance. Oncogene 2016, 35, 990–1002. [Google Scholar] [CrossRef]
- Wang, H.C.; Chiu, C.F.; Tsai, R.Y.; Kuo, Y.S.; Chen, H.S.; Wang, R.F.; Tsai, C.W.; Chang, C.H.; Lin, C.C.; Bau, D.T. Association of genetic polymorphisms of EXO1 gene with risk of breast cancer in Taiwan. Anticancer Res. 2009, 29, 3897–3901. [Google Scholar] [PubMed]
- Tchatchou, S.; Wirtenberger, M.; Hemminki, K.; Sutter, C.; Meindl, A.; Wappenschmidt, B.; Kiechle, M.; Bugert, P.; Schmutzler, R.K.; Bartram, C.R.; et al. Aurora kinases A and B and familial breast cancer risk. Cancer Lett. 2007, 247, 266–272. [Google Scholar] [CrossRef] [PubMed]
- Mahadevappa, R.; Neves, H.; Yuen, S.M.; Jameel, M.; Bai, Y.; Yuen, H.F.; Zhang, S.D.; Zhu, Y.; Lin, Y.; Kwok, H.F. DNA Replication Licensing Protein MCM10 Promotes Tumor Progression and Is a Novel Prognostic Biomarker and Potential Therapeutic Target in Breast Cancer. Cancers 2018, 10, 282. [Google Scholar] [CrossRef] [PubMed]
- Phan, N.N.; Wang, C.Y.; Li, K.L.; Chen, C.F.; Chiao, C.C.; Yu, H.G.; Huang, P.L.; Lin, Y.C. Distinct expression of CDCA3, CDCA5, and CDCA8 leads to shorter relapse free survival in breast cancer patient. Oncotarget 2018, 9, 6977–6992. [Google Scholar] [CrossRef] [PubMed]
- Wazir, U.; Ahmed, M.H.; Bridger, J.M.; Harvey, A.; Jiang, W.G.; Sharma, A.K.; Mokbel, K. The clinicopathological significance of lamin A/C, lamin B1 and lamin B receptor mRNA expression in human breast cancer. Cell. Mol. Biol. Lett. 2013, 18, 595–611. [Google Scholar] [CrossRef] [PubMed]
- Moelans, C.B.; Verschuur-Maes, A.H.; Diest, P.J. Frequent promoter hypermethylation of BRCA2, CDH13, MSH6, PAX5, PAX6 and WT1 in ductal carcinoma in situ and invasive breast cancer. J. Pathol. 2011, 225, 222–231. [Google Scholar] [CrossRef] [PubMed]
- Ashida, S.; Kawada, C.; Inoue, K. Stromal regulation of prostate cancer cell growth by mevalonate pathway enzymes HMGCS1 and HMGCR. Oncol. Lett. 2017, 14, 6533–6542. [Google Scholar] [CrossRef] [PubMed]
- Yim, M.S.; Ha, Y.S.; Kim, I.Y.; Yun, S.J.; Choi, Y.H.; Kim, W.J. HMOX1 is an important prognostic indicator of nonmuscle invasive bladder cancer recurrence and progression. J. Urol. 2011, 185, 701–705. [Google Scholar] [CrossRef]
- Hanrahan, V.; Currie, M.J.; Gunningham, S.P.; Morrin, H.R.; Scott, P.A.; Robinson, B.A.; Fox, S.B. The angiogenic switch for vascular endothelial growth factor (VEGF)-A, VEGF-B, VEGF-C, and VEGF-D in the adenoma-carcinoma sequence during colorectal cancer progression. J. Pathol. 2003, 200, 183–194. [Google Scholar] [CrossRef] [PubMed]
- Ji, X.F.; Fan, Y.C.; Gao, S.; Yang, Y.; Zhang, J.J.; Wang, K. MT1M and MT1G promoter methylation as biomarkers for hepatocellular carcinoma. World J. Gastroenterol. 2014, 20, 4723–4729. [Google Scholar] [CrossRef]
- Han, Y.C.; Zheng, Z.L.; Zuo, Z.H.; Yu, Y.P.; Chen, R.; Tseng, G.C.; Nelson, J.B.; Luo, J.H. Metallothionein 1 h tumour suppressor activity in prostate cancer is mediated by euchromatin methyltransferase 1. J. Pathol. 2013, 230, 184–193. [Google Scholar] [CrossRef] [PubMed]
- Liu, Z.; Ye, Q.; Wu, L.; Gao, F.; Xie, H.; Zhou, L.; Zheng, S.; Xu, X. Metallothionein 1 family profiling identifies MT1X as a tumor suppressor involved in the progression and metastastatic capacity of hepatocellular carcinoma. Mol. Carcinog. 2018, 57, 1435–1444. [Google Scholar] [CrossRef] [PubMed]
- Obata, T.; Toyota, M.; Satoh, A.; Sasaki, Y.; Ogi, K.; Akino, K.; Suzuki, H.; Murai, M.; Kikuchi, T.; Mita, H.; et al. Identification of HRK as a target of epigenetic inactivation in colorectal and gastric cancer. Clin. Cancer Res. 2003, 9, 6410–6418. [Google Scholar] [PubMed]
- Okada, T.; Murata, K.; Hirose, R.; Matsuda, C.; Komatsu, T.; Ikekita, M.; Nakawatari, M.; Nakayama, F.; Wakatsuki, M.; Ohno, T.; et al. Upregulated expression of FGF13/FHF2 mediates resistance to platinum drugs in cervical cancer cells. Sci. Rep. 2013, 3, 2899. [Google Scholar] [CrossRef] [PubMed]
- Ohtani, H.; Nakayama, T.; Yoshie, O. In situ expression of the CCL20-CCR6 axis in lymphocyte-rich gastric cancer and its potential role in the formation of lymphoid stroma. Pathol. Int. 2011, 61, 645–651. [Google Scholar] [CrossRef] [PubMed]
- Charbonneau, B.; Block, M.S.; Bamlet, W.R.; Vierkant, R.A.; Kalli, K.R.; Fogarty, Z.; Rider, D.N.; Sellers, T.; Tworoger, S.S.; Poole, E.; et al. Risk of ovarian cancer and the NF-κB pathway: Genetic association with IL1A and TNFSF10. Cancer Res. 2014, 74, 852–861. [Google Scholar] [CrossRef] [PubMed]
- Shen, Y.L.; Gan, Y.; Gao, H.F.; Fan, Y.C.; Wang, Q.; Yuan, H.; Song, Y.F.; Wang, J.D.; Tu, H. TNFSF9 exerts an inhibitory effect on hepatocellular carcinoma. J. Dig. Dis. 2017, 18, 395–403. [Google Scholar] [CrossRef] [PubMed]
- Helms, M.W.; Kemming, D.; Pospisil, H.; Vogt, U.; Buerger, H.; Korsching, E.; Liedtke, C.; Schlotter, C.M.; Wang, A.; Chan, S.Y.; et al. Squalene epoxidase, located on chromosome 8q24.1, is upregulated in 8q+ breast cancer and indicates poor clinical outcome in stage I and II disease. Br. J. Cancer 2008, 99, 774–780. [Google Scholar] [CrossRef]
- Simony-Lafontaine, J.; Esslimani, M.; Bribes, E.; Gourgou, S.; Lequeux, N.; Lavail, R.; Grenier, J.; Kramar, A.; Casellas, P. Immunocytochemical assessment of sigma-1 receptor and human sterol isomerase in breast cancer and their relationship with a series of prognostic factors. Br. J. Cancer 2000, 82, 1958–1966. [Google Scholar] [CrossRef]
- Maia, C.J.; Socorro, S.; Schmitt, F.; Santos, C.R. STEAP1 is over-expressed in breast cancer and down-regulated by 17beta-estradiol in MCF-7 cells and in the rat mammary gland. Endocrine 2008, 34, 108–116. [Google Scholar] [CrossRef]
- Friedline, J.A.; Garrett, S.H.; Somji, S.; Todd, J.H.; Sens, D.A. Differential expression of the MT-1E gene in estrogen-receptor-positive and -negative human breast cancer cell lines. Am. J. Pathol. 1998, 152, 23–27. [Google Scholar] [PubMed]
- Jadhav, R.R.; Ye, Z.; Huang, R.L.; Liu, J.; Hsu, P.Y.; Huang, Y.W.; Rangel, L.B.; Lai, H.C.; Roa, J.C.; Kirma, N.B.; et al. Genome-wide DNA methylation analysis reveals estrogen-mediated epigenetic repression of metallothionein-1 gene cluster in breast cancer. Clin. Epigenet. 2015, 7, 13. [Google Scholar] [CrossRef] [PubMed]
- Krześlak, A.; Forma, E.; Jóźwiak, P.; Szymczyk, A.; Smolarz, B.; Romanowicz-Makowska, H.; Różański, W.; Bryś, M. Metallothionein 2A genetic polymorphisms and risk of ductal breast cancer. Clin. Exp. Med. 2014, 14, 107–113. [Google Scholar] [CrossRef] [PubMed]
- Duffy, M.J.; Reilly, D.; O’Sullivan, C.; O’Higgins, N.; Fennelly, J.J.; Andreasen, P. Urokinase-plasminogen activator, a new and independent prognostic marker in breast cancer. Cancer Res. 1990, 50, 6827–6829. [Google Scholar] [PubMed]
- Yin, X.; Wolford, C.C.; Chang, Y.S.; McConoughey, S.J.; Ramsey, S.A.; Aderem, A.; Hai, T. ATF3, an adaptive-response gene, enhances TGF{beta} signaling and cancer-initiating cell features in breast cancer cells. J. Cell Sci. 2010, 123, 3558–3565. [Google Scholar] [CrossRef] [PubMed]
- Wang, W.; Huper, G.; Guo, Y.; Murphy, S.K.; Olson, J.A.; Marks, J.R. Analysis of methylation-sensitive transcriptome identifies GADD45a as a frequently methylated gene in breast cancer. Oncogene 2005, 24, 2705–2714. [Google Scholar] [CrossRef]
- Wirtenberger, M.; Tchatchou, S.; Hemminki, K.; Schmutzhard, J.; Sutter, C.; Schmutzler, R.K.; Meindl, A.; Wappenschmidt, B.; Kiechle, M.; Arnold, N.; et al. Associations of genetic variants in the estrogen receptor coactivators PPARGC1A, PPARGC1B and EP300 with familial breast cancer. Carcinogenesis 2006, 27, 2201–2208. [Google Scholar] [CrossRef] [PubMed]
- Xu, C.; Chen, H.; Wang, X.; Gao, J.; Che, Y.; Li, Y.; Ding, F.; Luo, A.; Zhang, S.; Liu, Z. S100A14, a member of the EF-hand calcium-binding proteins, is overexpressed in breast cancer and acts as a modulator of HER2 signaling. J. Biol. Chem. 2014, 289, 827–837. [Google Scholar] [CrossRef]
- Wang, G.; Platt-Higgins, A.; Carroll, J.; de Silva Rudland, S.; Winstanley, J.; Barraclough, R.; Rudland, P.S. Induction of metastasis by S100P in a rat mammary model and its association with poor survival of breast cancer patients. Cancer Res. 2006, 66, 1199–1207. [Google Scholar] [CrossRef]
- Pinilla, S.; Alt, E.; Abdul Khalek, F.J.; Jotzu, C.; Muehlberg, F.; Beckmann, C.; Song, Y.H. Tissue resident stem cells produce CCL5 under the influence of cancer cells and thereby promote breast cancer cell invasion. Cancer Lett. 2009, 284, 80–85. [Google Scholar] [CrossRef]
- Zhu, N.; Zhang, D.; Xie, H.; Zhou, Z.; Chen, H.; Hu, T.; Bai, Y.; Shen, Y.; Yuan, W.; Jing, Q.; et al. Endothelial-specific intron-derived miR-126 is down-regulated in human breast cancer and targets both VEGFA and PIK3R2. Mol. Cell. Biochem. 2011, 351, 157–164. [Google Scholar] [CrossRef] [PubMed]
- Joshi, J.P.; Brown, N.E.; Griner, S.E.; Nahta, R. Growth differentiation factor 15 (GDF15)-mediated HER2 phosphorylation reduces trastuzumab sensitivity of HER2-overexpressing breast cancer cells. Biochem. Pharmacol. 2011, 82, 1090–1099. [Google Scholar] [CrossRef] [PubMed]
- Roberti, M.P.; Barrio, M.M.; Bravo, A.I.; Rocca, Y.S.; Arriaga, J.M.; Bianchini, M.; Mordoh, J.; Levy, E.M. IL-15 and IL-2 increase Cetuximab-mediated cellular cytotoxicity against triple negative breast cancer cell lines expressing EGFR. Breast Cancer Res. Treat. 2011, 130, 465–475. [Google Scholar] [CrossRef] [PubMed]
- Bachmeier, B.E.; Mohrenz, I.V.; Mirisola, V.; Schleicher, E.; Romeo, F.; Höhneke, C.; Jochum, M.; Nerlich, A.G.; Pfeffer, U. Curcumin downregulates the inflammatory cytokines CXCL1 and -2 in breast cancer cells via NFkappaB. Carcinogenesis 2008, 29, 779–789. [Google Scholar] [CrossRef] [PubMed]
- See, A.L.; Chong, P.K.; Lu, S.Y.; Lim, Y.P. CXCL3 is a potential target for breast cancer metastasis. Curr. Cancer Drug Targets 2014, 14, 294–309. [Google Scholar] [CrossRef]
- Martinet, L.; Filleron, T.; Le Guellec, S.; Rochaix, P.; Garrido, I.; Girard, J.P. High endothelial venule blood vessels for tumor-infiltrating lymphocytes are associated with lymphotoxin β-producing dendritic cells in human breast cancer. J. Immunol. 2013, 191, 2001–2008. [Google Scholar] [CrossRef] [PubMed]
- Lloyd, B.H.; Ruddell, C.; Rudland, P.S.; Barraclough, R. S100A3 mRNA expression displays an inverse correlation to breast cancer progression. Biochem. Soc. Trans. 1996, 24, 340S. [Google Scholar] [CrossRef]
- Peng, X.; Fu, H.; Yin, J.; Zhao, Q. CHAF1B knockdown blocks migration in a hepatocellular carcinoma model. Oncol. Rep. 2018, 40, 405–413. [Google Scholar] [CrossRef]
- Wang, Q.; Wen, Y.G.; Li, D.P.; Xia, J.; Zhou, C.Z.; Yan, D.W.; Tang, H.M.; Peng, Z.H. Upregulated INHBA expression is associated with poor survival in gastric cancer. Med. Oncol. 2012, 29, 77–83. [Google Scholar] [CrossRef]
- Lu, R.; Ji, Z.; Li, X.; Qin, J.; Cui, G.; Chen, J.; Zhai, Q.; Zhao, C.; Zhang, W.; Yu, Z. Tumor suppressive microRNA-200a inhibits renal cell carcinoma development by directly targeting TGFB2. Tumour Biol. 2015, 36, 6691–6700. [Google Scholar] [CrossRef]
- Lee, M.; Williams, K.A.; Hu, Y.; Andreas, J.; Patel, S.J.; Zhang, S.; Crawford, N.P. GNL3 and SKA3 are novel prostate cancer metastasis susceptibility genes. Clin. Exp. Metastasis 2015, 32, 769–782. [Google Scholar] [CrossRef] [PubMed]
- Waseem, A.; Ali, M.; Odell, E.W.; Fortune, F.; Teh, M.T. Downstream targets of FOXM1: CEP55 and HELLS are cancer progression markers of head and neck squamous cell carcinoma. Oral Oncol. 2010, 46, 536–542. [Google Scholar] [CrossRef] [PubMed]
- Banerjee, R.; Russo, N.; Liu, M.; Basrur, V.; Bellile, E.; Palanisamy, N.; Scanlon, C.S.; van Tubergen, E.; Inglehart, R.C.; Metwally, T.; et al. Corrigendum: TRIP13 promotes error-prone nonhomologous end joining and induces chemoresistance in head and neck cancer. Nat. Commun. 2016, 7, 10726. [Google Scholar] [CrossRef] [PubMed]
- Yamaguchi, K.; Yamaguchi, R.; Takahashi, N.; Ikenoue, T.; Fujii, T.; Shinozaki, M.; Tsurita, G.; Hata, K.; Niida, A.; Imoto, S.; et al. Overexpression of cohesion establishment factor DSCC1 through E2F in colorectal cancer. PLoS ONE 2014, 9, e85750. [Google Scholar] [CrossRef] [PubMed]
- Li, D.; Frazier, M.; Evans, D.B.; Hess, K.R.; Crane, C.H.; Jiao, L.; Abbruzzese, J.L. Single nucleotide polymorphisms of RecQ1, RAD54L, and ATM genes are associated with reduced survival of pancreatic cancer. J. Clin. Oncol. 2006, 24, 1720–1728. [Google Scholar] [CrossRef] [PubMed]
- Uchida, F.; Uzawa, K.; Kasamatsu, A.; Takatori, H.; Sakamoto, Y.; Ogawara, K.; Shiiba, M.; Tanzawa, H.; Bukawa, H. Overexpression of cell cycle regulator CDCA3 promotes oral cancer progression by enhancing cell proliferation with prevention of G1 phase arrest. BMC Cancer 2012, 12, 321. [Google Scholar] [CrossRef]
- Wang, J.; Guo, X.; Xie, C.; Jiang, J. KIF15 promotes pancreatic cancer proliferation via the MEK-ERK signalling pathway. Br. J. Cancer 2017, 117, 245–255. [Google Scholar] [CrossRef]
- Zeng, C.X.; Fu, S.B.; Feng, W.S.; Zhao, J.Y.; Li, F.X.; Gao, P. TCF19 enhances cell proliferation in hepatocellular carcinoma by activating the ATK/FOXO1 signaling pathway. Neoplasma 2018. [Google Scholar] [CrossRef]
- Killian, A.; Sarafan-Vasseur, N.; Sesboüé, R.; Le Pessot, F.; Blanchard, F.; Lamy, A.; Laurent, M.; Flaman, J.M.; Frébourg, T. Contribution of the BOP1 gene, located on 8q24, to colorectal tumorigenesis. Genes Chromosomes Cancer 2006, 45, 874–881. [Google Scholar] [CrossRef]
- Imai, T.; Oue, N.; Nishioka, M.; Mukai, S.; Oshima, T.; Sakamoto, N.; Sentani, K.; Matsusaki, K.; Yoshida, K.; Yasui, W. Overexpression of KIF11 in Gastric Cancer with Intestinal Mucin Phenotype. Pathobiology 2017, 84, 16–24. [Google Scholar] [CrossRef]
- Nguyen, M.H.; Ueda, K.; Nakamura, Y.; Daigo, Y. Identification of a novel oncogene, MMS22L, involved in lung and esophageal carcinogenesis. Int. J. Oncol. 2012, 41, 1285–1296. [Google Scholar] [CrossRef] [PubMed]
- Coltrera, M.D.; Wang, J.; Porter, P.L.; Gown, A.M. Expression of platelet-derived growth factor B-chain and the platelet-derived growth factor receptor beta subunit in human breast tissue and breast carcinoma. Cancer Res. 1995, 55, 2703–2708. [Google Scholar] [PubMed]
- Zhou, W.; Wang, Z.; Shen, N.; Pi, W.; Jiang, W.; Huang, J.; Hu, Y.; Li, X.; Sun, L. Knockdown of ANLN by lentivirus inhibits cell growth and migration in human breast cancer. Mol. Cell. Biochem. 2015, 398, 11–19. [Google Scholar] [CrossRef] [PubMed]
- Arora, A.; Agarwal, D.; Abdel-Fatah, T.M.; Lu, H.; Croteau, D.L.; Moseley, P.; Aleskandarany, M.A.; Green, A.R.; Ball, G.; Rakha, E.A.; et al. RECQL4 helicase has oncogenic potential in sporadic breast cancers. J. Pathol. 2016, 238, 495–501. [Google Scholar] [CrossRef] [PubMed]
- Cheang, M.C.; Chia, S.K.; Voduc, D.; Gao, D.; Leung, S.; Snider, J.; Watson, M.; Davies, S.; Bernard, P.S.; Parker, J.S.; et al. Ki67 index, HER2 status, and prognosis of patients with luminal B breast cancer. J. Natl. Cancer Inst. 2009, 101, 736–750. [Google Scholar] [CrossRef] [PubMed]
- Hunter, D.J.; Kraft, P.; Jacobs, K.B.; Cox, D.G.; Yeager, M.; Hankinson, S.E.; Wacholder, S.; Wang, Z.; Welch, R.; Hutchinson, A.; et al. A genome-wide association study identifies alleles in FGFR2 associated with risk of sporadic postmenopausal breast cancer. Nat. Genet. 2007, 39, 870–874. [Google Scholar] [CrossRef] [PubMed]
- Zhong, Z.; Yeow, W.S.; Zou, C.; Wassell, R.; Wang, C.; Pestell, R.G.; Quong, J.N.; Quong, A.A. Cyclin D1/cyclin-dependent kinase 4 interacts with filamin A and affects the migration and invasion potential of breast cancer cells. Cancer Res. 2010, 70, 2105–2114. [Google Scholar] [CrossRef] [PubMed]
- Perez-Peña, J.; Corrales-Sánchez, V.; Amir, E.; Pandiella, A.; Ocana, A. Ubiquitin-conjugating enzyme E2T (UBE2T) and denticleless protein homolog (DTL) are linked to poor outcome in breast and lung cancers. Sci. Rep. 2017, 7, 17530. [Google Scholar] [CrossRef]
- Mern, D.S.; Hoppe-Seyler, K.; Hoppe-Seyler, F.; Hasskarl, J.; Burwinkel, B. Targeting Id1 and Id3 by a specific peptide aptamer induces E-box promoter activity, cell cycle arrest, and apoptosis in breast cancer cells. Breast Cancer Res. Treat. 2010, 124, 623–633. [Google Scholar] [CrossRef]
- Krupa, R.; Synowiec, E.; Pawlowska, E.; Wozniak, K.; Blasiak, J. Polymorphism of the homologous recombination repair genes RAD51 and XRCC3 in breast cancer. Exp. Mol. Pathol. 2009, 87, 32–35. [Google Scholar] [CrossRef]
- Crawford, N.P.; Ziogas, A.; Peel, D.J.; Hess, J.; Anton-Culver, H.; Hunter, K.W. Germline polymorphisms in SIPA1 are associated with metastasis and other indicators of poor prognosis in breast cancer. Breast Cancer Res. 2006, 8, R16. [Google Scholar] [CrossRef] [PubMed]
- Abdel-Fatah, T.M.A.; Agarwal, D.; Liu, D.X.; Russell, R.; Rueda, O.M.; Liu, K.; Xu, B.; Moseley, P.M.; Green, A.R.; Pockley, A.G.; et al. SPAG5 as a prognostic biomarker and chemotherapy sensitivity predictor in breast cancer: A retrospective, integrated genomic, transcriptomic, and protein analysis. Lancet Oncol. 2016, 17, 1004–1018. [Google Scholar] [CrossRef]
- Larimer, B.M.; Deutscher, S.L. Identification of a Peptide from In vivo Bacteriophage Display with Homology to EGFL6: A Candidate Tumor Vasculature Ligand in Breast Cancer. J. Mol. Biomark. Diagn. 2014, 5. [Google Scholar] [CrossRef]
- Yan, F.; Tan, X.Y.; Geng, Y.; Ju, H.X.; Gao, Y.F.; Zhu, M.C. Inhibition effect of siRNA-downregulated UHRF1 on breast cancer growth. Cancer Biother. Radiopharm. 2011, 26, 183–189. [Google Scholar] [CrossRef]
- Xie, D.; Nakachi, K.; Wang, H.; Elashoff, R.; Koeffler, H.P. Elevated levels of connective tissue growth factor, WISP-1, and CYR61 in primary breast cancers associated with more advanced features. Cancer Res. 2001, 61, 8917–8923. [Google Scholar] [PubMed]
- Tang, F.; Zhang, R.; He, Y.; Zou, M.; Guo, L.; Xi, T. MicroRNA-125b induces metastasis by targeting STARD13 in MCF-7 and MDA-MB-231 breast cancer cells. PLoS ONE 2012, 7, e35435. [Google Scholar] [CrossRef]
- Cooper, W.N.; Dickinson, R.E.; Dallol, A.; Grigorieva, E.V.; Pavlova, T.V.; Hesson, L.B.; Bieche, I.; Broggini, M.; Maher, E.R.; Zabarovsky, E.R.; et al. Epigenetic regulation of the ras effector/tumour suppressor RASSF2 in breast and lung cancer. Oncogene 2008, 27, 1805–1811. [Google Scholar] [CrossRef]
- Park, J.H.; Lin, M.L.; Nishidate, T.; Nakamura, Y.; Katagiri, T. PDZ-binding kinase/T-LAK cell-originated protein kinase, a putative cancer/testis antigen with an oncogenic activity in breast cancer. Cancer Res. 2006, 66, 9186–9195. [Google Scholar] [CrossRef]
- Kong, C.; Wang, C.; Wang, L.; Ma, M.; Niu, C.; Sun, X.; Du, J.; Dong, Z.; Zhu, S.; Lu, J.; et al. NEDD9 is a positive regulator of epithelial-mesenchymal transition and promotes invasion in aggressive breast cancer. PLoS ONE 2011, 6, e22666. [Google Scholar] [CrossRef]
- Li, Y.; Lu, W.; Chen, D.; Boohaker, R.J.; Zhai, L.; Padmalayam, I.; Wennerberg, K.; Xu, B.; Zhang, W. KIFC1 is a novel potential therapeutic target for breast cancer. Cancer Biol. Ther. 2015, 16, 1316–1322. [Google Scholar] [CrossRef]
- Ye, L.; Guo, L.; He, Z.; Wang, X.; Lin, C.; Zhang, X.; Wu, S.; Bao, Y.; Yang, Q.; Song, L.; et al. Upregulation of E2F8 promotes cell proliferation and tumorigenicity in breast cancer by modulating G1/S phase transition. Oncotarget 2016, 7, 23757–23771. [Google Scholar] [CrossRef] [PubMed]
- Weinstat-Saslow, D.L.; Zabrenetzky, V.S.; VanHoutte, K.; Frazier, W.A.; Roberts, D.D.; Steeg, P.S. Transfection of thrombospondin 1 complementary DNA into a human breast carcinoma cell line reduces primary tumor growth, metastatic potential, and angiogenesis. Cancer Res. 1994, 54, 6504–6511. [Google Scholar] [PubMed]
- García, M.J.; Fernández, V.; Osorio, A.; Barroso, A.; Fernández, F.; Urioste, M.; Benítez, J. Mutational analysis of FANCL, FANCM and the recently identified FANCI suggests that among the 13 known Fanconi Anemia genes, only FANCD1/BRCA2 plays a major role in high-risk breast cancer predisposition. Carcinogenesis 2009, 30, 1898–1902. [Google Scholar] [CrossRef] [PubMed]
- Zhang, X.; Pan, Y.; Fu, H.; Zhang, J. Nucleolar and Spindle Associated Protein 1 (NUSAP1) Inhibits Cell Proliferation and Enhances Susceptibility to Epirubicin In Invasive Breast Cancer Cells by Regulating Cyclin D Kinase (CDK1) and DLGAP5 Expression. Med. Sci. Monit. 2018, 24, 8553–8564. [Google Scholar] [CrossRef] [PubMed]
- McInnes, N.; Sadlon, T.J.; Brown, C.Y.; Pederson, S.; Beyer, M.; Schultze, J.L.; McColl, S.; Goodall, G.J.; Barry, S.C. FOXP3 and FOXP3-regulated microRNAs suppress SATB1 in breast cancer cells. Oncogene 2012, 31, 1045–1054. [Google Scholar] [CrossRef] [PubMed]
- Corpet, A.; De Koning, L.; Toedling, J.; Savignoni, A.; Berger, F.; Lemaître, C.J.; O’Sullivan, R.J.; Karlseder, J.; Barillot, E.; Asselain, B.; et al. Asf1b, the necessary Asf1 isoform for proliferation, is predictive of outcome in breast cancer. EMBO J. 2011, 30, 480–493. [Google Scholar] [CrossRef]
- Ye, Q.; Holowatyj, A.; Wu, J.; Liu, H.; Zhang, L.; Suzuki, T.; Yang, Z.Q. Genetic alterations of KDM4 subfamily and therapeutic effect of novel demethylase inhibitor in breast cancer. Am. J. Cancer Res. 2015, 5, 1519–1530. [Google Scholar] [PubMed]
- Yang, G.D.; Yang, X.M.; Lu, H.; Ren, Y.; Ma, M.Z.; Zhu, L.Y.; Wang, J.H.; Song, W.W.; Zhang, W.M.; Zhang, R.; et al. SERPINA3 promotes endometrial cancer cells growth by regulating G2/M cell cycle checkpoint and apoptosis. Int. J. Clin. Exp. Pathol. 2014, 7, 1348–1358. [Google Scholar]
- Neubauer, N.L.; Ward, E.C.; Patel, P.; Lu, Z.; Lee, I.; Blok, L.J.; Schink, J.; Kim, J.J. Progesterone receptor-B induction of BIRC3 protects endometrial cancer cells from AP1-59-mediated apoptosis. Horm. Cancer 2011, 2, 170–181. [Google Scholar] [CrossRef]
- Han, J.; Zhang, L.; Zhang, J.; Jiang, Q.; Tong, D.; Wang, X.; Gao, X.; Zhao, L.; Huang, C. CREBRF promotes the proliferation of human gastric cancer cells via the AKT signaling pathway. Cell. Mol. Biol. 2018, 64, 40–45. [Google Scholar] [CrossRef]
- Lai, K.C.; Liu, C.J.; Lin, T.J.; Mar, A.C.; Wang, H.H.; Chen, C.W.; Hong, Z.X.; Lee, T.C. Blocking TNF-α inhibits angiogenesis and growth of IFIT2-depleted metastatic oral squamous cell carcinoma cells. Cancer Lett. 2016, 370, 207–215. [Google Scholar] [CrossRef] [PubMed]
- Simonetti, O.; Goteri, G.; Lucarini, G.; Filosa, A.; Pieramici, T.; Rubini, C.; Biagini, G.; Offidani, A. Potential role of CCL27 and CCR10 expression in melanoma progression and immune escape. Eur. J. Cancer 2006, 42, 1181–1187. [Google Scholar] [CrossRef] [PubMed]
- Qiu, G.; Sun, W.; Zou, Y.; Cai, Z.; Wang, P.; Lin, X.; Huang, J.; Jiang, L.; Ding, X.; Hu, G. RNA interference against TMEM97 inhibits cell proliferation, migration, and invasion in glioma cells. Tumour Biol. 2015, 36, 8231–8238. [Google Scholar] [CrossRef] [PubMed]
- Zhao, C.; Yin, S.; Dong, Y.; Guo, X.; Fan, L.; Ye, M.; Hu, H. Autophagy-dependent EIF2AK3 activation compromises ursolic acid-induced apoptosis through upregulation of MCL1 in MCF-7 human breast cancer cells. Autophagy 2013, 9, 196–207. [Google Scholar] [CrossRef] [PubMed]
- Hellerbrand, C.; Amann, T.; Schlegel, J.; Wild, P.; Bataille, F.; Spruss, T.; Hartmann, A.; Bosserhoff, A.K. The novel gene MIA2 acts as a tumour suppressor in hepatocellular carcinoma. Gut 2008, 57, 243–251. [Google Scholar] [CrossRef] [PubMed]
- Tajnik, M.; Stražišar, M.; Volavšek, M.; Boštjančič, E.; Glavač, D. BBC3 is down-regulated with increased tumor size independently of p53 expression in head and neck cancer. Cancer Biomark. 2012, 11, 197–208. [Google Scholar] [CrossRef] [PubMed]
- Dar, A.A.; Pradhan, T.N.; Kulkarni, D.P.; Shah, S.U.; Rao, K.V.; Chaukar, D.A.; D’Cruz, A.K.; Chiplunkar, S.V. Extracellular 2′5′-oligoadenylate synthetase 2 mediates T-cell receptor CD3-ζ chain down-regulation via caspase-3 activation in oral cancer. Immunology 2016, 147, 251–264. [Google Scholar] [CrossRef]
- Cho, H.; Chung, J.Y.; Kim, S.; Braunschweig, T.; Kang, T.H.; Kim, J.; Chung, E.J.; Hewitt, S.M.; Kim, J.H. MICA/B and ULBP1 NKG2D ligands are independent predictors of good prognosis in cervical cancer. BMC Cancer 2014, 14, 957. [Google Scholar] [CrossRef]
- Yang, L.; Mu, Y.; Cui, H.; Liang, Y.; Su, X. MiR-9-3p augments apoptosis induced by H2O2 through down regulation of Herpud1 in glioma. PLoS ONE 2017, 12, e0174839. [Google Scholar] [CrossRef]
- Scapoli, L.; Girardi, A.; Rubini, C.; Martinelli, M.; Spinelli, G.; Palmieri, A.; Lo Muzio, L.; Carinci, F. LOH at PDCD4, CTNNB1, and CASP4 loci contributes to stage progression of oral cancer. Int. J. Immunopathol. Pharmacol. 2011, 24, 89–93. [Google Scholar] [CrossRef]
- Roh, S.A.; Park, I.J.; Yoon, Y.S.; Kwon, Y.H.; Chung, J.H.; Kim, T.W.; Cho, D.H.; Lim, B.H.; Kim, S.K.; Kim, S.Y.; et al. Feasibility of novel PPP1R15A and proposed ANXA11 single nucleotide polymorphisms as predictive markers for bevacizumab regimen in metastatic colorectal cancer. J. Cancer Res. Clin. Oncol. 2016, 142, 1705–1714. [Google Scholar] [CrossRef] [PubMed]
- Olsen, R.S.; Andersson, R.E.; Zar, N.; Löfgren, S.; Wågsäter, D.; Matussek, A.; Dimberg, J. Prognostic significance of PLA2G4C gene polymorphism in patients with stage II colorectal cancer. Acta Oncol. 2016, 55, 474–479. [Google Scholar] [CrossRef] [PubMed]
- Both, J.; Krijgsman, O.; Bras, J.; Schaap, G.R.; Baas, F.; Ylstra, B.; Hulsebos, T.J. Focal chromosomal copy number aberrations identify CMTM8 and GPR177 as new candidate driver genes in osteosarcoma. PLoS ONE 2014, 9, e115835. [Google Scholar] [CrossRef] [PubMed]
- Lee, M.H.; Yang, H.I.; Lu, S.N.; Lin, Y.J.; Jen, C.L.; Wong, K.H.; Chan, S.Y.; Chen, L.C.; Wang, L.Y.; L’Italien, G.; et al. Polymorphisms near the IFNL3 Gene Associated with HCV RNA Spontaneous Clearance and Hepatocellular Carcinoma Risk. Sci. Rep. 2015, 5, 17030. [Google Scholar] [CrossRef] [PubMed]
- Kim, M.S.; Jeong, E.G.; Ahn, C.H.; Kim, S.S.; Lee, S.H.; Yoo, N.J. Frameshift mutation of UVRAG, an autophagy-related gene, in gastric carcinomas with microsatellite instability. Hum. Pathol. 2008, 39, 1059–1063. [Google Scholar] [CrossRef] [PubMed]
- Giannakis, M.; Hodis, E.; Jasmine Mu, X.; Yamauchi, M.; Rosenbluh, J.; Cibulskis, K.; Saksena, G.; Lawrence, M.S.; Qian, Z.R.; Nishihara, R.; et al. RNF43 is frequently mutated in colorectal and endometrial cancers. Nat. Genet. 2014, 46, 1264–1266. [Google Scholar] [CrossRef]
- Antony, P.; Rose, M.; Heidenreich, A.; Knüchel, R.; Gaisa, N.T.; Dahl, E. Epigenetic inactivation of ST6GAL1 in human bladder cancer. BMC Cancer 2014, 14, 901. [Google Scholar] [CrossRef]
- Zahnow, C.A. CCAAT/enhancer-binding protein beta: Its role in breast cancer and associations with receptor tyrosine kinases. Expert Rev. Mol. Med. 2009, 11, e12. [Google Scholar] [CrossRef]
- Krumpel, M.; Reithmeier, A.; Senge, T.; Baeumler, T.A.; Frank, M.; Nyholm, P.G.; Ek-Rylander, B.; Andersson, G. The small chemical enzyme inhibitor 5-phenylnicotinic acid/CD13 inhibits cell migration and invasion of tartrate-resistant acid phosphatase/ACP5-overexpressing MDA-MB-231 breast cancer cells. Exp. Cell Res. 2015, 339, 154–162. [Google Scholar] [CrossRef]
- Nagata, T.; Shimada, Y.; Sekine, S.; Hori, R.; Matsui, K.; Okumura, T.; Sawada, S.; Fukuoka, J.; Tsukada, K. Prognostic significance of NANOG and KLF4 for breast cancer. Breast Cancer 2014, 21, 96–101. [Google Scholar] [CrossRef]
- Wang, Y.; Cai, X.; Zhang, S.; Cui, M.; Liu, F.; Sun, B.; Zhang, W.; Zhang, X.; Ye, L. HBXIP up-regulates ACSL1 through activating transcriptional factor Sp1 in breast cancer. Biochem. Biophys. Res. Commun. 2017, 484, 565–571. [Google Scholar] [CrossRef]
- Luker, K.E.; Pica, C.M.; Schreiber, R.D.; Piwnica-Worms, D. Overexpression of IRF9 confers resistance to antimicrotubule agents in breast cancer cells. Cancer Res. 2001, 61, 6540–6547. [Google Scholar]
- Chang, Y.W.; Tseng, C.F.; Wang, M.Y.; Chang, W.C.; Lee, C.C.; Chen, L.T.; Hung, M.C.; Su, J.L. Deacetylation of HSPA5 by HDAC6 leads to GP78-mediated HSPA5 ubiquitination at K447 and suppresses metastasis of breast cancer. Oncogene 2016, 35, 1517–1528. [Google Scholar] [CrossRef] [PubMed]
- Rosette, C.; Roth, R.B.; Oeth, P.; Braun, A.; Kammerer, S.; Ekblom, J.; Denissenko, M.F. Role of ICAM1 in invasion of human breast cancer cells. Carcinogenesis 2005, 26, 943–950. [Google Scholar] [CrossRef] [PubMed]
- Ogony, J.; Choi, H.J.; Lui, A.; Cristofanilli, M.; Lewis-Wambi, J. Interferon-induced transmembrane protein 1 (IFITM1) overexpression enhances the aggressive phenotype of SUM149 inflammatory breast cancer cells in a signal transducer and activator of transcription 2 (STAT2)-dependent manner. Breast Cancer Res. 2016, 18, 25. [Google Scholar] [CrossRef]
- Danish, H.H.; Goyal, S.; Taunk, N.K.; Wu, H.; Moran, M.S.; Haffty, B.G. Interferon-induced protein with tetratricopeptide repeats 1 (IFIT1) as a prognostic marker for local control in T1-2 N0 breast cancer treated with breast-conserving surgery and radiation therapy (BCS + RT). Breast J. 2013, 19, 231–239. [Google Scholar] [CrossRef]
- Bektas, N.; Noetzel, E.; Veeck, J.; Press, M.F.; Kristiansen, G.; Naami, A.; Hartmann, A.; Dimmler, A.; Beckmann, M.W.; Knüchel, R.; et al. The ubiquitin-like molecule interferon-stimulated gene 15 (ISG15) is a potential prognostic marker in human breast cancer. Breast Cancer Res. 2008, 10, R58. [Google Scholar] [CrossRef] [PubMed]
- Nagelkerke, A.; Bussink, J.; Mujcic, H.; Wouters, B.G.; Lehmann, S.; Sweep, F.C.; Span, P.N. Hypoxia stimulates migration of breast cancer cells via the PERK/ATF4/LAMP3-arm of the unfolded protein response. Breast Cancer Res. 2013, 15, R2. [Google Scholar] [CrossRef] [PubMed]
- Madeleine, M.M.; Johnson, L.G.; Malkki, M.; Resler, A.J.; Petersdorf, E.W.; McKnight, B.; Malone, K.E. Genetic variation in proinflammatory cytokines IL6, IL6R, TNF-region, and TNFRSF1A and risk of breast cancer. Breast Cancer Res Treat. 2011, 129, 887–899. [Google Scholar] [CrossRef] [PubMed]
- Godoy, P.; Cadenas, C.; Hellwig, B.; Marchan, R.; Stewart, J.; Reif, R.; Lohr, M.; Gehrmann, M.; Rahnenführer, J.; Schmidt, M.; et al. Interferon-inducible guanylate binding protein (GBP2) is associated with better prognosis in breast cancer and indicates an efficient T cell response. Breast Cancer 2014, 21, 491–499. [Google Scholar] [CrossRef]
- Bouker, K.B.; Skaar, T.C.; Riggins, R.B.; Harburger, D.S.; Fernandez, D.R.; Zwart, A.; Wang, A.; Clarke, R. Interferon regulatory factor-1 (IRF-1) exhibits tumor suppressor activities in breast cancer associated with caspase activation and induction of apoptosis. Carcinogenesis 2005, 26, 1527–1535. [Google Scholar] [CrossRef] [PubMed]
- Gaur, S.; Shively, J.E.; Yen, Y.; Gaur, R.K. Altered splicing of CEACAM1 in breast cancer: Identification of regulatory sequences that control splicing of CEACAM1 into long or short cytoplasmic domain isoforms. Mol. Cancer 2008, 7, 46. [Google Scholar] [CrossRef] [PubMed]
- Yu, S.E.; Park, S.H.; Jang, Y.K. Epigenetic silencing of TNFSF7 (CD70) by DNA methylation during progression to breast cancer. Mol. Cells 2010, 29, 217–221. [Google Scholar] [CrossRef] [PubMed]
- Dong, C.; Yuan, L.; Dai, J.; Lai, L.; Mao, L.; Xiang, S.; Rowan, B.; Hill, S.M. Melatonin inhibits mitogenic cross-talk between retinoic acid-related orphan receptor alpha (RORalpha) and ERalpha in MCF-7 human breast cancer cells. Steroids 2010, 75, 944–951. [Google Scholar] [CrossRef] [PubMed]
- Vendrell, J.A.; Ghayad, S.; Ben-Larbi, S.; Dumontet, C.; Mechti, N.; Cohen, P.A. A20/TNFAIP3, a new estrogen-regulated gene that confers tamoxifen resistance in breast cancer cells. Oncogene 2007, 26, 4656–4667. [Google Scholar] [CrossRef] [PubMed]
- Shi, B.; Vinyals, A.; Alia, P.; Broceño, C.; Chen, F.; Adrover, M.; Gelpi, C.; Price, J.E.; Fabra, A. Differential expression of MHC class II molecules in highly metastatic breast cancer cells is mediated by the regulation of the CIITA transcription Implication of CIITA in tumor and metastasis development. Int. J. Biochem. Cell Biol. 2006, 38, 544–562. [Google Scholar] [CrossRef] [PubMed]
- Liu, X.X.; Li, X.J.; Zhang, B.; Liang, Y.J.; Zhou, C.X.; Cao, D.X.; He, M.; Chen, G.Q.; He, J.R.; Zhao, Q. MicroRNA-26b is underexpressed in human breast cancer and induces cell apoptosis by targeting SLC7A11. FEBS Lett. 2011, 585, 1363–1367. [Google Scholar] [CrossRef] [PubMed]
- Naderi, A. Coagulation factor VII is regulated by androgen receptor in breast cancer. Exp. Cell Res. 2015, 331, 239–250. [Google Scholar] [CrossRef]
- Feng, Y.H.; Chen, W.Y.; Kuo, Y.H.; Tung, C.L.; Tsao, C.J.; Shiau, A.L.; Wu, C.L. Elovl6 is a poor prognostic predictor in breast cancer. Oncol. Lett. 2016, 12, 207–212. [Google Scholar] [CrossRef]
- Zhao, X.; Liu, X.; Su, L. Parthenolide induces apoptosis via TNFRSF10B and PMAIP1 pathways in human lung cancer cells. J. Exp. Clin. Cancer Res. 2014, 33, 3. [Google Scholar] [CrossRef]
- Qian, X.L.; Li, Y.Q.; Yu, B.; Gu, F.; Liu, F.F.; Li, W.D.; Zhang, X.M.; Fu, L. Syndecan binding protein (SDCBP) is overexpressed in estrogen receptor negative breast cancers, and is a potential promoter for tumor proliferation. PLoS ONE 2013, 8, e60046. [Google Scholar] [CrossRef] [PubMed]
- Stojadinovic, A.; Hooke, J.A.; Shriver, C.D.; Nissan, A.; Kovatich, A.J.; Kao, T.C.; Ponniah, S.; Peoples, G.E.; Moroni, M. HYOU1/Orp150 expression in breast cancer. Med. Sci. Monit. 2007, 13, BR231–BR239. [Google Scholar]
- Diarra-Mehrpour, M.; Arrabal, S.; Jalil, A.; Pinson, X.; Gaudin, C.; Piétu, G.; Pitaval, A.; Ripoche, H.; Eloit, M.; Dormont, D.; et al. Prion protein prevents human breast carcinoma cell line from tumor necrosis factor alpha-induced cell death. Cancer Res. 2004, 64, 719–727. [Google Scholar] [CrossRef] [PubMed]
- Kotsopoulos, J.; Ghadirian, P.; El-Sohemy, A.; Lynch, H.T.; Snyder, C.; Daly, M.; Domchek, S.; Randall, S.; Karlan, B.; Zhang, P.; et al. The CYP1A2 genotype modifies the association between coffee consumption and breast cancer risk among BRCA1 mutation carriers. Cancer Epidemiol. Biomark. Prev. 2007, 16, 912–926. [Google Scholar] [CrossRef] [PubMed]
- Thompson, H.G.; Harris, J.W.; Wold, B.J.; Lin, F.; Brody, J.P. p62 overexpression in breast tumors and regulation by prostate-derivedEts factor in breast cancer cells. Oncogene 2003, 22, 2322–2333. [Google Scholar] [CrossRef]
- Suzuki, S.; Takagi, K.; Miki, Y.; Onodera, Y.; Akahira, J.; Ebata, A.; Ishida, T.; Watanabe, M.; Sasano, H.; Suzuki, T. Nucleobindin 2 in human breast carcinoma as a potent prognostic factor. Cancer Sci. 2012, 103, 136–143. [Google Scholar] [CrossRef]
- Wang, S.; Chen, F.; Tang, L. IL-32 promotes breast cancer cell growth and invasiveness. Oncol. Lett. 2015, 9, 305–307. [Google Scholar] [CrossRef]
- Roberti, M.P.; Rocca, Y.S.; Amat, M.; Pampena, M.B.; Loza, J.; Coló, F.; Fabiano, V.; Loza, C.M.; Arriaga, J.M.; Bianchini, M.; et al. IL-2- or IL-15-activated NK cells enhance Cetuximab-mediated activity against triple-negative breast cancer in xenografts and in breast cancer patients. Breast Cancer Res. Treat. 2012, 136, 659–671. [Google Scholar] [CrossRef]
- Dalamaga, M. Nicotinamide phosphoribosyl-transferase/visfatin: A missing link between overweight/obesity and postmenopausal breast cancer? Potential preventive and therapeutic perspectives and challenges. Med. Hypotheses 2012, 79, 617–621. [Google Scholar] [CrossRef]
- Puvirajesinghe, T.M.; Bertucci, F.; Jain, A.; Scerbo, P.; Belotti, E.; Audebert, S.; Sebbagh, M.; Lopez, M.; Brech, A.; Finetti, P.; et al. Identification of p62/SQSTM1 as a component of non-canonical Wnt VANGL2-JNK signaling in breast cancer. Nat. Commun. 2016, 7, 10318. [Google Scholar] [CrossRef]
- Ajona, D.; Castaño, Z.; Garayoa, M.; Zudaire, E.; Pajares, M.J.; Martinez, A.; Cuttitta, F.; Montuenga, L.M.; Pio, R. Expression of complement factor H by lung cancer cells: Effects on the activation of the alternative pathway of complement. Cancer Res. 2004, 64, 6310–6318. [Google Scholar] [CrossRef] [PubMed]
- Othman, E.Q.; Kaur, G.; Mutee, A.F.; Muhammad, T.S.; Tan, M.L. Immunohistochemical expression of MAP1LC3A and MAP1LC3B protein in breast carcinoma tissues. J. Clin. Lab. Anal. 2009, 23, 249–258. [Google Scholar] [CrossRef] [PubMed]
- Lv, P.; Qiu, X.; Gu, Y.; Yang, X.; Xu, X.; Yang, Y. Long non-coding RNA SNHG6 enhances cell proliferation, migration and invasion by regulating miR-26a-5p/MAPK6 in breast cancer. Biomed. Pharmacother. 2018, 110, 294–301. [Google Scholar] [CrossRef] [PubMed]
- Nagai, M.A.; Gerhard, R.; Fregnani, J.H.; Nonogaki, S.; Rierger, R.B.; Netto, M.M.; Soares, F.A. Prognostic value of NDRG1 and SPARC protein expression in breast cancer patients. Breast Cancer Res. Treat. 2011, 126, 1–14. [Google Scholar] [CrossRef] [PubMed]
- Shima, N.; Buske, T.R.; Schimenti, J.C. Genetic screen for chromosome instability in mice: Mcm4 and breast cancer. Cell Cycle 2007, 6, 1135–1140. [Google Scholar] [CrossRef] [PubMed]
- McCaig, C.; Perks, C.M.; Holly, J.M. Intrinsic actions of IGFBP-3 and IGFBP-5 on Hs578T breast cancer epithelial cells: Inhibition or accentuation of attachment and survival is dependent upon the presence of fibronectin. J. Cell Sci. 2002, 115, 4293–4303. [Google Scholar] [CrossRef] [PubMed]
- Knight, J.A.; Onay, U.V.; Wells, S.; Li, H.; Shi, E.J.; Andrulis, I.L.; Ozcelik, H. Genetic variants of GPX1 and SOD2 and breast cancer risk at the Ontario site of the Breast Cancer Family Registry. Cancer Epidemiol. Biomark. Prev. 2004, 13, 146–149. [Google Scholar] [CrossRef]
- Li, X.; Xiao, R.; Tembo, K.; Hao, L.; Xiong, M.; Pan, S.; Yang, X.; Yuan, W.; Xiong, J.; Zhang, Q. PEG10 promotes human breast cancer cell proliferation, migration and invasion. Int. J. Oncol. 2016, 48, 1933–1942. [Google Scholar] [CrossRef]
- Chen, Y.; Hughes-Fulford, M. Human prostate cancer cells lack feedback regulation of low-density lipoprotein receptor and its regulator, SREBP2. Int. J. Cancer 2001, 91, 41–45. [Google Scholar] [CrossRef]
- Watkins, G.; Douglas-Jones, A.; Mansel, R.E.; Jiang, W.G. Expression of thromboxane synthase, TBXAS1 and the thromboxane A2 receptor, TBXA2R, in human breast cancer. Int. Semin. Surg. Oncol. 2005, 2, 23. [Google Scholar] [CrossRef][Green Version]


© 2019 by the authors. Licensee MDPI, Basel, Switzerland. This article is an open access article distributed under the terms and conditions of the Creative Commons Attribution (CC BY) license (http://creativecommons.org/licenses/by/4.0/).
Share and Cite
Alshabi, A.M.; Vastrad, B.; Shaikh, I.A.; Vastrad, C. Exploring the Molecular Mechanism of the Drug-Treated Breast Cancer Based on Gene Expression Microarray. Biomolecules 2019, 9, 282. https://doi.org/10.3390/biom9070282
Alshabi AM, Vastrad B, Shaikh IA, Vastrad C. Exploring the Molecular Mechanism of the Drug-Treated Breast Cancer Based on Gene Expression Microarray. Biomolecules. 2019; 9(7):282. https://doi.org/10.3390/biom9070282
Chicago/Turabian StyleAlshabi, Ali Mohamed, Basavaraj Vastrad, Ibrahim Ahmed Shaikh, and Chanabasayya Vastrad. 2019. "Exploring the Molecular Mechanism of the Drug-Treated Breast Cancer Based on Gene Expression Microarray" Biomolecules 9, no. 7: 282. https://doi.org/10.3390/biom9070282
APA StyleAlshabi, A. M., Vastrad, B., Shaikh, I. A., & Vastrad, C. (2019). Exploring the Molecular Mechanism of the Drug-Treated Breast Cancer Based on Gene Expression Microarray. Biomolecules, 9(7), 282. https://doi.org/10.3390/biom9070282