Article

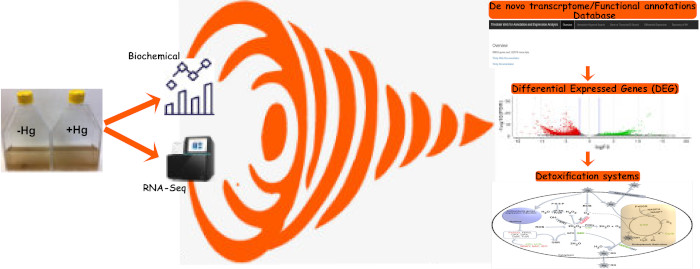
Transcriptomic Analysis Reveals the Roles of Detoxification Systems in Response to Mercury in Chromera velia

by
Abdoallah Sharaf
1,2,*,†,
Roberto De Michele
3,†,
Ayush Sharma
1,4,
Safieh Fakhari
3 and
Miroslav Oborník
1,4,*
1
Institute of Parasitology, Biology Centre, Czech Academy of Sciences, 37005 České Budějovice, Czech Republic
2
Genetic Department, Faculty of Agriculture, Ain Shams University, Cairo 11241, Egypt
3
Institute of Biosciences and Bioresources (IBBR), National Research Council (CNR) of Italy, 90129 Palermo, Italy
4
Faculty of Science, University of South Bohemia, 37005 České Budějovice, Czech Republic
*
Authors to whom correspondence should be addressed.
These authors contributed equally to this work.
Biomolecules 2019, 9(11), 647; https://doi.org/10.3390/biom9110647
Submission received: 3 September 2019 / Revised: 15 October 2019 / Accepted: 18 October 2019 / Published: 24 October 2019
(This article belongs to the Section Molecular Biology)

Abstract

:
Heavy metal pollution is an increasing global concern. Among heavy metals, mercury (Hg) is especially dangerous because of its massive release into the environment and high toxicity, especially for aquatic organisms. The molecular response mechanisms of algae to Hg exposure are mostly unknown. Here, we combine physiological, biochemical, and transcriptomic analysis to provide, for the first time, a comprehensive view on the pathways activated in Chromera velia in response to toxic levels of Hg. Production of hydrogen peroxide and superoxide anion, two reactive oxygen species (ROS), showed opposite patterns in response to Hg2+ while reactive nitrogen species (RNS) levels did not change. A deep RNA sequencing analysis generated a total of 307,738,790 high-quality reads assembled in 122,874 transcripts, representing 89,853 unigenes successfully annotated in databases. Detailed analysis of the differently expressed genes corroborates the biochemical results observed in ROS production and suggests novel putative molecular mechanisms in the algal response to Hg2+. Moreover, we indicated that important transcription factor (TF) families associated with stress responses differentially expressed in C. velia cultures under Hg stress. Our study presents the first in-depth transcriptomic analysis of C. velia, focusing on the expression of genes involved in different detoxification defense systems in response to heavy metal stress.

Graphical Abstract

1. Introduction

Pollution with heavy metals is a major environmental concern worldwide because of their diffusion, persistence, and toxic effects. Heavy metals are released in the ecosystems during volcanic eruptions and by anthropogenic activities, such as mining, fossil fuel burning, agriculture, and waste management. Heavy metals are not degraded by organisms, but can be absorbed by plants and algae, thus entering the food chain. Among heavy metals, mercury (Hg) is particularly toxic, since it can accumulate at a high level, especially in fishes, and cause serious diseases, such as the infamous Minamata outbreak in Japan in the 1950s [1]. In the environment, Hg is present in different forms, i.e., as elemental Hg, ionic Hg2+, or generated as methyl-Hg. Regardless of the form, a large part of Hg ends up in the oceans, with estimates of about 290 million moles currently released [2]. Hg quickly accumulates in both terrestrial plants [3,4,5] and aquatic organisms [6,7,8,9]. In oceans, algae are the first target of Hg accumulation, and some microalgal species are active Hg-accumulators and may serve for phytoremediation purposes [10].
Physiological effects of heavy metals on higher plants, especially cadmium, have been extensively studied (recently reviewed by [11]). Far less is known about the plant physiological responses to Hg. In plants, high concentrations of mercury are usually very toxic and lead to cell death, often preceded by water loss, impaired ion homeostasis, and disruption of membrane integrity (reviewed by [12,13]). Events often associated with exposure to heavy metals are the oxidative and nitrosative bursts.
Various metabolic processes generate reactive oxygen and nitrogen species (ROS and RNS) as by-products [14,15] or in response to biotic and abiotic stresses [16]. ROS include singlet oxygen (1O2), superoxide anion (O2−), hydrogen peroxide (H2O2), and hydroxyl radical (·OH) [17]. RNS comprises, among others, nitric oxide (NO) and peroxynitrite (ONOO). ROS and RNS are reactive molecules that can directly damage proteins, lipids, and DNA, but they also act as signaling molecules during biotic and abiotic stress responses [15,18]. In physiological conditions, ROS homeostasis is maintained by the antioxidant machinery of the cell, including the enzymes superoxide dismutase (SOD), catalase (CAT), glutathione peroxidase (GPX), ascorbate peroxidase (APX), peroxidase (POD), and glutathione reductase (GR); and non-enzymatic mechanism such as glutathione (GSH), ascorbate (AsA), and others [14,18,19].
It is well known that ROS and RNS play important roles during plant response to heavy metals, and that, often, different reactive species interact. For instance, Arabidopsis cells treated with cadmium trigger an early wave in NO, required for a later H2O2 burst and cell death [20]. In the case of Hg, the little information available is restricted to H2O2 and O2−, and it shows some contradictory patterns, with their levels increasing in some species/tissues, and decreasing in others [21,22,23,24].
An involvement of ROS in Hg-induced toxicity is also suggested by the evidence that the antioxidant machinery is altered following treatment with Hg2+, although once again the modulation of each enzyme activity varies greatly depending on the experimental system, species, duration, and intensity of treatments [4,8,21,23,24,25,26,27].
Cells can detoxify from heavy metals by transforming them into less toxic forms. Photosynthetic organisms perform biotransformation in three phases [28,29,30,31,32]. During phase I (transformation), oxidations, reductions, or hydrolysis are catalyzed by mixed-function oxidases (MFO) (i.e., cytochrome P-450 (Cyt P450), cytochrome b5 (Cyt b5), and NADPH-cytochrome P450 reductase (P450R) [33,34,35]. The MFO system can transform lipophilic xenobiotics, such as methyl-Hg, into more water-soluble compounds to facilitate their excretion [36]. Phase II of biotransformation (conjugation) facilitates the heavy metal excretion through binding with chelating compounds such as GSH and glucuronic acid (GA) [37,38]. The biotransformation detoxication pathway is acting as a sink for environmental chemicals in microalgae and could function as ‘‘green livers’’ since it is similar to those of the mammalian liver [30,34,39] Phase III involves confining the heavy metal in the cell wall or the vacuole [40,41,42]. In animals, multixenobiotic resistance (MXR) P-glycoprotein transporter (ABC) can also export xenobiotic compounds [43,44]. Very little is known about the biotransformation pathways in algae.
The heavy metal response also involves an active transcriptional rearrangement. Several transcription factors (TFs) have been identified to play a role in heavy metal stress response, acting upstream of ROS signaling [45]. Under heavy metal stress, the activities of both POD and SOD increased due to the overexpression of ThbZIP1 in tobacco [46]. WRKY transcription factors provide defense against various stresses, including heavy metals [47]. ZmWRKY4 was reported to regulate the expression of SOD and APX in response to Cd stress in maize [48].
Chromera velia is a unicellular alveolate alga living in an association with stony corals in Australia [49,50]. Together with the other chromerid Vitrella brassicaformis, C. velia represents the closest known phototrophic relatives to apicomplexan parasites, branching together with predatory colpodellids at the root of the parasitic Apicomplexa [51]. Chromerids possess a unique photosynthetic apparatus, which seems to be well adapted to high photosynthesis-related oxidative stress [52,53,54]. Photosystem I (PSI) of C. velia non-canonically contains two permanently attached SOD molecules and several protein subunits with no sequence homology to known function [55]. Such organization of photosystems could provide a framework for the efficient and adaptable photosynthesis observed in C. velia [52,55].
This study aims to unravel the physiological responses of the marine protist C. velia to toxic Hg2+ exposure. Due to the double role of C. velia as a model for the study of apicomplexan parasites and microalgae, the knowledge acquired by this study might be of interest for both environmental and medical purposes. We tackled the response with a physiological, biochemical, and transcriptomic approach, to identify the molecular mechanism of the stress response in C. velia. RNA-Seq is an efficient technology for transcriptomics studies [56]. In recent years, RNA-seq has proven useful for the identification of functionally related genes and their expression patterns in algal species responding to abiotic stress [57,58,59,60].
In this study we: (i) Characterize the physiological response of C. velia cultures to different concentrations of Hg2+, over time, assessing the toxicity effects and modulation of different ROS and RNS species; (ii) present the first deep transcriptome analyses for C. velia; (iii) identify differentially expressed genes (DEGs); (iv) investigate the molecular regulatory network of detoxification systems in C. velia; and (v) identify TFs involved in response to Hg exposure. This work provides a basic knowledge of the mechanisms used by Chromera to cope with heavy metal toxicity.

2. Materials and Methods

2.1. Chromera velia Culture and Treatment

C. velia was cultivated in F2 medium [49] made with fresh seawater collected in Sicily, Italy, filtered through Miracloth and pasteurized at 80 °C for 7 h. Minerals and vitamins were added at double concentration, compared to the original recipe. Cells were kept at 25 °C in polypropylene flasks under artificial light (30–50 μmol PAR/m2/s) with a day/night photoperiod 16 h/8 h. Subculturing was scheduled every two weeks, when cells were in the mid-exponential growth phase (Supplementary Figure S1) at approximately 6.5 × 10⁷ cells/mL, by diluting 30 mL of inoculum in 300 mL fresh medium.
For ROS, RNS, cell viability, and chlorophyll measurements, cells were treated 10 days after subculturing, by adding 0, 0.3, 0.9, and 3 mL of a 10 mM HgCl2 stock solution to 300 mL cultures, to yield 0, 10, 30, and 100 µM final concentrations, respectively. Measurements were performed 3, 6, 24, 48, and 72 h after treatment. Depending on the experiment, we performed three or four experimental rounds. In each experimental round, each treatment was run in three independent replicates. t-test was performed on all the analyses, and significant differences were scored for p < 0.05.
For the transcriptomic analysis, 300 mL of 10 day-old cultures were treated with either 0.9 mL HgCl2 (30 µM final concentration) or an equal amount of pure water (mock) for 6 h. Cells were then harvested by filtration, weighted, and immediately frozen in liquid nitrogen until RNA extraction. The experiment was run in triplicate (three treated samples, three mock-controls).

2.2. Cell Count and Chlorophyll Quantification

To measure cell growth, we counted the cells present in the culture at a binocular microscope (200×) with the aid of a Burker slide chamber. Values are reported as the mean of 12 squares.
For chlorophyll quantification, we measured chlorophyll a, the only chlorophyll present in C. velia [54]. We followed the protocol described in [61], with some modifications. Briefly, 10 mL culture was centrifuged at 2000 rcf for 2 min to collect the cells in the bottom of a plastic tube. Cells were suspended in 1.5 mL of absolute ethanol in a plastic microtube and ground using a mortar and pestle with 100 mg of sand. Chlorophyll was then extracted by incubating the samples at 60 °C for 30 min in agitation (150 rpm). Quantification was performed in the Synergy H1 reader (Biotek, Winooski, VT, USA) by reading absorbance at 649 and 645 nm, and by applying the formula: Chlorophyll a (µg/mL) = 13.7 A665 − 5.76 A649 [62].

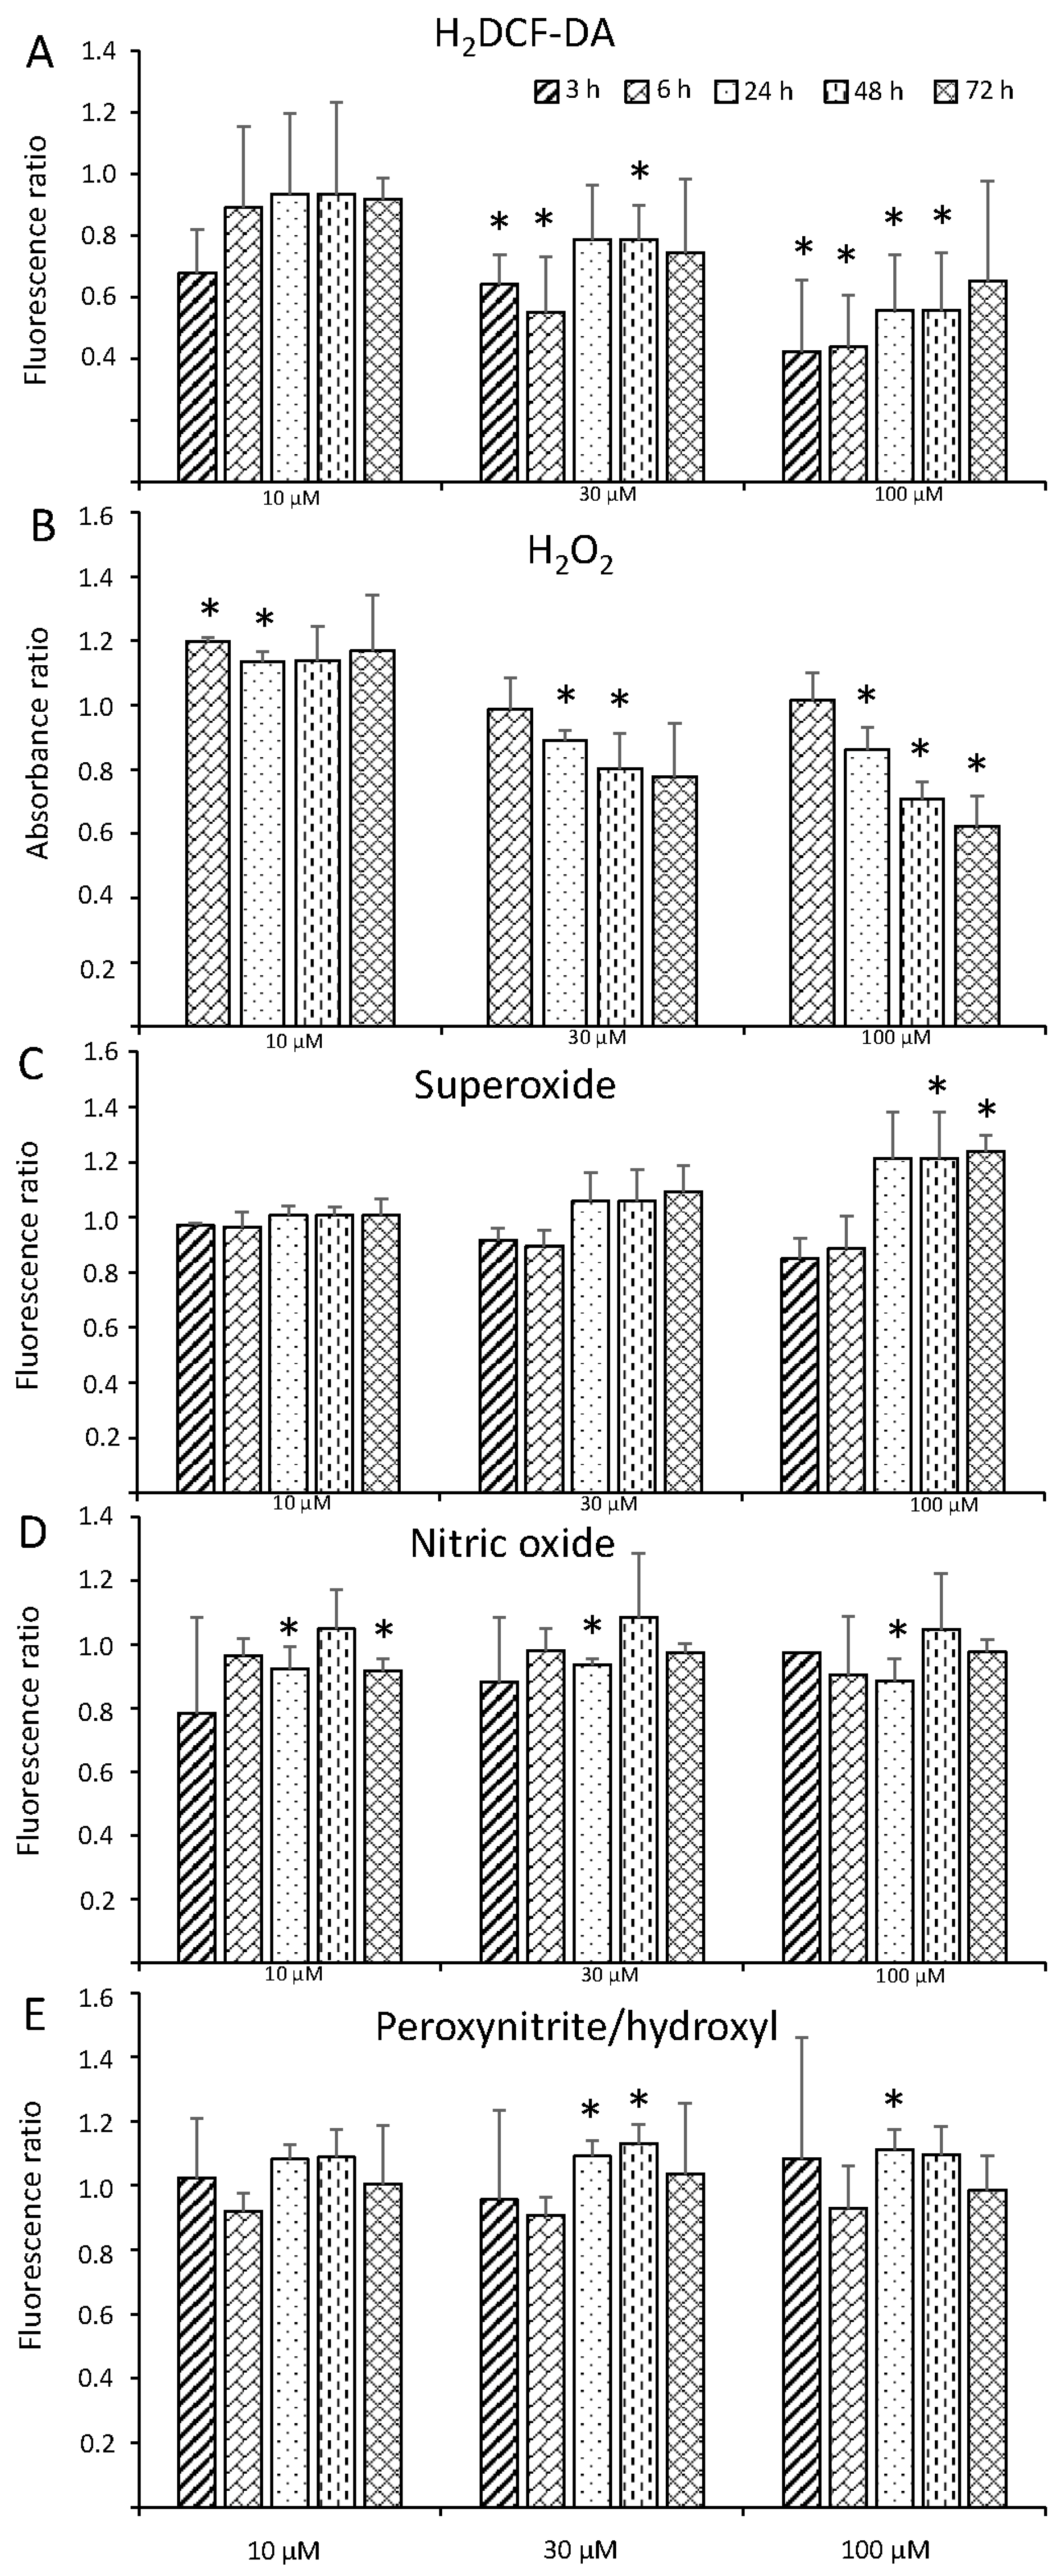
2.3. ROS and RNS Quantification

ROS and RNS were quantified by fluorimetric analysis using specific fluorescent dyes. In particular, 2,7-dichlorodihydrofluorescein diacetate (H2DCF-DA) is an intracellular marker that becomes fluorescent when oxidized [63]; dihydroethidium (DHE) is a specific marker for the superoxide anion (·O2−) [64]; 4-Amino-5-methylamino-2′,7′-difluorofluorescein diacetate (DAF-FM-DA) is an intracellular specific marker for nitric oxide (NO) [65]; Aminophenyl fluorescein (APF) is a marker for peroxynitrite (ONOO) and hydroxyl radical (⋅OH), since the dye is unable to discriminate between the two molecules [66]. Dyes were dissolved in DMSO to a stock concentration of 10 mM (H2DCF-DA, DHE, APF) or 5 mM (DAF-FM-DA). All dyes were from Cayman Chemicals, USA. Two mL of culture was deposited in a well in a transparent 12-well polypropylene plate (Greiner Frickenhausen, Germany) and brought to pH 7.5 by adding 20 µL 10 mM Tris buffer (final concentration 100 µM). Then, 2 µL of dye was added to the culture, with final dye concentration of 10 µM (H2DCF-DA, DHE, APF) or 5 µM (DAF-FM-DA). Plates were incubated, in the dark, at 25 °C for 30 min on agitation (100 rpm). Fluorescence was then measured at a Synergy H1 reader (Biotek, USA) with a bottom reader mode and gain set to 80 (H2DCF-DA and APF) or 100 (DHE and DAF-FM-DA) and bandwidth of 9 nm. Due to the possible formation of cell clumps, which could affect the homogeneity of the fluorescence readout, the measurement was made in 21 different points on the well surface and averaged (“area scan” mode). Excitation and emission wavelengths for each dye were 495/525 Ex/Em for H2DCF-DA; 495/515 Ex/Em for DAF-FM-DA and APF; for DHE, we used 405/570 nm Ex/Em instead of the commonly used 480/580 nm Ex/Em because the former setup was proved to be more selective in detecting O2−, rather than the unspecific oxidized byproduct 2-OH-ethidium [64].
For extracellular H2O2 quantification, we used the xylenol orange protocol described in [67], with some modifications. Briefly, 2 mL of culture were filtered through a chromatographic column (Poly-Prep; Bio-Rad, Hercules, CA, USA) to separate cells from the growth medium. An aliquot of 500 µL of the flow through was added to an equal volume of assay reagent (500 mM ferrous ammonium sulfate, 50 mM H2SO4, 200 mM xylenol orange, and 200 mM sorbitol) and incubated for 45 min in the dark. The H2O2-mediated oxidation of Fe2+ to Fe3+ was determined by measuring the A560 of the Fe3+-xylenol orange complex. All reactions were carried out at least in duplicate, and their reproducibility was checked.

2.4. RNA Isolation, cDNA Library Construction, and Sequencing

TRI Reagent (Sigma-Aldrich, St. Louis, MO, USA) was used to extract total RNA from the six individual samples. Approximately 1.5 μg of the extracted RNA was used for complementary DNA (cDNA) library construction and subsequent Illumina sequencing. The six cDNA libraries (Cvel_cont1, Cvel_cont2, Cvel_cont3, Cvel_mer1, Cvel_mer2, and Cvel_mer3) were generated using NEBNext UltraTM RNA Library Prep Kit for Illumina (NEB, USA) following the manufacturer’s instructions [68]: (i) Poly-T oligo-attached magnetic beads were used to purify mRNA; (ii) fragmentation was carried out under high temperature in NEBNext; (iii) M-MuLV Reverse Transcriptase (RNase H −) was used to synthesize first strand cDNA using random hexamer primer.; (iv) the cDNA fragments were isolated and purified with AMPure XP system (Beckman Coulter, Beverly, USA) after synthesis second cDNA strand and adaptor ligation; (v) then, the final cDNA library was created based on PCR amplification, and library quality was assessed on the Agilent Bioanalyzer 2100 system (Santa Clara, CA, USA). The resulting per cDNA library was sequenced using the Illumina NextSeq 550 platform (San Diego, CA, USA) following the manufacturer’s recommendations at the Central European Institute of Technology of Masaryk University (Brno, Czech Republic).

2.5. Transcriptome Analysis

The RNA-Seq reads were assembled as previously described [68,69]. The assembled unigenes were annotated by BLAST search against protein databases, including NCBI non-redundant protein, Protein family (Pfam), Swiss-Prot, Protein sequence analysis and classification (InterPro), Kyoto Encyclopedia of Genes and Genomes (KEGG), and Gene Ontology (GO) with an E-value cutoff of 10−5. The best-aligning results from Nr, InterPro, and Swiss-Prot databases were selected as coding region sequences of unigenes. If the results from two databases conflicted with each other, a priority order of Nr and Swiss-Prot was considered. Meanwhile, Trinotate was used to archive all functional annotation data derived from the analysis of transcripts and integrate them into an SQLite database [70]. Also, the GO functional annotation of unigenes was gained using an in-house script, and GO functional classification was obtained to classify the possible functions of the unigenes based on Nr annotations using REViGO [71].

2.6. Quantification of Gene Expression Levels

RSEM software package was used to estimate the gene expression levels [72] for each sample: (i) The clean reads mapped to the de novo reference assembled transcriptome; (ii) the reads count was obtained for each gene; (iii) the gene expression level was normalized to FPKM (fragments per kilobase of transcript per millions fragments) based on the number of reads count. Differential expression analysis of the control and Hg-treated samples was performed using the edgaR R package (3.24.3) [73]. The threshold for differential expression was adjusted to p-value < 10−3 using the Benjamini–Hochberg method.

2.7. Molecular Phylogeny

Our assembled unigene was searched for selected detoxification-related enzymes (heme oxygenase (HO), superoxide dismutase (SOD), NADPH-cytochrome P450 reductase (P450R), Cytochrome P450 (CYP), and Catalase-peroxidase (katG)) by deltaBLAST [74]; also, the genome of C. velia [75] was searched through the Cryptosporidium Genomics database (CryptoDB) [76] using previously characterized amino acid sequences from eukaryotes, bacteria, and archaea as queries. To assess support for our chosen gene models, we checked whether the 5′-end of the gene model was transcribed by performing BLAST against the identified RNA-Seq contigs in C. velia CCMP2878 transcriptome in normal culture conditions RNA-Seq datasets [75]. We predicted all potential N-termini and targeting tags of C. velia and its close relative species V. brassicaformis detoxification-related enzymes: (Heme oxygenase (HO); superoxide dismutase (SOD); NADPH-cytochrome P450 reductase (P450R); Cytochrome P450 (CYP); and Catalase-peroxidase (katG)) by SignalP 3.0 [77], SignalP 4.1 [78], ASAFind [79], TargetP 1.1 [80], iPSORT [81], WoLF PSORT [82], Mitoprot [83], and the eukaryotic protein subcellular localization predictor (DeepLoc-1.0) [84] (Supplementary Table S1).
Amino acid sequences of all five detoxification-related enzymes: (Heme oxygenase (HO); Superoxide dismutase (SOD); NADPH-cytochrome P450 reductase (P450R); Cytochrome P450 (CYP); and Catalase-peroxidase (katG)) from V. brassicaformis were retrieved from the Cryptosporidium Genomics database [76], whereas plants, green and red algae, alveolates (apicomplexans and ciliates), stramenopiles (oomycetes and diatom), metazoans, fungi, kinetoplastids, amoebozoans, parabasalids, and diplomonads sequences were downloaded from NCBI GeneBank and specialized databases. We also considered the available bacteria and viruses amino acid sequences in NCBI GeneBank, with particular emphasis placed on those prokaryotes that could serve as a donor of genes transferred during endosymbiotic events, such as cyanobacteria (sharing an ancestor with chloroplasts) and α-proteobacteria (sharing a common ancestor with mitochondria). Sequences were aligned using MAFFT version 7 software [85]. Ambiguously aligned sequences and gaps were excluded for further analysis. Alignments were tested using Prottest [86] to choose the appropriate model for amino acid substitution. Maximum likelihood method using RAxML [87] and IQ-TREE v1.6.10 [88] were used to construct phylogenetic trees.

2.8. RT-qPCR Analysis

The quantitative reverse transcription PCR (RT-qPCR) analysis was performed using three biological and three technical replicates of total RNA. First strand cDNA fragments were synthesized using the SuperScript IV RT (Invitrogen, Carlsbad, CA, USA). RT-qPCR was performed on the LightCycler 480 system (F. Hoffmann-La Roche Ltd., Basel, Switzerland) using a TP SYBR 2× Master Mix (Top-Bio, Prague, Czech Republic) in 25 μl reaction mixtures. The PCR reaction protocol was 94 °C for 10 min, 55 cycles of 94 °C for 10 s, 60 °C for 10 s, and 72 °C for 10 s. The fluorescence was measured via a 65–95 °C melting curve. The specific primers for RT-qPCR were designed using Geneious prime software [89] (Supplementary Table S2A). The relative expression level of the selected genes using the Actin gene as the internal control gene was calculated using ratio = 2 −ΔΔCT.

2.9. Data Deposition

The six datasets of RNA-sequencing are available at the NCBI Short Read Archive (SRA) with the GenBank accession No.: PRJNA529782. The database archives all functional annotation data derived from the analysis was deposited into Mendeley Data with DOI: 10.17632/pkn2f6dzt3.1.

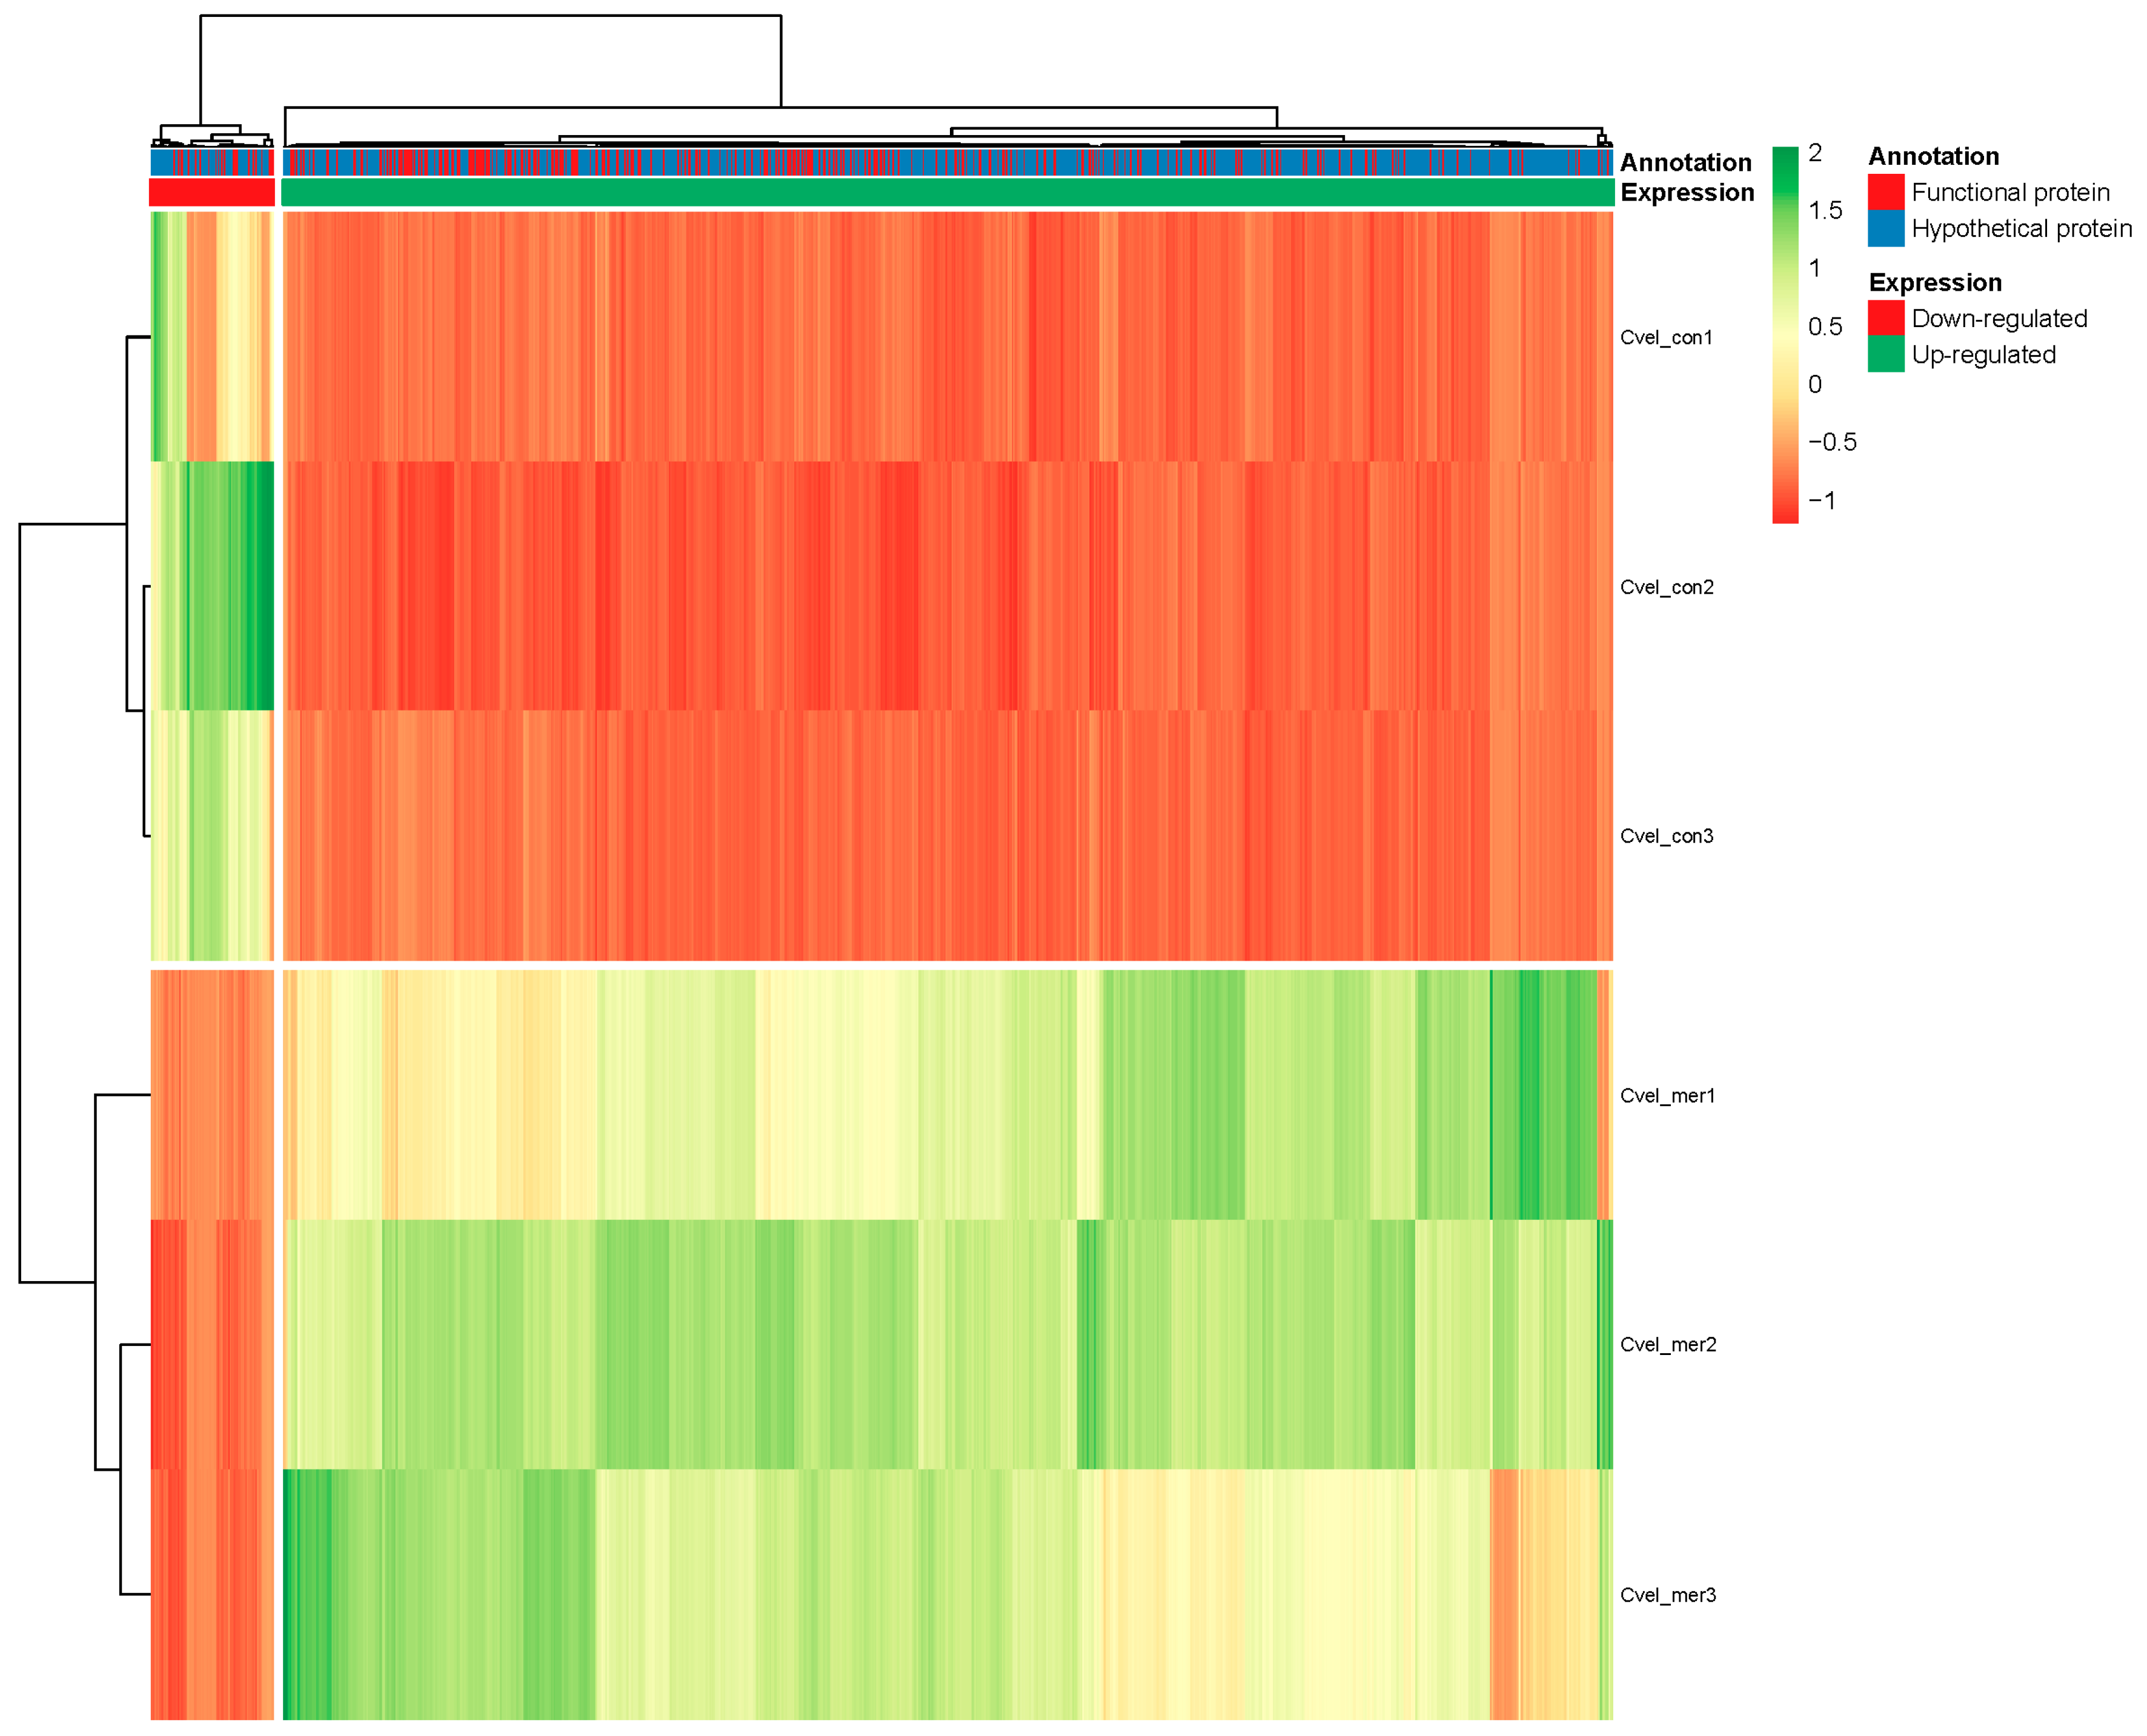
3. Results and Discussions

3.1. Mercury Toxicity

In conditions of nutrient starvation, C. velia, like many other microorganisms, enters in a dormant state, and it is less susceptible to environmental triggers [50]. Since the aim of this study was to study the physiological responses to Hg2+, we first characterized the growth curve of C. velia culture in our experimental conditions, to determine the best time for treatments. After subculturing, the culture experienced about three days of the initial lag phase (Supplementary Figure S1). By approximately day four, it entered into the exponential growth phase, that lasted for about two weeks. After that, if not subcultured, nutrients were depleted, and the culture rested in a stationary phase. In our previous experience with plant cell cultures and cadmium, we observed that treatments in the 50–150 µM range were able to trigger physiological responses and eventually cell death [20]. Therefore, for initial screening, we selected similar range of HgCl2 concentrations (10, 30, 100 µM) and times of treatment (from 3 to 72 h) to study the physiological response of C. velia under different acute stress conditions, and to select the best condition for subsequent transcriptomic analysis. First, we measured cell growth and chlorophyll content, as indicators of Hg toxicity. Treatment with 10 µM Hg2+ did not affect cell growth (Figure 1A). At 30 µM and 100 µM treatment, we observed a dose-dependent reduction in cell number, although not statistically significant with p > 0.5 in all cases. The modest effect in cell growth was not surprising, considering the slow growth of C. velia cultures during the three days of treatment (Supplementary Figure S1, Figure 1A control).
Conversely, chlorophyll content showed a marked reduction when cultures were treated with Hg2+, in a dose-dependent fashion (Figure 1B). In untreated cultures, chlorophyll content increased slightly over time, a result in agreement with the higher number of cells counted in the same time frame. In cultures treated with 30 and 100 µM Hg2+, chlorophyll content was sharply reduced in all time points, indicating a toxic effect of Hg2+ at these concentrations and time points of treatment. A similar effect of high Hg2+ concentrations on chlorophyll content had been observed on the microalgae Coccomyxa subellipsoidea [26] and Chlamydomonas reinhardtii [8,90], and on cucumber cotyledons [91], confirming that Hg2+ is toxic for plants and algae at high concentrations.

3.2. ROS and RNS Response

Since it is well known that treatment with heavy metals, such as cadmium, often triggers ROS and RNS production, which is causally linked to toxicity [20], we wondered whether C. velia cultures treated with Hg2+ similarly experienced oxidative and nitrosative bursts. We then measured the general level of intracellular oxidative stress, as reported by H2DCF-DA, and quantified the production of specific ROS and RNS compounds, namely extracellular hydrogen peroxide (H2O2), superoxide (O2−), nitric oxide (NO), and peroxynitrite and/or hydroxyl radical (ONOO/⋅OH). Being ROS and RNS signaling molecules, as well as downstream events during cell death, we extended our analysis from 3 to 72 h. Surprisingly, we observed that the intracellular oxidative environment, measured as H2DCF-DA fluorescence, decreased when cultures were treated with high concentrations of Hg2+ (30 and 100 µM) already within few hours after treatment (Figure 2A). A similar pattern was observed when extracellular H2O2 was measured (Figure 2B). H2O2 decreased at high concentrations of Hg2+. However, it significantly increased shortly after treatment with the lowest concentration (10 µM, 3 h, and 6 h). The decrease in H2DCF-DA fluorescence after exposure to high Hg2+ concentrations had been already observed in other studies. In particular, the oxidative burst following treatment of Medicago sativa root cells with 30 µM Hg2+ was modest and transient, occurring within the first hour of treatment [23]. At later times, H2DCF-DA fluorescence was markedly lower than untreated cells [22], a situation that reflects what we observed in C. velia. Similarly, another study observed decreased H2O2 levels 24 h after treatment of M. sativa roots with high (40 µM) Hg2+ concentration [24]. Leaves showed increased H2O2 production [24]. A different pattern in H2O2 production was also observed for two fern species under the same experimental conditions [21], suggesting that the molecular events triggered by Hg2+ exposure are not universal for any species and cell type.
Differently from what observed for H2O2, O2− levels increased when cells were treated with high concentrations of Hg2+, especially 100 µM (Figure 2C). O2− production appeared to be a late event since, within the first day of treatment, levels were similar to control. A late (24 h) O2− induction had also been shown in M. Sativa leaves incubated with Hg2+ [24] confirming that C. velia responses are similar to higher plant systems.
NO production did not change dramatically after Hg2+ exposure, though it was significantly lower at 24 h for all treatments, and at a later time for 10 µM (Figure 2D). A decrease in NO after Hg2+ treatment was observed also for the microalgae C. subellipsoidea [26]. Interestingly, NO was produced massively in Arabidopsis cells treated with another heavy metal, cadmium. Moreover, NO preceded and was required for subsequent H2O2 production and programmed cell death induction [20]. The mechanism of toxicity triggered by mercury and cadmium likely follow different pathways.
Finally, we used the dye APF to quantify ONOO and/or ⋅OH, since the marker is unable to discriminate between the two reactive molecules. Also, in this case, fluorescence did not vary much among treatments, although it slightly increased at 24–48 h for 30 and 100 µM treatments (Figure 2E). ONOO forms by reaction of NO with O2−. Since NO levels did not vary during treatment, it was not surprising that ONOO levels were likewise stable.
Due to the limited, nonsignificant effect of treatment with Hg2+ at the lowest concentration (10 µM) on chlorophyll content and most of ROS/RNS production, we decided to use 30 µM as the best treatment condition for subsequent transcriptomic analyses. However, to focus on the early signaling event, and to avoid late toxicity effects, we collected cells early, 6 h after treatment.

3.3. Sequencing Output and Assembly

RNA samples from C. velia cultures treated for 6 h with 30 µM Hg2+ and controls were used for Illumina Genome Analyzer deep sequencing. Approximately 165 and 148 million raw reads were generated for control (Cvel_cont) and Hg2+-treated (Cvel_mer) cultures, respectively. After cleaning, read numbers reduced to 162 and 145 million, respectively. In total, we generated 313 million raw reads and 307 million cleans (Table 1). Among all the clean reads, more than 95% had Phred-like quality scores at the Q20 level (an error probability of 1%). The three sets of clean reads per treatment were de novo assembled into one de novo reference transcriptome with the “Trinity” program. After assembly, the six sets of clean reads were mapped to the reference transcriptome. Approximately 134 million (Cvel_cont) and 126.5 million (Cvel_mer) reads were mapped to the reference transcriptome, which accounted for 52.51% and 87.02% of the total clean reads for Cvel_cont and Cvel_mer cultures, respectively (Table 1).

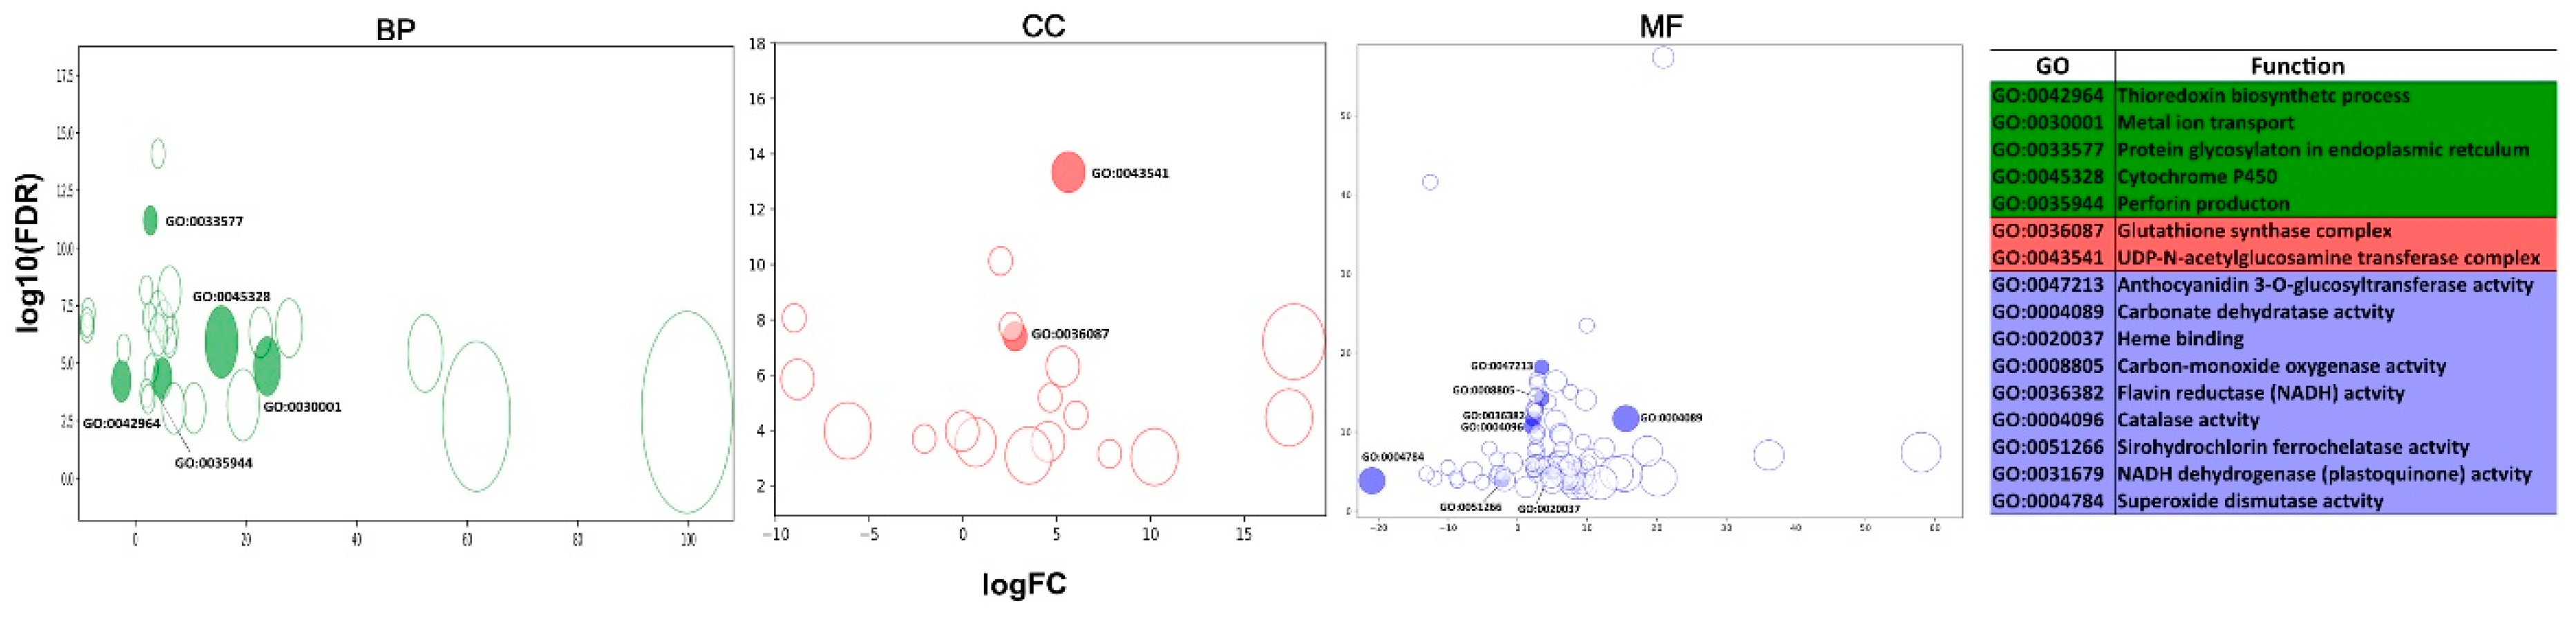
3.4. Functional Annotation

The NCBI non-redundant (NR) database was searched using all the assembled unigenes using BLASTX tool with a cut-off E-value of 10−5 [68]. In addition, all unigenes were annotated by aligning with the other five public databases, including Protein family (Pfam), Cryptosporidium Genomics database (CryptoDB), a manually annotated and reviewed protein sequence database (Swiss-Prot), Protein sequence analysis and classification (InterPro), and Gene Ontology (GO) databases with a cut-off E-value of 10−5. Analyses showed that 52,404 and 52,388 unigenes (58.32% and 58.3% of all unigenes) were annotated in the CryptoDB and InterPro databases, respectively, while only 11,173 unigenes (12.43% of all unigenes) were annotated in the Nr database due to the absence of genome and EST information for C. velia. Furthermore, 16,625 unigenes (18.5% of all unigenes) were annotated in Swiss-Prot database; 3456 (3.85% of all unigenes) unigenes were annotated in the Pfam, and 1005 (1.12%) were annotated in GO databases (Table 2). Unigenes amino acid sequences were also searched for transmembrane helices using TMHMM [92] and signal peptide using SignalP v4.0 [78]. Out of total 89,853 unigenes, 1461 (1.62%) were predicted as transmembrane proteins while 1055 (1.17%) contained signal peptide pre-sequence (Table 2). Of the 89,853 unigenes, 68,713 (76.47%) returned at least one match at the E-value < 10−5 (Table 2).

3.5. Differential Expression Analysis

The read counts for unigenes were quantified based on RPKM (reads per kilobase per million) normalized matrix, to facilitate the comparison of mRNA levels. Differentially expressed genes (DEGs) (p-value < 0.001 and log2 (fold change) >2) were defined as genes that were significantly enriched or depleted in Hg2+-treated cultures compared to control (Supplementary Table S2B). Based on the six sample’s log10RPKM, hierarchical clustering of the DEGs was performed to observe the overall gene expression pattern. The green bands represent the up-regulated genes, while the red bands identify down-regulated genes (Figure 3). Two groups of DEGs with specific expression patterns were outlined from the clustering. In total, 1239 DEGs were found. Hg2+-treatment resulted in up-regulation of 1070 DEGs and down-regulation of only 169 DEGs (Figure 3 and Supplementary Table S2B).
Based on sequence homology, 339 (27.36%) DEGs were annotated while the remaining 900 DEGs (72.64%) were hypothetical proteins (Figure 3 and Supplementary Table S2B). REVIOGO was used to classify and summarize the annotated DEGs (339) based on their Gene Ontology (GO) term [71]. Among these groups, the biological process (BP) category included proteins related to ‘cellular process’ (14), ‘metabolic process’ (10), and ‘single-organism process’ (4). The cellular component (CC) category comprised proteins involved in ‘cell part’ (14) and ‘organelle’ (5). Within the molecular function (MF) category, ‘binding’ (30), ‘catalytic activity’ (55), and ‘transporter activity’ (3) were represented (Figure 4).

3.6. Hg Exposure

3.6.1. ROS-Antioxidant Defense System Related Genes

Mercury tolerance of algae and its association with the different detoxification defense systems was reported [44,93,94]. C. velia is one of the most remarkable endosymbiotic algae, which showed a strong ability to survive in a wide range of environmental conditions [54,95,96]. However, little is known about the molecular mechanisms of heavy metal tolerance in C. velia.
Based on deep sequencing of the six cDNA libraries and the GO analysis, a total of 145 ROS-related unigenes were identified (Supplementary Table S3A). Among them, 117 (80.7%) unigenes were shared by all six libraries, and 12 unigenes were specifically expressed in a single library (Cvel_cont2). Additionally, two unigenes (DN73858_c0_g1 and DN85649_c0_g1, encoding for Kynurenine 3-monooxygenase and indole-3-acetic acid amido synthetase, respectively) were only expressed in control cultures (Supplementary Table S3A). Based on the unigenes FPKM values, the expressions of 145 ROS-related genes in control and Hg2+-treated cultures were summarized in Supplementary Table S3A and Figure 4. Of them, 125 unigenes (86.2%) showed similar expression patterns in cultures under Hg2+ treatment (Cvel_mer) compared to controls (Cvel_cont), while 20 unigenes showed differential expression (DE) patterns (16 up- and four down-regulated) (Figure 4).
Many studies show that Hg2+ treatment modulates the production of ROS e.g., O2−, H2O2, and OH [44,97,98], and ROS scavenging mechanisms, including the water–water cycle, glutathione–ascorbate (AsA-GSH) cycle, peroxidase (POD), glutathione peroxidase (GPX), and peroxiredoxin/thioredoxin (PrxR/Trx) pathways [14,99,100,101]. The water–water cycle (O2−–H2O2–H2O), mainly involves SOD, catalase peroxidase (KatG), and Prx, which sequentially convert the superoxide anion (O2−) to hydrogen peroxide (H2O2) and subsequently hydrogen peroxide to water [99,102]. In contrast, thioredoxins and glutaredoxins enzymes repair protein disulfides and glutathione-protein mix disulfides [103].
Superoxide dismutases (SOD) catalyze the disproportionation of O2− to O2 and H2O2 as the first defense line of the cell against ROS [104]. Since ·O2− is a precursor of several other highly reactive species, control of this free radical concentration by SOD constitutes an essential protective mechanism [105]. The SOD genes isoform FeSOD found has been reported from only a few microalgae [106]. Moreover, the activation of specific SOD isoforms can serve as a biomarker for cells that contains a high level of·O2− due stress response [107,108]. Subsequently, the enzyme catalase (CAT) catalyzes the production of H2O from H2O2, while ascorbate peroxidase (APX) reduces peroxides (H2O2 and organic hydroperoxides) to H2O or the corresponding alcohols, respectively, using ascorbate as an electron donor [44,109]. Catalase Peroxidase (KatG) is a dual catalytic activity enzyme, acting both as catalase and as a peroxidase. Evolutionarily, KatG contains two peroxidase-like domains, an N- and a C-terminal domain. Its C-terminal domain has no known catalytic activity [110]. KatG probably evolved by the fusion of two copies of a rudimentary peroxidase gene (which probably also gave rise to the ascorbate and cytochrome c peroxidases) [111]. KatG sequences are present in the genomes of Archaea, Bacteria, and some protists [112]; its C-terminal domain has no known catalytic activity [110]. Even though it shares the same EC number with monofunctional CATs, they have no sequence similarity, which suggests their different evolutionary origins [113].
Four SOD genes found in this study had been previously annotated in the C. velia genome, with two being MnSODs, and two plastid FeSODs (SOD1/2) [55] (Supplementary Table S1). Seven V. brassicaformis SOD loci were identified, three of them being MnSODs, and four FeSODs. Interestingly, we identified two plastids KatG in C. velia but none in V. brassicaformis nor other protists (Apicomplexa, Diplomonadida, and Parabasalidea). Possibly, their absence is compensated by other peroxidase class I enzymes (cytochrome c peroxidase (CcP) and ascorbate peroxidase (APx)) [112] (Supplementary Table S1). In this study, FeSOD (DN97564_c1_g1 and DN110975_c0_g1) and MnSOD (DN100508_c0_g1) were down-regulated by Hg2+ in C. velia (Supplementary Table S3A). Another unigene encoding MnSOD (DN109194_c0_g1) was unaffected by Hg. Both FeSOD and MnSOD showed lower expression levels in Hg2+-exposed cultures of C. velia than those of control cultures (Supplementary Table S3A and Figure 4). This result is in agreement with the highest ·O2− production observed when cultures were treated with high concentrations of Hg2+ (Figure 2C). The gene for another water–water cycle enzyme, catalase-peroxidase (katG) (DN112103_c0_g1) was up-regulated while the other katG unigene (DN79540_c0_g1) was unaffected (Supplementary Table S3A, and Figure 4). Again, these results are in agreement with the observed ROS production, since H2O2 levels decrease after Hg2+ treatment (Supplementary Table S3A,B), probably as a result of the increased H2O2 scavenging capacity. The unigene encoding FER3 (DN112480_c0_g3) was not affected by Hg (Supplementary Table S3A). Ferritin (FER) is an iron-storage protein, has been reported to seize Fe2+, and to prevent the formation of ·OH [18,114,115]; its overexpression improved abiotic stress tolerance [115,116]. In our experimental system, we did not observe variation in ·OH levels following Hg2+ treatment (Figure 2E), a trend that correlates with the unchanged expression of its gene. Other ROS-related genes were identified in this study, although we do not have enough biochemical data to correlate their expression to ROS modulation. Glutathionylation-related enzymes (thioredoxin), encoded by unigene (DN107579_c0_g1) and other redox-related enzymes (flavin reductase (NADH), NADH dehydrogenase (plastoquinone), and kynurenine 3-monooxygenase) encoded by unigenes DN94003_c0_g1, DN99597_c0_g1, and DN7632_c0_g1, respectively, were up-regulated (Supplementary Table S3A and Figure 4).

3.6.2. Xenobiotics Detoxification-Related Genes

A total of 126 of xenobiotics metabolism-related unigenes were identified in C. velia (Supplementary Table S3B). Only six unigenes were specifically expressed in a single library (Cvel_cont2) while all six libraries shared 120 (95.2%) unigenes. Based on the unigenes FPKM values, the expressions of 126 xenobiotics metabolism-related gene in control and Hg2+-treated cultures were summarized in Supplementary Table S3B and Figure 4. Of them, 111 unigenes (88.1%) did not change expression, while 15 showed different expression patterns (14 up- and only one down-regulated by Hg2+) (Figure 4).
Ten classes of cytochrome P450 systems (CYPs) have currently been assigned [117]. Mixed-function oxidases (MFO) class II includes most eukaryote CYPs localized to the endoplasmic reticulum and some other membranes via an N-terminal anchor and associated with a separate NADPH-cytochrome P450 reductase (P450R). The cytochrome b5 system is attributed to this activity [117,118,119]. Also, CYPs show protein–protein interactions with other CYPs to form homomeric and heteromeric complexes; these complexes can often have significant effects on CYP-mediated oxidation of substrates [120]. The analysis of the functional consequences of CYP−CYP homomeric interactions found that the complex model fits best to either a quaternary (CYP−P450R−CYP−P450R), trimeric (CYP−CYP−P450R), or dimeric (CYP−CYP) complex model, where only the binary (CYP−P450R) complex was active [120,121]. Some xenobiotic compounds are metabolized directly by phase II enzyme systems (e.g., glutathione S-transferases (GSTs) and UDP-glucoronyl transferases (UDPGTs) [37], while others are metabolized prior by the action of phase I enzymes. No evidence for either CYPs complexes or multixenobiotic resistance (MXR) presence exists in phytoplankton or macroalgae.
Genes encoding for biotransformation phase-I-related enzymes, including mixed-function oxidases (MFO) class II CYP (cytochrome P450 (CYP), cytochrome P450 reductase (P450R), and cytochrome b5 (Cyt b)) system, were identified in this study. One P450R unigene (DN11036_c0_g1) identified in our transcriptome analysis of C. velia (Supplementary Table S3B) had been previously annotated (Cvel_14639) [75]. Other CYP system-related enzymes were identified; 19 and 16 unigenes encoded for CYP and Cytb, respectively. Interestingly, six unigenes encoded for the binary homomeric (CYP−P450R) complex (Supplementary Table S3B). Similar to what we found in C. velia, the relative species V. brassicaformis has only one ER-P450R (Supplementary Table S1) and 19 CYP enzymes [75]. Phase-II-related enzymes (aldose reductase, glutathione S-transferase, and UDP-glucuronosyltransferase) were also identified in our study. Twenty and nine unigenes encoded for glutathione S-transferase and UDP-glucuronosyltransferase, respectively (Supplementary Table S3B). We also found two different multixenobiotic resistance (MXR) transporters (MATE and ABC transporters), phase-III-related enzymes (Supplementary Table S3B). This result is especially surprising since MXR had never been described in algae before. Chloroplastid MATE efflux protein and toxin extrusion protein were encoded by six unigenes each, while the ABC transporter was encoded by four unigenes (Supplementary Table S3B). The diversity within the ABC transporter protein family, including chromerids, has been discussed before [122], while here we report the first identification of MATE transporters in chromerids. Xenobiotics detoxification systems showed different expression patterns (Supplementary Table S3B). Genes for the phase I enzymes (CYP, Cyt b, and bifunctional P-450/NADPH-P450 reductase) were up-regulated, highlighting the importance of the CYP homomeric complex (bifunctional P-450/NADPH-P450 reductase) in C. velia xenobiotics metabolism; while both up-regulation (aldose reductase and UDP-glucuronosyltransferase) and down-regulation (glutathione S-transferase) patterns were found for phase II enzymes. MXR transporters-related unigenes did not change expression after Hg2+ treatment (Supplementary Table S3B).

3.6.3. Heavy-Metal Stress Biomarkers

Fifty-seven heavy-metal stress biomarkers unigenes were identified in C. velia (Supplementary Table S3C). Forty-five unigenes (78.9%) were shared by all six libraries, and 12 unigenes were specifically expressed in a single library (Cvel_cont2) (Table S3C). According to the unigenes’ FPKM values, the expressions of the identified biomarkers did not change in 40 unigenes (88.9%), and only five were up-regulated (Figure 4).
Heme oxygenase (HO), glutathione synthase (GS), glyoxalase (GLY), and stress proteins (or heat shock proteins (HSPs)) are all involved in Hg2+ response [44,123,124,125,126]. Our transcriptomic analyses identified one unigene for chloroplastic HO (DN93254_c0_g1), three for GS and GLY each, and 50 for HSP (Table S3C). The differential expansion analysis showed that only one GS unigene (DN110990_c0_g1) and four HSP70 kDa (DN113480_c11_g1, DN20133_c0_g1, DN113480_c11_g1, and DN113480_c14_g1) were up-regulated after Hg2+ treatment, while the rest of the unigenes were unaffected (Figure 4 and Supplementary Table S3C). The observed increase in GS transcript was especially interesting, since glutathione is the substrate for the synthesis of phytochelatins, the major mechanism for heavy metal chelation and detoxification in plants [127]; hence, it makes sense that C. velia responded to exposure to Hg2+ by inducing its main detoxification system.

3.6.4. Phylogenetic Analyses

To provide a phylogenetic framework for interpreting our results, we constructed individual alignments for 236 FeSODs and 357 MnSODs proteins and concatenated these into a single alignment for phylogenetic analysis. Three V. brassicaformis MnSODs (Vbra_1709, Vbra_19404, and Vbra_9701), cluster with green algae and are closely related to other stramenopiles, confirming their origin in the eukaryotic nucleus. The same applies to two sequences for MnSOD of C. velia (Cvel_4244 and Cvel_26697) (Supplementary Figure S2). The rest of the chromerid FeSODs cluster within all eukaryote FeSODs, suggesting their origins in a eukaryotic nucleus. C. velia (Cvel_3019) and V. brassicaformis FeSODs sequences (Vbra_13639, Vbra_10461, and Vbra_9665) formed a sister group together with apicomplexans, while plastid C. velia (Cvel_7136) and mitochondrion V. brassicaformis (Vbra_23058) FeSODs sequences formed a sister group together with kinetoplastids and amoebozoan Entamoeba dispar, respectively. MnSODs and FeSODs showed two disconnected branches, in agreement with previous studies [55] (Supplementary Figure S2). Phylogenetic analysis based on alignments of 138 KatG proteins revealed that C. velia had duplicated KatGs (Cvel_14436; Cvel_23495), originating in a eukaryotic nucleus because it branched together with stramenopiles including oomycetes, haptophyte, cryptophyte and chlorophytes (Supplementary Figure S2). This observation agrees with previous studies proposing the transfer of the KatG enzyme among eukaryotic organisms as a horizontal gene transfer (HGT) event [112,113,128].
Nineteen CYP genes and only one P450R gene were found in each chromerid (C. velia and V. brassicaformis) (Supplementary Table S2). Targeting to organelles was predicted for all these unigenes. P450R was predicted to be targeted to the ER in both organisms (Supplementary Table S2). They also originated in a eukaryotic nucleus, because of their position in the clade composed of all eukaryotes, forming a sister group together with apicomplexan (Supplementary Figure S2). For CYPs, C. velia had eight genes for the ER, one for the plastid, four for the cytoplasm, and six for the nucleus. V. brassicaformis had 10 genes for the ER, two for the plastid, one mitochondrial, four for the cytoplasm, and two for the nucleus (Supplementary Table S2). Our phylogenetic analysis showed that the ER Chromera (DN54179_c0_g1) and the plastid Vitrella (Vbra_11766) CYPs sequences clustered with bacteria/organelles, with planctomycetes bacteria as their closest relatives. The rest of chromerid CYPs sequences originated in a eukaryotic nucleus, because of their position in the clade composed of all eukaryotes (Supplementary Figure S2).
Two HO isoforms (HO1 and HO2) were identified in V. brassicaformis, while the isoforms HO3 and HO4 were exclusively present in green plants [129]. V. brassicaformis cytoplasmic HO2 (Vbra_20700) originated in a eukaryotic nucleus, because of the position in the clade composed of all eukaryotes, forming a sister group together with apicomplexan. The other mitochondrion V. brassicaformis HO1 (Vbra_4541) and the only nuclear C. velia HO1 (DN93254_c0_g1) sequences clustered with green plants and algae within the same eukaryotic clade, suggesting their origins in a eukaryotic nucleus (Supplementary Figure S2).

3.7. Transcription Factors in Relation to Hg Stress

The assembled transcriptome showed that 56 unique TFs were differentially expressed under Hg2+ stress in C. velia (Table 2 and Table 3). TFs could trigger the activation of the ROS-related genes expression and protect cells against oxidative damage [48,130,131,132] (Table 3). Moreover, several heavy metal-induced TFs respond to other abiotic stresses [133], suggesting that they may be crucial for the adaptation of their growth to specific environments. The TFs diversity and characteristics revealed some clues consistent with the hypothesis of endosymbioses with green and red algal symbionts in the evolutionary history of haptophytes and stramenopiles [134,135]. TF genes encoding AP2/ERF, MYB, zinc finger, and basic leucine zipper (bZIP) showed a considerable enhancement of expression in brown algae (Ectocarpus siliculosus) in response to heavy metal (copper) stress [136]. The regulation of specific members of TF families in E. siliculosus supports the hypothesis that these genes may intersect oxidative stress-related transcriptional networks [136]. Among the differentially expressed TF genes in C. velia, there were three classes (NAC, WRKY, and bZIP) involved in biological process (BP), and the rest of the TF genes were involved in cellular function process (MF) (Supplementary Table S2B).
It has been previously demonstrated that MYB TF control the expression of peroxidases and ROS homeostasis, which modulates leaf cell expansion and final organ size [137]. One MYB TF (DN58459_c0_g1) was differentially expressed in C. velia, which up-regulated under Hg-stress. This result implies that the induction or repression of MYB TFs may be participating in the ROS homeostasis controlled by peroxidases. Three ERF (DN51129_c0_g1, DN105323_c0_g1, and DN107621_c0_g1) were up-regulated; while, two WRKY TFs (DN75769_c0_g1 and DN103312_c0_g1) were up-regulated and one WRKY TFs (DN77499_c0_g1) down-regulated in C. velia (Supplementary Table S2A). The results suggest that the up-regulation of WRKY and ERF TFs may be involved in the mechanism of ROS scavenging for C. velia. WRKY TFs are involved in response to abiotic and biotic stresses, including heavy metals [114,138]. The overexpression of ZmWRKY4 in maize has elevated the expression of SOD and APX under Cd stress [48]. Moreover, the activities of SOD, POD, GST, and GPX were enhanced due to the overexpression of ThWRKY7 in the transgenic plant Tamarix hispida [131]. ERF TFs could improve plant ROS tolerance by regulating the transcription of ROS metabolic enzymes [132,139]. A recent study reported that overexpression of TERF1 up-regulates the transcription of NtGPX, which may play a vital role in the regulation of ROS scavenging under Cd stress [132].
Hg exposure significantly down-regulated some TFs, including NAC (DN95341_c0_g1) and ZFPs (DN102045_c0_g1, DN102561_c0_g1, DN105281_c0_g1, and DN27427_c0_g1) (Supplementary Table S2B). A recent study found that overexpression of ThbZIP1 increased the content of both soluble sugars and proteins, and it also enhanced the activity of both POD and SOD under stress conditions [47]. In Arabidopsis, the ZFP family were shown to positively regulate heavy metal tolerance by the regulation of the GSH1 expression [140]. Overexpression of the NAC TF family improved the osmolytes contents and reduced the H2O2 and ·O2− contents under low temperature, which contribute to improving chilling stress tolerance in transgenic tobacco [141]. Overexpression of TaNAC69-1 enhanced the expression of stress up-regulated genes such as glyoxalase protein family in transgenic wheat, suggesting that TaNAC69 is included in regulating the drought tolerance [142]. Therefore, it seems that the changes in ROS levels observed in our study, for example the increase in ·O2− levels, may ultimately depend on the modulation of TFs expression.

3.8. Validation of the DEGs by Real-Time RT-PCR Analysis

To evaluate the reliability and validity of our transcriptome in the identified DEGs, a total of 28 DEGs were chosen and validated by RT-qPCR analysis. As shown in Figure 5, all DEGs were differentially expressed between control cultures (Cvel_cont) and cultures under Hg2+ treatment (Cvel_mer). The expression patterns of Flavin reductase (NADPH), katG 2, and GS were significantly up-regulated by Hg exposure, and FeSOD1 and FeSOD2 were down-regulated. CYP and bifunctional P-450/NADPH-P450 reductase were strongly up-regulated by Hg stress in C. velia. Generally, RT-qPCR results were comparable with the RNA-Seq-based gene expression patterns (Supplementary Table S2B). However, MnSOD, thioredoxin, and Glutathionyl-hydroquinone reductase did not show consistent expression levels between RT-qPCR and Illumina sequencing data (Figure 5). The discrepancies may result from different sensitivity of the two techniques.

4. Conclusions

This is the first study on the responses of the alveolate alga C. velia to Hg2+ treatment. By combining physiological, biochemical, transcriptomic, and bioinformatical analyses, we were able to uncover several pathways activated in response to the heavy metal stress. In general, we observed that C. velia behaves like higher plant species in terms of ROS production, with a reduction in H2O2 and an increase in O2− levels at high concentrations of Hg2+ while RNS does not seem to play a role. This is also the first transcriptomic analysis of C. velia altogether, an important organism for phylogenetic studies, and a model microalga. In total, 122,874 transcripts and 89,853 unigenes were successfully annotated in databases.
Moreover, the 1239 differentially expressed unigenes in C. velia were useful to postulate the molecular pathways involved in Hg2+ response, such as different detoxification defense systems and TFs. For the mechanism of ROS scavenging in response to Hg stress, the POD and glutathionylation pathways were involved, which was regulated by TFs such as ERF and WRKY. The water–water cycle and PrxR/Trx pathways might be associated with its sensitivity to Hg2+, which was regulated by TFs, including NAC and ZFP. Moreover, the xenobiotics detoxification system shows high activity in response to Hg stress.
Importantly, variation in expression of genes involved in ROS detoxifications generally matched with our biochemical observation of ROS levels, corroborating the validity of our dual approach. Overall, our data indicate that the response of C. velia to Hg2+ involves changes in various aspects of cell metabolism, signaling, and transport.

Supplementary Materials

The following are available online at https://www.mdpi.com/2218-273X/9/11/647/s1. Figure S1. Growth curve of C. velia culture. N = 3 ± SD. Arrow indicates the time of treatment (10 days after subculturing). Figure S2. Phylogenetic supertrees of all selected detoxification-related enzymes (heme oxygenase (HO), superoxide dismutase (SOD), NADPH-cytochrome P450 reductase (P450R), Cytochrome P450 (CYP) and Catalase-peroxidase (katG)), which explores the evolutionary relationships between C. velia enzymes and other domains of life based on protein sequences. Table S1. Summary of the protein sub-cellular localization of the identified detoxification-related enzymes (heme oxygenase (HO), superoxide dismutase (SOD), NADPH-cytochrome P450 reductase (P450R), Cytochrome P450 (CYP) and Catalase-peroxidase (katG)) in the C. velia and its close relative species (Vitrella brassicaformis). Table S2. (A) Primers for qRT-PCR analysis and (B) differentially expressed genes in C. velia. Table S3. Gene expression of selected (A) ROS-antioxidant defense system-related genes, (B) Xenobiotics detoxification-related genes and (C) Heavy metal-stress biomarkers in response to Hg exposure in C. velia.

Author Contributions

M.O., A.S. (Abdoallah Sharaf) and R.D.M. conceived the project and acquired funding. A.S. (Abdoallah Sharaf), R.D.M., A.S. (Ayush Sharma), and S.F. performed the experiments. A.S. (Abdoallah Sharaf) performed the bioinformatics analyses. A.S. (Abdoallah Sharaf) and R.D.M. drafted the manuscript. All authors revised the first draft and read and approved the final version of the manuscript.

Funding

This research was funded by [the Czech Science Foundation] grant number [project 18-13458S] and [ERDF/ESF Centre for research of pathogenicity, and virulence of parasites] grant number [No.CZ.02.1.01/0.0/0.0/16_019/0000759] to M.O. The sequencing was funded by [MEYS CR, NCMG project] grant number [LM2015091] to A.S.

Acknowledgments

The authors would like to thank MetaCentrum/CERIT-SC for providing the computational cloud for performing the bioinformatic analyses and the CF Genomics CEITEC MU supported by the NCMG research infrastructure for providing free sequencing.

Conflicts of Interest

The authors declare no conflict of interest.

References

  1. Harada, M. Minamata Disease: Methylmercury Poisoning in Japan Caused by Environmental Pollution. Crit. Rev. Toxicol. 1995, 25, 1–24. [Google Scholar] [CrossRef]
  2. Lamborg, C.H.; Hammerschmidt, C.R.; Bowman, K.L.; Swarr, G.J.; Munson, K.M.; Ohnemus, D.C.; Lam, P.J.; Heimbürger, L.-E.; Rijkenberg, M.J.A.; Saito, M.A. A global ocean inventory of anthropogenic mercury based on water column measurements. Nature 2014, 512, 65–68. [Google Scholar] [CrossRef]
  3. Cho, U.H.; Park, J.O. Mercury-induced oxidative stress in tomato seedlings. Plant Sci. 2000, 156, 1–9. [Google Scholar] [CrossRef]
  4. Israr, M.; Sahi, S.; Datta, R.; Sarkar, D. Bioaccumulation and physiological effects of mercury in Sesbania drummondii. Chemosphere 2006, 65, 591–598. [Google Scholar] [CrossRef]
  5. Lomonte, C.; Doronila, A.I.; Gregory, D.; Baker, A.J.M.; Kolev, S.D. Phytotoxicity of biosolids and screening of selected plant species with potential for mercury phytoextraction. J. Hazard. Mater. 2010, 173, 494–501. [Google Scholar] [CrossRef]
  6. Beauvais-Flück, R.; Slaveykova, V.; Cosio, C. Molecular Effects of Inorganic and Methyl Mercury in Aquatic Primary Producers: Comparing Impact to a Macrophyte and a Green Microalga in Controlled Conditions. Geosciences 2018, 8, 393. [Google Scholar] [CrossRef]
  7. Bodaly, R.A.; Jansen, W.A.; Majewski, A.R.; Fudge, R.J.P.; Strange, N.E.; Derksen, A.J.; Green, D.J. Postimpoundment time course of increased mercury concentrations in fish in hydroelectric reservoirs of northern Manitoba, Canada. Arch. Environ. Contam. Toxicol. 2007, 53, 379–389. [Google Scholar] [CrossRef]
  8. Elbaz, A.; Wei, Y.Y.; Meng, Q.; Zheng, Q.; Yang, Z.M. Mercury-induced oxidative stress and impact on antioxidant enzymes in Chlamydomonas reinhardtii. Ecotoxicology 2010, 19, 1285–1293. [Google Scholar] [CrossRef]
  9. Kamal, M.; Ghaly, A.E.; Mahmoud, N.; CoteCôté, R. Phytoaccumulation of heavy metals by aquatic plants. Environ. Int. 2004, 29, 1029–1039. [Google Scholar] [CrossRef]
  10. Narula, P.; Mahajan, A.; Gurnani, C.; Kumar, V.; Mukhija, S. Microalgae as an indispensable tool against heavy metals toxicity to plants: A review. Int. J. Pharm. Sci. Rev. Res. 2015, 31, 86–93. [Google Scholar]
  11. He, S.; Yang, X.; He, Z.; Baligar, V.C. Morphological and Physiological Responses of Plants to Cadmium Toxicity: A Review. Pedosphere 2017, 27, 421–438. [Google Scholar] [CrossRef]
  12. Azevedo, R.; Rodriguez, E. Phytotoxicity of Mercury in Plants: A Review. J. Bot. 2012, 2012, 1–6. [Google Scholar] [CrossRef]
  13. Chen, J.; Yang, Z.M. Mercury toxicity, molecular response and tolerance in higher plants. BioMetals 2012, 25, 847–857. [Google Scholar] [CrossRef]
  14. Apel, K.; Hirt, H. Reactive Oxygen Species: Metabolism, Oxidative Stress, and Signal Transduction. Annu. Rev. Plant Biol. 2004, 55, 373–399. [Google Scholar] [CrossRef]
  15. Gupta, D.K.; Pena, L.B.; Romero-Puertas, M.C.; Hernández, A.; Inouhe, M.; Sandalio, L.M. NADPH oxidases differentially regulate ROS metabolism and nutrient uptake under cadmium toxicity. Plant Cell Environ. 2017, 40, 509–526. [Google Scholar] [CrossRef]
  16. Del Río, L.A. ROS and RNS in plant physiology: An overview. J. Exp. Bot. 2015, 66, 2827–2837. [Google Scholar] [CrossRef]
  17. Martins, L.L.; Mourato, M.P.; Cardoso, A.I.; Pinto, A.P.; Mota, A.M.; Maria, M.L.; de Varennes, A.; de Lurdes, S.; Gonçalves, M.; de Varennes, A. Oxidative stress induced by cadmium in Nicotiana tabacum L.: Effects on growth parameters, oxidative damage and antioxidant responses in different plant parts. Acta Physiol. Plant. 2011, 33, 1375–1383. [Google Scholar] [CrossRef]
  18. Sytar, O.; Kumar, A.; Latowski, D.; Kuczynska, P.; Strzałka, K.; Prasad, M.N.V. Heavy metal-induced oxidative damage, defense reactions, and detoxification mechanisms in plants. Acta Physiol. Plant. 2013, 35, 985–999. [Google Scholar] [CrossRef]
  19. Gupta, D.K.; Palma, J.M.; Corpas, F.J. Reactive Oxygen Species and Oxidative Damage in Plants under Stress; Springer International Publishing: Cham, Switzerland, 2015; ISBN 978-3-319-20420-8. [Google Scholar]
  20. De Michele, R.; Vurro, E.; Rigo, C.; Costa, A.; Elviri, L.; Di Valentin, M.; Careri, M.; Zottini, M.; Sanita di Toppi, L.; Lo Schiavo, F. Nitric Oxide Is Involved in Cadmium-Induced Programmed Cell Death in Arabidopsis Suspension Cultures. Plant Physiol. 2009, 150, 217–228. [Google Scholar] [CrossRef]
  21. Chen, J.; Shiyab, S.; Han, F.X.; Monts, D.L.; Waggoner, C.A.; Yang, Z.; Su, Y. Bioaccumulation and physiological effects of mercury in Pteris vittata and Nephrolepis exaltata. Ecotoxicology 2009, 18, 110. [Google Scholar] [CrossRef]
  22. Ortega-Villasante, C.; Rellán-Álvarez, R.; Del Campo, F.F.; Carpena-Ruiz, R.O.; Hernández, L.E. Cellular damage induced by cadmium and mercury in Medicago sativa. J. Exp. Bot. 2005, 56, 2239–2251. [Google Scholar] [CrossRef]
  23. Ortega-Villasante, C.; Hernández, L.E.; Rellán-Álvarez, R.; Del Campo, F.F.; Carpena-Ruiz, R.O. Rapid alteration of cellular redox homeostasis upon exposure to cadmium and mercury in alfalfa seedlings. New Phytol. 2007, 176, 96–107. [Google Scholar] [CrossRef]
  24. Zhou, Z.S.; Wang, S.J.; Yang, Z.M. Biological detection and analysis of mercury toxicity to alfalfa (Medicago sativa) plants. Chemosphere 2008, 70, 1500–1509. [Google Scholar] [CrossRef]
  25. Zhou, Z.S.; Huang, S.Q.; Guo, K.; Mehta, S.K.; Zhang, P.C.; Yang, Z.M. Metabolic adaptations to mercury-induced oxidative stress in roots of Medicago sativa L. J. Inorg. Biochem. 2007, 101, 1–9. [Google Scholar] [CrossRef]
  26. Kováčik, J.; Rotková, G.; Bujdoš, M.; Babula, P.; Peterková, V.; Matúš, P. Ascorbic acid protects Coccomyxa subellipsoidea against metal toxicity through modulation of ROS/NO balance and metal uptake. J. Hazard. Mater. 2017, 339, 200–207. [Google Scholar] [CrossRef]
  27. Rellán-Álvarez, R.; Ortega-Villasante, C.; Álvarez-Fernández, A.; del Campo, F.F.; Hernández, L.E. Stress Responses of Zea mays to Cadmium and Mercury. Plant Soil 2006, 279, 41–50. [Google Scholar] [CrossRef] [Green Version]
  28. DellaGreca, M.; Pinto, G.; Pollio, A.; Previtera, L.; Temussi, F. Biotransformation of sinapic acid by the green algae Stichococcus bacillaris 155LTAP and Ankistrodesmus braunii C202.7a. Tetrahedron Lett. 2003, 44, 2779–2780. [Google Scholar] [CrossRef]
  29. Kirso, U.; Irha, N. Role of algae in fate of carcinogenic polycyclic aromatic hydrocarbons in the aquatic environment. Ecotoxicol. Environ. Saf. 1998, 41, 83–89. [Google Scholar] [CrossRef]
  30. Pflugmacher, S.; Wiencke, C.; Sandermann, H. Activity of phase I and phase II detoxication enzymes in Antarctic and Arctic macroalgae. Mar. Environ. Res. 1999, 48, 23–36. [Google Scholar] [CrossRef]
  31. Thies, F.; Grimme, L.H. In vivo O-dealkylation of resorufin and coumarin ethers by the green alga Chlorella fusca analysed by a rapid and sensitive high-performance liquid chromatographic assay. J. Chromatogr. A 1994, 684, 168–173. [Google Scholar] [CrossRef]
  32. Warshawsky, D.; Cody, T.; Radike, M.; Reilman, R.; Schumann, B.; LaDow, K.; Schneider, J. Biotransformation of benzo[a]pyrene and other polycyclic aromatic hydrocarbons and heterocyclic analogs by several green algae and other algal species under gold and white light. Chem. Biol. Interact. 1995, 97, 131–148. [Google Scholar] [CrossRef]
  33. Barque, J.P.; Abahamid, A.; Flinois, J.P.; Beaune, P.; Bonaly, J. Constitutive overexpression of immunoidentical forms of PCP-induced Euglena gracilis CYP-450. Biochem. Biophys. Res. Commun. 2002, 298, 277–281. [Google Scholar] [CrossRef]
  34. Pflugmacher, S.; Sandermann, H. Cytochrome P450 Monooxygenases for Fatty Acids and Xenobiotics in Marine Macroalgae. Plant Physiol. 1998, 117, 123–128. [Google Scholar] [CrossRef] [PubMed]
  35. Thies, F.; Backhaus, T.; Bossmann, B.; Grimme, L.H. Xenobiotic Biotransformation in Unicellular Green Algae (Involvement of Cytochrome P450 in the Activation and Selectivity of the Pyridazinone Pro-Herbicide Metflurazon). Plant Physiol. 1996, 112, 361–370. [Google Scholar] [CrossRef] [Green Version]
  36. Zangar, R.C.; Davydov, D.R.; Verma, S. Mechanisms that regulate production of reactive oxygen species by cytochrome P450. Toxicol. Appl. Pharmacol. 2004, 199, 316–331. [Google Scholar] [CrossRef]
  37. Pflugmacher, S.; Schröder, P.; Sandermann, H. Taxonomic distribution of plant glutathione S-transferases acting on xenobiotics. Phytochemistry 2000, 54, 267–273. [Google Scholar] [CrossRef]
  38. Reilman, R.; Keenan, T.H.; Cody, T.E.; Radike, M.J.; Warshawsky, D. Conjugation of benzo[a]pyrene metabolites by freshwater green alga Selenastrum capricornutum. Chem. Biol. Interact. 1990, 74, 93–105. [Google Scholar]
  39. Sandermann, H. Molecular ecotoxicology of plants. Trends Plant Sci. 2004, 9, 406–413. [Google Scholar] [CrossRef]
  40. Avery, S.V.; Codd, G.A.; Gadd, G.M. Characterisation of caesium transport in the microalga Chlorella salina. Biochem. Soc. Trans. 1995, 23, 468S. [Google Scholar] [CrossRef]
  41. Avilés, C.; Torres-Márquez, M.E.; Mendoza-Cózatl, D.; Moreno-Sánchez, R. Time-course development of the Cd2+ hyper-accumulating phenotype in Euglena gracilis. Arch. Microbiol. 2005, 184, 83–92. [Google Scholar] [CrossRef]
  42. Jabusch, T.W.; Swackhamer, D.L. Subcellular accumulation of polychlorinated biphenyls in the green alga Chlamydomonas reinhardtii. Environ. Toxicol. Chem. 2004, 23, 2823–2830. [Google Scholar] [CrossRef] [PubMed]
  43. Smital, T.; Sauerborn, R.; Hackenberger, B.K. Inducibility of the P-glycoprotein transport activity in the marine mussel Mytilus galloprovincialis and the freshwater mussel Dreissena polymorpha. Aquat. Toxicol. 2003, 65, 443–465. [Google Scholar] [CrossRef]
  44. Torres, M.A.; Barros, M.P.; Campos, S.C.G.; Pinto, E.; Rajamani, S.; Sayre, R.T.; Colepicolo, P. Biochemical biomarkers in algae and marine pollution: A review. Ecotoxicol. Environ. Saf. 2008, 71, 1–15. [Google Scholar] [CrossRef] [PubMed]
  45. You, J.; Chan, Z. ROS Regulation during Abiotic Stress Responses in Crop Plants. Front. Plant Sci. 2015, 6, 1092. [Google Scholar] [CrossRef] [PubMed]
  46. Jalmi, S.K.; Bhagat, P.K.; Verma, D.; Noryang, S.; Tayyeba, S.; Singh, K.; Sharma, D.; Sinha, A.K. Traversing the Links between Heavy Metal Stress and Plant Signaling. Front. Plant Sci. 2018, 9, 12. [Google Scholar] [CrossRef]
  47. Wang, Y.; Gao, C.; Liang, Y.; Wang, C.; Yang, C.; Liu, G. A novel bZIP gene from Tamarix hispida mediates physiological responses to salt stress in tobacco plants. J. Plant Physiol. 2010, 167, 222–230. [Google Scholar] [CrossRef]
  48. Hong, C.; Cheng, D.; Zhang, G.; Zhu, D.; Chen, Y.; Tan, M. The role of ZmWRKY4 in regulating maize antioxidant defense under cadmium stress. Biochem. Biophys. Res. Commun. 2017, 482, 1504–1510. [Google Scholar] [CrossRef]
  49. Moore, R.B.; Oborník, M.; Janouškovec, J.; Chrudimský, T.; Vancová, M.; Green, D.H.; Wright, S.W.; Davies, N.W.; Bolch, C.J.S.; Heimann, K.; et al. A photosynthetic alveolate closely related to apicomplexan parasites. Nature 2008, 451, 959–963. [Google Scholar] [CrossRef]
  50. Oborník, M.; Vancová, M.; Lai, D.H.; Janouškovec, J.; Keeling, P.J.; Lukeš, J. Morphology and ultrastructure of multiple life cycle stages of the photosynthetic relative of apicomplexa, Chromera velia. Protist 2011, 162, 115–130. [Google Scholar] [CrossRef]
  51. Vazač, J.; Füssy, Z.; Hladová, I.; Killi, S.; Oborník, M. Ploidy and Number of Chromosomes in the Alveolate Alga Chromera velia. Protist 2018, 169, 53–63. [Google Scholar] [CrossRef]
  52. Kotabová, E.; Jarešová, J.; Kaňa, R.; Sobotka, R.; Bína, D.; Prášil, O. Novel type of red-shifted chlorophyll a antenna complex from Chromera velia. I. Physiological relevance and functional connection to photosystems. Biochim. Biophys. Acta Bioenerg. 2014, 1837, 734–743. [Google Scholar] [CrossRef] [PubMed]
  53. Mann, M.; Hoppenz, P.; Jakob, T.; Weisheit, W.; Mittag, M.; Wilhelm, C.; Goss, R. Unusual features of the high light acclimation of Chromera velia. Photosynth. Res. 2014, 122, 159–169. [Google Scholar] [CrossRef] [PubMed]
  54. Quigg, A.; Kotabová, E.; Jarešová, J.; Kaňa, R.; Šetlík, J.; Šedivá, B.; Komárek, O.; Prášil, O. Photosynthesis in Chromera velia Represents a Simple System with High Efficiency. PLoS ONE 2012, 7, e47036. [Google Scholar] [CrossRef] [PubMed]
  55. Sobotka, R.; Esson, H.J.; Koník, P.; Trsková, E.; Moravcová, L.; Horák, A.; Dufková, P.; Oborník, M. Extensive gain and loss of photosystem I subunits in chromerid algae, photosynthetic relatives of apicomplexans. Sci. Rep. 2017, 7, 13214. [Google Scholar] [CrossRef] [PubMed] [Green Version]
  56. Liu, M.M.; Xing, Y.M.; Zhang, D.W.; Guo, S.X. Transcriptome analysis of genes involved in defence response in Polyporus umbellatus with Armillaria mellea infection. Sci. Rep. 2015, 5, 16075. [Google Scholar] [CrossRef] [PubMed]
  57. Dittami, S.M.; Scornet, D.; Petit, J.-L.L.; Ségurens, B.; Da Silva, C.; Corre, E.; Dondrup, M.; Glatting, K.-H.H.; König, R.; Sterck, L.; et al. Global expression analysis of the brown alga Ectocarpus siliculosus (Phaeophyceae) reveals large-scale reprogramming of the transcriptome in response to abiotic stress. Genome Biol. 2009, 10, R66. [Google Scholar] [CrossRef]
  58. Holzinger, A.; Pichrtová, M. Abiotic Stress Tolerance of Charophyte Green Algae: New Challenges for Omics Techniques. Front. Plant Sci. 2016, 7, 678. [Google Scholar] [CrossRef] [Green Version]
  59. Khraiwesh, B.; Qudeimat, E.; Thimma, M.; Chaiboonchoe, A.; Jijakli, K.; Alzahmi, A.; Arnoux, M.; Salehi-Ashtiani, K. Genome-wide expression analysis offers new insights into the origin and evolution of Physcomitrella patens stress response. Sci. Rep. 2015, 5, 17434. [Google Scholar] [CrossRef]
  60. Matthijs, M.; Fabris, M.; Broos, S.; Vyverman, W.; Goossens, A. Profiling of the Early Nitrogen Stress Response in the Diatom Phaeodactylum tricornutum Reveals a Novel Family of RING-Domain Transcription Factors. Plant Physiol. 2016, 170, 489–498. [Google Scholar] [CrossRef]
  61. De Michele, R.; Formentin, E.; Todesco, M.; Toppo, S.; Carimi, F.; Zottini, M.; Barizza, E.; Ferrarini, A.; Delledonne, M.; Fontana, P.; et al. Transcriptome analysis of Medicago truncatula leaf senescence: Similarities and differences in metabolic and transcriptional regulations as compared with Arabidopsis, nodule senescence and nitric oxide signalling. New Phytol. 2009, 181, 563–575. [Google Scholar] [CrossRef]
  62. Wintermans, J.F.G.M.; De Mots, A. Spectrophotometric characteristics of chlorophylls a and b and their phenophytins in ethanol. Biochim. Biophys. Acta Biophys. Incl. Photosynth. 1965, 109, 448–453. [Google Scholar] [CrossRef]
  63. Chen, X.; Zhong, Z.; Xu, Z.; Chen, L.; Wang, Y. 2′,7′-Dichlorodihydrofluorescein as a fluorescent probe for reactive oxygen species measurement: Forty years of application and controversy. Free Radic. Res. 2010, 44, 587–604. [Google Scholar] [CrossRef] [PubMed]
  64. Nazarewicz, R.R.; Bikineyeva, A.; Dikalov, S.I. Rapid and Specific Measurements of Superoxide Using Fluorescence Spectroscopy. J. Biomol. Screen. 2013, 18, 498–503. [Google Scholar] [CrossRef] [PubMed]
  65. Kojima, H.; Urano, Y.; Kikuchi, K.; Higuchi, T.; Hirata, Y.; Nagano, T. Fluorescent Indicators for Imaging Nitric Oxide Production. Angew. Chem. Int. Ed. 1999, 38, 3209–3212. [Google Scholar] [CrossRef]
  66. Setsukinai, K.; Urano, Y.; Kakinuma, K.; Majima, H.J.; Nagano, T. Development of Novel Fluorescence Probes That Can Reliably Detect Reactive Oxygen Species and Distinguish Specific Species. J. Biol. Chem. 2003, 278, 3170–3175. [Google Scholar] [CrossRef] [Green Version]
  67. Bellincampi, D.; Dipierro, N.; Salvi, G.; Cervone, F.; De Lorenzo, G. Extracellular H(2)O(2) induced by oligogalacturonides is not involved in the inhibition of the auxin-regulated rolB gene expression in tobacco leaf explants. Plant Physiol. 2000, 122, 1379–1386. [Google Scholar] [CrossRef]
  68. Hu, L.; Li, H.; Chen, L.; Lou, Y.; Amombo, E.; Fu, J. RNA-seq for gene identification and transcript profiling in relation to root growth of bermudagrass (Cynodon dactylon) under salinity stress. BMC Genom. 2015, 16, 575. [Google Scholar] [CrossRef]
  69. Grabherr, M.G.; Haas, B.J.; Yassour, M.; Levin, J.Z.; Thompson, D.A.; Amit, I.; Adiconis, X.; Fan, L.; Raychowdhury, R.; Zeng, Q.; et al. Full-length transcriptome assembly from RNA-Seq data without a reference genome. Nat. Biotechnol. 2011, 299, 644. [Google Scholar] [CrossRef]
  70. Bryant, D.M.; Johnson, K.; DiTommaso, T.; Tickle, T.; Couger, M.B.; Payzin-Dogru, D.; Lee, T.J.; Leigh, N.D.; Kuo, T.-H.; Davis, F.G.; et al. A Tissue-Mapped Axolotl De Novo Transcriptome Enables Identification of Limb Regeneration Factors. Cell Rep. 2017, 18, 762–776. [Google Scholar] [CrossRef] [Green Version]
  71. Supek, F.; Bošnjak, M.; Škunca, N.; Šmuc, T. REVIGO Summarizes and Visualizes Long Lists of Gene Ontology Terms. PLoS ONE 2011, 6, e21800. [Google Scholar] [CrossRef]
  72. Li, B.; Dewey, C.N. RSEM: Accurate transcript quantification from RNA-seq data with or without a reference genome. BMC Bioinfor. 2014, 12, 323. [Google Scholar]
  73. McCarthy, D.J.; Chen, Y.; Smyth, G.K. Differential expression analysis of multifactor RNA-Seq experiments with respect to biological variation. Nucleic Acids Res. 2012, 40, 4288–4297. [Google Scholar] [CrossRef] [PubMed] [Green Version]
  74. Boratyn, G.M.; Schäffer, A.A.; Agarwala, R.; Altschul, S.F.; Lipman, D.J.; Madden, T.L. Domain enhanced lookup time accelerated BLAST. Biol. Direct 2012, 7, 12. [Google Scholar] [CrossRef] [PubMed]
  75. Woo, Y.H.; Ansari, H.; Otto, T.D.; Linger, C.M.K.; Olisko, M.K.; Michálek, J.; Saxena, A.; Shanmugam, D.; Tayyrov, A.; Veluchamy, A.; et al. Chromerid genomes reveal the evolutionary path from photosynthetic algae to obligate intracellular parasites. Elife 2015, 4, 1–41. [Google Scholar] [CrossRef] [PubMed]
  76. Nordberg, H.; Cantor, M.; Dusheyko, S.; Hua, S.; Poliakov, A.; Shabalov, I.; Smirnova, T.; Grigoriev, I.V.; Dubchak, I. The genome portal of the Department of Energy Joint Genome Institute: 2014 updates. Nucleic Acids Res. 2014, 42, D26–D31. [Google Scholar] [CrossRef] [PubMed]
  77. Bendtsen, J.D.; Nielsen, H.; Von Heijne, G.; Brunak, S. Improved prediction of signal peptides: SignalP 3.0. J. Mol. Biol. 2004, 340, 783–795. [Google Scholar] [CrossRef] [PubMed]
  78. Petersen, T.N.; Brunak, S.; von Heijne, G.; Nielsen, H. SignalP 4.0: Discriminating signal peptides from transmembrane regions. Nat. Methods 2011, 8, 785–786. [Google Scholar] [CrossRef]
  79. Gruber, A.; Rocap, G.; Kroth, P.G.; Armbrust, E.V.; Mock, T. Plastid proteome prediction for diatoms and other algae with secondary plastids of the red lineage. Plant J. 2015, 81, 519–528. [Google Scholar] [CrossRef] [Green Version]
  80. Emanuelsson, O.; Brunak, S.; von Heijne, G.; Nielsen, H. Locating proteins in the cell using TargetP, SignalP and related tools. Nat. Protoc. 2007, 2, 953–971. [Google Scholar] [CrossRef]
  81. Bannai, H.; Tamada, Y.; Maruyama, O.; Nakai, K.; Miyano, S. Extensive feature detection of N-terminal protein sorting signals. Bioinformatics 2002, 18, 298–305. [Google Scholar] [CrossRef] [Green Version]
  82. Horton, P.; Park, K.J.; Obayashi, T.; Fujita, N.; Harada, H.; Adams-Collier, C.J.; Nakai, K. WoLF PSORT: Protein localization predictor. Nucleic Acids Res. 2007, 35, W585–W587. [Google Scholar] [CrossRef] [PubMed]
  83. Claros, M.G.; Vincens, P. Computational method to predict mitochondrially imported proteins and their targeting sequences. Eur. J. Biochem. 1996, 241, 779–786. [Google Scholar] [CrossRef] [PubMed]
  84. Almagro Armenteros, J.J.; Sønderby, C.K.; Sønderby, S.K.; Nielsen, H.; Winther, O. DeepLoc: Prediction of protein subcellular localization using deep learning. Bioinformatics 2017, 33, 3387–3395. [Google Scholar] [CrossRef] [PubMed]
  85. Katoh, K.; Standley, D.M. MAFFT multiple sequence alignment software version 7: Improvements in performance and usability. Mol. Biol. Evol. 2013, 30, 772–780. [Google Scholar] [CrossRef]
  86. de Juan, D.; Pazos, F.; Valencia, A.; Evaluation, P.M.; Rehbein, P.; Schwalbe, H.; Jones, D.T.; Buchan, D.W.A.; Cozzetto, D.; Pontil, M.; et al. ProtTest: Selection of best-fit models of protein evolution. Bioinformatics 2015, 21, 2104–2105. [Google Scholar]
  87. Stamatakis, A. RAxML version 8: A tool for phylogenetic analysis and post-analysis of large phylogenies. Bioinformatics 2014, 30, 1312–1313. [Google Scholar] [CrossRef]
  88. Nguyen, L.-T.; Schmidt, H.A.; von Haeseler, A.; Minh, B.Q. IQ-TREE: A Fast and Effective Stochastic Algorithm for Estimating Maximum-Likelihood Phylogenies. Mol. Biol. Evol. 2015, 32, 268–274. [Google Scholar] [CrossRef]
  89. Kearse, M.; Moir, R.; Wilson, A.; Stones-Havas, S.; Cheung, M.; Sturrock, S.; Buxton, S.; Cooper, A.; Markowitz, S.; Duran, C.; et al. Geneious Basic: An integrated and extendable desktop software platform for the organization and analysis of sequence data. Bioinformatics 2012, 28, 1647–1649. [Google Scholar] [CrossRef]
  90. Nowicka, B.; Pluciński, B.; Kuczyńska, P.; Kruk, J. Physiological characterization of Chlamydomonas reinhardtii acclimated to chronic stress induced by Ag, Cd, Cr, Cu and Hg ions. Ecotoxicol. Environ. Saf. 2016, 130, 133–145. [Google Scholar] [CrossRef]
  91. Cargnelutti, D.; Tabaldi, L.A.; Spanevello, R.M.; de Oliveira Jucoski, G.; Battisti, V.; Redin, M.; Linares, C.E.B.; Dressler, V.L.; de Moraes Flores, É.M.; Nicoloso, F.T.; et al. Mercury toxicity induces oxidative stress in growing cucumber seedlings. Chemosphere 2006, 65, 999–1006. [Google Scholar] [CrossRef]
  92. Krogh, A.; Larsson, B.; von Heijne, G.; Sonnhammer, E.L. Predicting transmembrane protein topology with a hidden markov model: Application to complete genomes11Edited by F. Cohen. J. Mol. Biol. 2001, 305, 567–580. [Google Scholar] [CrossRef] [PubMed]
  93. Pinto, E.; Sigaud-kutner, T.C.S.; Leitao, M.A.S.; Okamoto, O.K.; Morse, D.; Colepicolo, P. HEAVY METAL-INDUCED OXIDATIVE STRESS IN ALGAE1. J. Phycol. 2003, 39, 1008–1018. [Google Scholar] [CrossRef]
  94. Sabatini, S.E.; Juárez, Á.B.; Eppis, M.R.; Bianchi, L.; Luquet, C.M.; de Molina, M.D.C.R. Oxidative stress and antioxidant defenses in two green microalgae exposed to copper. Ecotoxicol. Environ. Saf. 2009, 72, 1200–1206. [Google Scholar] [CrossRef] [PubMed]
  95. Guo, J.T.; Weatherby, K.; Carter, D.; Šlapeta, J. Effect of nutrient concentration and salinity on immotile-motile transformation of Chromera velia. J. Eukaryot. Microbiol. 2010, 57, 444–446. [Google Scholar] [CrossRef] [PubMed]
  96. Kabeláčová, K. The Fitness of Three Strains of the Alga Chromera velia—Salinity and pH; University of South Bohemia: Budejovice, Ceske, 2018. [Google Scholar]
  97. Perez-Perez, M.E.; Lemaire, S.D.; Crespo, J.L. Reactive Oxygen Species and Autophagy in Plants and Algae. Plant Physiol. 2012, 160, 156–164. [Google Scholar] [CrossRef] [Green Version]
  98. Shanura Fernando, I.P.; Asanka Sanjeewa, K.K.; Samarakoon, K.W.; Lee, W.W.; Kim, H.S.; Kim, E.A.; Gunasekara, U.K.; Abeytunga, D.T.U.; Nanayakkara, C.; De Silva, E.D.; et al. FTIR characterization and antioxidant activity of water soluble crude polysaccharides of Sri Lankan marine algae. Algae 2017, 32, 75–86. [Google Scholar] [CrossRef] [Green Version]
  99. Fan, Y.; Bose, J.; Zhou, M.; Shabala, S. ROS Production, Scavenging, and Signaling under Salinity Stress. In Managing Salt Tolerance in Plants; Wani, S.H., Hossain, M.A., Eds.; CRC Press: Boca Raton, FL, USA, 2015. [Google Scholar]
  100. Gratão, P.L.; Monteiro, C.C.; Tezotto, T.; Carvalho, R.F.; Alves, L.R.; Peters, L.P.; Azevedo, R.A. Cadmium stress antioxidant responses and root-to-shoot communication in grafted tomato plants. BioMetals 2015, 28, 803–816. [Google Scholar] [CrossRef]
  101. Shahabivand, S.; Zare Maivan, H.; Mahmoudi, E.; Soltani, B.M.; Sharifi, M.; Aliloo, A.A. Antioxidant activity and gene expression associated with cadmium toxicity in wheat affected by mycorrhizal fungus. Zemdirb. Agric. 2016, 103, 53–60. [Google Scholar] [CrossRef]
  102. Cassier-Chauvat, C.; Chauvat, F. Responses to oxidative and heavy metal stresses in cyanobacteria: Recent advances. Int. J. Mol. Sci. 2015, 16, 871–886. [Google Scholar] [CrossRef]
  103. Narainsamy, K.; Marteyn, B.; Sakr, S.; Cassier-Chauvat, C.; Chauvat, F. Genomics of the Pleïotropic Glutathione System in Cyanobacteria. Adv. Bot. Res. 2013, 65, 157–188. [Google Scholar]
  104. Ken, C.F.; Hsiung, T.M.; Huang, Z.X.; Juang, R.H.; Lin, C.T. Characterization of Fe/Mn-superoxide dismutase from diatom Thallassiosira weissflogii: Cloning, expression, and property. J. Agric. Food Chem. 2005, 53, 1470–1474. [Google Scholar] [CrossRef] [PubMed]
  105. Fridovich, I. Superoxide anion radical (O 2), superoxide dismutases, and related matters. J. Biol. Chem. 1997, 272, 18515–18517. [Google Scholar] [CrossRef] [PubMed]
  106. Okamoto, O.K.; Robertson, D.L.; Fagan, T.F.; Hastings, J.W.; Colepicolo, P. Different Regulatory Mechanisms Modulate the Expression of a Dinoflagellate Iron-Superoxide Dismutase. J. Biol. Chem. 2001, 276, 19989–19993. [Google Scholar] [CrossRef] [PubMed] [Green Version]
  107. Barros, M.P.; Pinto, E.; Sigaud-Kutner, T.C.S.; Cardozo, K.H.M.; Colepicolo, P. Rhythmicity and oxidative/nitrosative stress in algae. Biol. Rhythm Res. 2005, 36, 67–82. [Google Scholar] [CrossRef]
  108. Murthy, K.N.C.; Vanitha, A.; Rajesha, J.; Swamy, M.M.; Sowmya, P.R.; Ravishankar, G.A. In vivo antioxidant activity of carotenoids from Dunaliella salina—A green microalga. Life Sci. 2005, 76, 1381–1390. [Google Scholar] [CrossRef] [PubMed]
  109. Tripathi, B.N.; Mehta, S.K.; Amar, A.; Gaur, J.P. Oxidative stress in Scenedesmus sp. during short- and long-term exposure to Cu2+ and Zn2+. Chemosphere 2006, 62, 538–544. [Google Scholar] [CrossRef]
  110. Yamada, Y.; Fujiwara, T.; Sato, T.; Igarashi, N.; Tanaka, N. The 2.0 å crystal structure of catalase-peroxidase from haloarcula marismortui. Nat. Struct. Biol. 2002, 9, 691. [Google Scholar] [CrossRef]
  111. Welinder, K.G. Superfamily of plant, fungal and bacterial peroxidases. Curr. Opin. Struct. Biol. 1992, 2, 388–393. [Google Scholar] [CrossRef]
  112. Passardi, F.; Bakalovic, N.; Teixeira, F.K.; Margis-Pinheiro, M.; Penel, C.; Dunand, C. Prokaryotic origins of the non-animal peroxidase superfamily and organelle-mediated transmission to eukaryotes. Genomics 2007, 89, 567–579. [Google Scholar] [CrossRef]
  113. Klotz, M.G.; Loewen, P.C. The molecular evolution of catalatic hydroperoxidases: Evidence for multiple lateral transfer of genes between prokaryota and from bacteria into eukaryota. Mol. Biol. Evol. 2003, 20, 1098–1112. [Google Scholar] [CrossRef]
  114. Yu, R.; Tang, Y.; Liu, C.; Du, X.; Miao, C.; Shi, G. Comparative transcriptomic analysis reveals the roles of ROS scavenging genes in response to cadmium in two pak choi cultivars. Sci. Rep. 2017, 7, 9217. [Google Scholar] [CrossRef] [PubMed]
  115. Zang, X.; Geng, X.; Wang, F.; Liu, Z.; Zhang, L.; Zhao, Y.; Tian, X.; Ni, Z.; Yao, Y.; Xin, M.; et al. Overexpression of wheat ferritin gene TaFER-5B enhances tolerance to heat stress and other abiotic stresses associated with the ROS scavenging. BMC Plant Biol. 2017, 17, 14. [Google Scholar] [CrossRef] [PubMed]
  116. Zok, A.; Oláh, R.; Hideg, É.; Horváth, V.G.; Kós, P.B.; Majer, P.; Váradi, G.; Szegedi, E. Effect of Medicago sativa ferritin gene on stress tolerance in transgenic grapevine. Plant Cell. Tissue Organ Cult. 2010, 100, 339–344. [Google Scholar] [CrossRef]
  117. Hannemann, F.; Bichet, A.; Ewen, K.M.; Bernhardt, R. Cytochrome P450 systems-biological variations of electron transport chains. Biochim. Biophys. Acta Gen. Subj. 2007, 1770, 330–344. [Google Scholar] [CrossRef] [PubMed]
  118. Kelly, S.L.; Kelly, D.E. Microbial cytochromes P450: Biodiversity and biotechnology. Where do cytochromes P450 come from, what do they do and what can they do for us? Philos. Trans. R. Soc. B Biol. Sci. 2013, 368, 20120476. [Google Scholar] [CrossRef]
  119. Schenkman, J.B.; Jansson, I. The many roles of cytochrome b5. Pharmacol. Ther. 2003, 97, 139–152. [Google Scholar] [CrossRef]
  120. Kandel, S.E.; Lampe, J.N. Role of Protein–Protein Interactions in Cytochrome P450-Mediated Drug Metabolism and Toxicity. Chem. Res. Toxicol. 2014, 27, 1474–1486. [Google Scholar] [CrossRef]
  121. Jamakhandi, A.P.; Kuzmic, P.; Sanders, D.E.; Miller, G.P. Global Analysis of Protein−Protein Interactions Reveals Multiple CYP2E1−Reductase Complexes †. Biochemistry 2007, 46, 10192–10201. [Google Scholar] [CrossRef]
  122. Lane, T.S.; Rempe, C.S.; Davitt, J.; Staton, M.E.; Peng, Y.; Soltis, D.E.; Melkonian, M.; Deyholos, M.; Leebens-Mack, J.H.; Chase, M.; et al. Diversity of ABC transporter genes across the plant kingdom and their potential utility in biotechnology. BMC Biotechnol. 2016, 16, 47. [Google Scholar] [CrossRef]
  123. Ben Chekroun, K.; Baghour, M. The role of algae in phytoremediation of heavy metals: A review. J. Mater. Environ. Sci. 2013, 4, 873–880. [Google Scholar]
  124. Hossain, M.A.; Piyatida, P.; da Silva, J.A.T.; Fujita, M. Molecular Mechanism of Heavy Metal Toxicity and Tolerance in Plants: Central Role of Glutathione in Detoxification of Reactive Oxygen Species and Methylglyoxal and in Heavy Metal Chelation. J. Bot. 2012, 2012, 37. [Google Scholar] [CrossRef]
  125. Yamuna, A.; Kabila, V.; Geraldine, P. Expression of heat shock protein 70 in freshwater prawn Macrobrachium malcolmsonii (H. Milne Edwards) following exposure to Hg and Cu. Indian J. Exp. Biol. 2000, 38, 921–925. [Google Scholar] [PubMed]
  126. Wei, Y.Y.; Zheng, Q.; Liu, Z.P.; Yang, Z.M. Regulation of tolerance of chlamydomonas reinhardtii to heavy metal toxicity by heme oxygenase-1 and carbon monoxide. Plant Cell Physiol. 2011, 52, 1665–1675. [Google Scholar] [CrossRef]
  127. Sanità Di Toppi, L.; Prasad, M.N.V.; Ottonello, S. Metal Chelating Peptides and Proteins in Plants. In Physiology and Biochemistry of Metal Toxicity and Tolerance in Plants; Prasad, M.N.V., Ed.; Springer: Dordrecht, The Netherlands, 2002; pp. 59–93. [Google Scholar]
  128. Zémocký, M. Phylogenetic relationships in class I of the superfamily of bacterial, fungal, and plant peroxidases. Eur. J. Biochem. 2004, 271, 3297–3309. [Google Scholar] [CrossRef] [PubMed]
  129. Theologis, A.; Ecker, J.R.; Palm, C.J.; Federspiel, N.A.; Kaul, S.; White, O.; Alonso, J.; Altafi, H.; Araujo, R.; Bowman, C.L.; et al. Sequence and analysis of chromosome 1 of the plant Arabidopsis thaliana. Nature 2000, 408, 816–820. [Google Scholar] [CrossRef] [PubMed]
  130. Wu, H.; Chen, C.; Du, J.; Liu, H.; Cui, Y.; Zhang, Y.; He, Y.; Wang, Y.; Chu, C.; Feng, Z.; et al. Co-Overexpression FIT with AtbHLH38 or AtbHLH39 in Arabidopsis-Enhanced Cadmium Tolerance via Increased Cadmium Sequestration in Roots and Improved Iron Homeostasis of Shoots 1. Plant Physiol. 2012, 158, 790–800. [Google Scholar] [CrossRef] [PubMed]
  131. Yang, G.; Wang, C.; Wang, Y.; Guo, Y.; Zhao, Y.; Yang, C.; Gao, C. Overexpression of ThVHAc1 and its potential upstream regulator, ThWRKY7, improved plant tolerance of Cadmium stress. Sci. Rep. 2016, 6, 18752. [Google Scholar] [CrossRef]
  132. Zhang, H.; Li, A.; Zhang, Z.; Huang, Z.; Lu, P.; Zhang, D.; Liu, X.; Zhang, Z.F.; Huang, R. Ethylene Response Factor TERF1, Regulated by ETHYLENE-INSENSITIVE3-like Factors, Functions in Reactive Oxygen Species (ROS) Scavenging in Tobacco (Nicotiana tabacum L.). Sci. Rep. 2016, 6, 29948. [Google Scholar] [CrossRef]
  133. Yadav, N.R.; Taunk, J.; Rani, A.; Aneja, B.; Yadav, R.C. Role of Transcription Factors in Abiotic Stress Tolerance in Crop Plants. In Climate Change and Plant Abiotic Stress Tolerance; Tuteja, N., Gill, S.S., Eds.; Wiley-VCH GmbH & Co. KGaA: Weinheim, Germany, 2013; pp. 605–640. [Google Scholar]
  134. Moustafa, A.; Beszteri, B.; Maier, U.G.; Bowler, C.; Valentin, K.; Bhattacharya, D. Genomic footprints of a cryptic plastid endosymbiosis in diatoms. Science 2009, 324, 1724–1726. [Google Scholar] [CrossRef]
  135. Thiriet-Rupert, S.; Carrier, G.; Chénais, B.; Trottier, C.; Bougaran, G.; Cadoret, J.P.; Schoefs, B.; Saint-Jean, B. Transcription factors in microalgae: Genome-wide prediction and comparative analysis. BMC Genom. 2016, 17, 282. [Google Scholar] [CrossRef]
  136. Ritter, A.; Dittami, S.M.; Goulitquer, S.; Correa, J.A.; Boyen, C.; Potin, P.; Tonon, T. Transcriptomic and metabolomic analysis of copper stress acclimation in Ectocarpus siliculosus highlights signaling and tolerance mechanisms in brown algae. BMC Plant Biol. 2014, 14, 116. [Google Scholar] [CrossRef] [PubMed]
  137. Lu, D.; Wang, T.; Persson, S.; Mueller-Roeber, B.; Schippers, J.H.M. Transcriptional control of ROS homeostasis by KUODA1 regulates cell expansion during leaf development. Nat. Commun. 2014, 5, 3767. [Google Scholar] [CrossRef] [PubMed] [Green Version]
  138. Fan, S.; Dong, L.; Han, D.; Zhang, F.; Wu, J.; Jiang, L.; Cheng, Q.; Li, R.; Lu, W.; Meng, F.; et al. GmWRKY31 and GmHDL56 Enhances Resistance to Phytophthora sojae by Regulating Defense-Related Gene Expression in Soybean. Front. Plant Sci. 2017, 8, 781. [Google Scholar] [CrossRef] [PubMed] [Green Version]
  139. Sewelam, N.; Kazan, K.; Thomas-Hall, S.R.; Kidd, B.N.; Manners, J.M.; Schenk, P.M. Ethylene Response Factor 6 Is a Regulator of Reactive Oxygen Species Signaling in Arabidopsis. PLoS ONE 2013, 8, e70289. [Google Scholar] [CrossRef] [PubMed]
  140. Chen, J.; Yang, L.; Yan, X.; Liu, Y.; Wang, R.; Fan, T.; Ren, Y.; Tang, X.; Xiao, F.; Liu, Y.; et al. Zinc-Finger Transcription Factor ZAT6 Positively Regulates Cadmium Tolerance through Glutathione-dependent Pathway in Arabidopsis. Plant Physiol. 2016, 171, 707–719. [Google Scholar] [CrossRef] [PubMed]
  141. Li, X.D.; Zhuang, K.Y.; Liu, Z.M.; Yang, D.Y.; Ma, N.N.; Meng, Q.W. Overexpression of a novel NAC-type tomato transcription factor, SlNAM1, enhances the chilling stress tolerance of transgenic tobacco. J. Plant Physiol. 2016, 204, 54–65. [Google Scholar] [CrossRef] [PubMed]
  142. Xue, G.P.; Way, H.M.; Richardson, T.; Drenth, J.; Joyce, P.A.; McIntyre, C.L. Overexpression of TaNAC69 leads to enhanced transcript levels of stress up-regulated genes and dehydration tolerance in bread wheat. Mol. Plant 2011, 4, 697–712. [Google Scholar] [CrossRef]
Figure 1. Cell number (A) and chlorophyll a content (B) of cultures treated with 0 (control), 10, 30, and 100 µM HgCl2 for 3 h, 6 h, 24 h, 48 h, and 72 h. N = 3 ± Standard Deviation (SD). Asterisks indicate significant differences compared to the corresponding control value, for p < 0.05.
Biomolecules 09 00647 g001
Figure 2. Intracellular oxidating events, as measured by H2DCF-DA fluorescence (A), extracellular H2O2 (B), O2− (C), NO (D), and ONOO/⋅OH (E) levels of cultures treated with 10, 30, and 100 µM HgCl2 for 3 h, 6 h, 24 h, 48 h, and 72 h, relative to the corresponding control values. N = 4 ± SD. Asterisks indicate significant differences compared to the corresponding control value, for p < 0.05.
Biomolecules 09 00647 g002
Figure 3. Hierarchical clustering analysis of the C. velia control (Cvel_cont1, Cvel_cont2, and Cvel_cont3) and Hg-treated libraries (Cvel_mer1, Cvel_mer2, and Cvel_mer3).
Biomolecules 09 00647 g003
Figure 4. A bubble plot of the annotated differentially expressed genes (DEGs) gene expressions and gene ontology (GO) classification. The results summarized in three main categories: Biological process (BP), cellular component (CC), and molecular function (MF).
Biomolecules 09 00647 g004
Figure 5. RT-qPCR analyses of 28 heavy metal stress-related genes under the control and Hg treatment in C. velia cultures. Each bar represents the mean ± SD of triplicate assays. Values with different letters indicate significant differences at p < 0.05, according to Duncan’s multiple range tests.
Biomolecules 09 00647 g005
Table 1. Summary of the sequencing results.
Sample NameConditionRaw ReadsClean ReadsTotal Mapped
Cvel_cont1Control509,407.39499,612.65435,130,47 (87.09%)
Cvel_cont2Control602,350.18593,301.55440,098,77 (74.18%)
Cvel_cont3Control539,187.31530,589.42464,339,73 (87.51%)
Subtotal165,094,488162,350,362133,956,897 (82.51%)
Cvel_mer1Mercury475,722.8467,895.2408,397,57 (87.28%)
Cvel_mer2Mercury532,104.78523,476.04456,650,32 (87.23%)
Cvel_mer3Mercury47,120.479462,513.04400,187,51 (86.52%)
Subtotal147,903,237145,388,428126,523,540 (87.02%)
Total312,997,725307,738,790
Table 2. Summary of the annotation results.
DatabaseNumber of UnigenesPercentage (%)
CryptoDB52,40458.32
InterPro52,38858.3
NCBI non-redundant (NR)11,17312.43
UniProt16,62518.5
Pfam34563.85
GeneOntology (GO)10051.12
TmHMM14611.62
SignalP10551.17
Annotated in at least one Database68,71376.47
Total Unigenes89,853
Table 3. Transcription factors identified in the C. velia under Hg stress.
Transcription Factors FamilyNumbers
Zinc finger C2H2-type12
Zinc finger C3H-type9
Basic helix-loop-helix (bHLH)6
Basic Leucine Zipper (bZIP)5
Trihelix5
ERF3
WRKY3
B33
GATA3
NAC3
ADP-ribosylation factor (ARF)2
Homeodomain-leucine zipper (HD-ZIP)1
MYB1
Total56

