Article

Monosodium Glutamate (MSG) Renders Alkalinizing Properties and Its Urinary Metabolic Markers of MSG Consumption in Rats

1
Department of Biochemistry, Faculty of Medicine, Khon Kaen University, Khon Kaen 40002, Thailand
2
Chronic Kidney Disease prevention in the Northeast Thailand (CKDNET), Khon Kaen University, Khon Kaen 40002, Thailand
3
Department of Metabolism, Digestive Disease and Reproduction, Faculty of Medicine, Imperial College London, South Kensington, London SW7 2AZ, UK
4
Centre for Digestive and Gut Health, Institute of Global Health Innovation, Imperial College London, London SW7 2AZ, UK
5
Department of Medicine, Faculty of Medicine, Khon Kaen University, Khon Kaen 40002, Thailand
6
Rheumatology and Clinical Immunology, IRCCS Humanitas Clinical and Research Center, 20089 Milan, Italy
7
BIOMETRA Department, University of Milan, 20089 Milan, Italy
*
Authors to whom correspondence should be addressed.
Biomolecules 2019, 9(10), 542; https://doi.org/10.3390/biom9100542
Submission received: 23 August 2019 / Revised: 25 September 2019 / Accepted: 26 September 2019 / Published: 27 September 2019

Abstract

:
Monosodium glutamate (MSG) is widely used as a flavor enhancer and its effects on human health are still debated. We aimed to investigate whether MSG can act as alkalinizing agent in murine models and if its metabolites are biomarkers of MSG consumption. For this purpose, adult male Wistar rats were given water added with 1 g% MSG or three types of control water, including sodium chloride (NaCl) and sodium bicarbonate (NaHCO3). At 14 days, urinary pH, electrolytes, urinary metabolites and ion-exchanger gene expression were determined. The results revealed that MSG-treated rats had significantly more alkaline urine and higher levels of urinary sodium and bicarbonate similar to NaHCO3 controls. These changes correlated with a lower expression of ion-exchanger genes, namely, CAII, NBC1, and AE1, which are involved in bicarbonate kidney reabsorption. The urinary metabolic profiles also revealed similar patterns for the MSG and NaHCO3 groups. In conclusion, MSG exhibits similar properties to NaHCO3, an alkalinizing agent, with regard to inducing alkaline urine, reducing bicarbonate kidney reabsorption, and generating a specific urinary metabolic pattern. We believe that these observations will be useful to further study the MSG effects in humans.

Graphical Abstract

1. Introduction

Monosodium glutamate (MSG) is commercially produced as a flavor enhancer in processed foods and home cooking and its use is exponentially increasing worldwide [1]. Although the Food and Drug Administration (FDA) have classified MSG as a safe food ingredient [2], its safety as a food additive is still debated. For example, cross-sectional and longitudinal studies from our group and others have revealed that the consumption of MSG is associated with human metabolic syndrome [3], obesity [4,5], and arterial hypertension [6], although conflicting evidence is also available [7,8].
The metabolic effects of both oral and parenteral MSG seem to be consistent in animal models, with data available on the effects of MSG on the liver [9,10,11], pancreas [12,13] and kidney [9,14]. MSG causes alkaline urine in rats following long-term consumption [14]. Urine alkalinization using available alkalinizing agents such as potassium citrate (K citrate) [15,16] and sodium bicarbonate (NaHCO3) [17,18] is a common treatment for several medical conditions, with the latter used for treating patients who have acute metabolic acidosis or renal proximal tubular acidosis [19]. Of importance, potassium citrate has limitations in patients with hyperkalemia [20,21,22] and in long-term supplementation, and NaHCO3 may lead to adverse events such as systemic alkalosis [19].
Since alkalinizing agents should be used with caution in specific subjects, it is very important to identify whether MSG is also able to alkalinize urine, even though our previous observations revealed that a 9-month exposure to MSG did not affect the blood pH [14]. We herein report that oral MSG (resembling human intake) can alkalinize urine within two weeks and our 1H-NMR-based metabolomics approach revealed that MSG induced urinary metabolic profiles were similar to those of NaHCO3, an alkalinizing agent. We ultimately submit that urinary metabolites may be useful for monitoring dietary consumption, and thus predict MSG effects in human.

2. Materials and Methods

2.1. Chemicals and Animals

We used 99% pure food-grade MSG (Ajinomoto, Japan), NaCl (RCI Labscan, Thailand), NaHCO3 (BDH, Visalia, CA, USA) and 40 6-week old male Wistar rats (approximately 200 g) obtained from the National Laboratory Animal Center (Salaya, Mahidol University, Bangkok, Thailand). Animals were housed for 2 weeks in the Northeast Laboratory Animal Center and maintained under standard conditions (temperature: 23 ± 2 °C, humidity (RH): 30–60%, brightness: 350–400 Lux and 12 h/12 h dark/light cycle) with standard rat chow pellets (Perfect Companion Group, Bangkok, Thailand). All experiments were performed in accordance with the guidelines of KKU animal ethics (AEKKU-NELAC 5/2558).

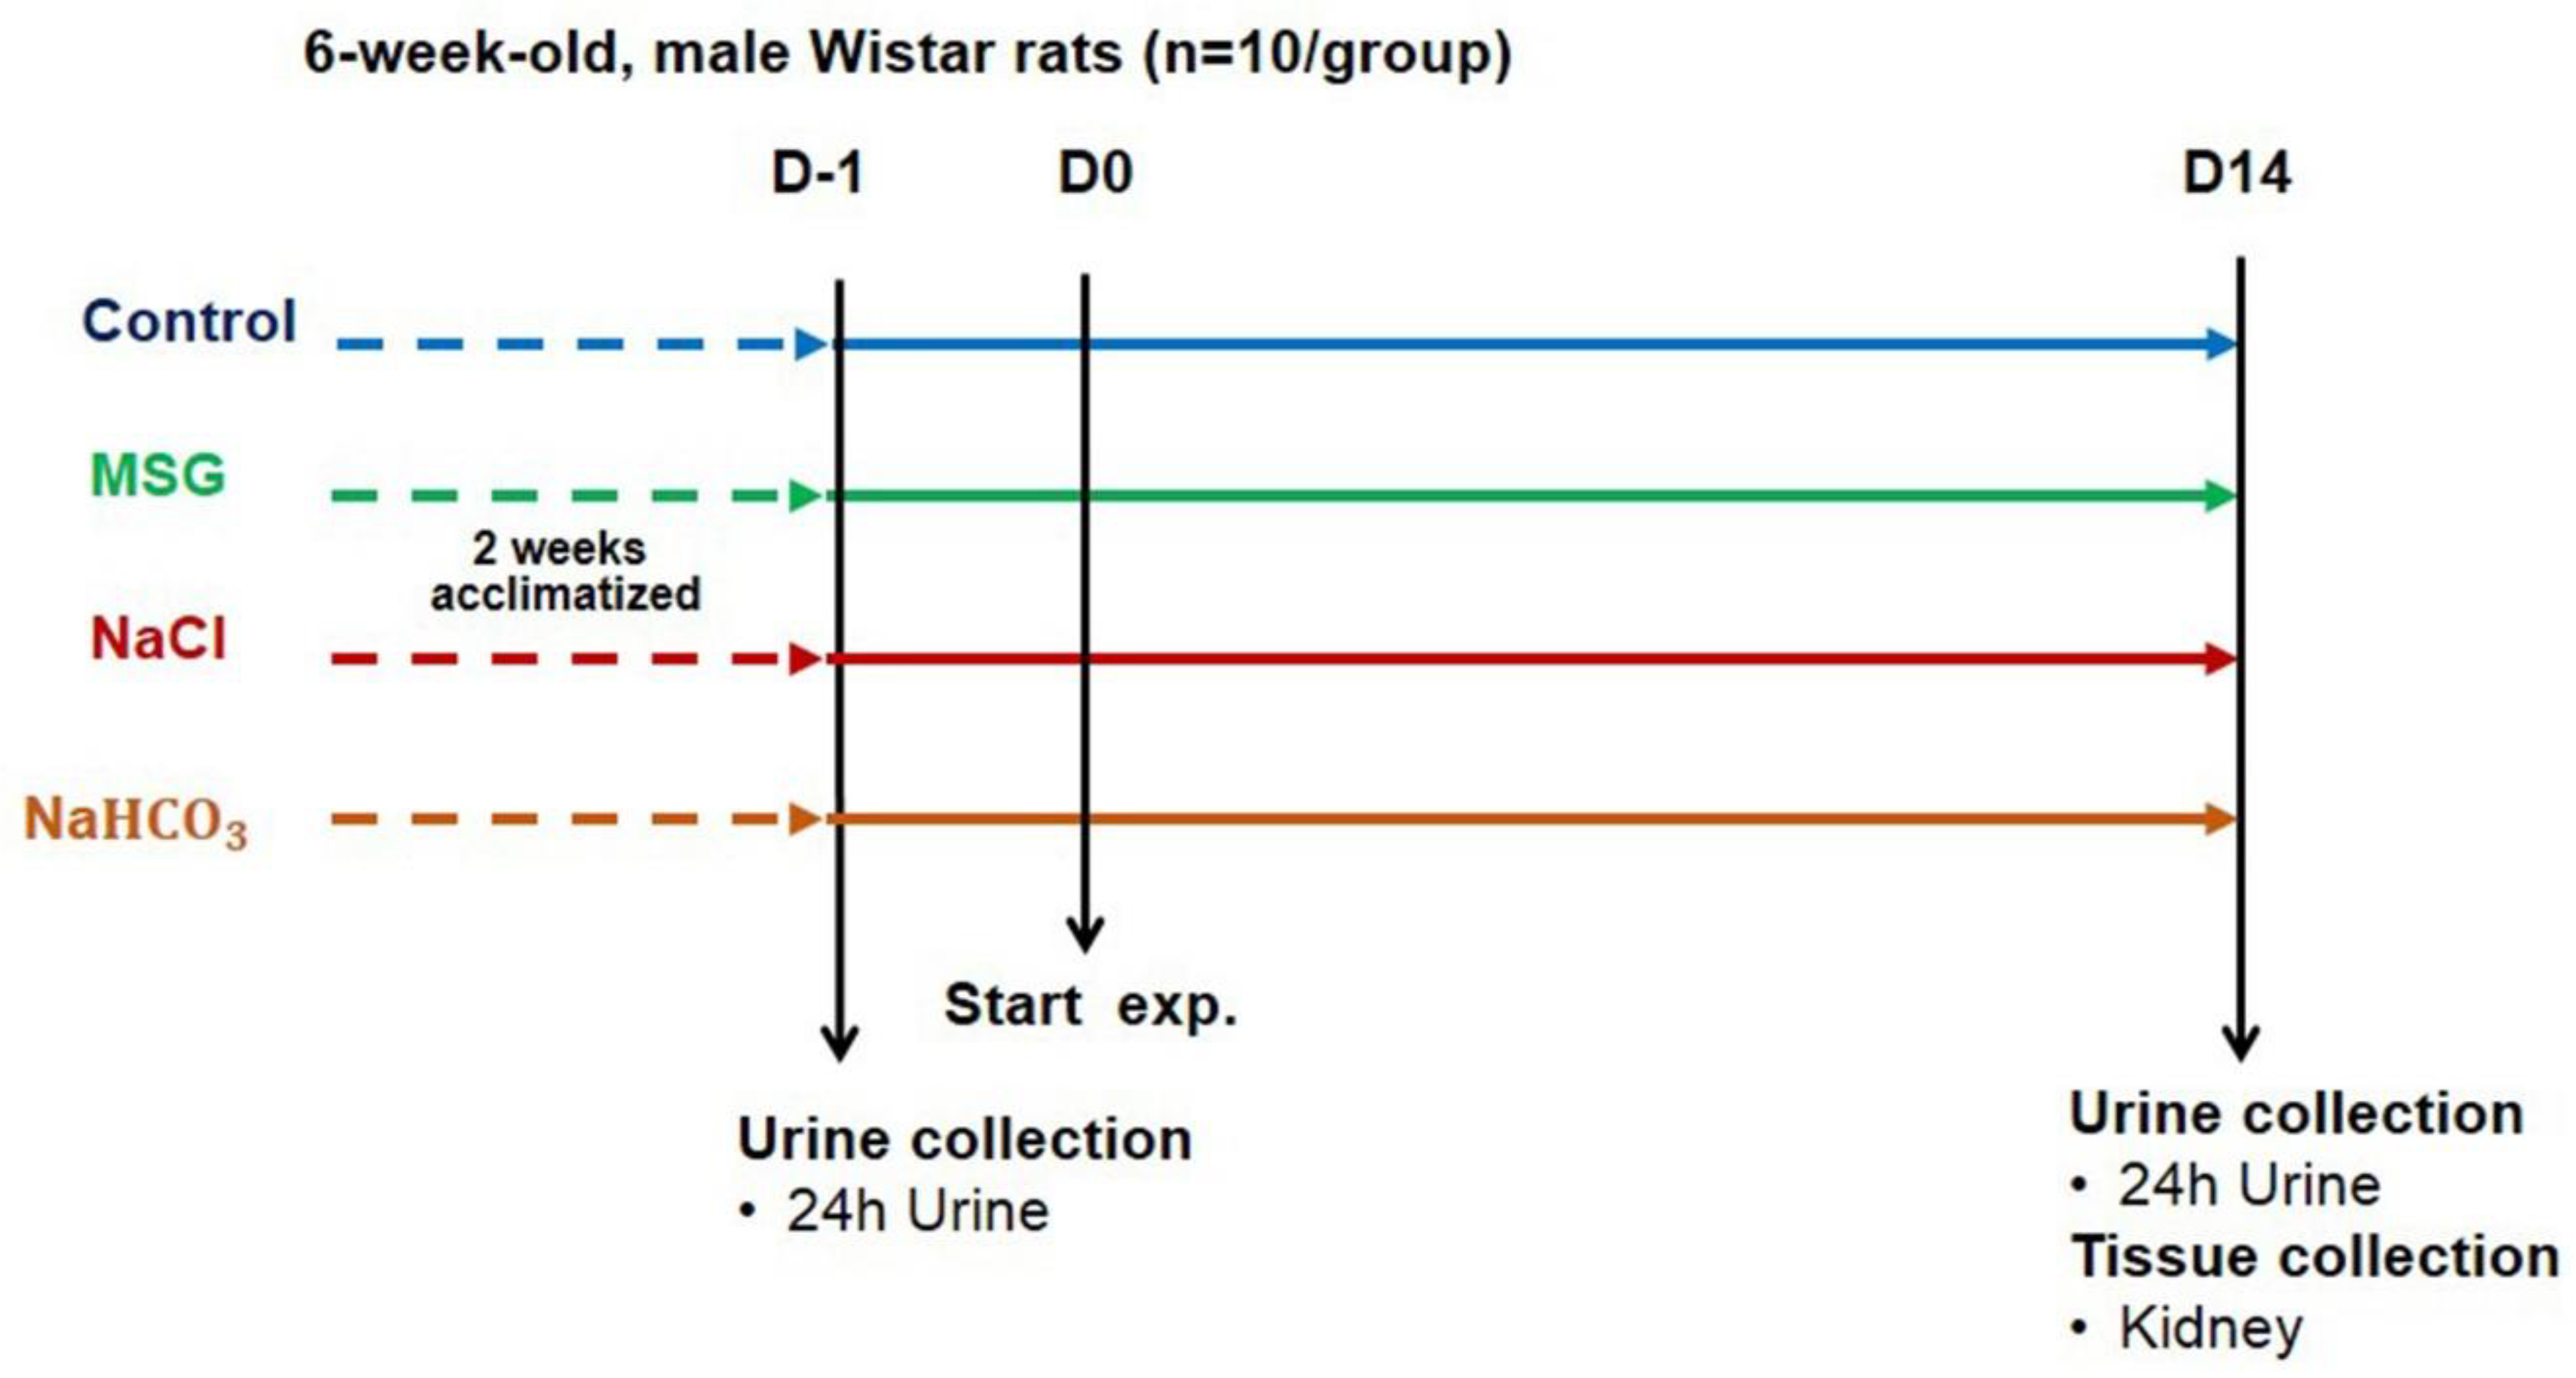
2.2. Experimental Design

Rats were assigned into 4 groups, (1) receiving drinking water, (2) receiving water with 1 g% MSG added, (3) receiving water with 0.34 g% NaCl added, which equivalent to the sodium in group 2, and (4) receiving water with 2.4 g% NaHCO3 as a positive control for the alkalinizing agent treated group (Figure 1). Animals were allowed to access water and food ad libitum and daily water intake was recorded weekly. Food intake (g/day) was measured every 2 weeks. Rats were housed in individual stainless steel metabolic cages for urine sample collection. Urinary samples (24-h urine) were collected one day before (D1) and 14 days after the experiment (D14) and kept at −80 °C until analyzed. At the end of the experiment (D14), all animals were sacrificed using carbon dioxide after 12-h fasting. Kidneys were dissected, washed with normal saline, and divided into cortex and medulla layer, then transferred to cryotubes with TRIzol® Reagent (Invitrogen, Waltham, MA, USA), dipped in liquid nitrogen and stored at −80 °C for gene expression analysis.

2.3. Urine Analysis

The 24 h urine was thawed at room temperature and analyzed for urine pH and urine electrolyte (sodium, potassium, chloride and bicarbonate). All samples were analyzed at the laboratory services in Srinagarind Hospital, Khon Kaen University and using automatic machine under standard protocol.

2.4. Sample Preparation for 1H-NMR Spectroscopic Analysis

Urine samples were thawed at room temperature and centrifuged at 18,000× g, 4 °C, for 10 min. Then 100 µL of the urine supernatant was transferred to a new tube and mixed with 300 µL of deuterium oxide (D2O) (Sigma Aldrich, Gillingham Dorset, UK) and 250 µL of 0.2 M sodium phosphate buffer containing 0.1% sodium trimethylsilyl-[2,2,3,3-2H4]-propionate (TSP), 100% D2O and 3 mM sodium azide. The sample was vortexed briefly, and then 600 µL of the mixture was transferred to NMR glass tubes (Wilmad-labglass, Vineland, NJ, USA) with an outer diameter of 5 mm pending NMR analysis.

2.5. 1H-Nuclear Magnetic Resonance Spectroscopic Analysis of Urine

Urinary samples were analyzed using a Bruker 600 MHz spectrometer (Bruker Avance III, Bruker Biospin, Rheinstetten, Germany) at a 1H frequency of 600.13 MHz with a temperature of 300 K. A standard one-dimensional (1-D) NMR pulse sequence (recycle delay [RD]-90°-t1-90°-tm-90°-acquire free induction decay) was used t1 was fixed to 3 µs. The suppression of the water peak was achieved by selective irradiation during recycle delay of 2 s and mixing time (tm) of 100 ms. The 90 degree-pulse was adjusted to approximately 10 µs. A total of 128 scans were recorded into 64 K data points with a spectral width of 20 ppm [23].

2.6. Data Pre-Processing and Multivariate Statistical Analysis

The urinary spectra were calibrated to the TSP peak (δ1H 0.00), phased and baseline corrected using TopSpin 3.0 (Bruker, Rheinstetten, Germany). The pre-processed spectra were imported into MATLAB software (MathWorks, R2014a, Natrick, MA, USA) and digitized with a resolution of 0.0005 ppm. Spectral regions containing the TSP peak (δ1H −1.00–0.005), water (δ1H 4.70–4.90) and urea (δ1H 5.71–6.00) were removed. Normalization using the probabilistic quotient method [24] and peak alignment using recursive segment-wise peak alignment (RSPA) [25] were applied to the remaining spectral data. Unsupervised principal component analysis (PCA) with unit variance (UV) scaling method was initially performed in order to identify any obvious clustering or outliers to unassigned treatment groups. The orthogonal-signal correction-projection to latent structures-discriminant analysis (O-PLS-DA) was then used to investigate the metabolic difference between the control and MSG groups. The O-PLS-DA models are evaluated by the R2X and Q2Y values, representing the fitness and predictivity of the model, respectively. A two-tailed heteroscedastic t-test with Benjamini-Hochberg correction was also used to determine the statistical significance of differences between the groups. Statistical Total Correlation Spectroscopy (STOCSY), the Human Metabolome Database (HMDB version 3.6, Edmonton, AB, Canada) [26,27] and in-house chemical shift databases were used for metabolite identification.

2.7. Gene Expression Analysis

Total RNAs were extracted from cortex and medulla layers of kidney using TRIzol® reagent method. Tissues weighing about 50–100 mg were preserved in TRIzol® and incubated at room temperature (RT) for 3 min, 200 µL of chloroform was added the mixture was shaken vigorously and incubated at RT for 3 min. The reaction was then centrifuged at 12,000× g for 15 min at 4 °C. The upper aqueous phase (60%) was transferred to a new 1.5 mL sterile tube, 500 μL of isopropanol was added, mixed well, and then incubated at RT for 10 min and centrifuged at 12,000× g for 10 min at 4 °C. The supernatant was discarded while the pellet was washed by 70% ethanol and centrifuged at 7500× g for 5 min at 4 °C (twice). The pellet was air dried at RT, re-suspended in 30–50 μL of DEPC water and then the pellet was dissolved by keeping it at 55 °C for 15 min. Total RNA were stored at −80 °C until used.
RNA concentration was measured with OD at 260 nm and reverse-transcribed to complementary DNA (cDNA) using the high capacity reverse transcription Kit (Applied Biosystem, Foster, CA, USA). Obtained cDNA was diluted to 20 ng/μL and stored at −20 °C until used. Gene expression analysis was determined by real-time PCR, using beta-actin (ACTB) as the internal control for normalization [28], in LightCycler® 480 real-time PCR system (Roche Applied Science, Mannheim, Germany). Each PCR condition containing 2.5 μM of primers (forward and reverse primers), cDNA 50 ng/μL, and 2X LightCycler® 480 SYBR green I master mix. The amplification was initiated by pre-incubation at 95 °C for 10 min, followed by 40 cycles at 94 °C for 30 s, 60 °C for 30 s, 72 °C for 1 min, and 79 °C for 0.1 s. Each sample was prepared in duplicate sample and the crossing point (Cp) cycle was calculated and presented as mean ± SEM values. The gene expression levels were determined and the 2−∆cp value; Δcp = Cptarget − Cpactin was calculated. Primers for all genes were designed using NCBI with a least one exon-exon junction in the target (Table 1).

2.8. Statistical Analysis

The statistical analysis of the urinary analysis and gene expression were reported as mean ± SEM per group of animals and the differences between groups was compared for statistical significance by Student’s t-test. Moreover, all comparisons of gene expression with p-values < 0.05 were considered as statistically significant.

3. Results

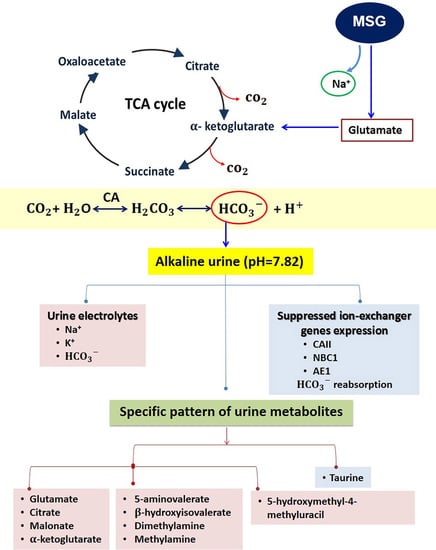
3.1. MSG Exhibits Urine Chemistries Similar to Alkaline Loading
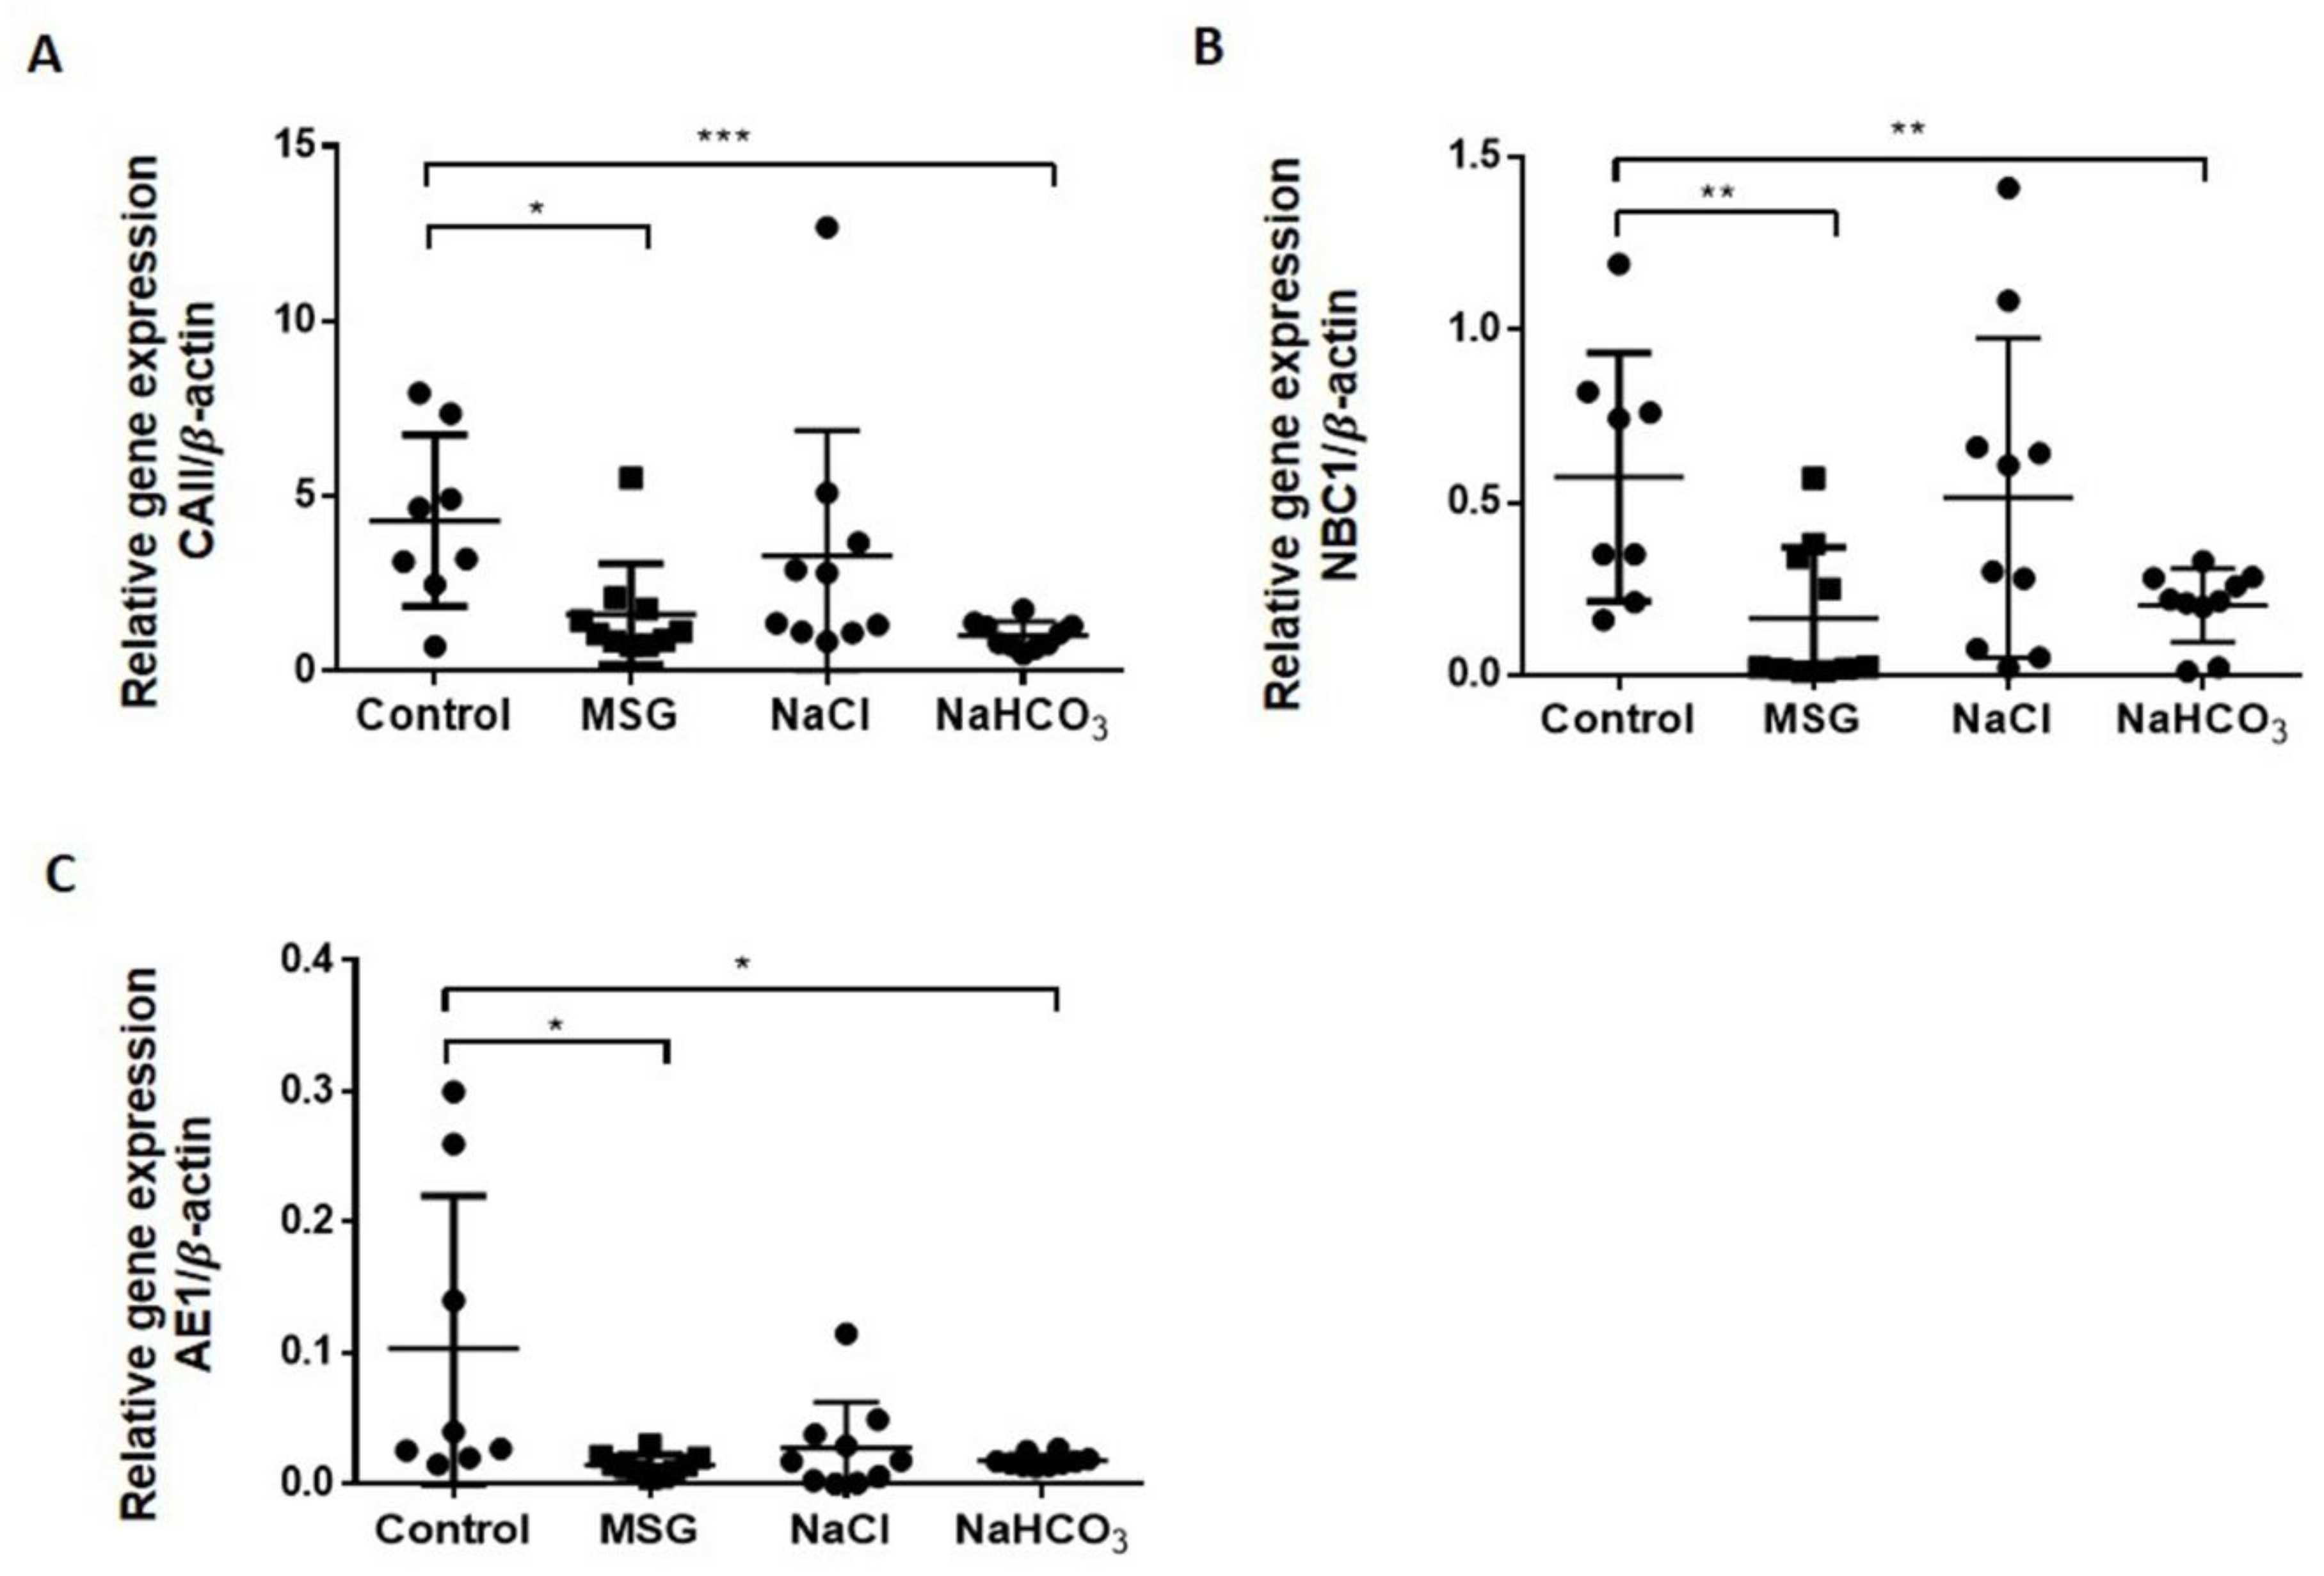
After two weeks, urine analyses indicated that the MSG and NaHCO3 treatment groups had significantly higher urine pH compared to controls (pH = 7.82, pH = 9.13, and pH = 6.86, respectively; *** p < 0.001 for both groups vs. controls), whereas no significant difference in urinary pH was observed between NaCl-treated rats (pH = 6.93) and controls (Figure 2A). Urinary Na+ was significantly higher in MSG, NaCl, and NaHCO3-treated rats compared to controls (3.1 ± 0.17, 4.59 ± 0.31, 8.84 ± 1.12, 1.28 ± 0.05 mEq/day, respectively). Urinary K+ excretion in MSG group (1.83 ± 0.06 mEq/day) was significantly higher, whereas the NaHCO3-treated group (1.04 ± 0.12 mEq/day) was the opposite to controls (1.50 ± 0.10 mEq/day). Significantly higher levels of HCO3 were also revealed in MSG (0.95 ± 0.16 mEq/day) and NaHCO3-treated rats (1.14 ± 0.20 mEq/day) but not in NaCl-treated rats (0.20 ± 0.06 mEq/day) compared to controls (0.19 ± 0.02 mEq/day). No significant differences in urinary Cl- were observed between MSG (3.70 ± 0.26 mEq/day) and NaCl-treated rats (3.85 ± 0.31 mEq/day), whereas significantly lower levels were found in NaHCO3-treated rats (1.88 ± 0.20 mEq/day) compared to control rats (4.32 ± 0.28 mEq/day) (Figure 2B).

3.2. MSG Suppresses HCO3 Reabsorption Similar to Alkaline Loading

We used RT-PCR to analyze the expression of the 11 ion-exchanger genes that contribute to the acid-base regulation in the kidney cortex, including the expression of genes related to glutamine/glutamate metabolism and the TCA cycle (Table 1). Three important ion-exchanger genes involved in HCO3 reabsorption (CAII, NBC1 and AE1) were suppressed in MSG-treated rats (1.62 ± 0.456, 0.16 ± 0.065, 0.01 ± 0.002, respectively), similar to that of the NaHCO3 group (1.02 ± 0.125, 0.20 ± 0.034, 0.02 ± 0.001, respectively) when compared to controls (4.30 ± 0.865, 0.57 ± 0.127, 0.10 ± 0.041, respectively) (Figure 3). No significant differences were observed for CAII, NBC1, and AE1 mRNA expression levels in NaCl-treated rats compared to controls. Glutamine/glutamate metabolism and TCA cycle gene expression in kidney were unchanged in MSG, NaCl and NaHCO3 compared to control groups (data shown in Supplementary Materials).

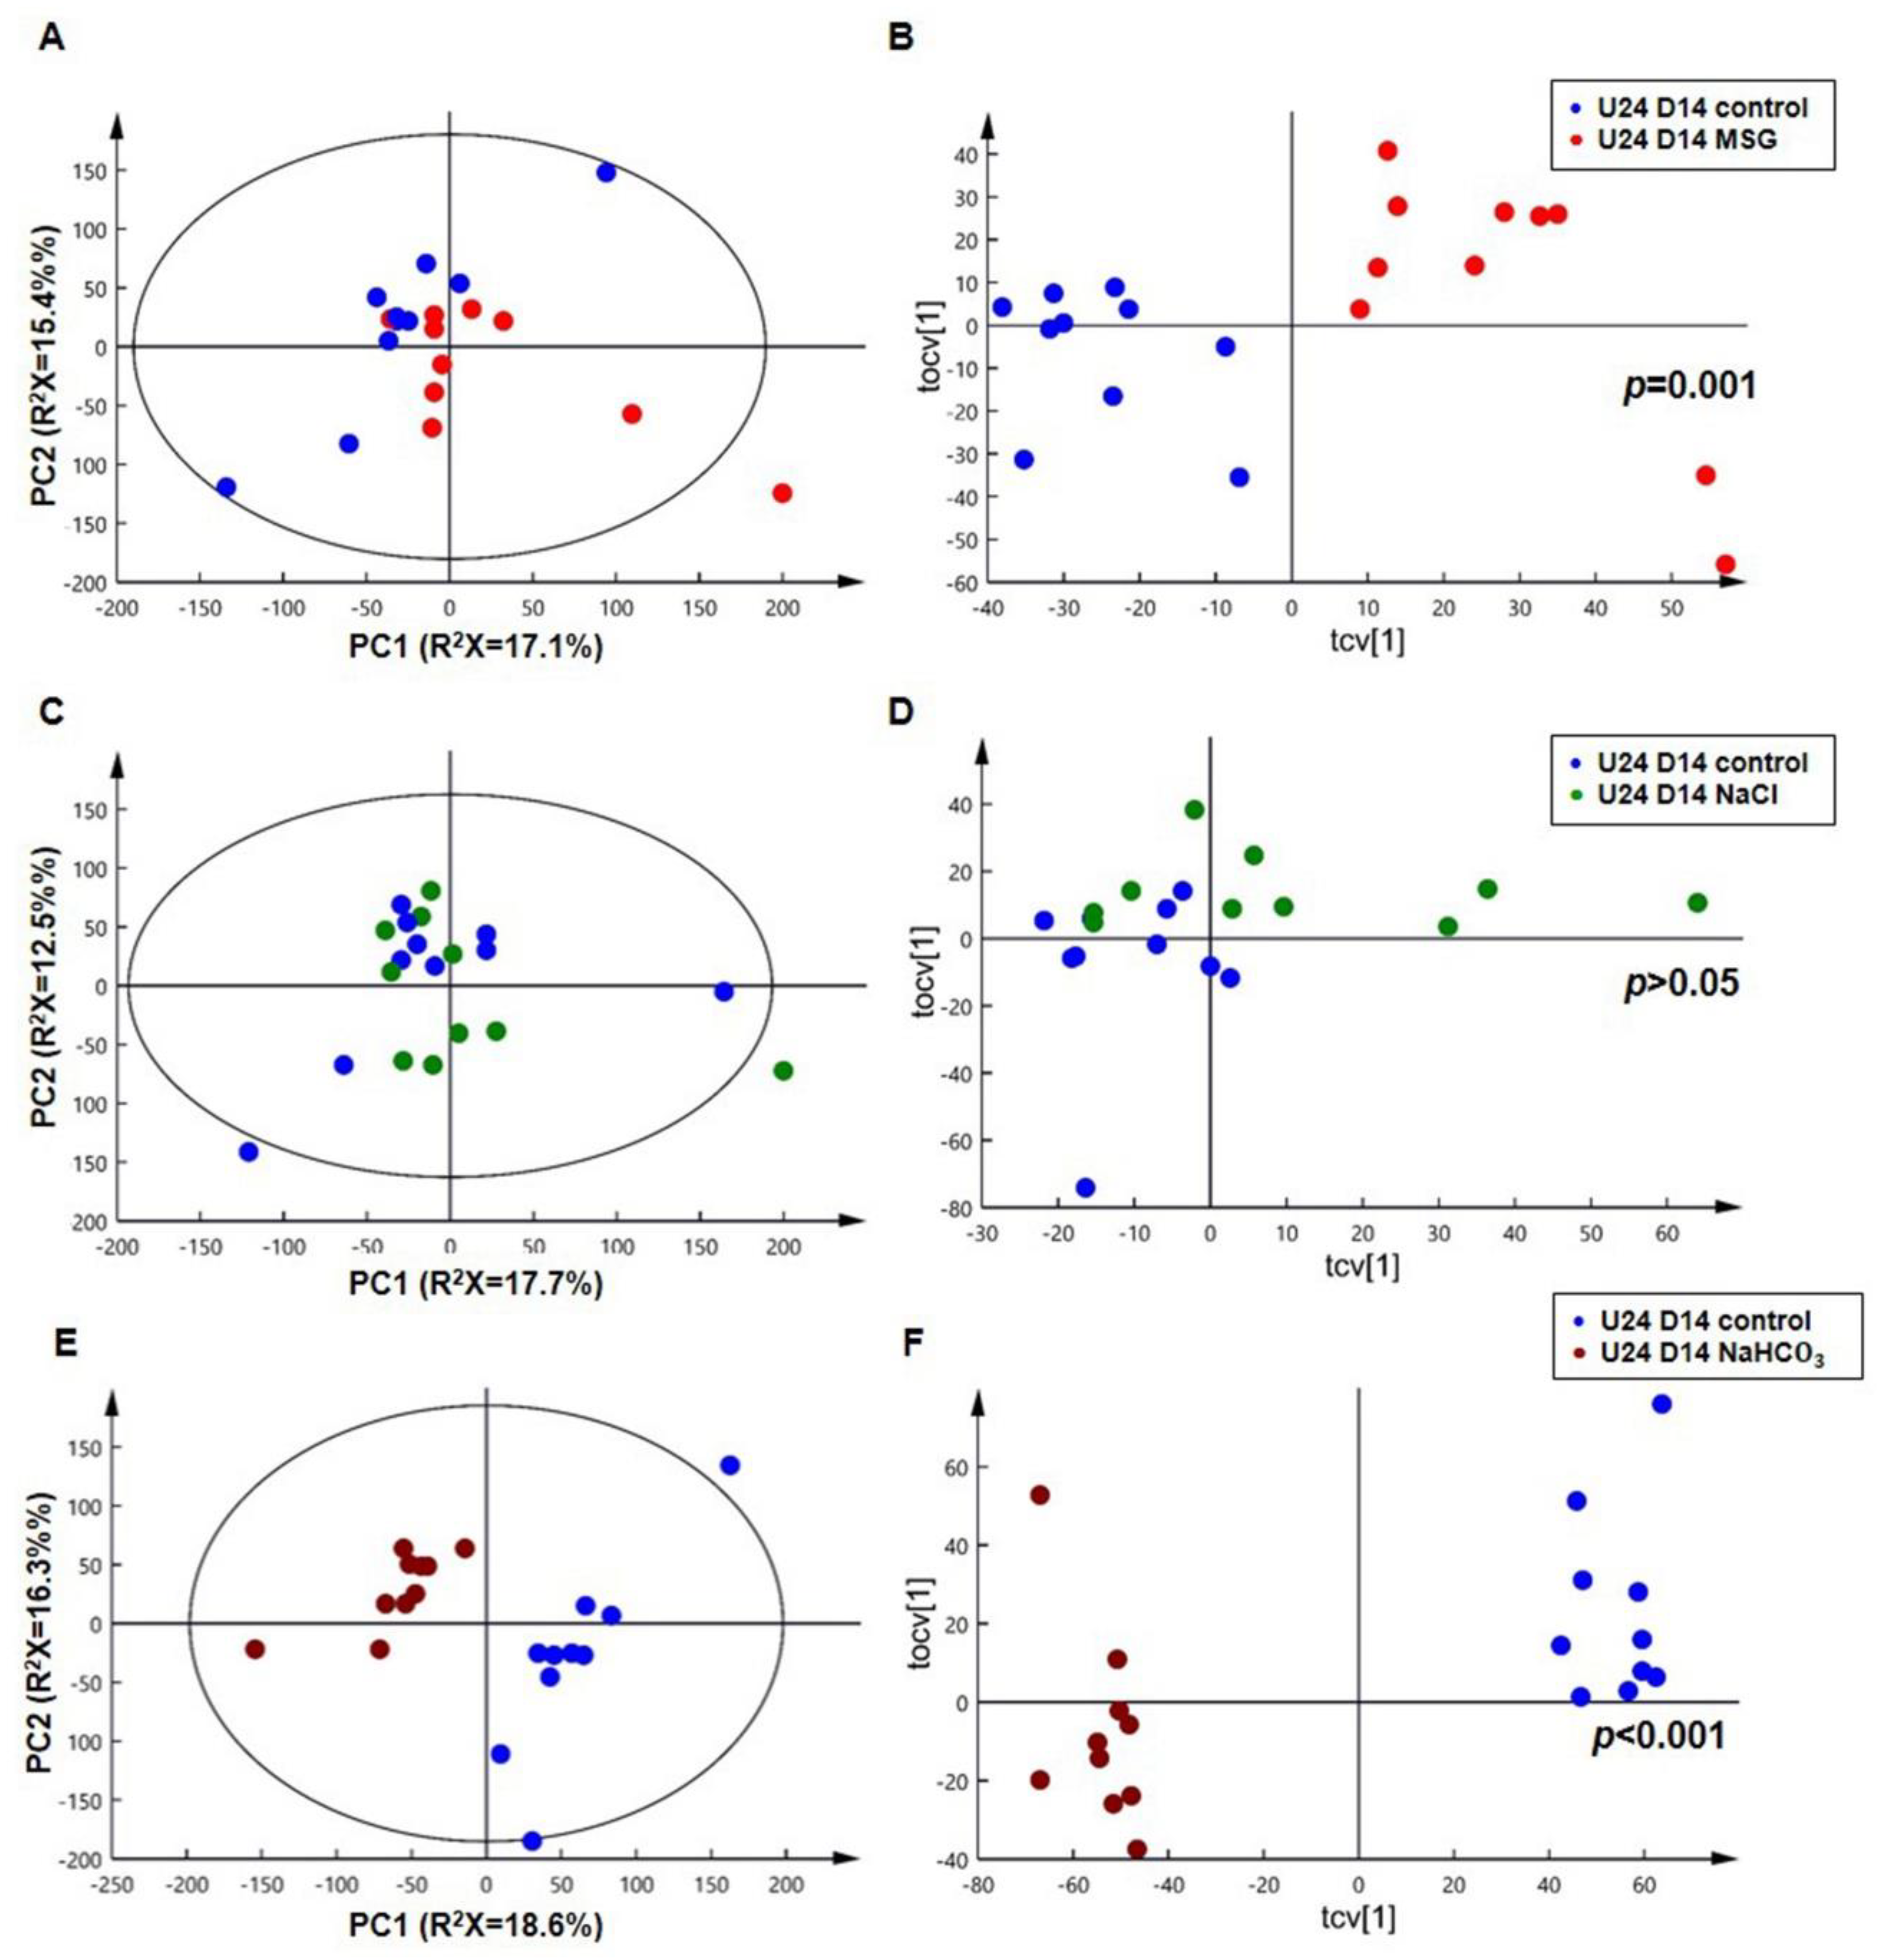
3.3. MSG Shares Common Urinary Metabolic Profile Resembling Alkaline Loading

1H-NMR spectra of 24 h urine samples from control, MSG, NaCl and NaHCO3-treatment groups at day 14 (D14) are plotted in Figure 4. Differences in raw spectra between 4.5 ppm and 5.25 ppm were observed in MSG and NaHCO3-treated rats compared to NaCl and control rats (Figure 4). Urinary NMR spectral data was analyzed using PCA and the scores plot is shown in Figure 5. No clustering based on the treatment group was observed in the PCA scores plot (Figure 5A). However, the O-PLS-DA cross-validated scores plot shows a clear separation between controls and MSG at D14 (Figure 5B) with a permutation p-value of 0.001, R2X of 44%, and Q2Y of 0.75. Based on PCA and O-PLS-DA, no clustering or separation was observed between controls and the NaCl-treated group (Figure 5C,D). In contrast, clear clustering and complete separation were observed based on PCA and O-PLS-DA, between controls and the NaHCO3-treated group (Figure 5E,F) with a permutation p value of 0.001, R2X of 47%, and Q2Y of 0.95.
The detected urinary metabolite changes are summarized in Table 2 and changes in the urinary profiles were observed in MSG and NaHCO3-treated rats when compared with control animals. In particular, nine urinary metabolites, including glutamate, citrate, malonate, alpha-ketoglutarate, beta-hydroxyisovalerate, 5-aminovalerate, 5-hydroxymethyl-4-methyluracil, dimethylamine, and methylamine were significantly higher in the MSG treatment group, whereas taurine was significantly higher in control animals. Seven urinary metabolites, including glutamate, citrate, malonate, alpha-ketoglutarate, 5-aminovalerate, beta-hydroxyisovalerate, and taurine found in the MSG group were also observed in theNaHCO3 group. However, three metabolites, i.e., 3-carboxy-2-methyl-3-oxopropanamine, succinate, and choline were significantly higher in the NaHCO3 group compared to controls. The 5-hydroxymethyl-4-methyluracil metabolite was significantly altered in both MSG and NaHCO3, but in opposite ways. The similar effects of MSG and NaHCO3 supplementation on urine pH, urine electrolytes, ion exchanger gene expression and urinary metabolic markers are illustrated in Table 3.

4. Discussion

The kidney plays a dominant role in maintaining the homeostasis of plasma and urine pH by acid excretion and HCO3 reabsorption via ion exchangers. We report for the first time that short-term MSG consumption can induce alkaline urine similar to the NaHCO3 supplementation group, and the MSG group has a similar metabolic profile with potentially similar clinical consequences.
First, we believe that the increased urinary pH in the MSG group is secondary to its glutamate composition, not to sodium itself. This is supported by the urinary pH of the NaCl group which does not increase as the amount of Na intake increased compared to the MSG group (Figure 2B). Our investigation of MSG-induced alkaline urine confirms previous data from rats receiving 20% dietary MSG for 5 weeks [29], fed 6% MSG for 3 months [30], or receiving 2 mg/g body weight MSG/day in drinking water for 9 months [14]. We also demonstrated that the MSG-treated group has similar urine electrolyte levels when compared to the NaHCO3-treated group. MSG-treated rats have significantly higher urinary Na+, K+ and HCO3, as observed with longer supplementation [14]. The excretion of Na+, K+ and HCO3 in MSG-treated rats may suggest these elements are excessively uptaken or overproduced by metabolic pathways. Our current hypothesis is that the excess of Na+ derives directly from the overconsumption of MSG as show in the NaCl group, whereas HCO3 and K+ derive from the catabolism of glutamate and other nutrient metabolism. The byproduct of glutamate metabolism might be similar to that of potassium citrate that generates HCO3 via its catabolic citric acid cycle, leading to the alkaline urinary pH [31]. Alkaline urine may influence the kidney’s capacity to secrete or reabsorb metabolites leading to the suppression of bicarbonate reabsorption in the kidney.
Second, the expression of ion exchangers involved in bicarbonate reabsorption in the kidney cortex of MSG-treated rats is decreased (Figure 3) and this indicates lower bicarbonate reabsorption in MSG-treated rats, similar to that of the NaHCO3 supplemented group, which was not observed in NaCl-treated animals. The decreased NBC1 expression in the proximal tubule has been reported in rats treated with NaHCO3 loading [32] while the immunostaining intensity of AE1 was increased in metabolic acidosis and reduced in metabolic alkalosis [33].
Third, the 1H-NMR-based metabolomics approach revealed that the MSG-induced urinary metabolic profiles were similar to the NaHCO3 group. In particular, MSG consumption generates a pattern of metabolites with higher levels of glutamate, alpha-ketoglutarate, malonate, citrate, beta-hydroxyisovalerate and 5-aminovalerate, whereas the level of taurine is lower than rats receiving normal drinking water, as also observed in rats receiving NaHCO3. A quick observation of the four treatment groups showed differences in the raw spectra between 4.5 ppm and 5.25 ppm in MSG and NaHCO3-treated rats compared to NaCl and control rats (Figure 4). In agreement with these raw spectra, data analysis using PCA and O-PLS-DA revealed that both MSG and NaHCO3 treatments show a clustering difference between treatment and control rats (Figure 5).
Ten metabolites that relate to MSG consumption are linked to catabolism of amino acids, fatty acids, vitamin, pyrimidine and citric acid cycle. For example, alpha-ketoglutarate and citrate are intermediates of the citric acid cycle. Alpha-ketoglutarate and glutamate are from transamination reactions. Beta-hydroxyisovalerate and 5-aminovalerate are leucine and lysine degradation products, respectively. Malonate is from either aspartate or fatty acid catabolism. Taurine is from cysteine or serine metabolism whereas dimethylamine and methylamine are from choline metabolism. Lastly, 5-hydroxymethyl-4-methyluracil, a marker of DNA damage, is from pyrimidine catabolism [34].
The characterization of the 10 metabolites observed in the MSG treatment group and the 11 metabolites in the NaHCO3 treatment group, with some shared changes (Table 2), warrants a more detailed discussion. The higher levels of amino acid (glutamate) and amino acids-related metabolites (alpha-ketoglutarate, malonate, citrate, beta-hydroxyisovalerate and 5-aminovalerate) found in the urine of MSG and NaHCO3-treated groups compared to controls may be related to their urine alkalinizing condition. Glutamate kidney re-uptake requires glutamate transporters [35], which co-transport H+ with glutamate, and high urinary pH may inhibit glutamate re-uptake in the renal brush border, thus contributing to the higher urinary glutamate. Alkaline urine also inhibits metabolite reabsorption in the case of alpha-ketoglutarate, malonate and citrate in the MSG and NaHCO3-treated rats. Based on their pKa, the alkaline urine may deprotonate alpha-ketoglutarate1-, malonate1−, and citrate2− to form alpha-ketoglutarate2−, malonate2−, and citrate3−, respectively, and affect their reabsorption [36,37]. In metabolic/respiratory alkalosis, alpha-ketoglutarate excretion increases to levels that are several times above normal [38,39,40]. Under alkaline loading conditions, the blood concentration of alpha-ketoglutarate rises and net alpha-ketoglutarate reabsorption in the proximal tubule and Henle’s loop is decreased, making the alpha-ketoglutarate secretion increase in the same nephron segments, and leading to a significant increase in the urinary excretion of alpha-ketoglutarate [41,42]. Moreover, citrate, alpha-ketoglutarate, and succinate competitively inhibit the transport of each other [43].
A similar scenario is also hypothesized for malonate as citrate and malonate compete for reabsorption in the renal tubular cell [44]. The higher level of a lysine degradation product, 5-aminovalerate and leucine degradation product, beta-hydroxyisovalerate found in MSG and NaHCO3 supplemented animals may relate to tissue injury. The beta-hydroxyisovalerate itself is a metabotoxin [45]. Taurine is a normal constituent of human urine, however, its level varies markedly among individuals depending on age, hormones, stress, and diet [46], however, our control and MSG, NaHCO3 groups had comparable characteristics, except for MSG and NaHCO3 intake. The decrease in taurine in the MSG and NaHCO3 groups may relate to either taurine use, secondary to oxidative stress, or to its degradation, as observed in chronic renal failure [47], glomerulonephritis, diabetic nephropathy, chronic renal failure, and acute kidney injury [48].
In fact, excessive renal metabolism of glutamate can be a source of ROS. Moreover, chronic MSG intake is associated with decreased levels of antioxidant enzymes and increased lipid peroxidation; leading to cellular and functional damage of the kidneys [49]. Such effects are not observed with sodium bicarbonate (NaHCO3). The distinct urinary metabolites between MSG and NaHCO3 are methylamine and dimethylamine, which were only observed in MSG-treated animals. Methylamine and dimethylamine are metabolites from the gut microbiota [50,51]. This gut microbiota is also found in human intestine [52]. MSG may alter the gut microbiota community, specifically those that are involved in methylamine metabolism. However, the connection of MSG consumption and methylamine metabolism needs to be further explored.
In summary, MSG consumption may resemble alkali loading (Table 3), causing suppression of ion exchangers responsible for bicarbonate absorption which correspond to the higher excretion of urinary bicarbonate in MSG and NaHCO3-treated rats. MSG consumption exhibits similar features to alkaline loading, causing alkaline urine, leading to alteration of di- and tricarboxylic metabolites, i.e., glutamate, alpha-ketoglutarate, citrate, and malonate reabsorption in the kidney. We may also speculate that MSG itself may alter the gut microbiome to catabolize dietary molecules, such as amino acids and choline and urinary metabolites could be potential markers for MSG consumption in animals and should now be studied in humans. However, there are two limitations in this present study to be aware of: the effects of MSG consumption were only tested in male animals, and the frequency of obtaining MSG was every time the animals drunk water. This behavior differs from humans because humans receiving MSG only consume MSG at their regular meal times, which is usually 2-3 times a day.

5. Conclusions

Short-term MSG consumption exhibits similar effects as consuming NaHCO3, an alkalinizing agent; it induces alkaline urine and alters the ion-exchanger gene expression that relates to bicarbonate kidney reabsorption. This implies that MSG consumption induces metabolic changes with a pattern of urinary metabolites, which may be used for monitoring MSG exposure in humans.

Supplementary Materials

The following are available online at https://www.mdpi.com/2218-273X/9/10/542/s1, Figure S1–S3. Changes in mRNA expression of ion exchanger genes in the cortex (left panel) and medulla (right panel) layers of rat kidney after 14 days of MSG, NaCl and NaHCO3 supplementation compared to controls; Figure S4. Changes in mRNA expression of glutamate and glutamine metabolism in the cortex (left panel) and medulla (right panel) layers of rat kidney after 14 days of MSG, NaCl and NaHCO3 supplementation compared to control; Figure S5. Changes in mRNA expression of TCA cycle in the cortex (left panel) and medulla (right panel) layers of rat kidney after 14 days of MSG, NaCl and NaHCO3 supplementation compared to controls.

Author Contributions

Conceptualization, U.C.; Data curation, K.N., J.V.L., H.A. and U.C.; Formal analysis, K.N. and U.C.; Funding acquisition, J.V.L. and U.C.; Investigation, K.N., J.V.L., J.P. and U.C.; Methodology, K.N., J.P., C.W., R.T., A.S. and U.C.; Project administration, U.C.; Resources, J.V.L., S.A. and C.S.; Software, J.V.L.; Supervision, C.W., R.T., A.S., S.A. and C.S.; Validation, J.V.L.; Writing—original draft, K.N.; Writing—review & editing, J.V.L., C.S. and U.C.

Funding

Thanks to The Royal Golden Jubilee Ph.D. Program (RGJ-Ph.D. Program) (PHD/0124/2558) for giving the Scholarship to KN. Thanks to the Chronic Kidney Disease Northeast Thailand (CKDNET) research group (CKDNET 2561), the Invitation research fund (I56205, IN62137), the Faculty of Medicine, Khon Kaen University for the research fund to UC. JVL is funded by a MRC New Investigator Grant (MR/P002536/1) and ERC Starting Grant (715662).

Acknowledgments

We would like to thank the Northeast Laboratory Animal Center at KKU for animal husbandry facilities. Thanks to Imperial College London for technical support.

Conflicts of Interest

This study was performed in collaboration between Khon Kaen University and Imperial College London. All authors declare no other conflict of interest.

References

  1. Beyreuther, K.; Biesalski, H.K.; Fernstrom, J.D.; Grimm, P.; Hammes, W.P.; Heinemann, U.; Kempski, O.; Stehle, P.; Steinhart, H.; Walker, R. Consensus meeting: Monosodium glutamate—An update. Eur. J. Clin. Nutr. 2007, 61, 304–313. [Google Scholar] [CrossRef] [PubMed]
  2. Walker, R.; Lupien, J.R. The safety evaluation of monosodium glutamate. J. Nutr. 2000, 130, 1049S–1052S. [Google Scholar] [CrossRef] [PubMed]
  3. Insawang, T.; Selmi, C.; Cha’on, U.; Pethlert, S.; Yongvanit, P.; Areejitranusorn, P.; Boonsiri, P.; Khampitak, T.; Tangrassameeprasert, R.; Pinitsoontorn, C.; et al. Monosodium glutamate (MSG) intake is associated with the prevalence of metabolic syndrome in a rural Thai population. Nutr. Metab. (Lond.) 2012, 9, 50. [Google Scholar] [CrossRef] [PubMed]
  4. He, K.; Zhao, L.; Daviglus, M.L.; Dyer, A.R.; Van Horn, L.; Garside, D.; Zhu, L.; Guo, D.; Wu, Y.; Zhou, B.; et al. Association of monosodium glutamate intake with overweight in Chinese adults: The INTERMAP Study. Obes. (Silver Spring) 2008, 16, 1875–1880. [Google Scholar] [CrossRef] [PubMed]
  5. He, K.; Du, S.; Xun, P.; Sharma, S.; Wang, H.; Zhai, F.; Popkin, B. Consumption of monosodium glutamate in relation to incidence of overweight in Chinese adults: China Health and Nutrition Survey (CHNS). Am. J. Clin. Nutr. 2011, 93, 1328–1336. [Google Scholar] [CrossRef] [PubMed] [Green Version]
  6. Shi, Z.; Yuan, B.; Taylor, A.W.; Dai, Y.; Pan, X.; Gill, T.K.; Wittert, G.A. Monosodium glutamate is related to a higher increase in blood pressure over 5 years: Findings from the Jiangsu Nutrition Study of Chinese adults. J. Hypertens. 2011, 29, 846–853. [Google Scholar] [CrossRef] [PubMed]
  7. Shi, Z.; Luscombe-Marsh, N.D.; Wittert, G.A.; Yuan, B.; Dai, Y.; Pan, X.; Taylor, A.W. Monosodium glutamate is not associated with obesity or a greater prevalence of weight gain over 5 years: Findings from the Jiangsu Nutrition Study of Chinese adults. Br. J. Nutr. 2010, 104, 457–463. [Google Scholar] [CrossRef]
  8. Thu Hien, V.T.; Thi Lam, N.; Cong Khan, N.; Wakita, A.; Yamamoto, S. Monosodium glutamate is not associated with overweight in Vietnamese adults. Public Health Nutr. 2013, 16, 922–927. [Google Scholar] [CrossRef]
  9. Ortiz, G.G.; Bitzer-Quintero, O.K.; Zarate, C.B.; Rodriguez-Reynoso, S.; Larios-Arceo, F.; Velazquez-Brizuela, I.E.; Pacheco-Moises, F.; Rosales-Corral, S.A. Monosodium glutamate-induced damage in liver and kidney: A morphological and biochemical approach. Biomed. Pharmacother. 2006, 60, 86–91. [Google Scholar] [CrossRef]
  10. Nakanishi, Y.; Tsuneyama, K.; Fujimoto, M.; Salunga, T.L.; Nomoto, K.; An, J.L.; Takano, Y.; Iizuka, S.; Nagata, M.; Suzuki, W.; et al. Monosodium glutamate (MSG): A villain and promoter of liver inflammation and dysplasia. J. Autoimmun. 2008, 30, 42–50. [Google Scholar] [CrossRef]
  11. Collison, K.S.; Maqbool, Z.; Saleh, S.M.; Inglis, A.; Makhoul, N.J.; Bakheet, R.; Al-Johi, M.; Al-Rabiah, R.; Zaidi, M.Z.; Al-Mohanna, F.A. Effect of dietary monosodium glutamate on trans fat-induced nonalcoholic fatty liver disease. J. Lipid Res. 2009, 50, 1521–1537. [Google Scholar] [CrossRef] [PubMed] [Green Version]
  12. Nakayama, D.; Magami, Y.; Azuma, T.; Inokuchi, H.; Furukawa, M.; Ohyashiki, J.; Yoshimoto, T.; Mizuguchi, J.; Moriyasu, F.; Kawai, K.; et al. Turnover of acinar and islet cells in the pancreas of monosodium glutamate-treated obese mice. Obes. Res. 2003, 11, 87–94. [Google Scholar] [CrossRef] [PubMed]
  13. Boonnate, P.; Waraasawapati, S.; Hipkaeo, W.; Pethlert, S.; Sharma, A.; Selmi, C.; Prasongwattana, V.; Cha’on, U. Monosodium Glutamate Dietary Consumption Decreases Pancreatic beta-Cell Mass in Adult Wistar Rats. PLoS ONE 2015, 10, e0131595. [Google Scholar] [CrossRef] [PubMed]
  14. Sharma, A.; Prasongwattana, V.; Cha’on, U.; Selmi, C.; Hipkaeo, W.; Boonnate, P.; Pethlert, S.; Titipungul, T.; Intarawichian, P.; Waraasawapati, S.; et al. Monosodium glutamate (MSG) consumption is associated with urolithiasis and urinary tract obstruction in rats. PLoS ONE 2013, 8, e75546. [Google Scholar] [CrossRef] [PubMed]
  15. Pak, C.Y.; Fuller, C.; Sakhaee, K.; Preminger, G.M.; Britton, F. Long-term treatment of calcium nephrolithiasis with potassium citrate. J. Urol. 1985, 134, 11–19. [Google Scholar] [CrossRef]
  16. Mattle, D.; Hess, B. Preventive treatment of nephrolithiasis with alkali citrate—A critical review. Urol. Res. 2005, 33, 73–79. [Google Scholar] [CrossRef] [PubMed]
  17. Mirrakhimov, A.E.; Ayach, T.; Barbaryan, A.; Talari, G.; Chadha, R.; Gray, A. The Role of Sodium Bicarbonate in the Management of Some Toxic Ingestions. Int. J. Nephrol. 2017, 2017. [Google Scholar] [CrossRef] [PubMed]
  18. Rouch, J.A.; Burton, B.; Dabb, A.; Brown, V.; Seung, A.H.; Kinsman, K.; Holdhoff, M. Comparison of enteral and parenteral methods of urine alkalinization in patients receiving high-dose methotrexate. J. Oncol. Pharm. Pract. 2017, 23, 3–9. [Google Scholar] [CrossRef]
  19. Adeva-Andany, M.M.; Fernandez-Fernandez, C.; Mourino-Bayolo, D.; Castro-Quintela, E.; Dominguez-Montero, A. Sodium bicarbonate therapy in patients with metabolic acidosis. Sci. World J. 2014, 2014, 627673. [Google Scholar] [CrossRef]
  20. Browning, J.J.; Channer, K.S. Hyperkalaemic cardiac arrhythmia caused by potassium citrate mixture. Br. Med. J. (Clin. Res. Ed.) 1981, 283, 1366. [Google Scholar] [CrossRef]
  21. Wilson, R.G.; Farndon, J.R. Hyperkalaemic cardiac arrhythmia caused by potassium citrate mixture. Br. Med. J. (Clin. Res. Ed.) 1982, 284, 197–198. [Google Scholar] [CrossRef] [PubMed]
  22. Choi, S.K.; Kim, Y.G.; Yoo, K.H.; Lee, D.G.; Min, G.E.; Lee, H.L. Hyperkalemic cardiac arrhythmia resulting from short-term ingestion of potassium citrate for the management of ureter stones. Urolithiasis 2016, 44, 283–284. [Google Scholar] [CrossRef] [PubMed]
  23. Beckonert, O.; Coen, M.; Keun, H.C.; Wang, Y.; Ebbels, T.M.; Holmes, E.; Lindon, J.C.; Nicholson, J.K. High-resolution magic-angle-spinning NMR spectroscopy for metabolic profiling of intact tissues. Nat. Protoc. 2010, 5, 1019–1032. [Google Scholar] [CrossRef] [PubMed]
  24. Dieterle, F.; Ross, A.; Schlotterbeck, G.; Senn, H. Probabilistic quotient normalization as robust method to account for dilution of complex biological mixtures. Application in 1H NMR metabonomics. Anal. Chem. 2006, 78, 4281–4290. [Google Scholar] [CrossRef] [PubMed]
  25. Veselkov, K.A.; Lindon, J.C.; Ebbels, T.M.; Crockford, D.; Volynkin, V.V.; Holmes, E.; Davies, D.B.; Nicholson, J.K. Recursive segment-wise peak alignment of biological (1)h NMR spectra for improved metabolic biomarker recovery. Anal. Chem. 2009, 81, 56–66. [Google Scholar] [CrossRef] [PubMed]
  26. Wishart, D.S.; Jewison, T.; Guo, A.C.; Wilson, M.; Knox, C.; Liu, Y.; Djoumbou, Y.; Mandal, R.; Aziat, F.; Dong, E.; et al. HMDB 3.0—The Human Metabolome Database in 2013. Nucleic Acids Res. 2013, 41, D801–D807. [Google Scholar] [CrossRef] [PubMed]
  27. Wishart, D.S.; Knox, C.; Guo, A.C.; Eisner, R.; Young, N.; Gautam, B.; Hau, D.D.; Psychogios, N.; Dong, E.; Bouatra, S.; et al. HMDB: A knowledgebase for the human metabolome. Nucleic Acids Res. 2009, 37, D603–D610. [Google Scholar] [CrossRef]
  28. Nowik, M.; Lecca, M.R.; Velic, A.; Rehrauer, H.; Brandli, A.W.; Wagner, C.A. Genome-wide gene expression profiling reveals renal genes regulated during metabolic acidosis. Physiol. Genom. 2008, 32, 322–334. [Google Scholar] [CrossRef] [Green Version]
  29. Wen, C.P.; Hayes, K.C.; Gershoff, S.N. Effects of dietary supplementation of monosodium glutamate on infant monkeys, weanling rats, and suckling mice. Am. J. Clin. Nutr. 1973, 26, 803–813. [Google Scholar] [CrossRef]
  30. De Groot, A.P.; Feron, V.J.; Immel, H.R. Induction of hyperplasia in the bladder epithelium of rats by a dietary excess of acid or base: Implications for toxicity/carcinogenicity testing. Food Chem. Toxicol. 1988, 26, 425–434. [Google Scholar] [CrossRef]
  31. Krieger, N.S.; Asplin, J.R.; Frick, K.K.; Granja, I.; Culbertson, C.D.; Ng, A.; Grynpas, M.D.; Bushinsky, D.A. Effect of Potassium Citrate on Calcium Phosphate Stones in a Model of Hypercalciuria. J. Am. Soc. Nephrol. 2015, 26, 3001–3008. [Google Scholar] [CrossRef] [PubMed] [Green Version]
  32. Amlal, H.; Chen, Q.; Greeley, T.; Pavelic, L.; Soleimani, M. Coordinated down-regulation of NBC-1 and NHE-3 in sodium and bicarbonate loading. Kidney Int. 2001, 60, 1824–1836. [Google Scholar] [CrossRef] [PubMed] [Green Version]
  33. Sabolic, I.; Brown, D.; Gluck, S.L.; Alper, S.L. Regulation of AE1 anion exchanger and H(+)-ATPase in rat cortex by acute metabolic acidosis and alkalosis. Kidney Int. 1997, 51, 125–137. [Google Scholar] [CrossRef] [PubMed]
  34. Cadet, J.; Delatour, T.; Douki, T.; Gasparutto, D.; Pouget, J.P.; Ravanat, J.L.; Sauvaigo, S. Hydroxyl radicals and DNA base damage. Mutat. Res. 1999, 424, 9–21. [Google Scholar] [CrossRef]
  35. Hediger, M.A. Glutamate transporters in kidney and brain. Am. J. Physiol. 1999, 277 Pt 2, F487–F492. [Google Scholar] [CrossRef]
  36. Brennan, S.; Hering-Smith, K.; Hamm, L.L. Effect of pH on citrate reabsorption in the proximal convoluted tubule. Am. J. Physiol. 1988, 255 Pt 2, F301–F306. [Google Scholar] [CrossRef]
  37. Kaufman, A.M.; Kahn, T. Complementary role of citrate and bicarbonate excretion in acid-base balance in the rat. Am. J. Physiol. 1988, 255 Pt 2, F182–F187. [Google Scholar] [CrossRef]
  38. Balagura, S.; Pitts, R.F. Renal Handling of Alpha-Ketoglutarate by the Dog. Am. J. Physiol. 1964, 207, 483–494. [Google Scholar] [CrossRef]
  39. Balagura, S.; Stone, W.J. Renal tubular secretion of alpha ketoglutarate in dog. Am. J. Physiol. 1967, 212, 1319–1326. [Google Scholar] [CrossRef]
  40. Cohen, J.J.; Wittmann, E. Renal utilization and excretion of alpha-ketoglutarate in dog: Effect of alkalosis. Am. J. Physiol. 1963, 204, 795–811. [Google Scholar] [CrossRef]
  41. Ferrier, B.; Martin, M.; Baverel, G. Reabsorption and secretion of alpha-ketoglutarate along the rat nephron: A micropuncture study. Am. J. Physiol. 1985, 248 Pt 2, F404–F412. [Google Scholar] [CrossRef]
  42. Martin, M.; Ferrier, B.; Baverel, G. Transport and utilization of alpha-ketoglutarate by the rat kidney in vivo. Pflug. Arch. 1989, 413, 217–224. [Google Scholar] [CrossRef] [PubMed]
  43. Packer, R.K.; Curry, C.A.; Brown, K.M. Urinary organic anion excretion in response to dietary acid and base loading. J. Am. Soc. Nephrol. 1995, 5, 1624–1629. [Google Scholar] [PubMed]
  44. Grollman, A.P.; Harrison, H.C.; Harrison, H.E. The renal excretion of citrate. J. Clin. Investig. 1961, 40, 1290–1296. [Google Scholar] [CrossRef] [PubMed]
  45. 3-Hydroxyisovaleric Acid (HMDB0000754). Available online: http://www.hmdb.ca/metabolites/HMDB0000754 (accessed on 3 August 2019).
  46. Thompson, D.E.; Vivian, V.M. Dietary-induced variations in urinary taurine levels of college women. J. Nutr. 1977, 107, 673–679. [Google Scholar] [CrossRef]
  47. Bergstrom, J.; Alvestrand, A.; Furst, P.; Lindholm, B. Sulphur amino acids in plasma and muscle in patients with chronic renal failure: Evidence for taurine depletion. J. Intern. Med. 1989, 226, 189–194. [Google Scholar] [CrossRef]
  48. Chesney, R.W.; Han, X.; Patters, A.B. Taurine and the renal system. J. Biomed. Sci. 2010, 17 (Suppl. 1), S4. [Google Scholar] [CrossRef]
  49. Paul, M.V.; Abhilash, M.; Varghese, M.V.; Alex, M.; Nair, R.H. Protective effects of alpha-tocopherol against oxidative stress related to nephrotoxicity by monosodium glutamate in rats. Toxicol. Mech. Methods 2012, 22, 625–630. [Google Scholar] [CrossRef]
  50. Zhu, Y.; Jameson, E.; Parslow, R.A.; Lidbury, I.; Fu, T.; Dafforn, T.R.; Schafer, H.; Chen, Y. Identification and characterization of trimethylamine N-oxide (TMAO) demethylase and TMAO permease in Methylocella silvestris BL2. Environ. Microbiol. 2014, 16, 3318–3330. [Google Scholar] [CrossRef]
  51. Messenger, J.; Clark, S.; Massick, S.; Bechtel, M. A review of trimethylaminuria: (fish odor syndrome). J. Clin. Aesthet. Dermatol. 2013, 6, 45–48. [Google Scholar]
  52. Rath, S.; Heidrich, B.; Pieper, D.H.; Vital, M. Uncovering the trimethylamine-producing bacteria of the human gut microbiota. Microbiome 2017, 5, 54. [Google Scholar] [CrossRef] [PubMed]
Figure 1. A schematic diagram showing the experimental design and sample collection.
Biomolecules 09 00542 g001
Figure 2. Urine pH (A) and electrolytes (B) after treatment in male Wistar rats supplemented with 1 g% MSG, 0.34 g% NaCl and 2.4 g% NaHCO3 (n = 10 per group). Data are shown as mean ± SEM and p-values calculated by Student’s t-test (* p < 0.05, ** p < 0.01, *** p < 0.001).
Biomolecules 09 00542 g002
Figure 3. Changes in mRNA expression of ion exchanger genes in cortex layers of rat kidney after 14 days of MSG (n = 10), NaCl (n = 10) and NaHCO3 (n = 10) supplementation compared to controls (n = 8) (A) CAII, (B) NBC1, (C) AE1. Data are shown as mean ± SEM relative gene expression with beta-actin, * p < 0.05; ** p < 0.01; *** p < 0.001. Abbreviations: CAII: carbonic anhydrase2, NBC1: Na+-HCO3 co-transporter1; AE1: anion exchanger1.
Biomolecules 09 00542 g003
Figure 4. The 600 MHz 1H-NMR spectra of urinary samples collected over 24 h at day 14 from (A) control, (B) MSG-fed, (C) NaCl-fed, and (D) NaHCO3 –fed rats (n = 10 per group).
Biomolecules 09 00542 g004
Figure 5. PCA scores plots (left panel) and O-PLS-DA cross-validated scores plots (right panel) of 24-h urine at day 14 (U24 D14). (A,B): control (blue) vs. MSG (red); (C,D): control (blue) vs. NaCl (green); (E,F): control (blue) vs. NaHCO3 (brown) (n = 10 per group).
Biomolecules 09 00542 g005
Table 1. Oligonucleotide primers used for gene expression analysis.
GroupGenePrimerOligonucleotide SequenceProduct Size (bp)
Internal ControlBeta-actinForwardACAACCTTCTTGCAGCTCCT197
ReverseACCCATACCCACCATCACAC
Ion-ExchangerAE1ForwardTCCCGCTACACTCAGGAGAT118
ReverseCAGGGGCATAGCTCTCTTGT
CAIIForwardTGCTGGAATGTGTGACCTGG101
ReverseCTCCCCCTCCGAATTGAAGT
Na+/K+ ATPaseForwardCAGCACTCGCTTTCCCTCG189
ReverseGGCCAGGCAGCCATAGAATA
H+/K+ ATPaseForwardCCCCTGAGTACGTGAAGTTCG168
ReverseCCACAACCACAGCAATGAGTG
CA IVForwardGTCTATGCCCTCAAGCACCA114
ReverseTTGGGCTCCTTGGCTTGAAT
NBC1ForwardGCTATCCCGGCTTTGCTAGT153
ReverseGAAGGAGCACACCACCATGA
NHE3ForwardACTGCTTAATGACGCGGTGA160
ReverseGAAGGCGAAGATGACACCA
RhbgForwardTGTCCGCTACAACCACGAAA96
ReverseTGGAAGCTTGGGTAGCGAAA
RhcgForwardCTCTTCGGCGTGTTCGTGC200
ReverseCCTACAGCGCTGAACCCATA
PendrinForwardAGAACCAGGCCAAATCCAGG83
ReverseCAAGTCTACGCATGGCCTCA
H+-ATPaseForwardTGCCTTCAGTTAGAGAGGCCGTGA147
ReverseTGCCAAGAAGAGTCTGGGACAAGG
Glutamate and Glutamine MetabolismXC-sysForwardGCATCGTCCTTTCAAGGTGC150
ReverseAAGAGGTAATACGCCGGGAC
EAAC1ForwardAAACCACGGTGCTCGGTC127
ReverseACCGGCGTTTGTGAGGAATC
GlutaminaseForwardTGGGCATGATGTGTTGGTCT199
ReverseTACGCAGCAAACAGGAGGTT
SNAT3ForwardGGAACGGAGTGCTGAACGTG83
ReverseCTGAAACCACCCCAGAGCAC
PEPCKForwardTGCCATGGCTGCTATGTACC89
ReverseTTTGGATGCTACGGCATGGT
TCA CycleCitrate synthaseForwardTGCTACACAGAACCTCAGTTCAC243
ReverseATCTGACACGTCTTTGCCGA
AconitaseForwardCCTGTACCTGACACTGCTCG223
ReverseTGTAGTCAGAGGGGTCAGCA
IDHForwardTGCAAAAATATCCCCCGCCT144
ReverseGCCATCCTTTGGGGTGAAGA
Abbreviations: AE1: anion exchanger1, CAII: carbonic anhydrase2, CAIV: carbonic anhydrase4, NBC1: Na+-HCO3 co-transporter1, NHE3: Na+/H+ exchanger3, Rhbg: Rh family B glycoprotein, Rhcg: Rh family C glycoprotein, XC-sys: Cysteine/glutamate transporter, EAAC1: Excitatory amino acid transporter1, SNAT3: Na+-coupled neutral amino acid transporter3, PEPCK: Phosphoenolpyruvate carboxykinase, IDH: Isocitrate dehydrogenase.
Table 2. Relative changes at 2 weeks of 24 h urine metabolites in control, MSG and NaHCO3 rats (n = 10 per group) using the 1H-NMR profiles.
MetabolitesChemical Shift (Multiplicity)MSG and NaHCO3 Induced Metabolic Changes Compared to ControlThe Acid Dissociation Constant (pKa)
(−) Control vs. (+) MSG R2X = 44%, Q2Y = 0.75, p = 0.001(−) Control vs. (+) NaHCO3
R2X = 47%, Q2Y = 0.95,
p = 0.001
3-carboxy-2-methyl-3-oxopropanamine1.08 (d); 2.49 (m); 3.19(m); 3.56 (m); 3.72 (m)-(*0.95)(∆3.33 × 10⁻¹⁰)
Beta-hydroxyisovalerate1.28 (s)(*0.77)(∆6.19 × 10⁻⁵)(*0.89)(∆1.83 × 10⁻⁷)pKa1 = 4.55
5-aminovalerate1.68 (m); 2.21 (t); 3.02 (t)(*0.79)(∆3.35 × 10⁻⁵)(*0.95)(∆1.38 × 10⁻¹⁰)pKa1 = 4.27, pKa2 = 10.77
5-hydroxymethyl-4-methyluracil1.98 (s); 4.42 (s)(*0.83)(∆5.84 × 10⁻⁶)(*−0.84)(∆4.15 × 10⁻⁶)pKa1 = 9.87
Glutamate2.02 (m); 2.34 (m); 3.76 (m)(*0.85)(∆2.31 × 10⁻⁶)(*0.88)(∆2.91 × 10⁻⁷)pKa1 = 2.19, pKa2 = 4.25, pKa3 = 9.67
Succinate2.41 (s)-(*0.87)(∆8.10 × 10⁻⁷)pKa1 = 4.16, pKa2 = 5.61
Alpha-ketoglutarate2.44 (t); 3.01 (t)(*0.75)(∆1.37 × 10⁻⁴)(*0.89)(∆1.46 × 10⁻⁷)pKa1 = 2.47, pKa2 = 4.68
Citrate2.54 (d); 2.66 (d)(*0.87)(∆5.10 × 10⁻⁷)(*0.96)(∆4.63 × 10⁻¹¹)pKa1 = 3.14, pKa2 = 4.77, pKa3 = 6.39
Methylamine2.61 (s)(*0.52) (∆0.019)-pKa1 = 10.63
Dimethylamine2.77 (s)(*0.71)(∆4.76 × 10⁻⁴)-pKa1 = 2.36, pKa2 = 10.21
Malonate3.11 (s)(*0.74)(∆2.17 × 10⁻⁴)(*0.97)(∆1.66 × 10⁻¹²)pKa1 = 2.85, pKa2 = 5.70
Choline3.21 (s); 3.52 (m); 4.07 (m)-(*0.80)(∆2.70 × 10⁻⁵)pKa1 = 13.9
Taurine3.25 (t); 3.43 (t)(*−0.73)(∆2.69 × 10⁻⁴)(*−0.80)(∆2.80 × 10⁻⁵)pKa1 = 1.15, pKa2 = 9.06
R2X and Q2Y show the variance explained and predicted by each model while P values for all models were derived from the permutation test (n = 1000). (+) indicates a higher correlation, whereas (−) indicates a lower correlation of urinary metabolite after MSG and NaHCO3 consumption. (*) represents the correlation value and (∆) represents the p value of the specific peak. The bolded chemical shift per metabolite was used as the STOCSY driver peak and for deriving the correlation and p-value. (* p < 0.05, ** p < 0.01, *** p < 0.001). Abbreviations: s, singlet; d, doublet; t, triplet; m, multiplet, pKa; acid dissociation constant. Note; (−) Control vs. (+) NaCl, R2X = 38%, Q2Y = 0.12, p = 0.433.
Table 3. The similar effects of MSG and NaHCO3 supplementation on urine pH, urine electrolytes, ion exchanger gene expression and urinary metabolic markers.
ControlMSGNaClNaHCO3
Urine pH--
Urine Electrolytes (HCO3)--
Ion exchanger gene expression
(HCO3 reabsorption, CAII, NBC1, AE1)
--
    Urinary metabolic markers
      Beta-hydroxyisovalerate
      5-aminovalerate
      Glutamate
      Alpha-ketoglutarate
      Citrate
      Malonate
--
Taurine--

