Article

Homologs and Transcriptional Isoforms of Dorsal Are Involved in the Response of Apis cerana to Ascosphaera apis Infection


1
College of Animal Science, Fujian Agriculture and Forestry University, Fuzhou 350002, China
2
College of Bee Science, Fujian Agriculture and Forestry University, Fuzhou 350002, China
3
National & Local United Engineering Laboratory of Natural Biotoxin, Fuzhou 350002, China
4
Apitherapy Research Institute of Fujian Agriculture and Forestry University, Fuzhou 350002, China
*
Authors to whom correspondence should be addressed.
These authors contributed equally to this work.
Biomolecules 2026, 16(9), 1223; https://doi.org/10.3390/biom16091223
Submission received: 29 June 2026 / Revised: 10 August 2026 / Accepted: 22 August 2026 / Published: 23 August 2026
(This article belongs to the Section Molecular Biology)

Abstract

Chalkbrood disease caused by Ascosphaera apis threatens honey bee brood, yet the transcriptional mechanisms that coordinate antifungal immune responses in Apis cerana remain unclear. Here, RNA interference (RNAi) was used to examine two Dorsal homologs and selected dorsal1 transcript isoforms during larval infection. A. apis inoculation increased dorsal1, dorsal2, and five antimicrobial peptide (AMP) transcripts in larval midguts, consistent with an infection-associated humoral response. Gene-level RNAi produced selective transcript responses: dorsal1 knockdown was accompanied by reduced apidaecin and defensin1 expression, whereas dorsal2 knockdown was accompanied principally by reduced defensin1 expression. abaecin, defensin2, and hymenoptaecin transcripts were not significantly altered after dorsal knockdown under the tested conditions. Isoform-targeted RNAi of RNA9886, RNA9888, and RNA9890 was likewise associated with distinct AMP transcript responses, with RNA9888 and RNA9890 more closely associated with defensin1. These transcript-level data support selective and partially overlapping Dorsal-associated regulation during the A. cerana larval response to A. apis, while direct differences in Dorsal protein abundance or activity remain to be established.

1. Introduction

Honey bees are essential pollinators of wild plants and agricultural crops, but their colonies are threatened by brood diseases that reduce larval survival and colony productivity [1,2]. Chalkbrood, caused by the filamentous fungal pathogen Ascosphaera apis, begins when larvae ingest spores that germinate in the gut and invade larval tissues [2]. Apis mellifera are highly susceptible to A. apis, whereas the Asian honey bee Apis cerana shows stronger resistance to this pathogen [3]. However, the molecular mechanisms that enable A. cerana larvae to mount an effective antifungal response remain incompletely defined. Recent transcriptomic and non-coding RNA studies have shown that A. apis infection reshapes immune and regulatory networks in A. cerana larvae [3,4], pointing to a need to connect these global responses with specific immune transcription factors.
Once fungal pathogens breach physical barriers such as the cuticle and peritrophic membrane, insects rely on cellular and humoral immune responses to restrict infection [2,5,6,7,8,9]. Antimicrobial peptides (AMPs), including abaecin, apidaecin, defensins, and hymenoptaecin in honey bees, are major effectors of the humoral response [10,11]. Recent honey bee work further indicates that gut-associated metabolites can prime humoral and cellular immunity, emphasizing the gut as an important immune-regulatory interface [12]. In insects, AMP transcription is primarily coordinated by NF-kappaB/Rel signaling pathways, especially Toll and immune deficiency (IMD) pathways [11,13,14,15,16]. The canonical Toll pathway is activated by fungal and Gram-positive bacterial cues and signals through Spatzle/Toll, MyD88, Tube, Pelle, and Cactus to release Dorsal/Dif family transcription factors, which then enter the nucleus and activate immune-effector genes [11,13,14,15,16,17]. Recent studies further support Toll signaling as a central determinant of antifungal defense while showing that Toll functions can vary across insect lineages and pathogen contexts [18,19,20]. In honey bees, the immune-gene repertoire is reduced relative to Drosophila but retains core Toll/IMD components [16]. Because the Drosophila Dif paralogue is absent or not clearly conserved in honey bees, Dorsal homologs are expected to be key NF-kappaB transcription factors linking Toll signaling to AMP expression [16,21]. In A. mellifera, RNAi-mediated silencing of dorsal genes reduces defensin1 expression [21], but whether A. cerana dorsal homologs regulate AMP responses to A. apis remains unknown.
Alternative splicing (AS) provides an additional layer through which a single gene can generate transcript isoforms with different regulatory or functional potential. In insects, immune-related AS can expand receptor or effector diversity, as illustrated by pathogen-recognition genes such as Dscam in Anopheles gambiae [22,23]. In A. cerana, recent full-length transcriptomic work has shown that AS and alternative polyadenylation can respond to environmental stress and vary with worker age [24], indicating that isoform usage may be condition-dependent. In our previous full-length transcriptome of A. cerana larval guts [25], gene5492 and gene8512 were annotated as embryonic polarity protein dorsal (GenBank Accession No. 107996080; hereafter dorsal1) and embryonic polarity protein dorsal-like (GenBank Accession No. 107999258; hereafter dorsal2), respectively. The dorsal1 gene produces seven transcript isoforms, whereas dorsal2 produces a single transcript. These annotations raise an important unresolved question: whether dorsal1 transcript isoforms are only structural variants or whether they contribute selectively to immune regulation during fungal infection.
RNA interference (RNAi) is a sequence-specific post-transcriptional silencing approach that has been widely used for functional studies in insects and honey bees [21,26,27,28,29,30,31]. Here, we used dsRNA feeding to silence dorsal1, dorsal2, and three selected dorsal1 transcripts (RNA9886, RNA9888, and RNA9890) in A. apis-inoculated A. cerana larvae. Knockdown efficiency and the transcript abundance of five AMP genes—abaecin, apidaecin, defensin1, defensin2, and hymenoptaecin—were subsequently examined. We hypothesized that perturbing the two Dorsal homologs and individual dorsal1 transcripts would be associated with distinct AMP transcript responses during fungal infection. This study therefore aimed to clarify the gene- and transcript-specific roles of Dorsal factors in the antifungal immunity of A. cerana larvae.

2. Materials and Methods

2.1. Insect Rearing and Fungal Inoculation

A. cerana larvae used in this study were obtained from three colonies maintained in the teaching apiary of the College of Bee Science, Fujian Agriculture and Forestry University (Fuzhou, China). Each colony contributed one independent biological replicate to every experimental group. Before larval collection, all three colonies were inspected and showed no clinical signs of chalkbrood. Midguts from representative larvae were dissected by gently pulling out the alimentary tract, homogenized, and examined by light microscopy; no A. apis spores or other pathogen-like structures were observed. The colonies were therefore considered clinically healthy for larval collection. A. apis was originally isolated from chalkbrood mummies and deposited in the China General Microbiological Culture Collection Center (CGMCC No. 40895). Purified A. apis spores were prepared as described previously [32] and maintained in the Honey Bee Protection Laboratory. Larval diets were prepared according to Feng et al. [33], pre-warmed to 35 °C, and added to 48-well culture plates (Figure 1). Two-day-old larvae were transferred at one larva per well and maintained at 35 °C and 90% relative humidity. At 3 days of age, each larva in the infection group received a single 50 µL ration containing A. apis spores at 1 × 10⁷ spores/mL; control larvae received the same volume of spore-free diet. Larvae were observed individually, and only larvae that completely consumed the 50 µL treatment ration were retained. Fresh diet was supplied once daily thereafter, and dead larvae were removed every 24 h. Midguts were collected at the time points specified for each assay, immediately frozen in liquid nitrogen, and stored at −80 °C until RNA extraction. For each treatment and sampling time, n = 3 denoted three colony-derived biological replicates, each prepared by pooling the midguts of three larvae (nine larvae per treatment per time point).

2.2. Bioinformatic Analysis and Gene-Structure Visualization

The gene structures of dorsal1 and dorsal2 were visualized using Integrative Genomics Viewer (IGV) [34]. The dorsal1 and dorsal2 annotations were based on the full-length transcriptome and genome annotation described in our previous study [25], together with the corresponding GenBank annotations for dorsal1 (accession No. 107996080) and dorsal2 (accession No. 107999258). The transcript isoforms analyzed in this study included dorsal1 isoforms RNA9886, RNA9888, RNA9889, RNA9890, RNA9891, ONT.3970.1, and ONT.3970.2, and the single annotated dorsal2 transcript. The transcript sequences are provided in Supplementary Data S1.

2.3. dsRNA Design, Synthesis, and RNAi

Gene-specific dsRNA fragments were designed to target either shared or transcript-specific regions of dorsal genes. The dsRNA-dorsal1 fragment targeted a region shared by dorsal1 transcript isoforms, whereas dsRNA-dorsal2 targeted dorsal2. Isoform-specific dsRNAs were designed for three dorsal1 transcripts, RNA9886, RNA9888, and RNA9890. The approximate dsRNA fragment lengths were 254 bp for dsRNA-dorsal1, 232 bp for dsRNA-dorsal2, 252 bp for dsRNA-RNA9886, 203 bp for dsRNA-RNA9888, and 203 bp for dsRNA-RNA9890. Partial cDNA fragments were amplified using primers containing T7 promoter sequences (Table S1), ligated into the pClone007 vector (Tsingke, Shanghai, China), and transformed into E. coli DH5α. Recombinant plasmids were verified by Sanger sequencing and extracted using the FastPure Plasmid Mini Kit (Vazyme, Nanjing, China). In vitro transcription was performed using the T7 RNAi Transcription Kit (Vazyme, Nanjing, China) to generate dsRNA-dorsal1, dsRNA-dorsal2, dsRNA-RNA9886, dsRNA-RNA9888, dsRNA-RNA9890, and dsRNA-egfp, which served as the negative control.
RNAi was performed by feeding dsRNA to larvae. Two-day-old larvae were transferred to 48-well culture plates and maintained at 35 °C and 90% relative humidity. At 3 days of age, each larva received a single 50 µL treatment ration. In A. apis-inoculated RNAi assays, the spores and the corresponding dsRNA treatment were included in the same ration. Every dsRNA species was supplied at 20 ng/µL: single-dsRNA treatments therefore contained 20 ng/µL total dsRNA, paired treatments contained 20 ng/µL of each dsRNA (40 ng/µL total), and the triple transcript-targeting treatment contained 20 ng/µL of each dsRNA (60 ng/µL total). dsRNA-egfp at 20 ng/µL served as the negative control. The treatments included dsRNA-egfp, dsRNA-dorsal1, dsRNA-dorsal2, dsRNA-dorsal1 plus dsRNA-dorsal2, dsRNA-RNA9886, dsRNA-RNA9888, dsRNA-RNA9890, and the indicated paired or triple transcript-targeting dsRNAs. Complete consumption of the treatment ration was confirmed for each retained larva, and fresh diet was supplied once daily thereafter. Midguts were collected at the time points indicated for each experiment, frozen in liquid nitrogen, and stored at −80 °C until analysis.
For the uninfected and A. apis-inoculated gene-level RNAi time courses, each treatment at each age (4, 5, and 6 days) comprised three colony-derived biological replicates of three pooled larval midguts (nine larvae per treatment per age; 27 larvae per treatment across the three-age time course). For the infection-only comparison at 6 days, each condition comprised three biological replicates of three pooled midguts (nine larvae per condition). For the gene-level AMP assay and the transcript-targeted RNAi assays, each treatment at 6 days likewise comprised three biological replicates of three pooled midguts (nine larvae per treatment).

2.4. RNA Extraction and cDNA Synthesis

Total RNA was extracted from larval midgut tissues using TRIzol reagent (Thermo Fisher Scientific, Waltham, Massachusetts, USA) according to the manufacturer’s instructions. RNA concentration and purity were assessed before reverse transcription. First-strand complementary DNA (cDNA) was synthesized using the Maxima H Minus Reverse Transcriptase Kit (Thermo Fisher Scientific, Waltham, Massachusetts, USA) following the manufacturer’s protocol. RNA and cDNA samples were stored at −80 °C until subsequent gene cloning and RT-qPCR analysis.

2.5. Real-Time Quantitative PCR (RT-qPCR)

RT-qPCR was performed to quantify the transcript abundance of dorsal genes, dorsal1 transcript isoforms, and AMP genes under the indicated treatment conditions. Reactions were performed on a QuantStudio 3 Real-Time PCR System (Thermo Fisher Scientific, Waltham, Massachusetts, USA) using Hieff qPCR SYBR Green Master Mix (Yeasen, Shanghai, China). Each 20 µL reaction contained 10 µL of SYBR Green Master Mix, 1 µL of cDNA template, 1 µL of each primer, and 7 µL of double-distilled water. The amplification program was 95 °C for 5 min, followed by 34 cycles of 95 °C for 50 s, 55 °C for 30 s, and 72 °C for 50 s. Each colony-derived biological replicate was measured in three technical qPCR replicates. Amplification efficiencies were determined directly from the original cycle-by-cycle fluorescence data generated by the QuantStudio 3 system. The exponential phase of each amplification curve was evaluated by log-linear regression, and amplification efficiency was calculated from the resulting slope. The mean amplification efficiencies of all RT-qPCR assays ranged from 91.3% to 93.5%, with mean coefficients of determination (R2) ranging from 0.9984 to 0.9995. The reference gene actin-5C showed an amplification efficiency of 93.0 ± 4.0%, which was highly comparable to those of all target assays. Assay-specific amplification efficiencies and R2 values are provided in Table S1. The technical determinations were consolidated into one estimate for each biological replicate before statistical analysis and were not treated as independent observations. actin-5C (GenBank accession No. 107999330) was used as the endogenous reference because actin genes are commonly used as normalization controls in honey bee RT-qPCR studies [35,36]. For each sample, ΔCt was calculated as Cttarget − Ctactin-5C. For the ith colony-derived biological replicate, the treated sample was calibrated against the corresponding control sample from the same colony and experiment: ΔΔCti = ΔCttreatment,i − ΔCtcontrol,i. The control was the uninoculated group or dsRNA-egfp group, as appropriate. Relative transcript abundance was calculated as 2−ΔΔCt [37], which is equivalent to the ratio 2−ΔCt(treatment)/2−ΔCt(control). Thus, calibrator scaling was applied only after within-sample target/reference normalization, and a single group-mean control was not imposed across the three colonies. Primer sequences and their applications are listed in Table S1. The available assay information is reported with reference to the MIQE 2.0 framework [38].

2.6. Data Analysis

Data are presented as the mean ± SD from three independent colony-derived biological replicates (n = 3); each biological replicate comprised three pooled larval midguts. The effects of larval age and dsRNA treatment on dorsal1 or dorsal2 expression were analyzed using two-way analysis of variance (ANOVA), followed by Sidak multiple-comparisons tests. The single prespecified contrast between A. apis-inoculated and uninoculated larvae was analyzed separately for each gene using Student’s t-test. Only prespecified comparisons between each dsRNA treatment and the dsRNA-egfp control were evaluated using Student’s t-test; no inferential comparisons among the active dsRNA treatments were made. Statistical analyses and figure preparation were performed using GraphPad Prism software (version 11). Differences were considered statistically significant at p < 0.05. Given the three-replicate design and the presence of multiple planned treatment-control contrasts, the effect magnitudes were not used to rank mechanistic potency among transcript targets.

3. Results

3.1. Analysis of the Dorsal Genes and Isoforms and dsRNA-Mediated Silencing of dorsal1 and dorsal2

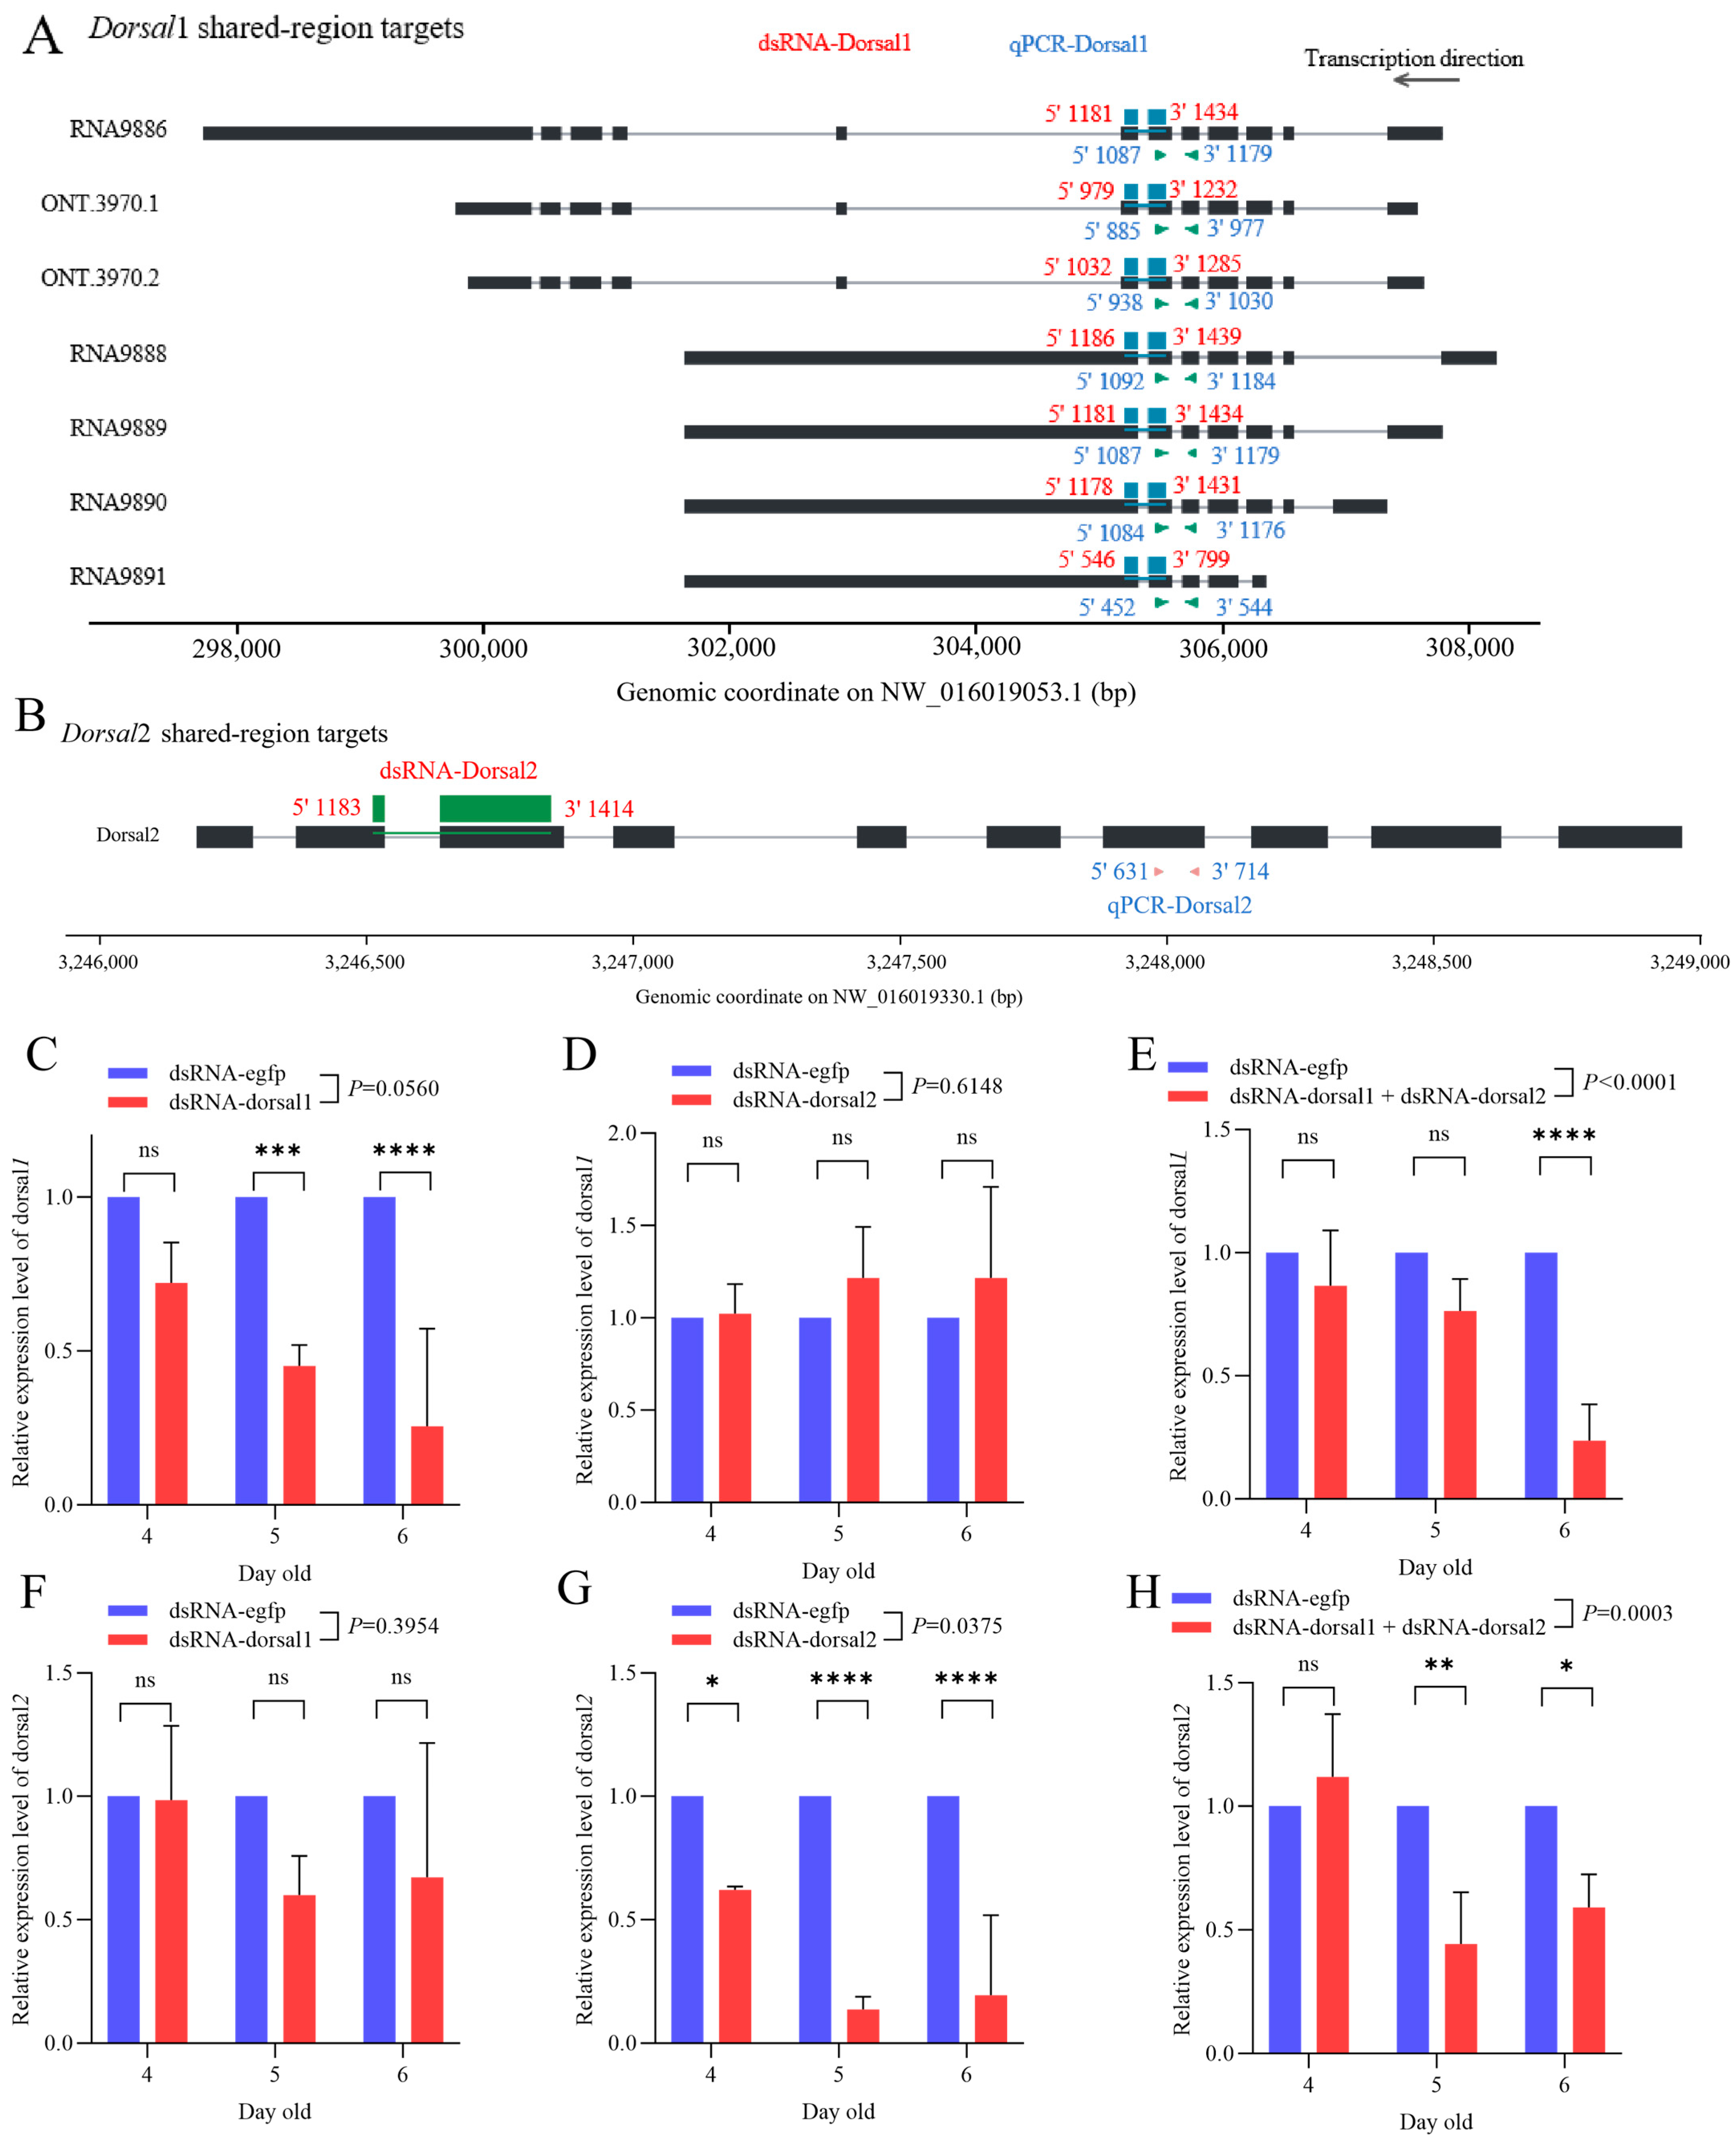
Gene-structure analysis showed that dorsal1 generated seven transcript isoforms through alternative splicing, including RNA9886, RNA9888, RNA9889, RNA9890, RNA9891, ONT.3970.1, and ONT.3970.2 (Figure 2A). RNA9886, ONT.3970.1, and ONT.3970.2 each contained 11 exons, whereas the other dorsal1 transcripts differed mainly in the 5′ untranslated region, 3′ untranslated region, and the eighth exon. In contrast, dorsal2 produced a single transcript containing 10 exons (Figure 2B).
To validate the RNAi strategy, dsRNA and RT-qPCR target regions were mapped onto dorsal1 and dorsal2. The dsRNA-dorsal1 fragment targeted a region shared by the dorsal1 transcript isoforms, whereas dsRNA-dorsal2 targeted the single dorsal2 transcript (Figure 2A,B). In uninfected larvae, dsRNA-dorsal1 reduced dorsal1 expression to 0.721, 0.451, and 0.255 of the dsRNA-egfp control at 4, 5, and 6 days old, corresponding to knockdown efficiencies of 27.9%, 54.9%, and 74.5%, respectively (Figure 2C). The reductions were significant at 5 and 6 days old (p = 0.0012 and p = 0.0001, respectively), whereas the 4-day-old reduction was not significant (p = 0.1133). dsRNA-dorsal2 did not reduce dorsal1 expression at any time point (p = 0.9993, p = 0.6467, and p = 0.6464 at 4, 5, and 6 days old, respectively; Figure 2D), indicating target specificity. Co-administration of dsRNA-dorsal1 and dsRNA-dorsal2 reduced dorsal1 expression to 0.866, 0.763, and 0.236 of the control at 4, 5, and 6 days old, corresponding to 13.4%, 23.7%, and 76.4% knockdown, respectively; this reduction was significant at 6 days old (p < 0.0001) but not at 4 or 5 days old (p = 0.4958 and p = 0.1008; Figure 2E). Conversely, dsRNA-dorsal1 did not significantly reduce dorsal2 expression (p = 0.9998, p = 0.2348, and p = 0.3887; Figure 2F), whereas dsRNA-dorsal2 reduced dorsal2 expression to 0.621, 0.137, and 0.194 of the control at 4, 5, and 6 days old, corresponding to 37.9%, 86.3%, and 80.6% knockdown, respectively (p = 0.0140, p < 0.0001, and p < 0.0001; Figure 2G). The combined dsRNA treatment reduced dorsal2 expression at 5 and 6 days old, with expression levels of 0.443 and 0.590 of the control, corresponding to 55.7% and 41.0% knockdown (p = 0.0016 and p = 0.0143, respectively), while no reduction was detected at 4 days old (p = 0.7120; Figure 2H).
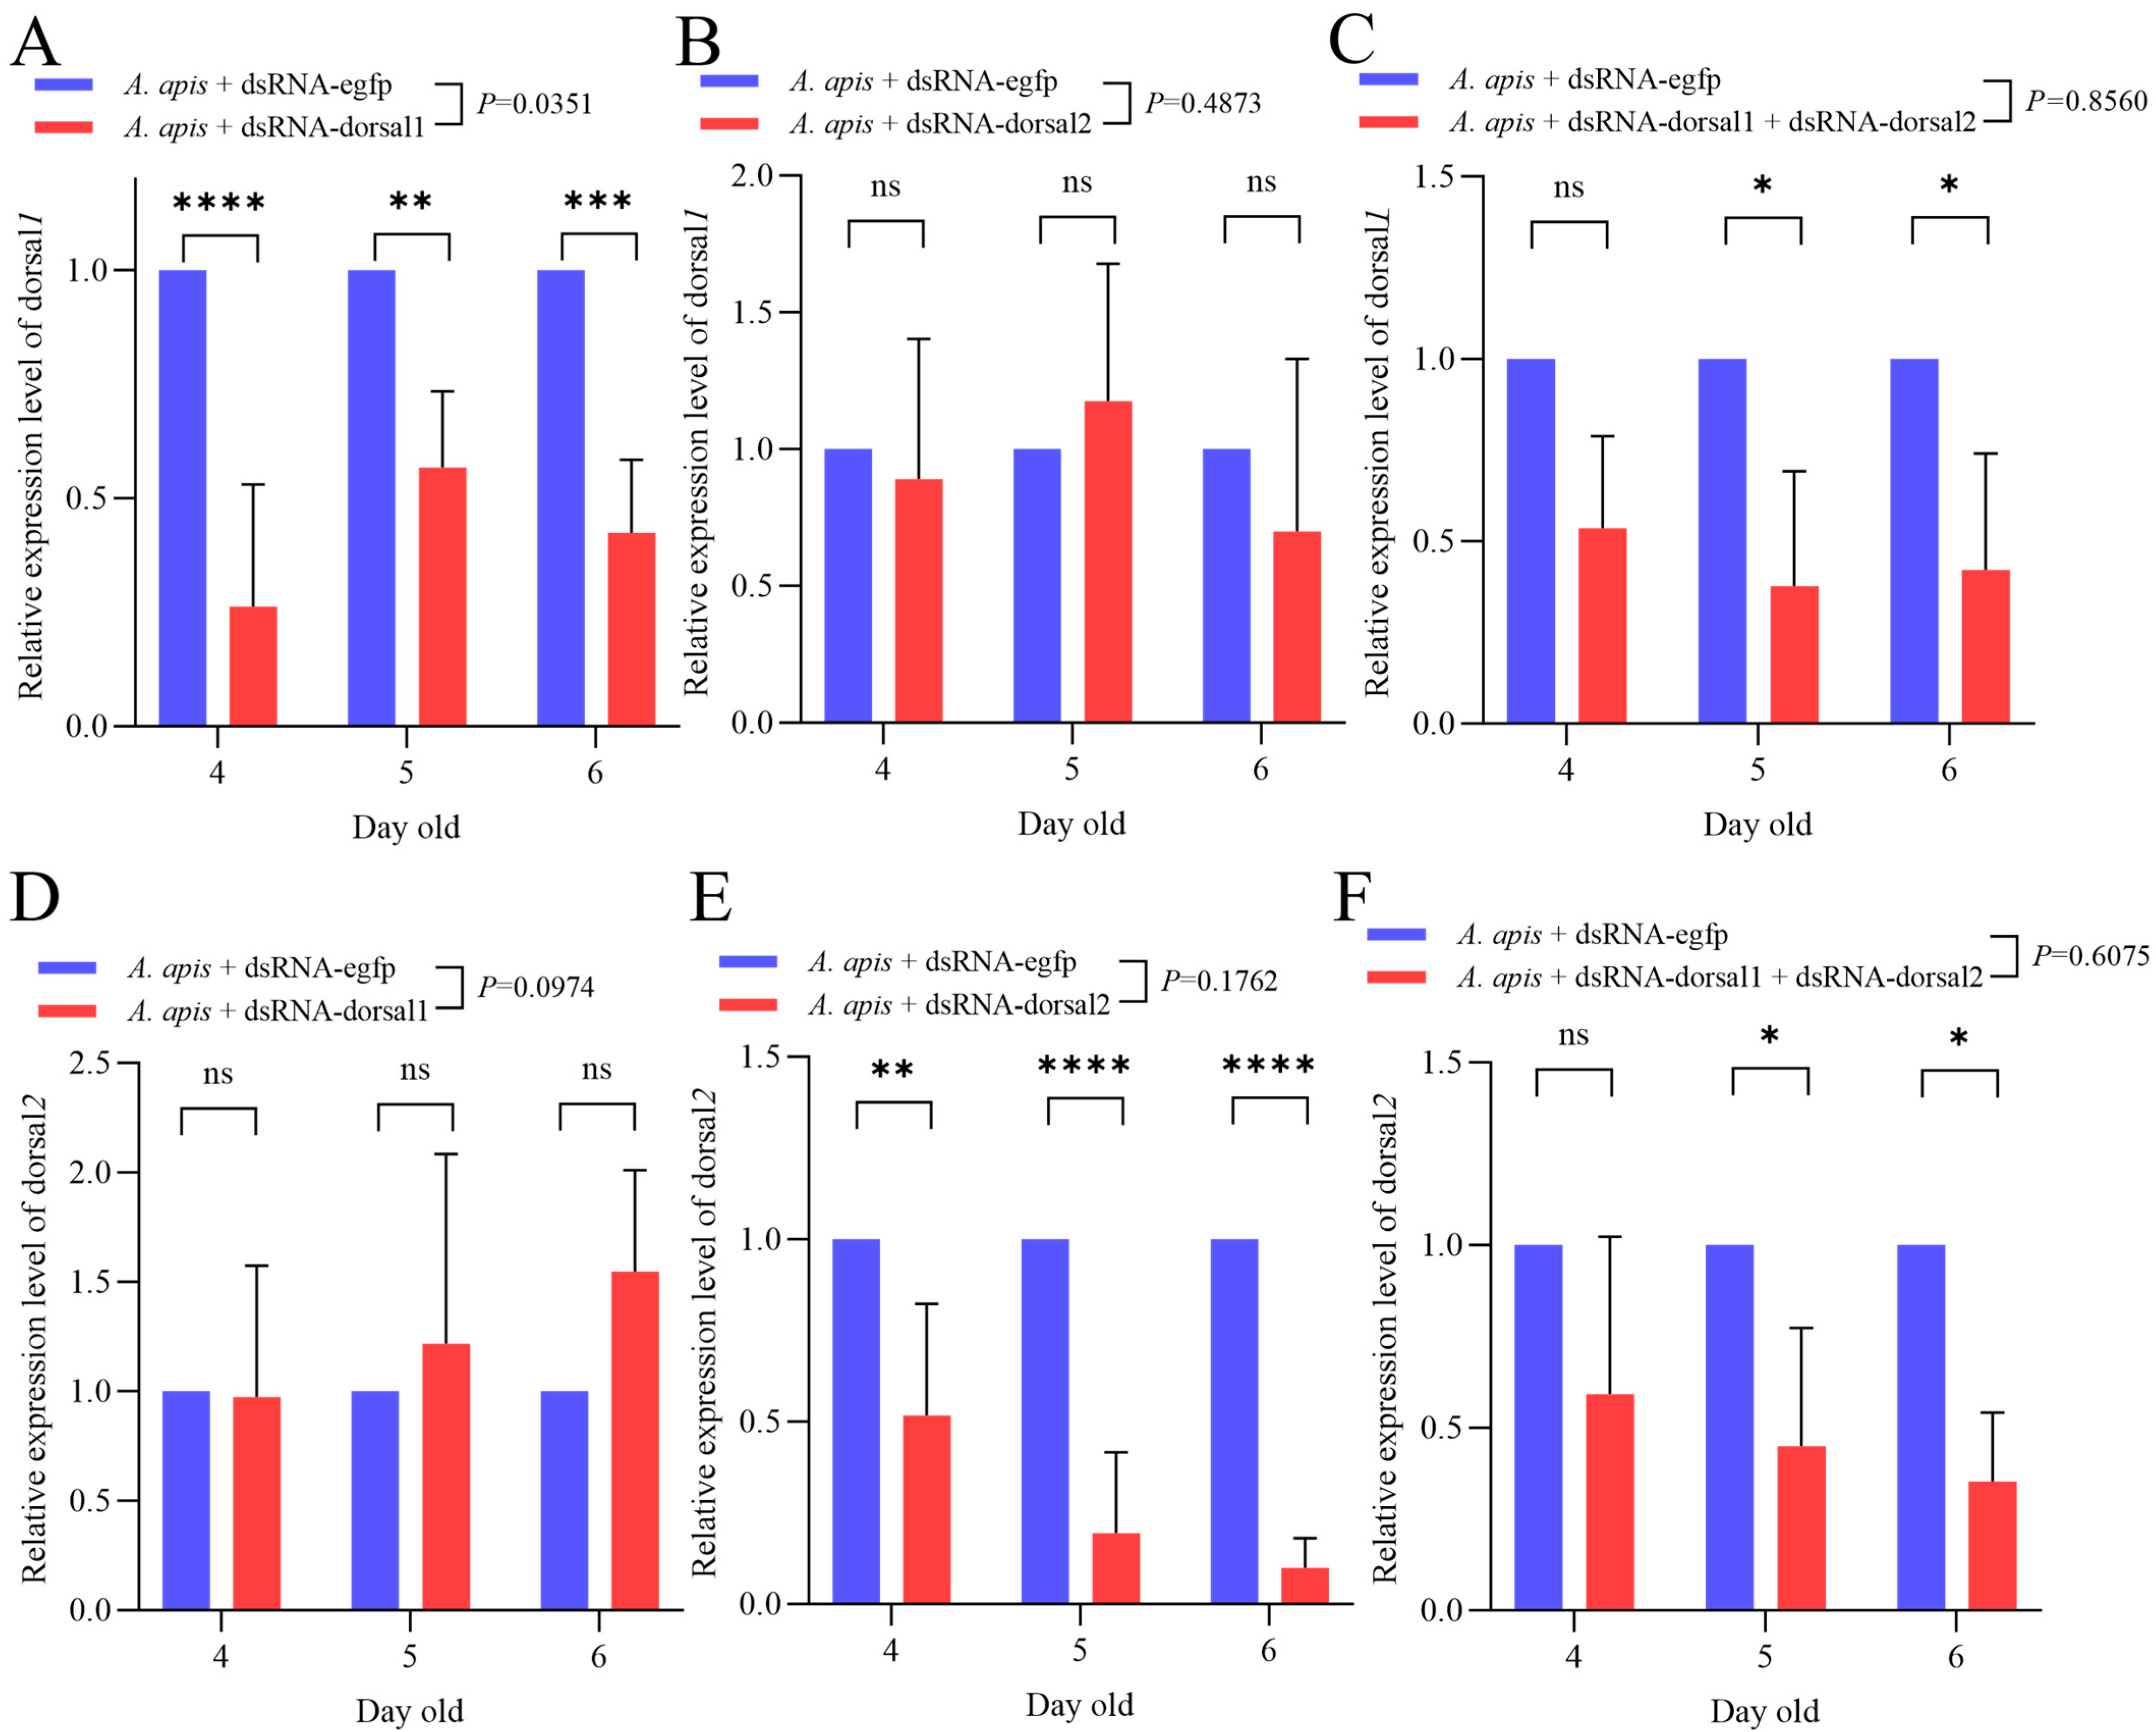
After A. apis inoculation, the target-specific knockdown patterns were retained (Figure 3). dsRNA-dorsal1 reduced dorsal1 expression to 0.262, 0.568, and 0.424 of the dsRNA-egfp control at 4, 5, and 6 days old, corresponding to 73.8%, 43.2%, and 57.6% knockdown, respectively; all three reductions were significant (p = 0.0001, p = 0.0097, and p = 0.0011; Figure 3A). dsRNA-dorsal2 did not significantly reduce dorsal1 expression (p = 0.9818, p = 0.9308, and p = 0.7425; Figure 3B). The combined dsRNA-dorsal1 and dsRNA-dorsal2 treatment reduced dorsal1 expression to 0.536, 0.377, and 0.422 of the control at 4, 5, and 6 days old, corresponding to 46.4%, 62.3%, and 57.8% knockdown, respectively; the reductions were significant at 5 and 6 days old (p = 0.0102 and p = 0.0165) and marginal at 4 days old (p = 0.0558; Figure 3C). In parallel, dsRNA-dorsal1 did not reduce dorsal2 expression in infected larvae (p = 0.9999, p = 0.9266, and p = 0.4493; Figure 3D), whereas dsRNA-dorsal2 reduced dorsal2 expression to 0.517, 0.195, and 0.100 of the control, corresponding to 48.3%, 80.5%, and 90.0% knockdown, respectively (p = 0.0083, p = 0.0001, and p < 0.0001; Figure 3E). The combined dsRNA treatment reduced dorsal2 expression to 0.592, 0.450, and 0.353 of the control, corresponding to 40.8%, 55.0%, and 64.7% knockdown, respectively; this effect was significant at 5 and 6 days old (p = 0.0397 and p = 0.0156) but not at 4 days old (p = 0.1509; Figure 3F).

3.2. Effects of dorsal1 and dorsal2 Knockdown on AMP Gene Expression After A. apis Infection

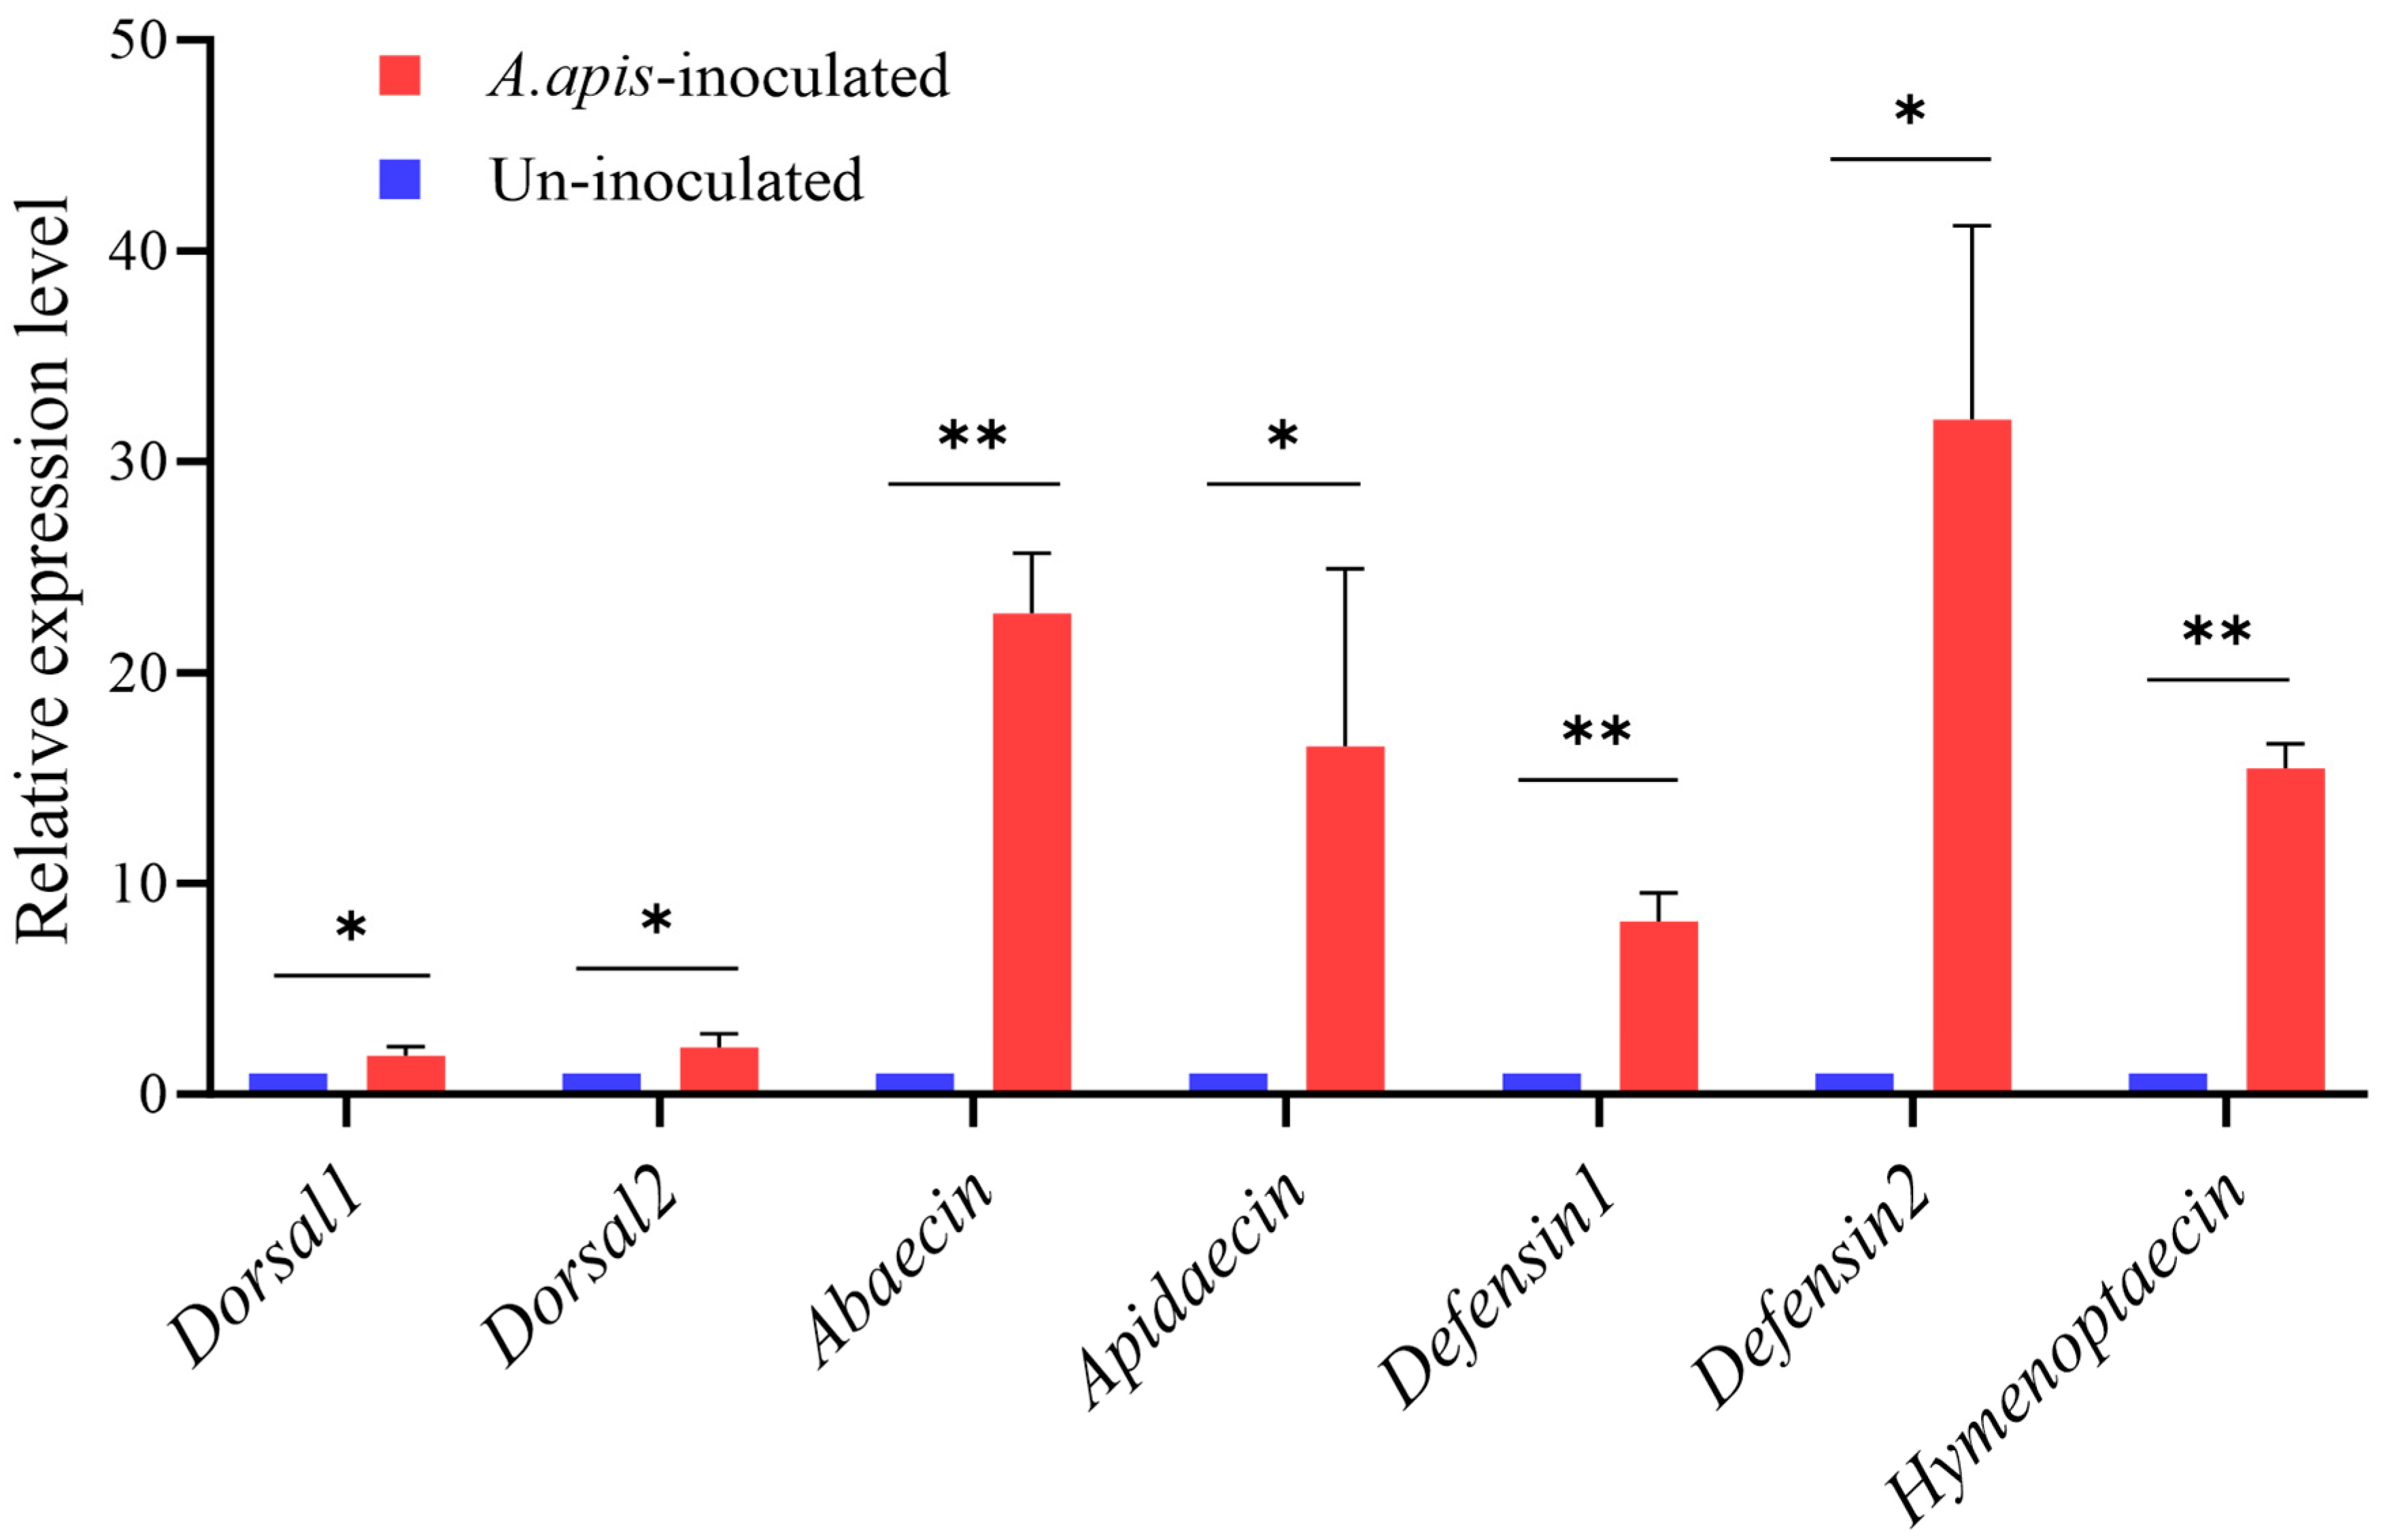
RT-qPCR analysis of 6-day-old larval midguts showed that A. apis inoculation was associated with increased dorsal and AMP transcript abundance. Compared with uninoculated larvae, infected larvae showed increased expression of dorsal1 (p = 0.0417), dorsal2 (p = 0.0397), abaecin (p = 0.0029), apidaecin (p = 0.0432), defensin1 (p = 0.0057), defensin2 (p = 0.0141), and hymenoptaecin (p = 0.0011) (Figure 4). These results document an infection-associated increase in the measured immune transcripts.
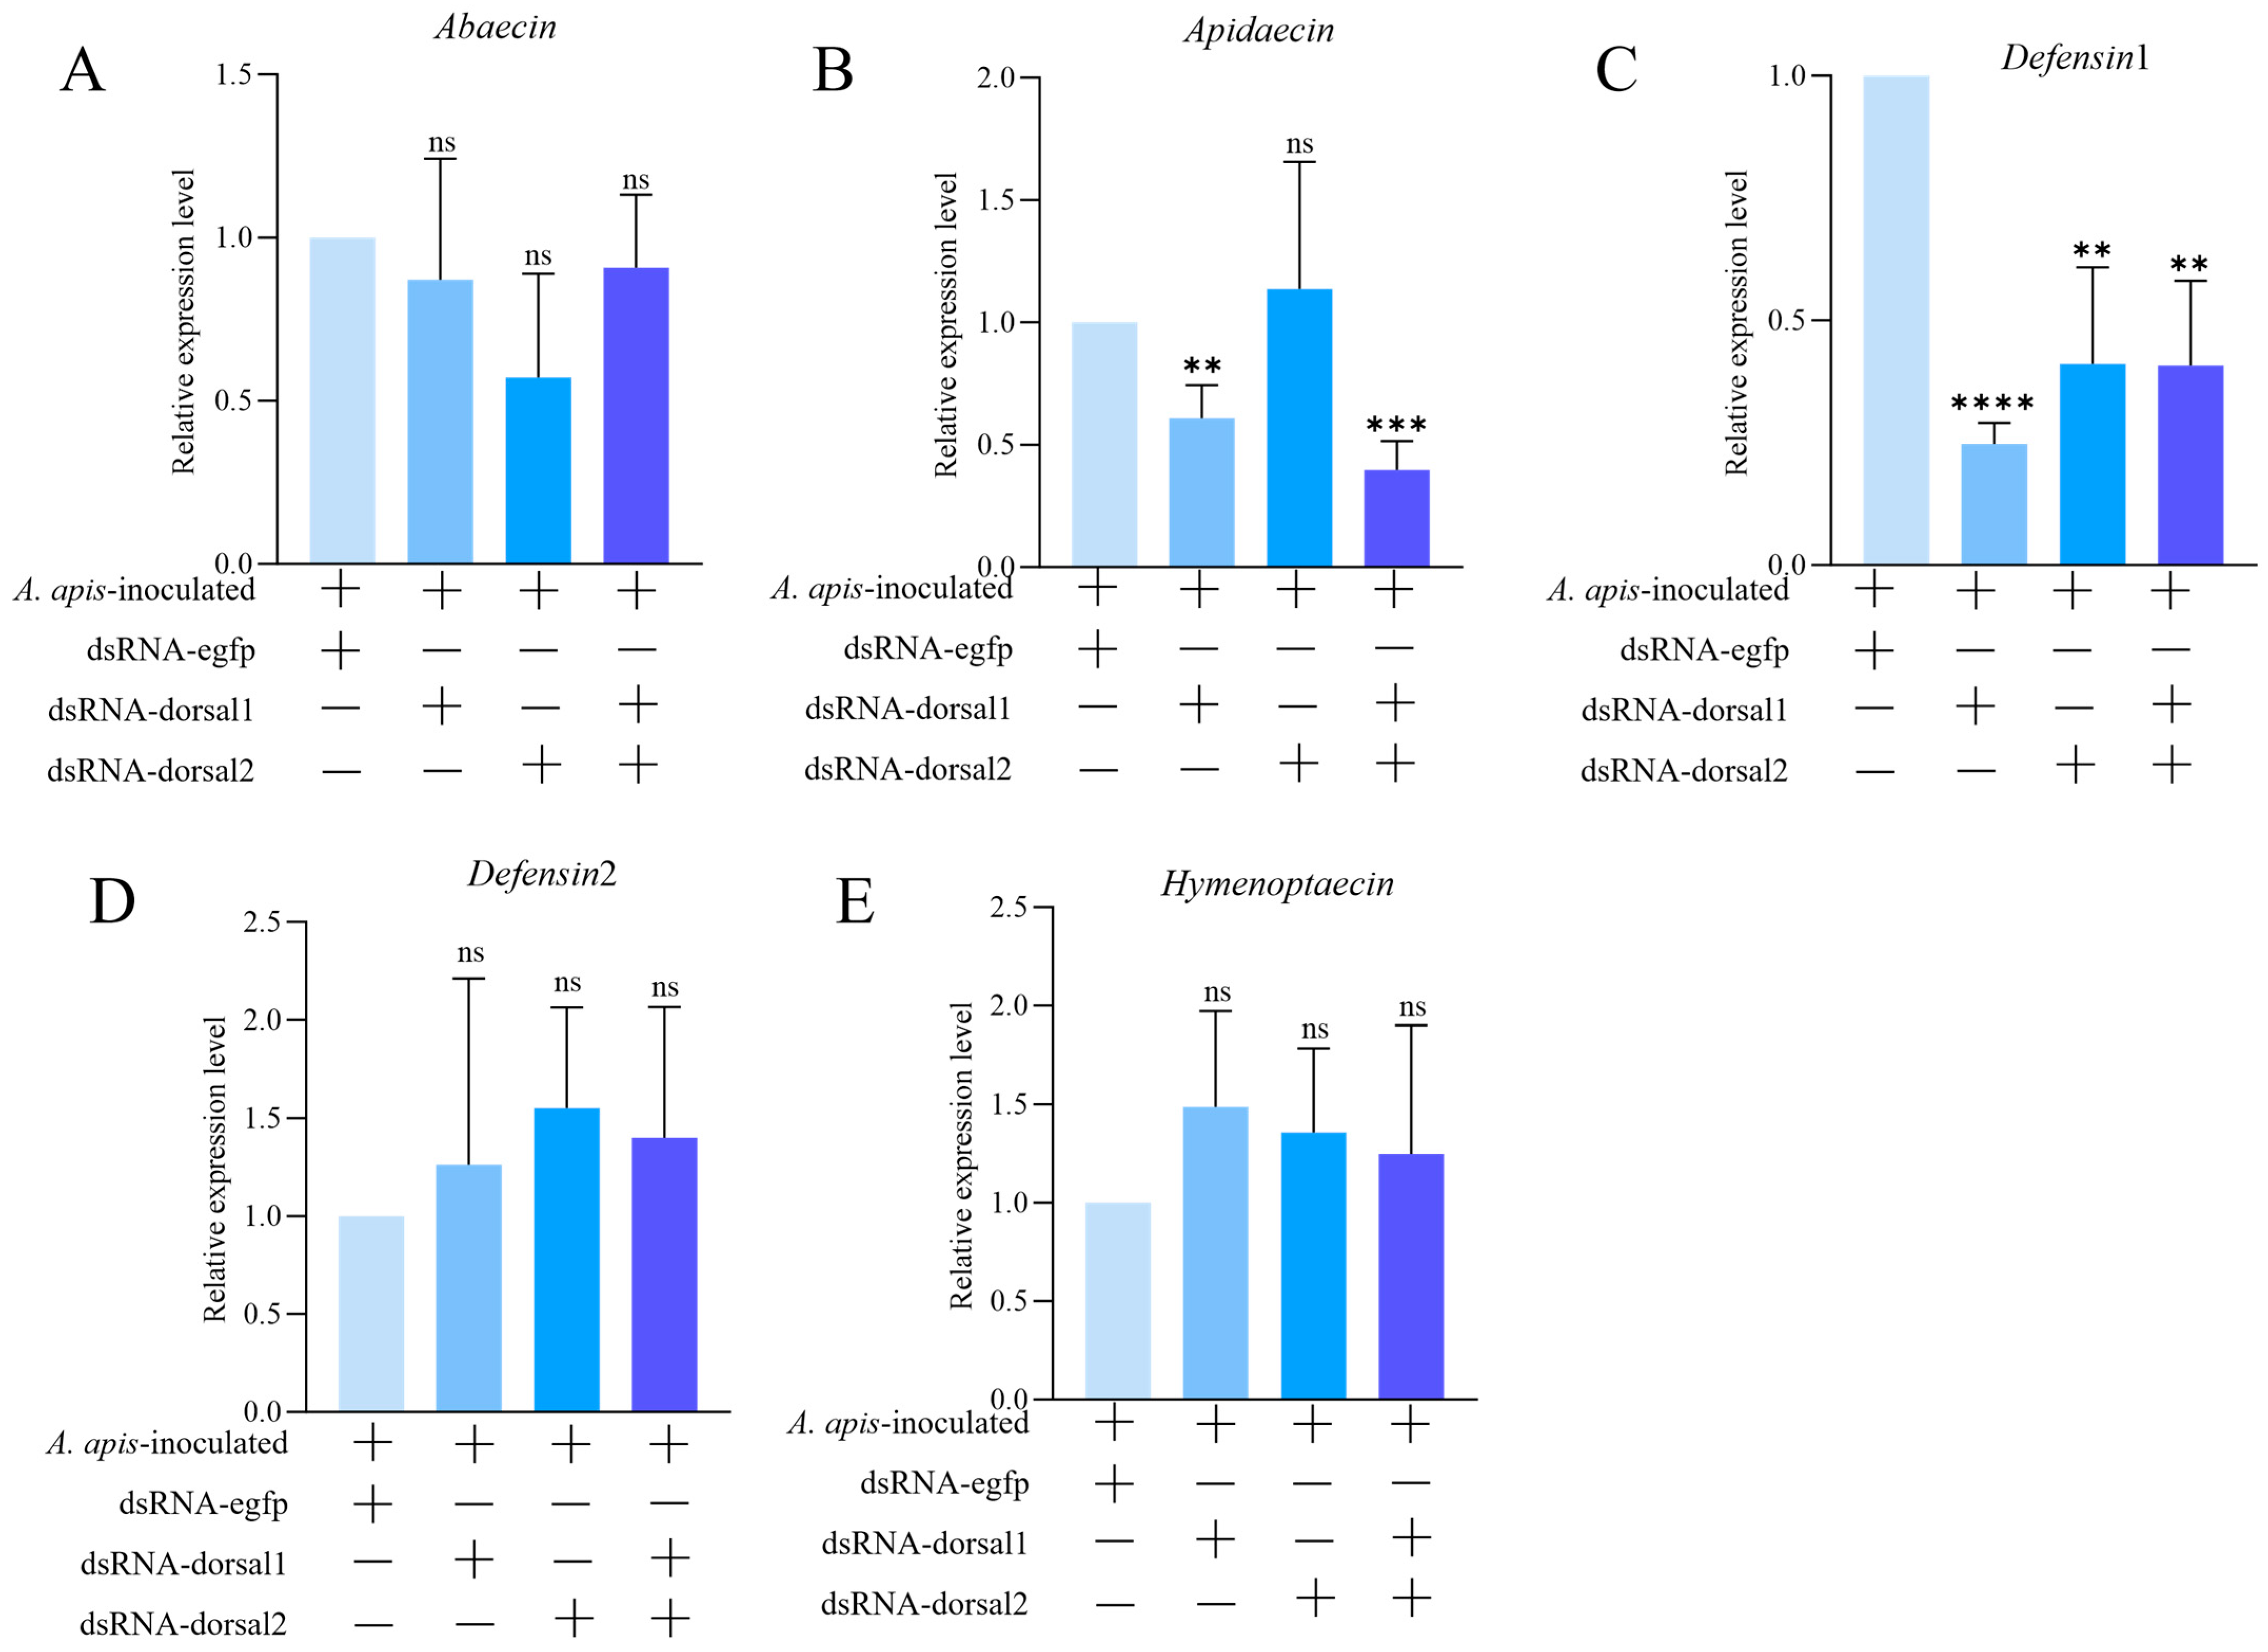
To examine whether reducing dorsal1 or dorsal2 was accompanied by changes in AMP transcripts during infection, AMP expression was measured after dorsal knockdown in A. apis-inoculated larvae. Knockdown of dorsal1, dorsal2, or both genes did not significantly alter abaecin, defensin2, or hymenoptaecin expression (all p > 0.05; Figure 5A,D,E). In contrast, apidaecin expression was reduced by dsRNA-dorsal1 and by the combined dsRNA-dorsal1 plus dsRNA-dorsal2 treatment, with relative expression levels of 0.608 and 0.397, corresponding to 39.2% and 60.3% reductions, respectively (p = 0.0076 and p = 0.0009; Figure 5B). defensin1 expression was reduced by dsRNA-dorsal1, dsRNA-dorsal2, and the combined treatment, with relative expression levels of 0.248, 0.411, and 0.408, corresponding to 75.2%, 58.9%, and 59.2% reductions, respectively (p < 0.0001, p = 0.0067, and p = 0.0041; Figure 5C). Under the tested conditions, these transcript-level associations were selective for apidaecin and defensin1 rather than uniform across all five AMP genes.

3.3. Effects of dorsal1 Transcript Knockdown on AMP Gene Expression After A. apis Infection

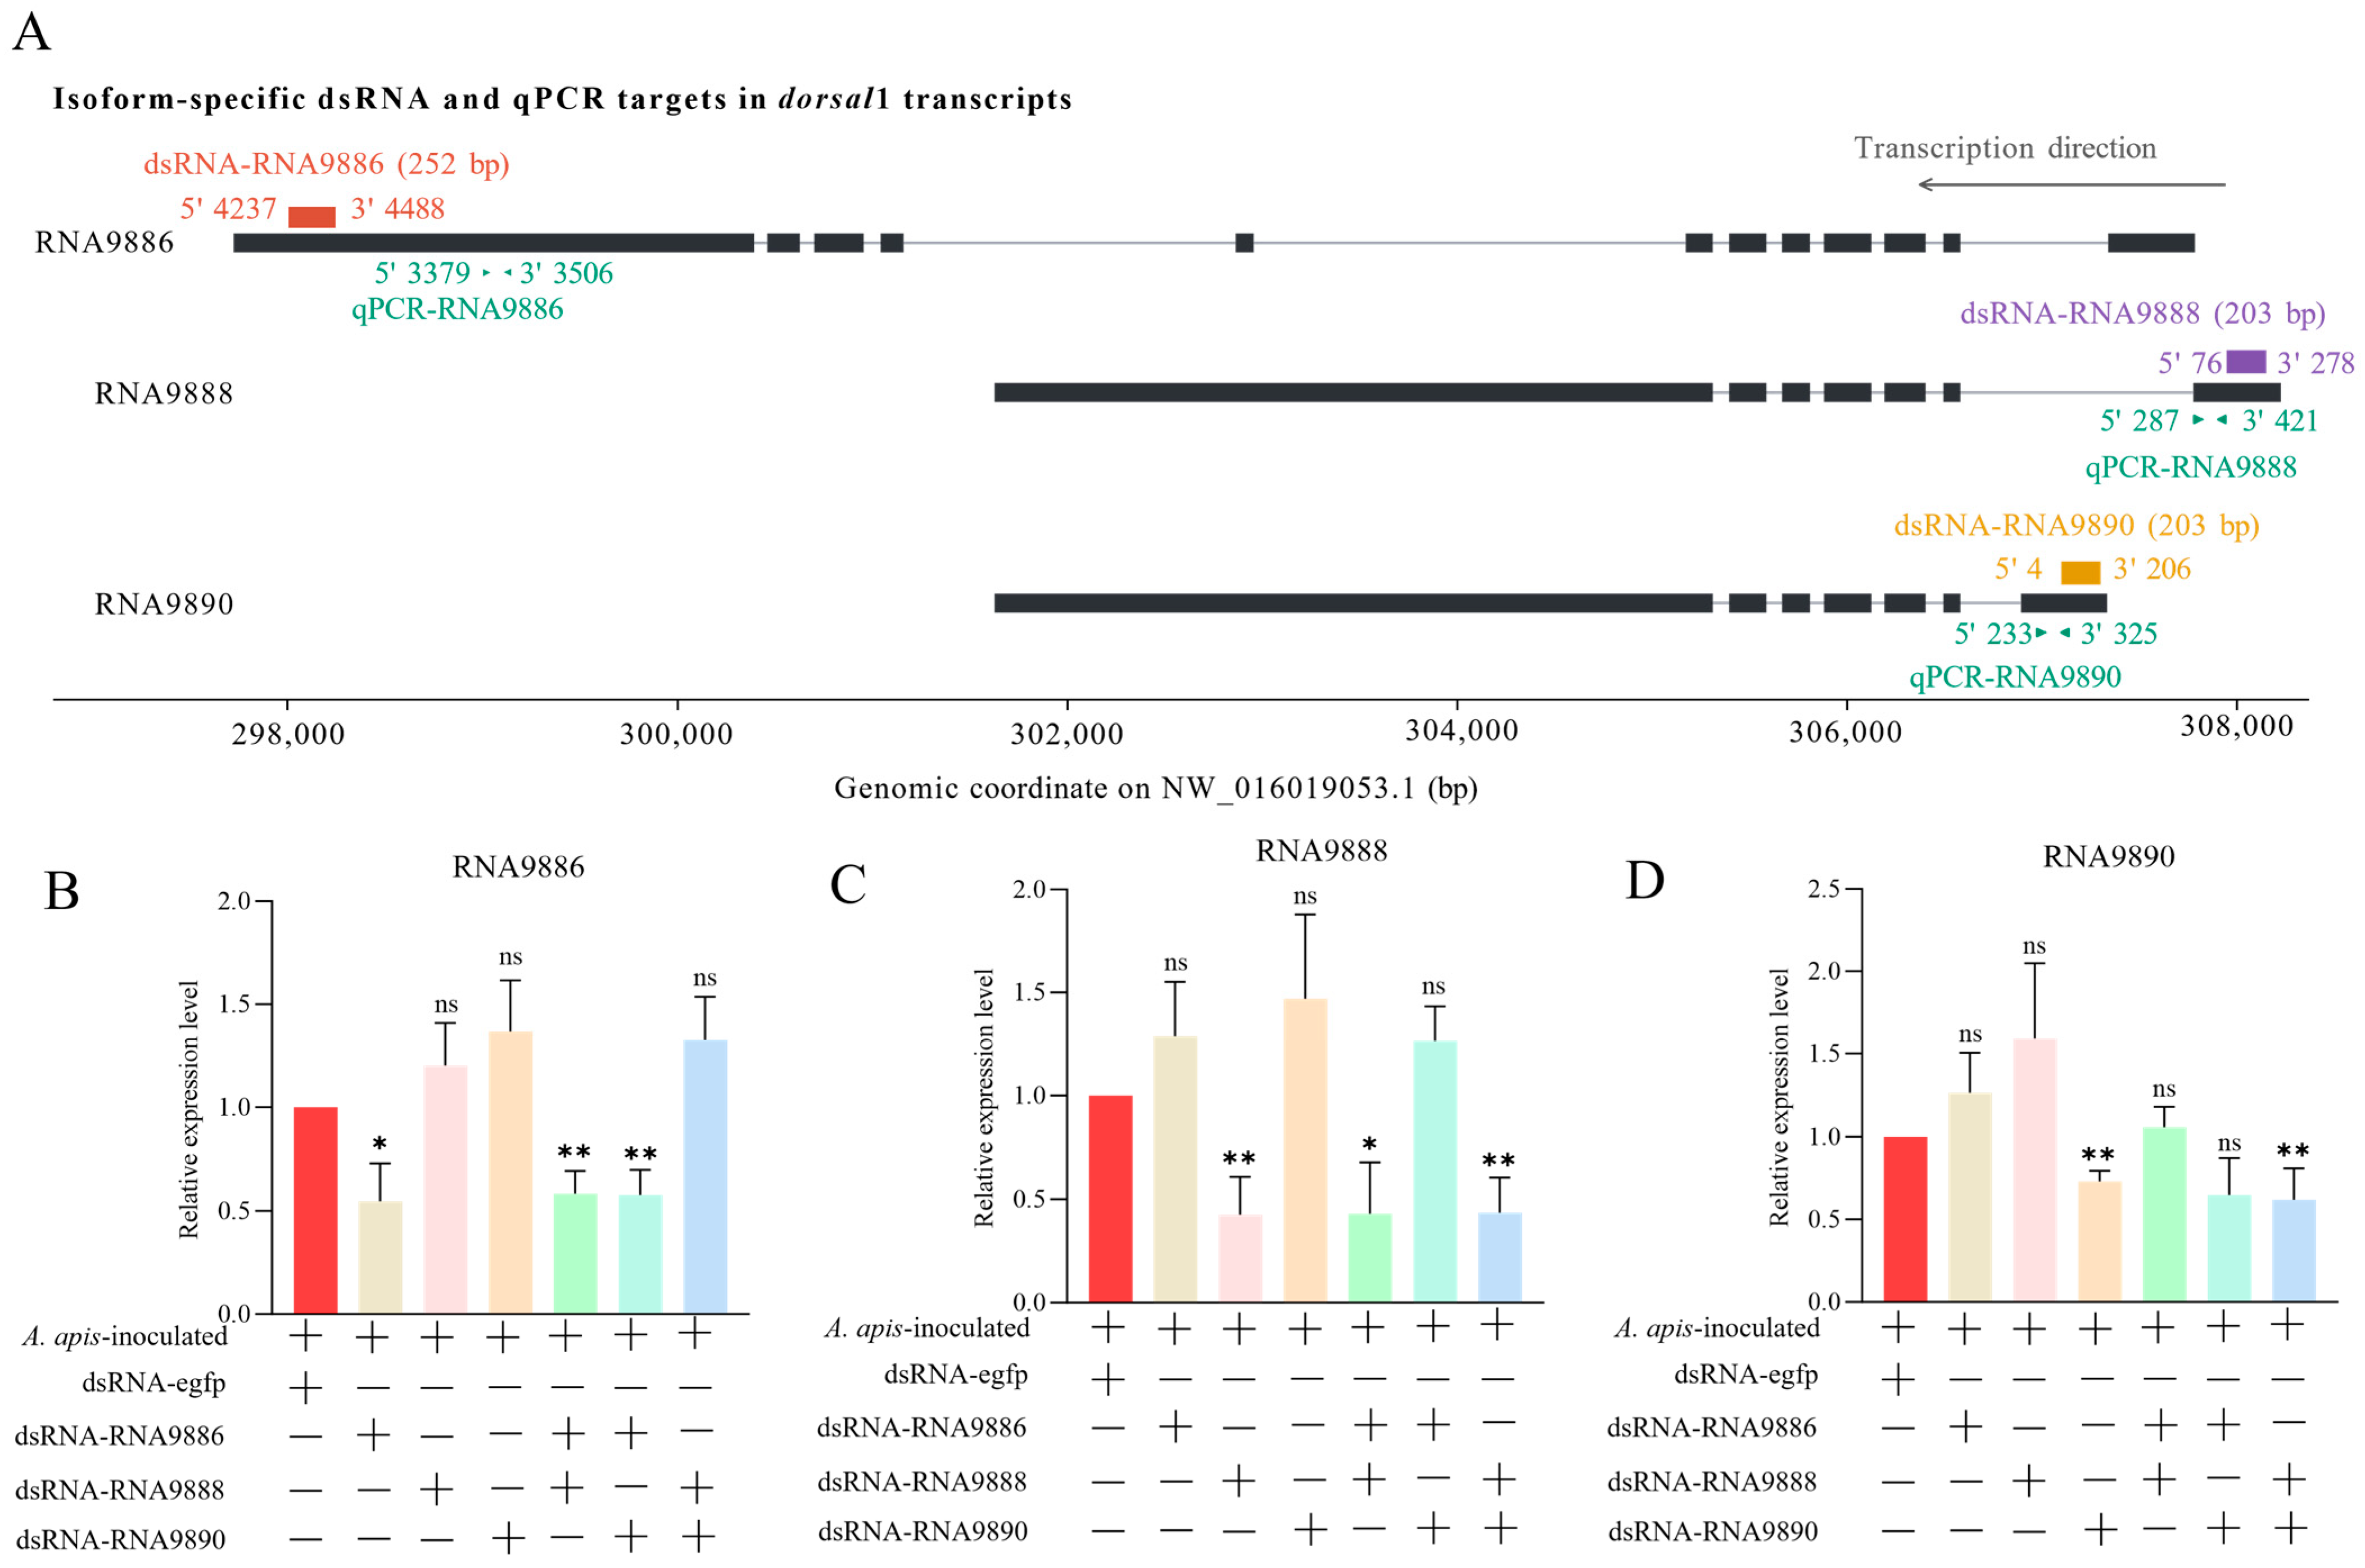
Because dorsal1 produced multiple transcript isoforms, we next examined whether targeting individual dorsal1 transcripts was associated with distinct AMP transcript responses during A. apis infection. Isoform-specific dsRNA and RT-qPCR target sites were designed for RNA9886, RNA9888, and RNA9890 (Figure 6A). dsRNA-RNA9886 reduced RNA9886 expression to 0.547 of the control, corresponding to 45.3% knockdown (p = 0.0129), without significantly reducing RNA9888 or RNA9890 expression (p > 0.05; Figure 6B–D). dsRNA-RNA9888 reduced RNA9888 expression to 0.426 of the control, corresponding to 57.4% knockdown (p = 0.0057), without reducing RNA9886 or RNA9890 expression. dsRNA-RNA9890 reduced RNA9890 expression to 0.730 of the control, corresponding to 27.0% knockdown (p = 0.0020), without reducing RNA9886 or RNA9888 expression.
The paired transcript-targeting treatments showed the same target-associated pattern. dsRNA-RNA9886 plus dsRNA-RNA9888 reduced RNA9886 and RNA9888 by 41.5% and 57.0%, respectively (p = 0.0028 and p = 0.0167). dsRNA-RNA9886 plus dsRNA-RNA9890 reduced RNA9886 by 42.3% (p = 0.0039) and lowered RNA9890 by 35.4%, although the RNA9890 reduction was marginal (p = 0.0534). dsRNA-RNA9888 plus dsRNA-RNA9890 reduced RNA9888 and RNA9890 by 56.4% and 38.1%, respectively (p = 0.0045 and p = 0.0256; Figure 6B–D). These data indicate that, at the RNA level and under the tested conditions, the designed dsRNAs preferentially reduced their intended dorsal1 transcript targets.
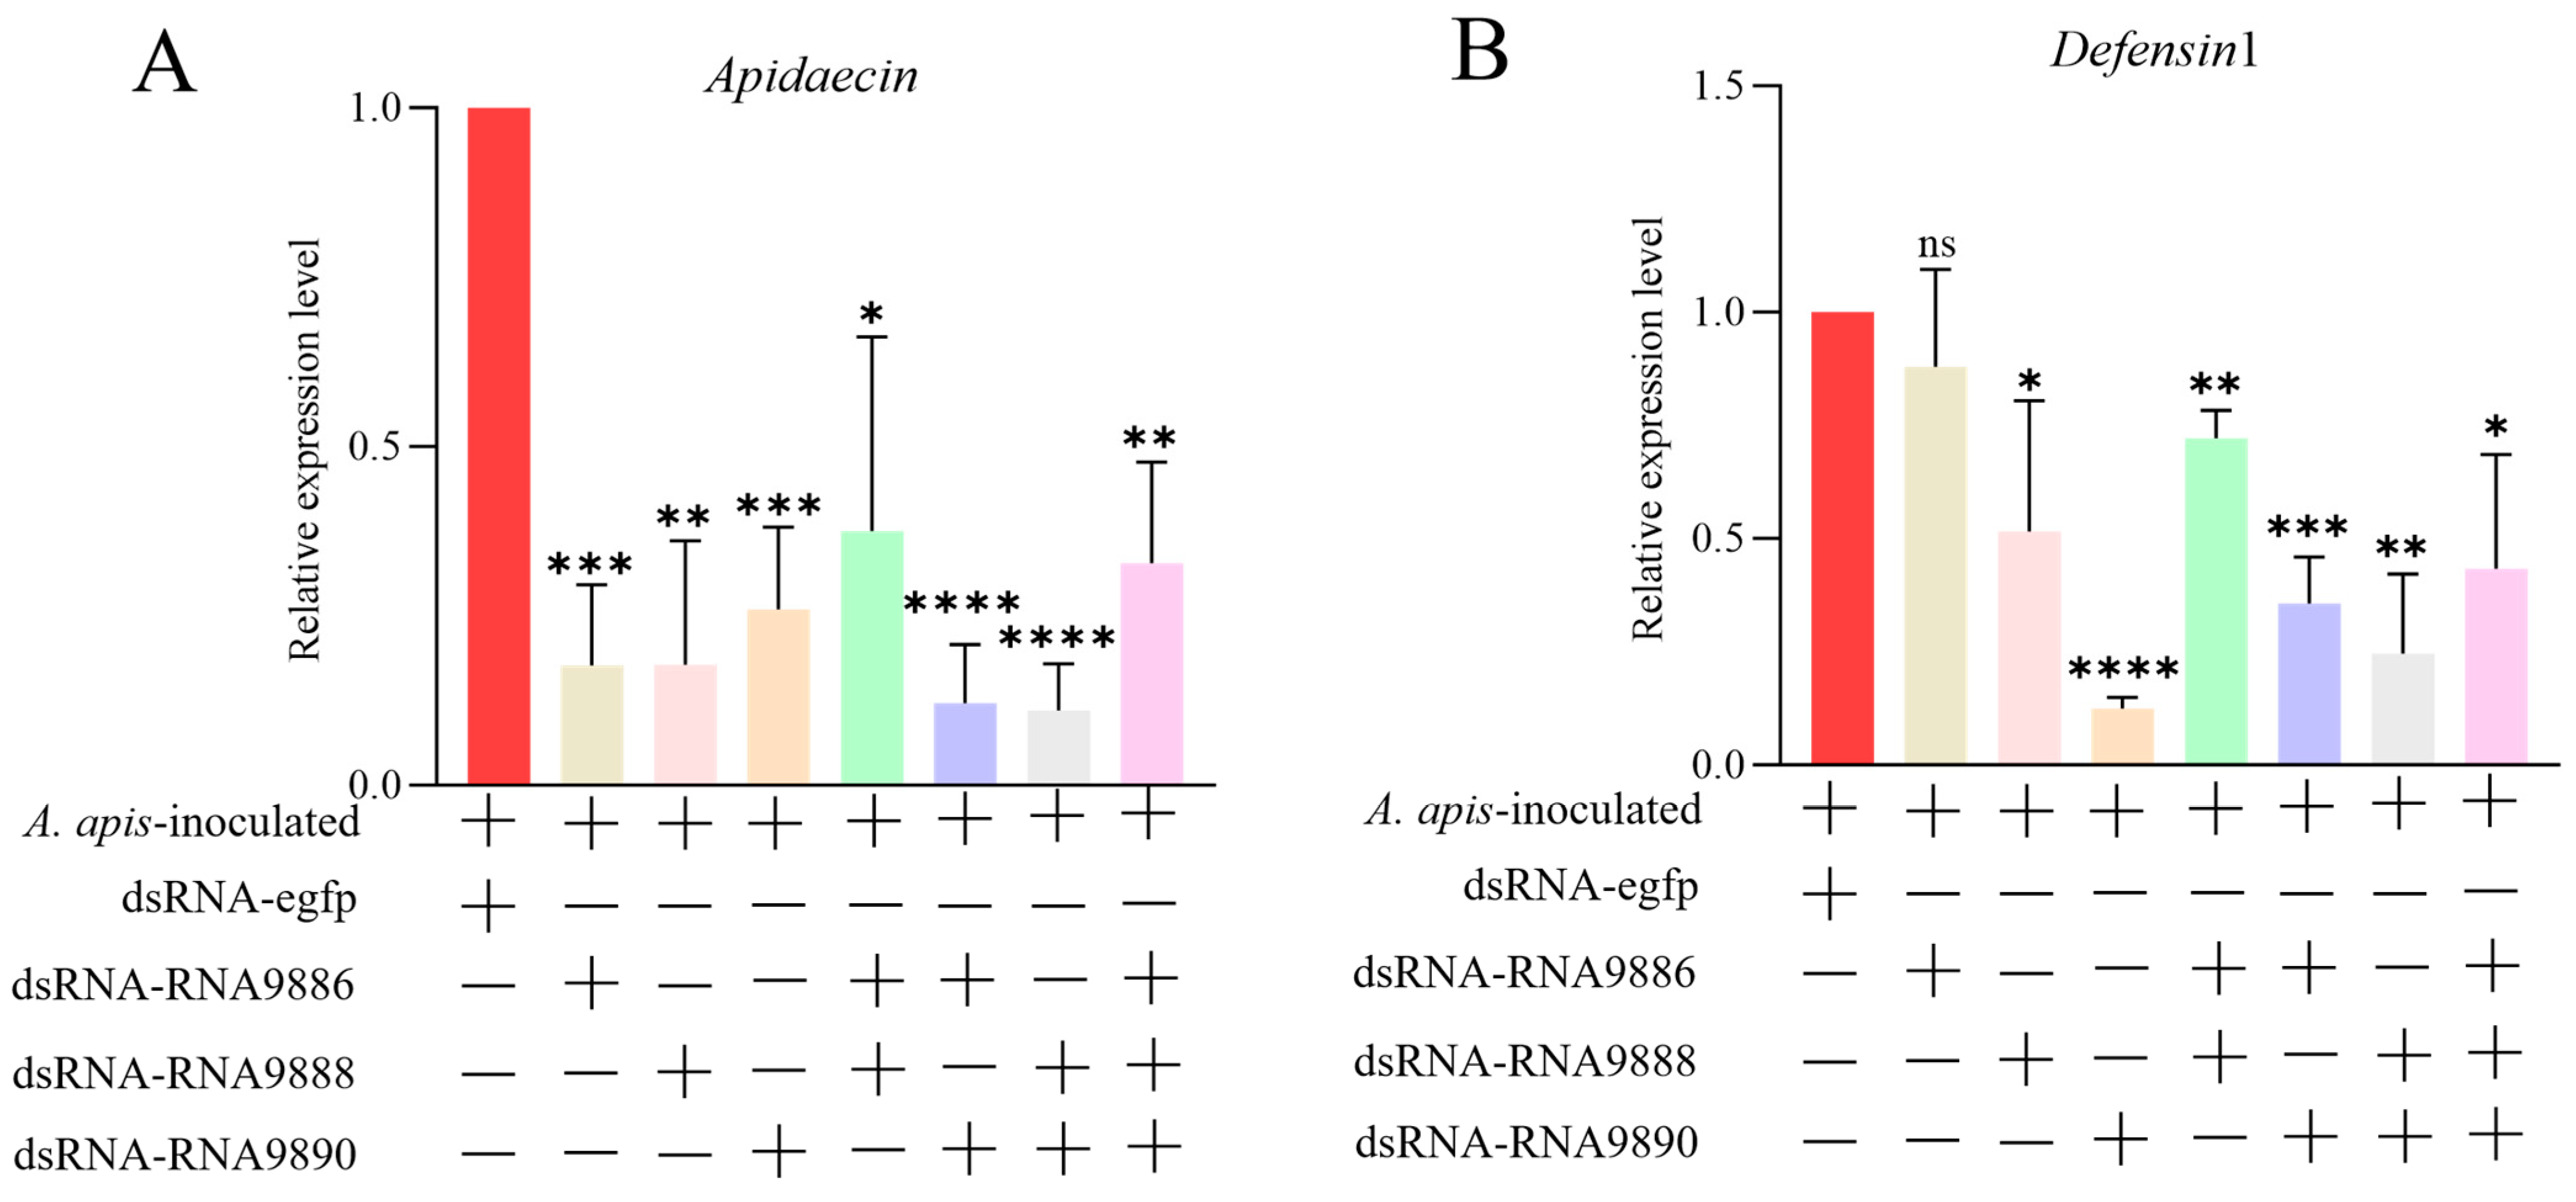
We then examined AMP transcript abundance after the dorsal1 transcript-targeting treatments in A. apis-inoculated larvae. apidaecin expression was reduced by all single, double, and triple transcript-targeting dsRNA treatments (p = 0.0003 for dsRNA-RNA9886, p = 0.0015 for dsRNA-RNA9888, p = 0.0005 for dsRNA-RNA9890, p = 0.0195 for dsRNA-RNA9886 plus dsRNA-RNA9888, p < 0.0001 for dsRNA-RNA9886 plus dsRNA-RNA9890, p < 0.0001 for dsRNA-RNA9888 plus dsRNA-RNA9890, and p = 0.0015 for the triple-dsRNA treatment; Figure 7A). defensin1 expression was not significantly changed by dsRNA-RNA9886 alone (p = 0.3872), but was reduced by dsRNA-RNA9888 and dsRNA-RNA9890 (p = 0.0437 and p < 0.0001; Figure 7B). Double and triple transcript-targeting treatments also reduced defensin1 expression (p = 0.0014, p = 0.0004, p = 0.0018, and p = 0.0177; Figure 7B). These results identify distinct transcript-level associations: RNA9890 knockdown was accompanied by the largest observed defensin1 decrease, whereas knockdown of each tested transcript was accompanied by reduced apidaecin.

4. Discussion

Inoculation with A. apis increased the transcript abundance of dorsal1, dorsal2, and all five AMP genes examined in the midguts of 6-day-old Apis cerana larvae, indicating broad activation of the antifungal immune response. RNAi analysis, however, revealed a more restricted pattern of dorsal-dependent regulation. Silencing dorsal1 reduced apidaecin and defensin1 expression, whereas silencing dorsal2 reduced defensin1 but had no significant effect on apidaecin. Neither individual nor combined knockdown of the two Dorsal homologs significantly altered abaecin, defensin2, or hymenoptaecin expression. Thus, infection-induced AMP expression does not necessarily imply direct dependence on dorsal, and the two homologs appear to account for only part of the AMP response. This pattern is consistent with the established role of the Toll–Cactus–Dorsal module in insect antifungal immunity, while also reflecting the considerable variation in Toll pathway outputs among insect lineages, pathogens, and tissues [13,15,16,17,18,19,20]. Transcriptomic and non-coding RNA studies of A. cerana larvae infected with A. apis have likewise revealed extensive remodeling of immune and regulatory networks, supporting a multilayered response rather than control by a single transcription factor [4,32,33].
Gene-level knockdown further revealed overlapping but distinct transcript-level associations for dorsal1 and dorsal2. The decrease in defensin1 after silencing either homolog agrees with RNAi evidence from A. mellifera white-eyed pupae showing that Dorsal homologs participate in defensin-1 expression [21]. The present larval-midgut infection model extends that comparison by identifying an additional association between dorsal1 knockdown and apidaecin, whereas dorsal2 knockdown did not significantly alter apidaecin. The absence of detectable changes in abaecin, defensin2, and hymenoptaecin further shows that the measured Dorsal transcripts were not uniformly associated with all A. apis-responsive AMP genes. Their induction may instead involve other transcription factors, immune-pathway cross-talk, or differences in the timing and cellular origin of AMP expression. Honey bees retain core Toll and IMD modules but have a reduced and reorganized immune-gene repertoire relative to Drosophila, and individual AMP genes cannot always be assigned exclusively to the canonical pathway relationships established in flies [16,39,40]. Because the present study targeted dorsal transcripts rather than upstream Toll components or the IMD-associated transcription factor Relish, it does not resolve the relative contribution of each pathway to a given AMP transcript.
Isoform-targeted RNAi further identified transcript-associated heterogeneity among the three tested dorsal1 isoforms. Targeting RNA9886, RNA9888, or RNA9890 was accompanied by reduced apidaecin, whereas defensin1 decreased after targeting RNA9888 or RNA9890 but not RNA9886 alone. Based on the transcript models underlying Figure 2, RNA9886 is predicted to encode a 587-amino-acid (aa) protein, whereas RNA9888 and RNA9890 share an identical coding sequence and encode the same 810-aa protein. All three predicted products retain the N-terminal Dorsal/Dif Rel homology DNA-binding and dimerization domains, but the RNA9886 product diverges from the RNA9888/RNA9890 product downstream of residue 325 in the C-terminal region. Because the Dorsal C-terminal region can contribute to transcriptional activation and repression in Drosophila [41], this coding difference provides a plausible context for the observed treatment-control pattern. Basal isoform abundance, dsRNA accessibility and knockdown efficiency, and post-transcriptional regulation may also contribute to the observed pattern. Accordingly, these findings are interpreted as transcript-level associations rather than evidence of established isoform-specific protein functions. Isoform-resolved protein quantification, transcriptional-activity assays, and direct UTR-reporter experiments will be required to distinguish these possibilities.
The results showed that a 57.6% knockdown of dorsal1 resulted in a 39.2% reduction in apidaecin expression, whereas knockdown of the individual transcripts, with efficiencies of 45.3%, 57.4%, and 27.0%, respectively, resulted in greater reductions in apidaecin expression (62.5–89.0%). Although knockdown of either dorsal1 or its individual transcripts consistently reduced apidaecin expression, an apparent inconsistency was observed in that transcript-specific knockdown produced a greater reduction in apidaecin expression than knockdown of dorsal1 as a whole. Based on our current understanding, we cannot fully explain this discrepancy. One possible explanation is that knockdown of dorsal1 may affect its multiple transcripts to different extents. In addition, individual transcripts may differ in their relative contributions to the regulation of apidaecin expression. At the same time, we cannot exclude the possibility that measurement-related experimental variation may have contributed to the observed discrepancy.

5. Conclusions

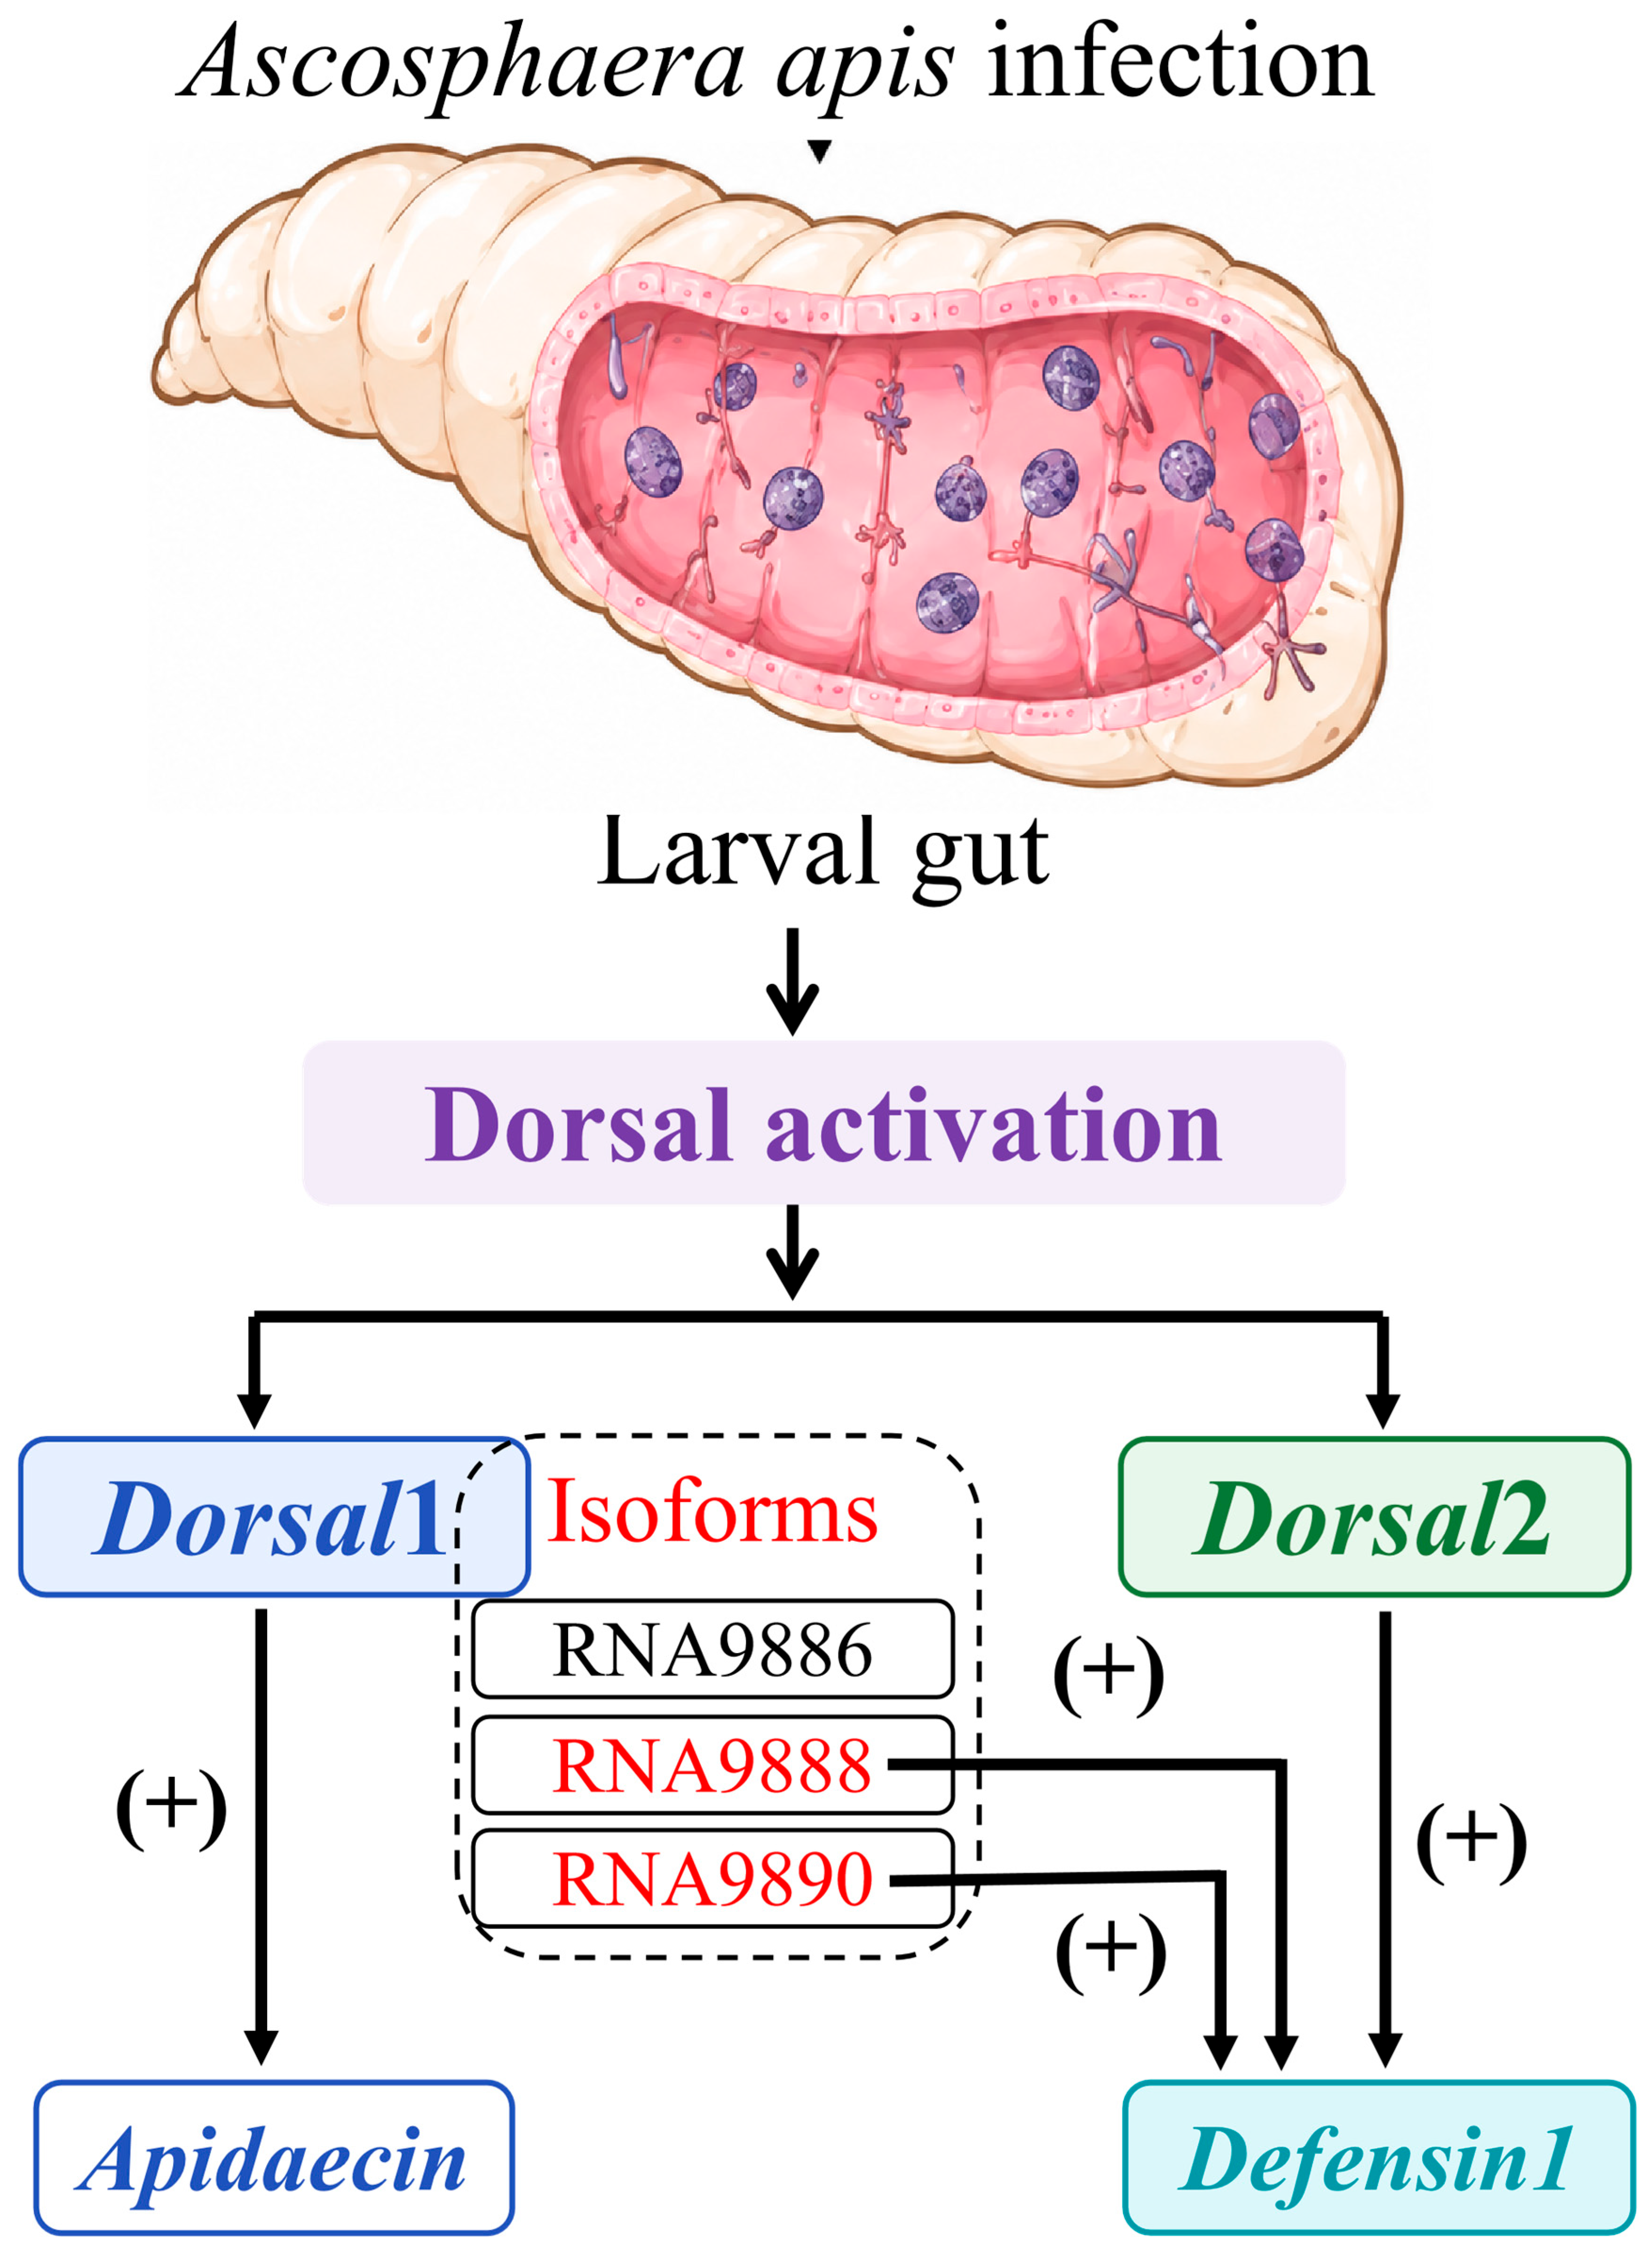
A. apis infection was associated with increased dorsal1, dorsal2, and AMP transcript abundance in the midgut of A. cerana larvae. RNAi-mediated reductions in dorsal1 and dorsal2 were accompanied by selective and partially overlapping AMP transcript changes: dorsal1 knockdown was associated with reduced apidaecin and defensin1, whereas dorsal2 knockdown was associated principally with reduced defensin1 (Figure 8). Targeting selected dorsal1 transcripts likewise produced distinct AMP transcript-response patterns (Figure 8). These data support homolog- and transcript-associated regulation at the RNA level, but they do not establish Dorsal protein abundance, nuclear localization, transcriptional activity, or direct functional differences among protein isoforms.

Supplementary Materials

The following supporting information can be downloaded at: https://www.mdpi.com/article/10.3390/biom16091223/s1, Supplementary Data S1: The transcript sequences. Table S1: PCR primers used in this study.

Author Contributions

Conceptualization, H.Z., X.Y., D.C. and R.G.; methodology, H.Z.; investigation, H.Z. and X.C.; resources, X.C. and J.Q.; visualization, X.C.; supervision, X.L., D.C. and R.G.; data curation, X.Y.; formal analysis, Q.T.; software, Q.T.; writing & original draft preparation, Q.T.; writing & review and editing, H.Z., X.L., X.Y. and J.Q.; project administration, D.C.; funding acquisition, R.G. and J.Q. All authors have read and agreed to the published version of the manuscript.

Funding

This research was funded by the National Natural Science Foundation of China, grant numbers 32372943 and 32172792; the Earmarked Fund for China Agriculture Research System, grant number CARS-44-KXJ7; and the Natural Science Foundation of Fujian Province, grant number 2025J01616.

Institutional Review Board Statement

Not applicable.

Informed Consent Statement

Not applicable.

Data Availability Statement

The data supporting the conclusions of this article are included within the article and its Supplementary Materials. Additional data are available from the corresponding author upon reasonable request.

Conflicts of Interest

The authors declare no conflicts of interest. The funders had no role in the design of the study; in the collection, analyses, or interpretation of data; in the writing of the manuscript; or in the decision to publish the results.

References

  1. Calderone, N.W. Insect pollinated crops, insect pollinators and US agriculture: Trend analysis of aggregate data for the period 1992–2009. PLoS ONE 2012, 7, e37235. [Google Scholar] [CrossRef] [Scilit] [PubMed]
  2. Aronstein, K.A.; Murray, K.D. Chalkbrood disease in honey bees. J. Invertebr. Pathol. 2010, 103, S20–S29. [Google Scholar] [CrossRef] [Scilit] [PubMed]
  3. Guo, R.; Zhang, L.; Xu, X.J.; Shi, X.L.; Xiong, C.L.; Zheng, Y.Z.; Fu, Z.M.; Huang, Z.J.; Wang, H.Q.; Hou, Z.X.; et al. Analysis of the differentially expressed genes in the 6-day-old larval gut of Apis cerana cerana under the stress of Ascosphaera apis. J. Environ. Entomol. 2017, 39, 539–547. (In Chinese) [Google Scholar] [CrossRef]
  4. Zhang, K.; Wang, F.; Fan, N.; Fan, X.; Wu, T.; Geng, Y.; Chen, X.; Qiu, J.; Fu, Z.; Chen, D.; et al. Novel_circ_002651 regulates the immune defense of eastern honeybee larvae against fungal invasion through sponging miR-6001-y. Virulence 2026, 17, 2656530. [Google Scholar] [CrossRef] [Scilit] [PubMed]
  5. Gliński, Z.; Jarosz, J. Infection and immunity in the honey bee Apis mellifera. Apiacta 2001, 36, 12–24. [Google Scholar]
  6. Barr, A.R.; Shope, R.E. The invertebrate gut as a barrier to invading parasites. In Invertebrate Immunity: Mechanisms of Invertebrate Vector–Parasite Relations; Maramorosch, K., Shope, R.E., Eds.; Academic Press: New York, NY, USA, 1975; pp. 113–114. [Google Scholar]
  7. Gliński, Z.; Buczek, K. Response of the Apoidea to fungal infections. Apiacta 2003, 38, 183–189. [Google Scholar]
  8. Hedengren-Olcott, M.; Olcott, M.C.; Mooney, D.T.; Ekengren, S.; Geller, B.L.; Taylor, B.J. Differential activation of the NF-κB-like factors Relish and Dif in Drosophila melanogaster by fungi and Gram-positive bacteria. J. Biol. Chem. 2004, 279, 21121–21127. [Google Scholar] [CrossRef] [Scilit] [PubMed]
  9. Stanley, D.; Miller, J.; Tunaz, H. Eicosanoid actions in insect immunity. J. Innate Immun. 2009, 1, 282–290. [Google Scholar] [CrossRef] [Scilit] [PubMed]
  10. Casteels-Josson, K.; Zhang, W.; Capaci, T.; Casteels, P.; Tempst, P. Acute transcriptional response of the honeybee peptide-antibiotics gene repertoire and required post-translational conversion of the precursor structures. J. Biol. Chem. 1994, 269, 28569–28575. [Google Scholar] [CrossRef] [Scilit]
  11. Zhou, L.; Meng, G.; Zhu, L.; Ma, L.; Chen, K. Insect antimicrobial peptides as guardians of immunity and beyond: A review. Int. J. Mol. Sci. 2024, 25, 3835. [Google Scholar] [CrossRef] [Scilit] [PubMed]
  12. Liu, J.; Wu, Y.; Li, Z.; Tang, J.; Zhou, X.; Luo, S. Gut microbiota-derived butyrate primes systemic immunity in honey bees by mediating lipid metabolic reprogramming. Nat. Commun. 2026, 17, 2924. [Google Scholar] [CrossRef] [Scilit] [PubMed]
  13. Lemaitre, B.; Nicolas, E.; Michaut, L.; Reichhart, J.M.; Hoffmann, J.A. The dorsoventral regulatory gene cassette spätzle/Toll/cactus controls the potent antifungal response in Drosophila adults. Cell 1996, 86, 973–983. [Google Scholar] [CrossRef] [Scilit] [PubMed]
  14. Lemaitre, B.; Reichhart, J.M.; Hoffmann, J.A. Drosophila host defense: Differential induction of antimicrobial peptide genes after infection by various classes of microorganisms. Proc. Natl. Acad. Sci. USA 1997, 94, 14614–14619. [Google Scholar] [CrossRef] [Scilit] [PubMed]
  15. Belvin, M.P.; Anderson, K.V. A conserved signaling pathway: The Drosophila Toll–Dorsal pathway. Annu. Rev. Cell Dev. Biol. 1996, 12, 393–416. [Google Scholar] [CrossRef] [Scilit] [PubMed]
  16. Evans, J.D.; Aronstein, K.; Chen, Y.P.; Hetru, C.; Imler, J.L.; Jiang, H.; Kanost, M.; Thompson, G.J.; Zou, Z.; Hultmark, D. Immune pathways and defence mechanisms in honey bees Apis mellifera. Insect Mol. Biol. 2006, 15, 645–656. [Google Scholar] [CrossRef] [Scilit] [PubMed]
  17. Roth, S. Neofunctionalization of Toll signaling in insects: From immunity to dorsoventral patterning. Annu. Rev. Cell Dev. Biol. 2023, 39, 1–22. [Google Scholar] [CrossRef] [Scilit] [PubMed]
  18. Liu, G.; Tian, Y.; Hanson, M.A.; Sah, P.K.; Li, J.; Lemaitre, B. Drosophila host defense mechanisms against filamentous fungal pathogens with diverse lifestyles. PLoS Pathog. 2026, 22, e1013995. [Google Scholar] [CrossRef] [Scilit] [PubMed]
  19. Du, Y.; Sun, M.; Xiao, Y.; Yang, J.; Hu, M.; Chen, Q.; Li, Y.; Wei, T. The insect Toll pathway activates antibacterial immunity against the citrus Huanglongbing pathogen. Nat. Commun. 2026, 17, 2721. [Google Scholar] [CrossRef] [Scilit] [PubMed]
  20. Jia, D.; Luo, G.; Guan, H.; Yu, T.; Sun, X.; Du, Y.; Wang, Y.; Chen, H.; Wei, T. Arboviruses antagonize insect Toll antiviral immune signaling to facilitate the coexistence of viruses with their vectors. PLoS Pathog. 2024, 20, e1012318. [Google Scholar] [CrossRef] [Scilit] [PubMed]
  21. Lourenço, A.P.; Florecki, M.M.; Simões, Z.L.P.; Evans, J.D. Silencing of Apis mellifera dorsal genes reveals their role in expression of the antimicrobial peptide defensin-1. Insect Mol. Biol. 2018, 27, 577–589. [Google Scholar] [CrossRef] [Scilit] [PubMed]
  22. Dong, Y.; Taylor, H.E.; Dimopoulos, G. AgDscam, a hypervariable immunoglobulin domain-containing receptor of the Anopheles gambiae innate immune system. PLoS Biol. 2006, 4, e229. [Google Scholar] [CrossRef] [Scilit] [PubMed]
  23. Dong, Y.; Cirimotich, C.M.; Pike, A.; Chandra, R.; Dimopoulos, G. Anopheles NF-κB-regulated splicing factors direct pathogen-specific repertoires of the hypervariable pattern recognition receptor AgDscam. Cell Host Microbe 2012, 12, 521–530. [Google Scholar] [CrossRef] [Scilit] [PubMed]
  24. Fan, Y.; Yao, D.; Ma, J.; You, F.; Wei, X.; Ji, T. Alternative splicing and alternative polyadenylation-regulated cold stress response of Apis cerana. Insects 2024, 15, 1006. [Google Scholar] [CrossRef] [Scilit] [PubMed]
  25. Song, Y.X.; Li, K.Z.; Zang, H.; Jing, X.; Fan, X.X.; Zou, P.Y.; Chen, D.F.; Fu, Z.M.; Guo, R. Construction and annotation of the full-length transcriptome of the larval gut of Apis cerana cerana (Hymenoptera: Apidae) workers. Acta Entomol. Sin. 2024, 67, 183–192. (In Chinese) [Google Scholar] [CrossRef]
  26. Bronkhorst, A.W.; van Rij, R.P. The long and short of antiviral defense: Small RNA-based immunity in insects. Curr. Opin. Virol. 2014, 7, 19–28. [Google Scholar] [CrossRef] [Scilit] [PubMed]
  27. Brutscher, L.M.; Daughenbaugh, K.F.; Flenniken, M.L. Virus and dsRNA-triggered transcriptional responses reveal key components of honey bee antiviral defense. Sci. Rep. 2017, 7, 6448. [Google Scholar] [CrossRef] [Scilit] [PubMed]
  28. Zambon, R.A.; Vakharia, V.N.; Wu, L.P. RNAi is an antiviral immune response against a dsRNA virus in Drosophila melanogaster. Cell. Microbiol. 2006, 8, 880–889. [Google Scholar] [CrossRef] [Scilit] [PubMed]
  29. Agrawal, N.; Dasaradhi, P.V.; Mohmmed, A.; Malhotra, P.; Bhatnagar, R.K. RNA interference: Biology, mechanism, and applications. Microbiol. Mol. Biol. Rev. 2003, 67, 657–685. [Google Scholar] [CrossRef] [Scilit] [PubMed]
  30. Park, M.G.; Kim, W.J.; Choi, J.Y.; Kim, J.H.; Park, D.H.; Kim, J.Y.; Wang, M.; Je, Y.H. Development of a Bacillus thuringiensis-based dsRNA production platform to control sacbrood virus in Apis cerana. Pest Manag. Sci. 2020, 76, 1699–1704. [Google Scholar] [CrossRef] [Scilit] [PubMed]
  31. Zamore, P.D.; Tuschl, T.; Sharp, P.A.; Bartel, D.P. RNAi: Double-stranded RNA directs the ATP-dependent cleavage of mRNA at 21 to 23 nucleotide intervals. Cell 2000, 101, 25–33. [Google Scholar] [CrossRef] [Scilit] [PubMed]
  32. Chen, D.; Guo, R.; Xu, X.; Xiong, C.; Liang, Q.; Zheng, Y.; Luo, Q.; Zhang, Z.; Huang, Z.; Kumar, D.; et al. Uncovering the immune responses of Apis mellifera ligustica larval gut to Ascosphaera apis infection utilizing transcriptome sequencing. Gene 2017, 621, 40–50. [Google Scholar] [CrossRef] [Scilit] [PubMed]
  33. Feng, R.; Fu, Z.; Du, Y.; Zhang, W.; Fan, X.; Wang, H.; Wan, J.; Zhou, Z.; Kang, Y.; Chen, D.; et al. Identification and analysis of microRNAs in the larval gut of Apis cerana cerana. Sci. Agric. Sin. 2022, 55, 208–218. [Google Scholar] [CrossRef]
  34. Robinson, J.T.; Thorvaldsdóttir, H.; Winckler, W.; Guttman, M.; Lander, E.S.; Getz, G.; Mesirov, J.P. Integrative Genomics Viewer. Nat. Biotechnol. 2011, 29, 24–26. [Google Scholar] [CrossRef] [Scilit] [PubMed]
  35. Shi, W.; Sun, J.; Xu, B.; Li, H. Molecular characterization and oxidative stress response of a cytochrome P450 gene (CYP4G11) from Apis cerana cerana. Z. Naturforsch. C J. Biosci. 2013, 68, 509–521. [Google Scholar] [CrossRef] [Scilit]
  36. Ma, M.; Jia, H.; Cui, X.; Zhai, N.; Wang, H.; Guo, X.; Xu, B. Isolation of carboxylesterase (esterase FE4) from Apis cerana cerana and its role in oxidative resistance during adverse environmental stress. Biochimie 2018, 144, 85–97. [Google Scholar] [CrossRef] [Scilit] [PubMed]
  37. Livak, K.J.; Schmittgen, T.D. Analysis of relative gene expression data using real-time quantitative PCR and the 2−ΔΔCT method. Methods 2001, 25, 402–408. [Google Scholar] [CrossRef] [Scilit] [PubMed]
  38. Bustin, S.A.; Ruijter, J.M.; van den Hoff, M.J.B.; Kubista, M.; Pfaffl, M.W.; Shipley, G.L.; Tran, N.; Rödiger, S.; Untergasser, A.; Mueller, R.; et al. MIQE 2.0: Revision of the Minimum Information for Publication of Quantitative Real-Time PCR Experiments Guidelines. Clin. Chem. 2025, 71, 634–651. [Google Scholar] [CrossRef] [Scilit] [PubMed]
  39. Aggarwal, K.; Silverman, N. Positive and negative regulation of the Drosophila immune response. BMB Rep. 2008, 41, 267–277. [Google Scholar] [CrossRef] [Scilit] [PubMed]
  40. Lemaitre, B.; Hoffmann, J. The host defense of Drosophila melanogaster. Annu. Rev. Immunol. 2007, 25, 697–743. [Google Scholar] [CrossRef] [Scilit] [PubMed]
  41. Flores-Saaib, R.D.; Jia, S.; Courey, A.J. Activation and repression by the C-terminal domain of Dorsal. Development 2001, 128, 1869–1879. [Google Scholar] [CrossRef] [Scilit] [PubMed]
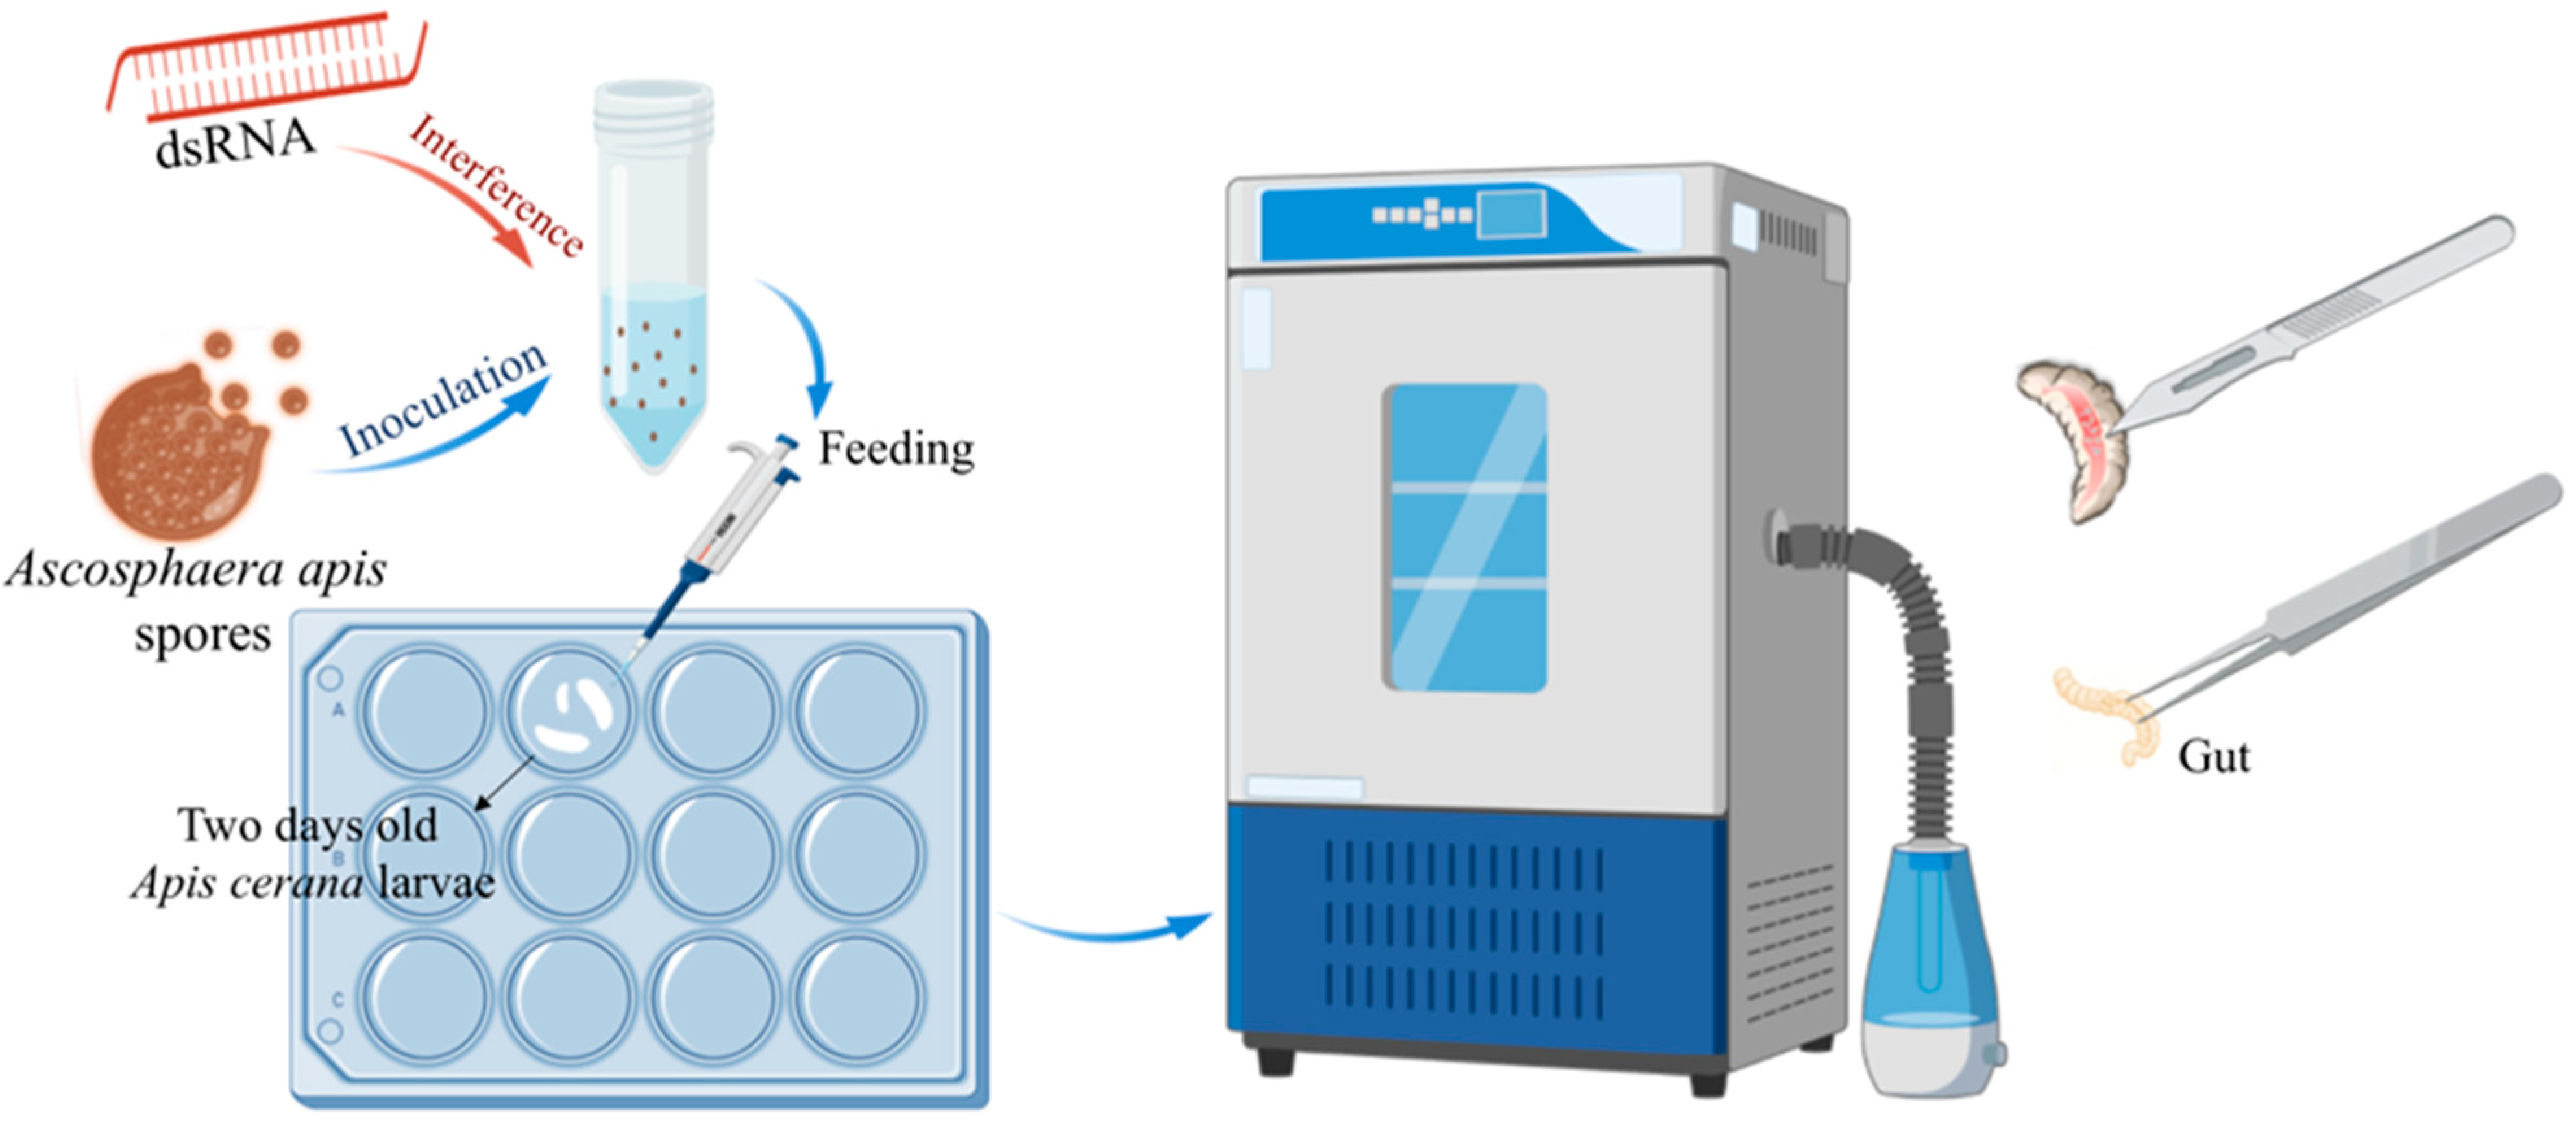
Figure 1. Schematic diagram illustrating the procedures for Ascosphaera apis spore and dsRNA feeding, as well as the collection of midgut samples from bee larvae.
Biomolecules 16 01223 g001
Figure 2. Design of shared-region dsRNA targets and validation of dorsal1 and dorsal2 knockdown in uninfected A. cerana larvae. (A) Locations of the dsRNA-dorsal1 target region and qPCR primer regions across dorsal1 transcript isoforms. (B) Locations of the dsRNA-dorsal2 target region and qPCR primer region in dorsal2. (CH) Relative expression of dorsal1 and dorsal2 in 4-, 5-, and 6-day-old larvae after dsRNA feeding: dorsal1 after dsRNA-dorsal1 (C), dsRNA-dorsal2 (D), or dsRNA-dorsal1 plus dsRNA-dorsal2 (E), and dorsal2 after dsRNA-dorsal1 (F), dsRNA-dorsal2 (G), or dsRNA-dorsal1 plus dsRNA-dorsal2 (H). dsRNA-egfp was used as the control. Data are shown as mean ± SD (n = 3). Statistical significance was analyzed by two-way ANOVA followed by Sidak multiple comparisons. ns, p > 0.05; *, p < 0.05; **, p < 0.01, ***, p < 0.001, ****, p < 0.0001.
Biomolecules 16 01223 g002
Figure 3. Validation of dorsal1 and dorsal2 knockdown in A. apis-inoculated A. cerana larvae. Relative expression of dorsal1 and dorsal2 was measured in 4-, 5-, and 6-day-old larvae after A. apis inoculation and dsRNA feeding. Panels show dorsal1 expression after dsRNA-dorsal1 (A), dsRNA-dorsal2 (B), or dsRNA-dorsal1 plus dsRNA-dorsal2 (C), and dorsal2 expression after dsRNA-dorsal1 (D), dsRNA-dorsal2 (E), or dsRNA-dorsal1 plus dsRNA-dorsal2 (F). dsRNA-egfp was used as the control, and Actin-5C was used as the endogenous reference gene. Data are shown as mean ± SD (n = 3). Statistical significance was analyzed by two-way ANOVA followed by Sidak multiple comparisons. ns, p > 0.05; *, p < 0.05; **, p < 0.01, ***, p < 0.001, ****, p < 0.0001.
Biomolecules 16 01223 g003
Figure 4. Expression of dorsal and AMP genes in A. apis-inoculated larvae. Relative transcript levels of dorsal1, dorsal2, abaecin, apidaecin, defensin1, defensin2, and hymenoptaecin were measured in the midguts of 6-day-old A. apis-inoculated larvae and uninoculated controls. Data are shown as mean ± SD (n = 3). Statistical significance was analyzed by Student’s t-test for each gene; *, p < 0.05; **, p < 0.01.
Biomolecules 16 01223 g004
Figure 5. Effects of dorsal1 and dorsal2 knockdown on AMP gene expression in A. apis-inoculated larvae. Relative expression levels of abaecin (A), apidaecin (B), defensin1 (C), defensin2 (D), and hymenoptaecin (E) were measured in 6-day-old A. apis-inoculated larvae after feeding dsRNA-egfp, dsRNA-dorsal1, dsRNA-dorsal2, or dsRNA-dorsal1 plus dsRNA-dorsal2. The first bar in each panel represents the A. apis + dsRNA-egfp control. Data are shown as mean ± SD (n = 3). Statistical significance was analyzed by Student’s t-test, with each treatment group compared with the control group. ns, p > 0.05; **, p < 0.01, ***, p < 0.001, ****, p < 0.0001.
Biomolecules 16 01223 g005
Figure 6. Isoform-specific knockdown of dorsal1 transcripts in A. apis-inoculated larvae. (A) Locations of dsRNA target regions and RT-qPCR primer regions for RNA9886, RNA9888, and RNA9890. (BD) Relative expression levels of RNA9886 (B), RNA9888 (C), and RNA9890 (D) in 6-day-old A. apis-inoculated larvae after feeding dsRNA-egfp, single transcript-targeting dsRNAs, or paired transcript-targeting dsRNAs. Data are shown as mean ± SD (n = 3). Statistical significance was analyzed by Student’s t-test, with each treatment group compared with the A. apis + dsRNA-egfp group. ns, p > 0.05; *, p < 0.05; **, p < 0.01.
Biomolecules 16 01223 g006
Figure 7. Effects of dorsal1 transcript knockdown on apidaecin and defensin1 expression in A. apis-inoculated larvae. Relative expression levels of apidaecin (A) and defensin1 (B) were measured in 6-day-old A. apis-inoculated larvae after feeding dsRNA-egfp, dsRNA-RNA9886, dsRNA-RNA9888, dsRNA-RNA9890, paired transcript-targeting dsRNAs, or the combined dsRNA-RNA9886 + dsRNA-RNA9888 + dsRNA-RNA9890 treatment. The first bar in each panel represents the A. apis + dsRNA-egfp control. Data are shown as mean ± SD (n = 3). Statistical significance was analyzed by Student’s t-test, with each treatment group compared with the control group. ns, p > 0.05; *, p < 0.05; **, p < 0.01, ***, p < 0.001, ****, p < 0.0001.
Biomolecules 16 01223 g007
Figure 8. Proposed transcript-level model of Dorsal-associated antimicrobial peptide expression in Apis cerana larvae during Ascosphaera apis infection.
Biomolecules 16 01223 g008
Disclaimer/Publisher’s Note: The statements, opinions and data contained in all publications are solely those of the individual author(s) and contributor(s) and not of MDPI and/or the editor(s). MDPI and/or the editor(s) disclaim responsibility for any injury to people or property resulting from any ideas, methods, instructions or products referred to in the content.