Article

Upregulation of GnT-IVa and Its Critical Roles in ATRA-Induced Differentiation of Acute Promyelocytic Leukemia Cells


by
Siming Zhang
1,2,
Tomoya Isaji
1,3,
Meng Zheng
1,
Yue Wang
1,
Tiangui Wu
1,
Tsukushi Saito
1,
Yuhang Zhou
1,
Tomohiko Fukuda
1,3,
Shinichiro Takahashi
3,4,* and
Jianguo Gu
1,3,*
1
Division of Regulatory Glycobiology, Graduate School of Pharmaceutical Sciences, Tohoku Medical and Pharmaceutical University, 4-4-1 Komatsushima, Aoba-ku, Sendai 981-8558, Japan
2
Department of Cancer Research Center, Nantong Tumor Hospital, The Affiliated Tumor Hospital of Nantong University, Nantong 226006, China
3
Institute of Molecular Biomembrane and Glycobiology, Tohoku Medical and Pharmaceutical University, Sendai 981-8558, Japan
4
Division of Laboratory Medicine, Faculty of Medicine, Tohoku Medical and Pharmaceutical University, 1-15-1 Fukumuro, Miyagino-ku, Sendai 983-8536, Japan
*
Authors to whom correspondence should be addressed.
Biomolecules 2026, 16(5), 756; https://doi.org/10.3390/biom16050756
Submission received: 16 April 2026 / Revised: 19 May 2026 / Accepted: 19 May 2026 / Published: 21 May 2026
(This article belongs to the Special Issue Insights from the Editorial Board Members)

Abstract

Glycosylation is essential for hematopoietic cell homeostasis and malignant transformation. Dysregulated expression of glycosylation genes in leukemia cells accelerates disease progression and fosters drug resistance. Therefore, targeting these genes offers a promising avenue for anti-leukemic therapy. In this study, we explore the roles of N-glycans in acute promyelocytic leukemia (APL) differentiation using the ATRA-induced wild-type NB4 (WT/ATRA) or HL-60 cell model. We found that expression of N-acetylglucosaminyltransferase IVa (GnT-IVa, encoded by the MGAT4A gene) and its product (β1,4-GlcNAc-branched N-glycan) increased significantly during differentiation, as evaluated by lectin blot, real-time PCR, and flow cytometry. Interestingly, analysis of the Gene Expression Omnibus (GEO) public data showed that MGAT4A expression is significantly lower in APL patients, and higher MGAT4A expression was associated with favorable survival in AML cohorts. To address the role of GnT-IVa in differentiation, we established MGAT4A- and MGAT4B-knockout (KO) NB4 cell lines using CRISPR/Cas9. Compared to WT/ATRA cells, MGAT4A KO, but not MGAT4B KO, markedly suppressed ATRA-induced differentiation, as evidenced by reduced expression of CD11b and CD11c. We found that CD11b is a major glycoprotein carrying β1,4-GlcNAc-branched N-glycans. This modification enhanced CD11b stability, as CD11b expression declined more rapidly in MGAT4A KO cells in the presence of cycloheximide. In addition, MGAT4A KO suppressed ERK/MAPK signaling, which contributed to differentiation. Our study highlights the critical role of GnT-IVa in regulating APL differentiation, which may provide a basis for developing new differentiation therapies for APL.

1. Introduction

Acute promyelocytic leukemia (APL), a distinct subtype of acute myeloid leukemia (AML), is driven by the t(15; 17)(q22; q21) translocation, which produces the PML-RARα fusion oncoprotein [1]. This fusion protein functions as a transcriptional repressor of retinoic acid-responsive genes and arises from the arrest of differentiation at the promyelocytic stage [2,3,4]. Currently, the standard treatment for APL combines all-trans retinoic acid (ATRA) and arsenic trioxide (ATO), which has significantly improved patient outcomes. However, despite this success, differentiation-based strategies have not been successfully extended to the broader spectrum of AML, where outcomes remain suboptimal [5]. Therefore, elucidating the molecular mechanisms that govern leukemic cell differentiation remains an important goal to expand differentiation therapy beyond APL.
Differentiation arrest in APL patients involves a complex interplay of multiple mechanisms, including cell cycle arrest [6], metabolic reprogramming [7,8] and autophagy regulation [9]. Current evidence suggests that dysregulated genetic control alone cannot fully account for the complexity of differentiation arrest in APL. Instead, post-translational modifications—such as ubiquitination [10,11], sumoylation [12], and glycosylation [13,14]—are closely associated with differentiation treatment in APL patients. Among these, glycosylation is one of the most important protein modifications, playing essential roles in protein folding, conformation, localization, stability, and activity [15]. Notably, aberrant protein glycosylation has been strongly linked to tumor development and progression [16]. For instance, N-acetylglucosaminyltransferase III (GnT-III, encoded by the MGAT3 gene) played a critical role in regulating erythroid differentiation in chronic myeloid leukemia [17]. Alpha2,3-sialyltransferase ST3GAL4 influenced the sensitivity of AML cells to Siglec-9-expressing macrophages, providing a possible target for immunotherapy in AML [18]. A combination of the fucosylation inhibitor 6-alkynylfucose (6AF) and ATRA significantly enhanced cell differentiation [13]. These studies highlight the significant roles of glycosylation in leukemia treatments. Additionally, some glycoproteins, such as CD79, CD82, and CD110, in leukemia cells have been reported to display abnormal glycans [19,20,21,22]. Despite advances in the field, the mechanisms by which N-glycans regulate differentiation in APL patients remain poorly understood, underscoring the need for further investigation. The NB4 and HL-60 cell lines, derived from APL and AML, respectively, provide a well-established model for studying ATRA-induced differentiation and offer a valuable system for identifying key regulatory pathways.
In this study, we observed a marked upregulation of GnT-IVa and its product, β1,4-GlcNAc-branched N-glycans, during differentiation, and this upregulation correlated positively with patient prognosis. MGAT4A KO impaired differentiation progression via the ERK pathway, accompanied by reduced expression of the markers CD11b and CD11c. Meanwhile, treatment with U0126, a specific MEK inhibitor, significantly suppressed differentiation and the expression of β1,4-GlcNAc-branched N-glycans. These findings underscore the importance of GnT-IVa in APL differentiation. The induction of MGAT4A suggests potential strategies to enhance the efficacy of differentiation therapy, offering new avenues for therapeutic intervention.

2. Materials and Methods

2.1. Reagents and Antibodies

The following antibodies and reagents were used in the experiments: Antibodies against CD11b (ab133357) were purchased from Abcam, Cambridge, UK; PU.1 (2266), p44/42 MAPK (9102), phospho-p44/42 MAPK (Thr202/Tyr204) (4370), the peroxidase-conjugated secondary antibody against rabbit (7074S), and U0126 (9903) were purchased from Cell Signaling Technology, Danvers, MA, USA; biotinylated Phaseolus vulgaris erythroagglutinin (E4-PHA) (B-1385), biotinylated Datura stramonium agglutinin (DSA) (B-1185), biotinylated Phaseolus vulgaris leucoagglutinin (L4-PHA) (B-1115–2) and ABC kit (PK-4000) were from Vector Laboratories, Burlingame, CA, USA; biotinylated Lens culinaris agglutinin (LCA) (J207) was obtained from J-Oil Mills, Tokyo, Japan; the anti-GAPDH (G9545) antibody was acquired from Sigma; the PE-conjugated mouse anti-human CD11b antibody was from BioLegend, San Diego, CA, USA; PNGase F was from Roche, Diagnostics, Mannheim, Germany. Cycloheximide (CHX) (037-20991) was from Wako, Saitama, Japan.

2.2. Cell Culture and Morphological Analysis

The NB4 and HL-60 cells were obtained from the Cell Resource Center for Biomedical Research at Tohoku University, Sendai, Japan. Cells were cultured in RPMI 1640 (Wako, Saitama, Japan) supplemented with 10% fetal bovine serum in a humidified atmosphere at 37 °C with 5% CO2. During erythroid differentiation, cells were treated with ATRA at 100 nM for 1, 3, and 5 days. Differentiated cells were collected and smeared onto glass slides for Wright–Giemsa staining. Differentiation was evaluated using a ZEISS LSM 900 confocal microscope (Carl Zeiss, Oberkochen, Germany).

2.3. Acquisition of the GEO Database for Bioinformatics Analysis

Gene expression datasets GSE71014 and GSE13159 were obtained from the Gene Expression Omnibus (GEO) database (https://www.ncbi.nlm.nih.gov/geo/) (accessed on 22 July 2025). The GSE13159 dataset was used to validate the expression of characteristic genes [23,24]. After excluding certain samples, the analysis included 73 normal bone marrow samples and 34 bone marrow samples from AML patients with the t(15; 17)(q22; q21) translocation. For prognostic analysis, the GSE71014 dataset, which includes RNA-seq and survival data from 104 AML patients, was used. Based on gene expression, patients were assigned to low- and high-expression groups. Survival differences between the two groups were assessed by Kaplan–Meier analysis and compared using the log-rank test with the “survival” (version 3.8-3) and “survminer” (version 0.5.0) by R packages (version 4.3.3) [25] Xiantao Academic (https://www.xiantaozi.com/) (accessed on 22 February 2026) is a powerful bioinformatics analysis tool that offers extensive functionalities for gene correlation analysis [26].

2.4. Western Blot and Lectin Blot Analysis

Cells were washed with ice-cold PBS and lysed on ice for 30 min in lysis buffer (20 mM Tris–HCl, pH 7.4, 150 mM NaCl, 1% Triton X-100) containing protease and phosphatase inhibitors (Nacalai Tesque, Kyoto, Japan). Lysates were centrifuged at 15,000× g for 10 min at 4 °C, and the supernatant was collected. Protein concentrations were determined using a BCA protein assay kit (Pierce Biotechnology, Rockford, IL, USA). For pull-down assays, equal amounts of protein were incubated with DSA-agarose overnight at 4 °C with rotation. The beads were washed twice with TBS, and bound proteins were analyzed by Western blotting.
For Western and lectin blotting, equal amounts of protein were resolved by SDS-PAGE and transferred to PVDF membranes (MilliporeSigma, Billerica, MA, USA). Membranes were blocked with 5% BSA (for lectin blot) or 5% nonfat milk (for Western blot) in TBS containing 0.05% Tween-20 (TBST) for 90 min at room temperature, then incubated with primary antibodies or biotinylated lectins overnight at 4 °C. After washing with TBST, membranes were incubated with appropriate horseradish peroxidase (HRP)-conjugated secondary antibodies or HRP-conjugated streptavidin. Signals were visualized using Immobilon Western Chemiluminescent HRP Substrate (MilliporeSigma, Billerica, MA, USA). Original western blot images can be found at Supplementary Figure S4.

2.5. Establishment of MGAT4A KO Cells

The Lenti-CRISPR v2 plasmid (#52961) was obtained from Addgene (Watertown, MA, USA). MGAT4A (5′-GTCAGGATAATAGCTTTCAG-3′) and MGAT4B (5′-GAAGGAGGACTCGGTCATCG-3′) KO cells were generated by targeting the human GnT-IVa and GnT-IVb genes. Lentiviral particles were produced by co-transfecting 293T cells with the Lenti-CRISPR v2 vector, and the packaging plasmids psPAX2 (5.5 μg), pMD2.G (2.4 μg), and TAX1 (0.6 μg) to enhance viral titers [27]. Viral supernatants were collected 48 h post-transfection and used to transduce NB4 cells. After transduction, cells were selected with puromycin (0.5 μg/mL) and plated in 96-well plates for single-cell clone isolation. Genomic DNA was extracted from the clones, and the targeted region was analyzed by PCR using the primers listed in Table 1.

2.6. RNA Extraction and Quantitative Real-Time PCR (qPCR) Analysis

RNAs were extracted using TRI Reagent (MilliporeSigma), and 1 μg of total RNA was reverse-transcribed into complementary DNA using PrimeScript RT reagent with a genomic DNA Eraser (Takara Bio, Kusatsu, Japan) according to the manufacturer’s instructions. Primer sequences are listed in Table 2. PCR products were diluted to 50 ng/μL and analyzed on a StepOnePlus (Applied Biosystems, Foster City, CA, USA). Real-time PCR analyses were performed using TB Green Premix Ex Taq II (Tli RNaseH Plus) (Takara Bio) as described previously [28].

2.7. Flow Cytometry

Cells (1 × 10⁶) were washed twice with ice-cold PBS and incubated with the CD11b antibody in magnetic-activated cell sorting buffer (PBS containing 0.1% BSA) for 1.5 h on ice, with gentle mixing every 15 min. After washing, the cells were resuspended in 800 μL of cell sorting buffer. An isotype-matched PE-conjugated mouse IgG antibody (BioLegend, San Diego, CA, USA) served as a negative control. Fluorescence intensity was measured on an Attune flow cytometer (Thermo Fisher Scientific, Waltham, MA, USA) and analyzed using FlowJo V10 software. A vertical line (cut-off line) was set based on the fluorescence intensity of CD11b for the negative control samples. Cells to the right of the vertical line were defined as positive. The positive cell ratio was calculated as: Positive cell ratio (%) = (Number of cells to the right of the vertical line/Total number of cells in the histogram) × 100%.

2.8. Statistical Analysis

All data are presented as mean ± SD from at least three independent experiments. Statistical analyses were performed using GraphPad Prism 8.0.1 (GraphPad Software, Inc., San Diego, CA, USA) with one-way ANOVA and Tukey’s post hoc test, two-way ANOVA and Tukey’s multiple-comparisons test, or an unpaired Student’s t-test, as appropriate. Survival curves were generated using the KM method and compared using the log-rank test. Significance levels were set as follows: ns (not significant) for p > 0.05; * p < 0.05; ** p < 0.01; and *** p < 0.001.

3. Results

3.1. ATRA-Induced Differentiation in NB4 Cells

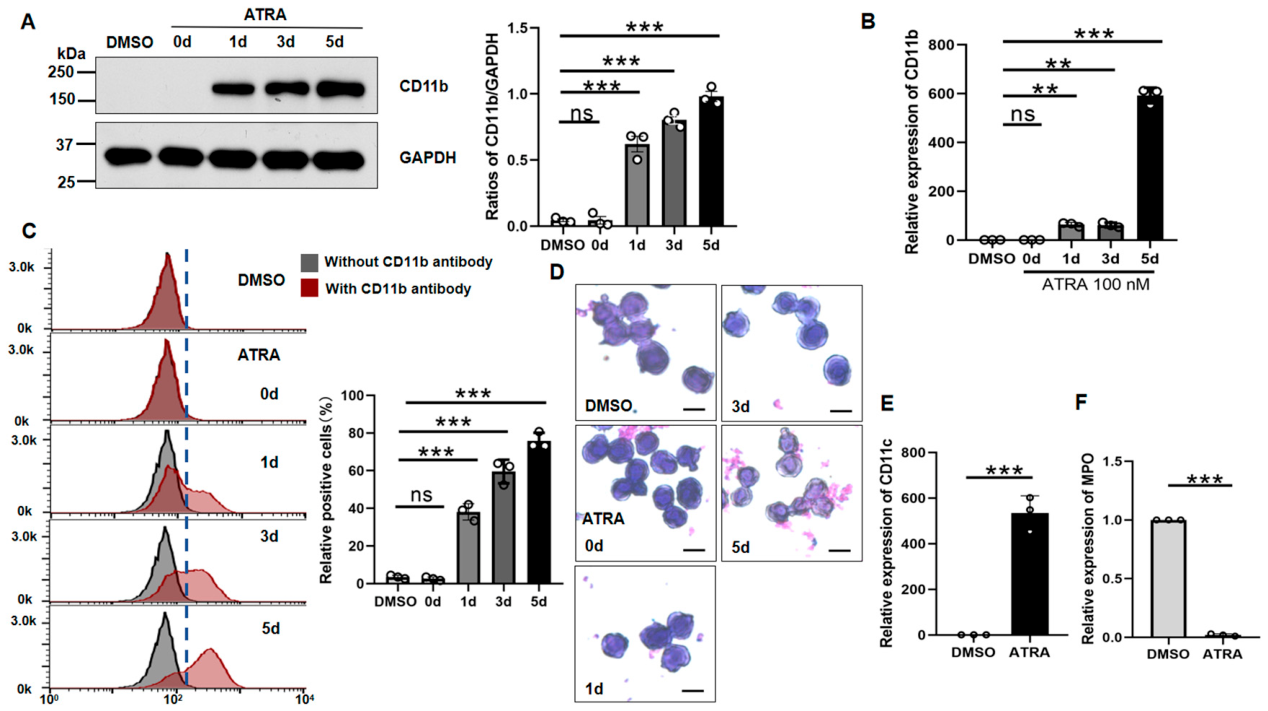
In this study, we induced differentiation of NB4 cells using ATRA, a well-established inducer. To determine the effect of ATRA on myeloid differentiation, NB4 cells were incubated with ATRA and then analyzed by Western blotting for CD11b, a myeloid monocyte differentiation marker. As shown in Figure 1A, ATRA significantly increased CD11b expression in a time-dependent manner. Quantitative PCR (qPCR) analysis revealed significant increases in CD11b mRNA levels following ATRA treatment (Figure 1B). Flow cytometry analysis confirmed significant upregulation of CD11b expression (Figure 1C). Consistent with these findings, morphological analysis of ATRA-treated NB4 cells showed a significant increase in differentiated cells, with nuclear indentation and bending, characteristic of granulocytic differentiation in metamyelocytes and the band stage. Furthermore, CD11c expression, another myeloid monocyte marker, was also increased during induction (Figure 1E). In contrast, myeloperoxidase (MPO) expression decreased during ATRA-induced differentiation (Figure 1F), consistent with previous reports [13,29]. These data suggest that ATRA at 100 nM effectively induces differentiation in NB4 cells over 5 days, as evidenced by changes in cell morphology and expression of differentiation markers.

3.2. The Expression Levels of β1,4-GlcNAc-Branched N-Glycans Increased in WT/ATRA Cells

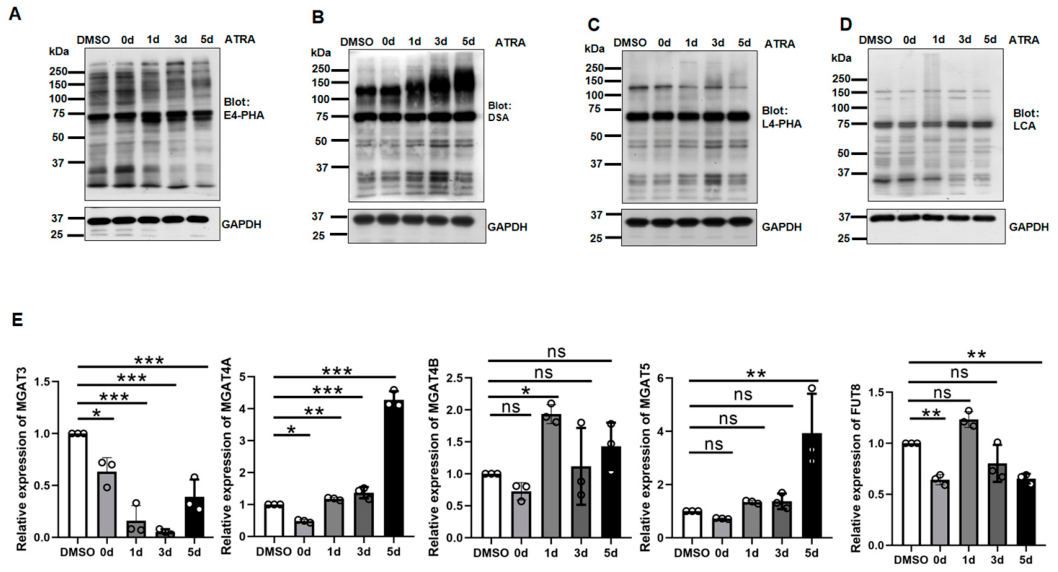
To compare N-glycan expression patterns between WT and WT/ATRA cells, we performed lectin blot analysis using four distinct lectins: E4-PHA lectin preferentially recognizes bisected N-glycans, DSA lectin recognizes β1,4-GlcNAc-branched N-glycans, L4-PHA lectin recognizes β1,6-GlcNAc-branched N-glycans and LCA lectin recognizes α1,6-linked fucose. WT/ATRA cells showed a marked increase in DSA reactivity compared to WT cells, particularly after 5 days, coinciding with NB4 cell differentiation (Figure 2A). In contrast, little or no changes were observed in the other lectin blots, including E4-PHA (Figure 2B), L4-PHA (Figure 2C) and LCA (Figure 2D). qPCR analysis revealed that the mRNA levels of MGAT4A, but not MGAT4B, were significantly increased in WT/ATRA cells compared to WT cells (Figure 2E). The other genes, except MGAT5, showed no significant differences, supporting these lectin blot results.
We also examined HL-60, an AML-M2 cell line that can be induced to differentiate by ATRA. We analyzed CD11b expression in a time-dependent manner (Supplementary Figure S1A). Lectin blot analysis showed that ATRA induced a significant upregulation of glycans recognized by the DSA lectin during differentiation (Supplementary Figure S1B), suggesting that β1,4-GlcNAc-branched N-glycans are important for ATRA-induced differentiation.
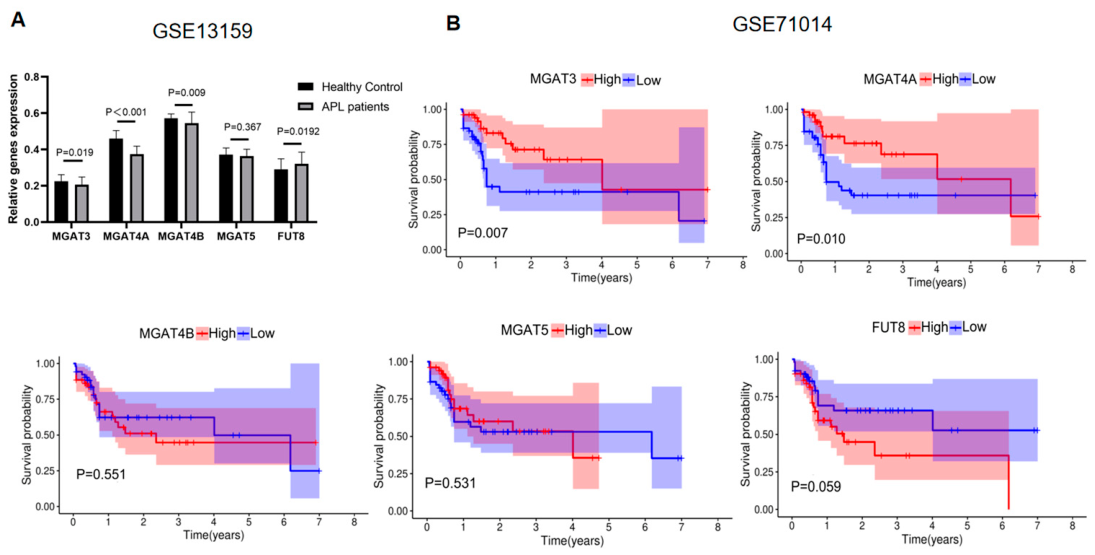
Furthermore, we analyzed expression and its clinical value in two independent GEO datasets (GSE13159 and GSE71014). Remarkably, expression levels of N-glycan-regulated genes, except for FUT8, were significantly lower in APL patients than in normal subjects. Among them, MGAT4A (p < 0.001) showed the most significant differential expression (Figure 3A). Kaplan–Meier survival curves showed that higher expression of MGAT4A (p = 0.01) or MGAT3 (p = 0.007) was associated with better prognosis in AML cohorts. However, no significant difference in survival time was observed between the high- and low-expression groups for MGAT4B, MGAT5, and FUT8 (Figure 3B). Therefore, MGAT4A may have prognostic relevance in AML.

3.3. MGAT4A KO, but Not MGAT4B KO, Suppressed ATRA-Induced Differentiation

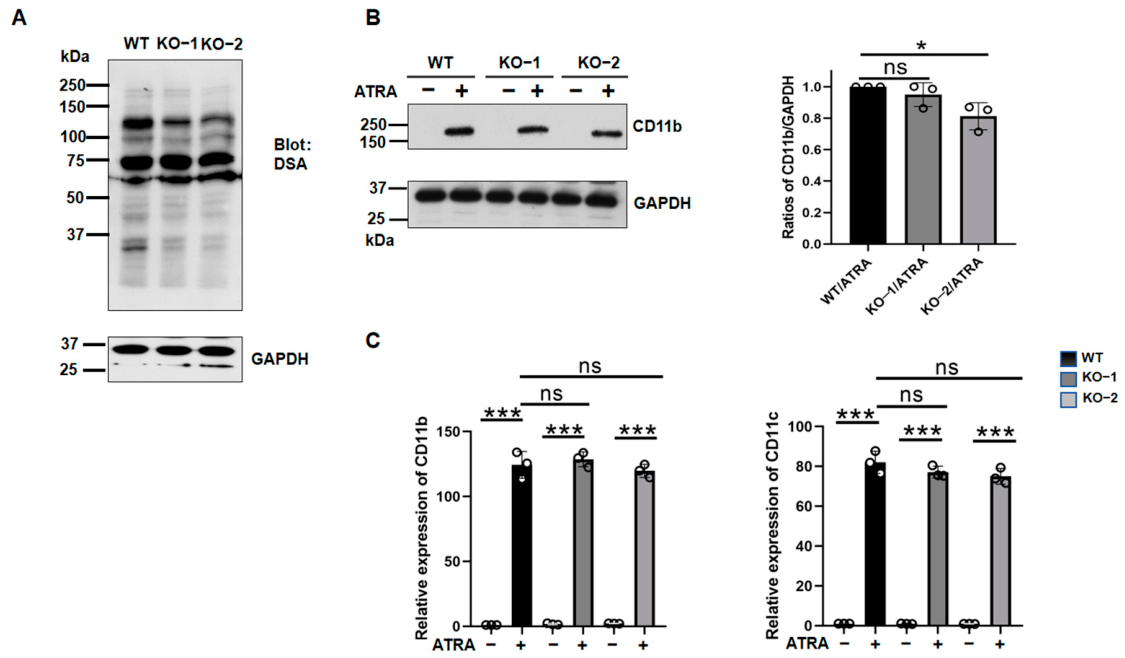
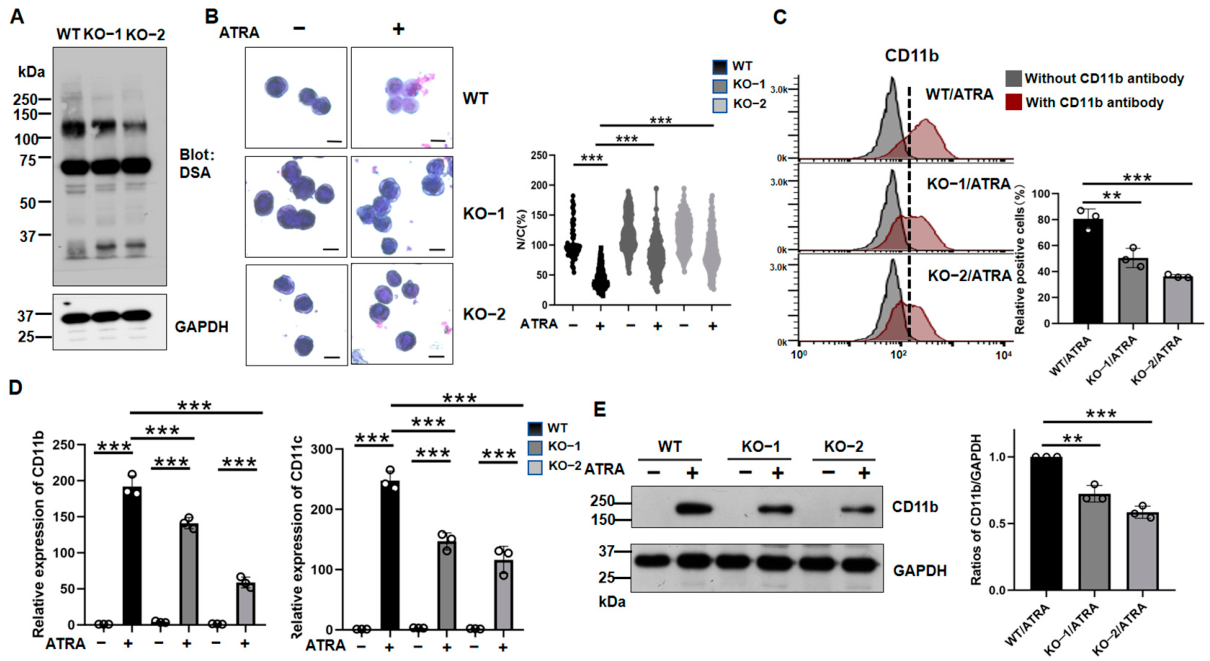
To investigate the role of MGAT4A, we generated MGAT4A KO in NB4 cells using CRISPR/Cas9 and validated two single-cell clones by genomic sequencing (Supplementary Figure S2A). As expected, both MGAT4A KO clones showed reduced reactivity with DSA lectin compared with parental WT cells (Figure 4A). Compared with WT cells, MGAT4A KO cells showed markedly impaired differentiation in response to ATRA, as assessed by the nucleus/cytoplasm area (N/C) ratio using Wright-Giemsa staining (Figure 4B). We detected CD11b expression on the cell surface by flow cytometric analysis (Figure 4C). We next examined the expression of differentiation-associated markers. qPCR analysis revealed that ATRA-induced mRNA expression of CD11b and CD11c was significantly suppressed in MGAT4A KO cells compared with the WT cells (Figure 4D). Consistently, CD11b protein levels were also reduced in MGAT4A KO cells, as determined by immunoblotting of cell lysates (Figure 4E).
To validate the effects of MGAT4B during ATRA-induced differentiation, we generated an MGAT4B knockout (KO) NB4 cell line using the CRISPR/Cas9 system and confirmed the knockout by genomic sequencing (Supplementary Figure S2B). The MGAT4B KO only slightly reduced DSA lectin reactivity, compared with WT cells (Figure 5A). Furthermore, the MGAT4B KO did not significantly suppress CD11b expression during ATRA-induced differentiation (Figure 5B). We then next examined the expression of differentiation-associated markers. As shown in Figure 4C, qPCR analysis revealed that ATRA-induced mRNA expression of CD11b and CD11c was not suppressed in MGAT4B KO cells compared with WT cells. These results strongly suggest that GnT-IVa and GnT-IVb may modify distinct substrates. Interestingly, Dr. Kizuka’s research group reported that GnT-IVa preferentially modifies larger glycoproteins, whereas GnT-IVb modifies proteins of approximately 75 kDa [30].

3.4. MGAT4A KO Suppressed PU.1 Expression and ERK Signaling During ATRA Induction

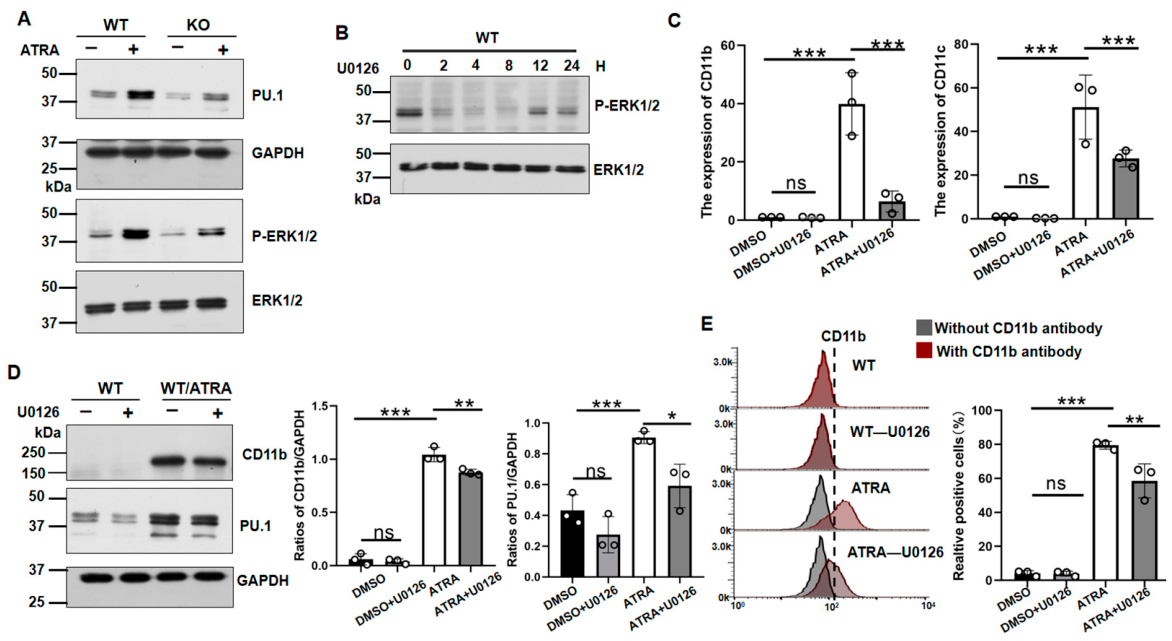
PU.1, encoded by the SPI1 gene, is a hematopoietic transcription factor that promotes myeloid differentiation and is upregulated upon ATRA treatment [31]. In addition, the ERK/MAPK cascade mediates ATRA-induced differentiation in APL cells, leading to increased PU.1 protein expression [32]. Here, we compared these changes between MGAT4A KO and WT cells. As shown in Figure 6A, PU.1 expression was markedly reduced in MGAT4A KO cells under ATRA induction compared with WT cells. ERK signaling activation was verified using Western blotting with an anti-phosphorylated ERK1/2 antibody. It clearly showed that the elevated levels of phosphorylated ERK1/2 in WT cells were neutralized in MGAT4A KO cells (Figure 6A). These results further support the involvement of MGAT4A in regulating ATRA-induced differentiation, which may be mediated by the ERK1/2 signaling pathway.
To confirm the role of the MEK/ERK signaling pathway in ATRA-induced differentiation, NB4 cells were treated with or without the MEK inhibitor U0126. U0126 effectively suppressed ERK1/2 phosphorylation within 1 h, and phosphorylation gradually recovered at 8, 12, and 24 h (Figure 6B), indicating that the inhibitory effect lasted approximately 8 h. To maintain sustained inhibition, the culture medium was replaced with fresh U0126 every 8 h throughout the induction period. The expression levels of CD11b and CD11c mRNA were significantly inhibited by U0126 (Figure 6C). In addition, inhibition was observed at the protein level by Western blotting with antibodies against CD11b and PU.1 (Figure 6D) and by flow cytometry (Figure 6E). Taken together, these results further confirmed that MGAT4A facilitates ATRA-induced differentiation, partially via the ERK/MAPK signaling pathway, positioning MGAT4A as a critical regulator of differentiation in APL cells.

3.5. Modification of CD11b by MGAT4A Prolonged Its Stability

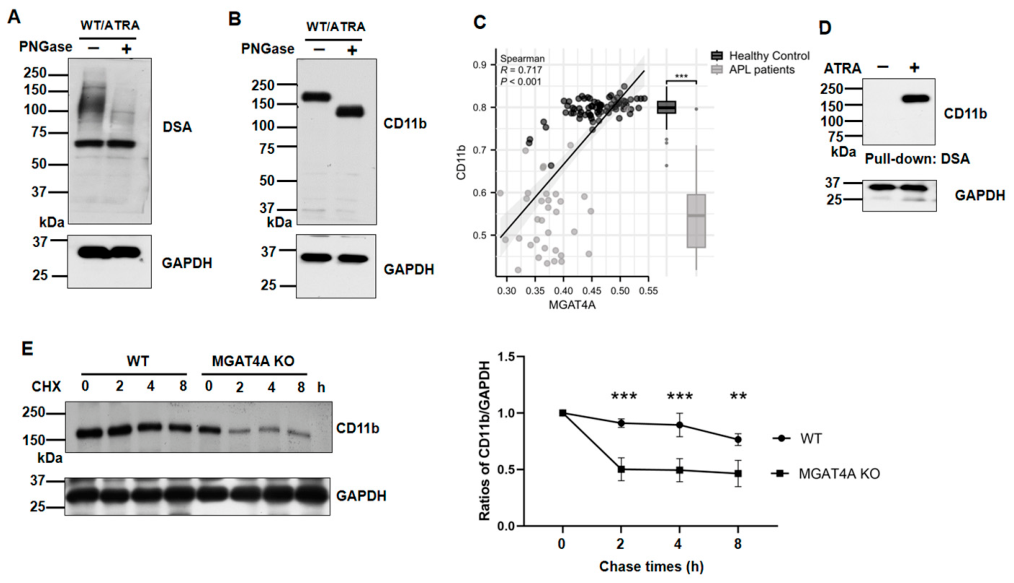
CD11b, also known as integrin alpha M, belongs to the integrin alpha chain family. Like other integrins [33], CD11b is a heavily N-glycosylated membrane protein [34,35]. PNGase F is an amidase that cleaves N-linked oligosaccharide chains from glycoproteins [36,37]. Following PNGase F treatment, reactivity with the DSA lectin was markedly reduced (Figure 7A). The molecular size of CD11b decreased, confirming that CD11b carries N-glycans (Figure 7B). Based on gene expression in the GSE13159 dataset, we observed a significant positive correlation between MGAT4A and CD11b levels (Spearman’s r = 0.717, p < 0.001), indicating that higher MGAT4A expression is associated with increased CD11b levels in healthy controls. In contrast, lower expression levels were observed in APL patients (Figure 7C). We observed no significantly positive correlation between MGAT4B and CD11b levels (Spearman’s r = 0.179, p = 0.066) in Supplement Figure S3A.
Then, we determined whether CD11b contains β1,4-GlcNAc-branched N-glycans, and a DSA pull-down assay was performed. As shown in Figure 7D, CD11b was detected in ATRA-induced cells, indicating that it carries β1,4-GlcNAc modification upon ATRA induction. Branched N-glycans are known to stabilize glycoproteins expressed on the cell surface [33]. To investigate the functions of CD11b modified by MGAT4A, we assessed CD11b stability in the presence of cycloheximide (CHX), a protein synthesis inhibitor. Interestingly, CD11b decayed significantly more rapidly in MGAT4A KO cells than in WT controls (Figure 7E). Given that CD11b mediates cell spreading and regulates intracellular signaling, including the ERK/MAPK signaling pathway [38,39], these findings suggest that the role of MGAT4A in ATRA induction may be mediated, at least in part, by modifying CD11b, thereby enhancing its cell surface expression and promoting ERK activation, which is important for cell differentiation.

4. Discussion

In this study, we investigated the roles of N-glycans in ATRA-induced differentiation and found the following: (1) GnT-IVa expression and its products, β1,4-GlcNAc N-glycans, were significantly upregulated in the differentiated cells; (2) MGAT4A KO, not MGAT4B KO, suppressed differentiation, suggesting substrate specificity for modification by GnT-IVa and GnT-IVb; and (3) GnT-IVa mediated β1,4-GlcNAc modification of CD11b enhancing its stability, which may partially modulate intracellular signaling to regulate cell differentiation. These findings demonstrate that GnT-IVa promotes differentiation, uncover a previously unrecognized role for GnT-IVa in differentiation.
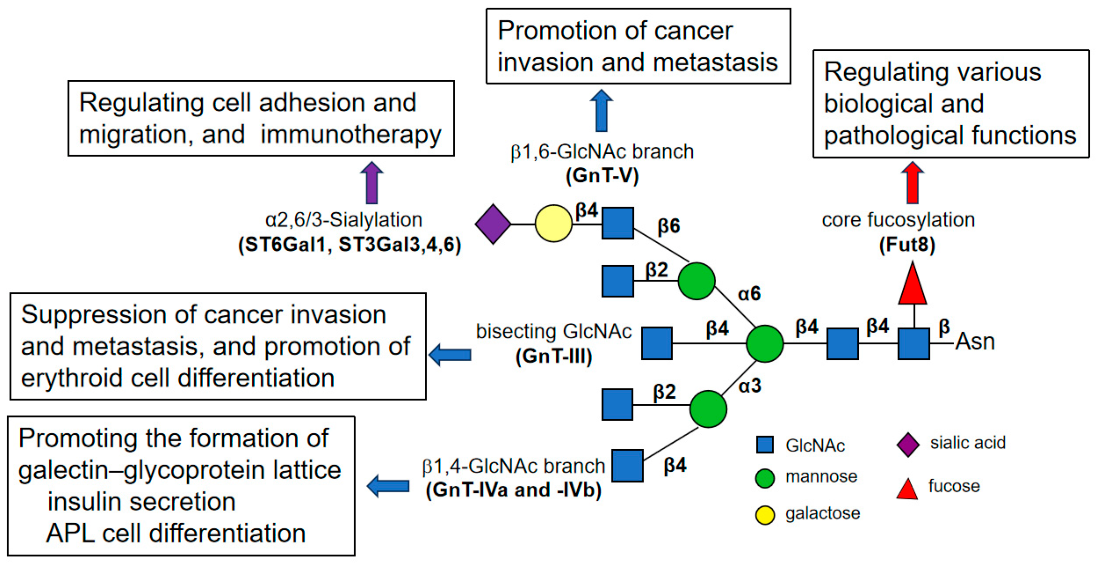
Many important questions remain about the role of GlcNAc-branched N-glycans. During N-glycan processing in the Golgi apparatus, the formation of a variable number of branches significantly increases the structural complexity of N-glycans [40]. As shown in Figure 8, each GlcNAc branch has distinct functions in the development and progression of various diseases by regulating the activities of specific glycoproteins [33]. For example, the β1,6 GlcNAc branch catalyzed by GnT-V significantly contributes to cancer invasion and metastasis [41,42]. In contrast, the β1,4 GlcNAc branch catalyzed by GnT-IVa plays a crucial role in regulating the glucose transporter 2 (GLUT2) and thereby influencing insulin secretion [43,44]. Conversely, the expression of bisecting GlcNAc catalyzed by GnT-III is often downregulated in cancers. The bisecting GlcNAc enzymatically sterically and/or conformationally interferes with the activities of GnT-IVs and GnT-V [45,46]. These observations may relate to galectin binding. Galectins cross-link glycoproteins, forming dynamic microdomains or lattices that control various mediators of cell adhesion, migration, proliferation, survival, and differentiation [47].
Galectins can be viewed as a code for repeating minimal binding units, N-acetyllactosamine (LacNAc), which can be extended with poly-LacNAc, fucose, sialic acid, and sulfate on the GlcNAc-branched N-glycans of glycoproteins, mainly modified by GnT-IVs and V. Multivalency is a key feature of galectin binding, allowing crosslinking of multiple targets and the formation of a galectin–glycoprotein lattice on the cell surface that influences receptor levels and functions. This galectin lattice has been linked to tumor progression through its effects on growth factor signaling [47] and on the stability of membrane glycoproteins such as GLUT2 and GLUT4 [43,48,49]. The phenomenon could also apply to CD11b in this study. As shown in Figure 7, the stability of CD11b was significantly downregulated in MGAT4A KO cells. Which galectins were involved in this event remains an important question for further study.
GnT-IVa and GnT-IVb are isozymes that catalyze the transfer of GlcNAc to α1,3-linked mannose in the core structure of N-glycans via a β1,4 linkage (Figure 8) [50,51,52]. Due to its high affinity for donor and acceptor substrates, GnT-IVa, but not GnT-IVb, is regarded as the primary enzyme for the formation of complex-type N-glycans [30]. In addition, the expression patterns of MGAT4A and MGAT4B are different in mammalian tissues. For example, MGAT4A expression was high in gastrointestinal tissues, whereas MGAT4B was ubiquitously expressed [43,51]. In pancreatic cancer, MGAT4A was downregulated due to the promoter methylation, while MGAT4B was overexpressed [53]. In choriocarcinoma, integrin β1 was modified by GnT-IVa to promote tumorigenicity [54,55]. In endometrial cancer, GnT-IVa/Galectin9-mediated modification of GLUT1 promoted glucose metabolism, supporting tumor proliferation and invasion [56]. These studies suggest that upregulation of GnT-IVa across various cancer types may promote tumor progression. These studies suggest that upregulation of GnT-IVa across various cancer types may promote tumor progression. In contrast, our findings demonstrate that GnT-IVa plays a differentiation-promoting role in APL cells, and higher MGAT4A expression is associated with a favorable prognosis (Figure 2). This apparent discrepancy may reflect the context-dependent functions of glycosylation. Because glycosyltransferases modify specific glycoprotein substrates available in a given cellular environment, the biological consequences of GnT-IVa activity are likely shaped by cell lineage, differentiation status, and signaling context. In epithelial tumors, GnT-IVa-mediated glycosylation may preferentially stabilize growth factor receptors or metabolic transporters that support tumor progression, as described above, whereas in leukemic cells, it may enhance the stability of differentiation-associated glycoproteins such as CD11b, thereby promoting differentiation signaling. These findings suggest that GnT-IVa may exert distinct biological effects depending on substrate availability and cellular context.
Our previous study showed that GnT-III, which increased E4-PHA staining, played a critical role in butylate-induced erythroid differentiation associated with the ERK/MAPK signaling pathway [17]. In ATRA-treated APL cells, we observed a decrease in E4-PHA staining alongside an increase in DSA staining; a similar observation has been reported previously [13], suggesting that distinct glycans play distinct roles in cell differentiation. This reciprocal change in N-glycans may also support the notion that GnT-III suppresses the formation of GlcNAc branches catalyzed by GnT-IV or GnT-V [57]. Thus, although GnT-IVa was the focus of this study, the functions of GnT-III in cell differentiation which could not be ruled out require further study. In addition, the ERK/MAPK signaling is required not only for butylate-induced erythroid differentiation [17] but also for ATRA-induced differentiation in APL cells [32] and this study.
PU.1 is a key hematopoietic transcription factor involved in myeloid, lymphoid, and erythroid differentiation and in regulating differentiation-associated genes such as CD11b [58,59]. Previous studies have shown that PU.1 is a downstream target gene of ATRA during APL treatment [60]. This study also showed that inhibition of ERK/MAPK signaling with the MEK-specific inhibitor U0126 suppressed ATRA-induced differentiation, PU.1 expression, and β1,4 GlcNAc-branched N-glycans, as assessed by DSA staining. Because PU.1 is a member of the Ets transcription factor family [61], these findings raise the possibility that Ets family transcription factors may participate in regulating MGAT4A expression during differentiation. In fact, Ets-1, another member of the Ets family, binds and trans-activates the MGAT4A and MGAT5 promoters [62,63]. Together, these observations suggest a potential mechanistic link between Ets family transcription factors and GnT-IVa expression during ATRA-induced differentiation. On the other hand, we confirmed a positive regulatory relationship between PU.1 and CD11B [64], and detected a positive correlation between PU.1 and MGAT4A in GSE13159 (Supplementary Figure S3B,C).
It remains unclear why GnT-IVa regulates cell differentiation, but we could speculate that GnT-IVa modifies cell-surface glycoproteins, such as CD11b, thereby modulating intracellular signaling that regulates cell differentiation. CD11b, the integrin αM subunit, can bind to various ligands, including complement, fibrinogen, and ICAM-1. The diversity of ligand binding provides a structural basis for the functional diversity of CD11b. CD11b has been demonstrated to mediate the adhesion, migration, chemotaxis, and recruitment of macrophages during inflammation [65,66], and to regulate the phagocytic action of macrophages toward tumor cells [67], and to initiate intracellular signaling, such as ERK/MAPK signaling [38,39]. In fact, CD11b modified with β1,4-GlcNAc-branched N-glycans greatly enhanced its stability and cellular signaling (Figure 7). Furthermore, we found a positive correlation between MGAT4A and CD11b (Figure 7C), but MGAT4B was not significant (Supplement Figure S3A). This study revealed that MGAT4A may directly affect protein stability, such as that of CD11b, and also regulate the functions of certain membrane glycoproteins that participate in the ERK/MAPK signaling pathway, thereby indirectly affecting CD11b mRNA expression. The target proteins of GnT-IVa remain to be further studied, as discussed below. Although a previous study reporting GnT-IV expression is particularly interesting because enzymatic activity increases during oncogenesis and myelocytic cell differentiation by 1α,25-dihydroxyvitamine D3 and interleukin-6 (IL-6) [52], it should be noted that GnT-IVa, but not GnT-IVb, promoted ATRA-induced differentiation in this study. Thus far, we do not know the underlying mechanism. Dr. Kizuka’s research group reported that GnT-IVa and GnT-IVb may have preference acceptors for modification; GnT-IVa modifies the larger glycoproteins, whereas GnT-IVb modifies smaller proteins [30]. The precise mechanisms require further investigation.
Several limitations of the present study should be acknowledged. First, the findings were derived primarily from NB4 and HL-60 cellular models and were not validated in primary patient samples or in vivo leukemia models. Although these cell lines are well-established systems for studying ATRA-induced differentiation, they cannot fully recapitulate the genetic heterogeneity and microenvironmental complexity of APL in patients. Second, based on expression data from public databases, future studies involving larger cohorts with comprehensive clinical information and prospective patient sample collection will be necessary to further validate the clinical relevance of GnT-IVa in leukemia progression and differentiation therapy. Third, although DSA pull-down assays suggested the presence of β1,4-GlcNAc-branched N-glycans on CD11b, the precise N-glycan structures and site-specific glycosylation patterns were not directly characterized in this study. Comprehensive glycomics and glycoproteomics, using MALDI-TOF MS or LC-MS/MS, will provide more definitive structural information on CD11b and other glycoproteins, thereby clarifying the molecular mechanisms underlying GnT-IVa-mediated regulation of protein stability and differentiation signaling.

5. Conclusions

This study identifies GnT-IVa as a differentiation-associated glycosyltransferase that promotes ATRA-induced differentiation in APL cells. We demonstrate that GnT-IVa-mediated β1,4-GlcNAc branching is upregulated during differentiation and contributes to the stabilization of CD11b, thereby influencing ERK/MAPK signaling. These findings reveal a previously unrecognized role of GnT-IVa in leukemic differentiation and support the concept that glycosylation actively contributes to differentiation regulation rather than merely representing a secondary consequence of cellular maturation, highlighting glycosylation as a potential regulatory mechanism in APL.

Supplementary Materials

The following supporting information can be downloaded at: https://www.mdpi.com/article/10.3390/biom16050756/s1, Figure S1: Effects of ATRA-induced HL60 cells on expression levels of CD11b and β1,4-GlcNAc-branched N-glycans. Figure S2: Establishment of knockout cell lines of NB4 cells. Figure S3: Correlation gene analysis and comparison between healthy controls and APL patients in GSE13159. Figure S4: Original Western blot.

Author Contributions

S.Z.: investigation, formal analysis, data curation, writing—original draft; T.I.: investigation, formal analysis, data curation; M.Z.: investigation; Y.W.: investigation; T.W.: investigation; T.S.: investigation; Y.Z.: investigation; T.F.: investigation, data curation; S.T.: writing—review and editing, writing—original draft, project administration, funding acquisition, conceptualization; J.G.: writing—review and editing, writing—original draft, project administration, funding acquisition, and conceptualization. All authors have read and agreed to the published version of the manuscript.

Funding

This work was partially supported by Grants-in-Aid for Scientific Research (23K27133, 25K10718) from the Japan Society for the Promotion of Science and also partly supported by the J-GlycoNet (Network-Type Joint Usage/Research Center for Glycoscience), Japan.

Institutional Review Board Statement

Not applicable.

Informed Consent Statement

Not applicable.

Data Availability Statement

The data used to support this study’s findings are available from the corresponding author upon reasonable request.

Acknowledgments

We acknowledge GEO database for providing their platforms and contributors for uploading their meaningful datasets.

Conflicts of Interest

The authors declare no conflicts of interest.

Abbreviations

AMLAcute myeloid leukemia
APLAcute promyelocytic leukemia
ATRAAll-trans retinoic acid
CHXCycloheximide
DSADatura stramonium agglutinin
E4-PHAPhaseolus vulgaris erythroagglutinin
GEOGene Expression Omnibus
GLUTGlucose transporter
GnTN-acetylglucosaminyltransferase
KOKnockout
L4-PHAPhaseolus vulgaris leucoagglutinin
LCALens culinaris agglutinin
MAPKMitogen-activated protein kinase
MPOMyeloperoxidase
N/CNucleus/cytoplasm
WTWild-type

References

  1. Hillestad, L.K. Acute promyelocytic leukemia. Acta Med. Scand. 1957, 159, 189–194. [Google Scholar]
  2. Choudhry, A.; DeLoughery, T.G. Bleeding and thrombosis in acute promyelocytic leukemia. Am. J. Hematol. 2012, 87, 596–603. [Google Scholar] [CrossRef]
  3. Rajpurkar, M.; Alonzo, T.A.; Wang, Y.C.; Gerbing, R.B.; Gamis, A.S.; Feusner, J.H.; Gregory, J.; Kutny, M.A. Risk Markers for Significant Bleeding and Thrombosis in Pediatric Acute Promyelocytic Leukemia; Report from the Children’s Oncology Group Study AAML0631. J. Pediatr. Hematol. Oncol. 2019, 41, 51–55. [Google Scholar] [CrossRef]
  4. de The, H.; Pandolfi, P.P.; Chen, Z. Acute Promyelocytic Leukemia: A Paradigm for Oncoprotein-Targeted Cure. Cancer Cell 2017, 32, 552–560. [Google Scholar] [CrossRef]
  5. Takahashi, S. Reawakening Differentiation Therapy in Acute Myeloid Leukemia: A Comprehensive Review of ATRA-Based Combination Strategies. Curr. Oncol. 2026, 33, 25. [Google Scholar] [CrossRef]
  6. Hattori, H.; Zhang, X.; Jia, Y.; Subramanian, K.K.; Jo, H.; Loison, F.; Newburger, P.E.; Luo, H.R. RNAi screen identifies UBE2D3 as a mediator of all-trans retinoic acid-induced cell growth arrest in human acute promyelocytic NB4 cells. Blood 2007, 110, 640–650. [Google Scholar] [CrossRef]
  7. Albanesi, J.; Noguera, N.I.; Banella, C.; Colangelo, T.; De Marinis, E.; Leone, S.; Palumbo, O.; Voso, M.T.; Ascenzi, P.; Nervi, C.; et al. Transcriptional and Metabolic Dissection of ATRA-Induced Granulocytic Differentiation in NB4 Acute Promyelocytic Leukemia Cells. Cells 2020, 9, 2423. [Google Scholar] [CrossRef]
  8. Zhu, D.; Gao, D.; Lu, Y.; Chen, N.; Zhang, L.; Zhang, L.; Wang, Y. Reversing the Warburg Effect: YW3-56 Induces Leukemia Differentiation via AKT-Mediated Glucose Metabolic Reprogramming. Pharmaceuticals 2025, 18, 1646. [Google Scholar] [CrossRef]
  9. Liu, S.; Wan, J.; Kong, Y.; Zhang, Y.; Wan, L.; Zhang, Z. Inhibition of CRL-NEDD8 pathway as a new approach to enhance ATRA-induced differentiation of acute promyelocytic leukemia cells. Int. J. Med. Sci. 2018, 15, 674–681. [Google Scholar]
  10. Dai, B.; Wang, F.; Wang, Y.; Zhu, J.; Li, Y.; Zhang, T.; Zhao, L.; Wang, L.; Gao, W.; Li, J.; et al. Targeting HDAC3 to overcome the resistance to ATRA or arsenic in acute promyelocytic leukemia through ubiquitination and degradation of PML-RARalpha. Cell Death Differ. 2023, 30, 1320–1333. [Google Scholar]
  11. Li, K.; Wang, F.; Cao, W.B.; Lv, X.X.; Hua, F.; Cui, B.; Yu, J.J.; Zhang, X.W.; Shang, S.; Liu, S.S.; et al. TRIB3 Promotes APL Progression through Stabilization of the Oncoprotein PML-RARalpha and Inhibition of p53-Mediated Senescence. Cancer Cell 2017, 31, 697–710.e7. [Google Scholar] [CrossRef]
  12. Xia, L.; Jiang, Y.; Zhang, X.H.; Wang, X.R.; Wei, R.; Qin, K.; Lu, Y. SUMOylation disassembles the tetrameric pyruvate kinase M2 to block myeloid differentiation of leukemia cells. Cell Death Dis. 2021, 12, 101. [Google Scholar] [CrossRef]
  13. Suzuki, S.; Liu, J.; Sato, Y.; Miyake, R.; Suzuki, S.; Okitsu, Y.; Fukuda, T.; Isaji, T.; Gu, J.; Takahashi, S. Fucosylation inhibitor 6-alkynylfucose enhances the ATRA-induced differentiation effect on acute promyelocytic leukemia cells. Biochem. Biophys. Res. Commun. 2024, 710, 149541. [Google Scholar] [CrossRef]
  14. Racanicchi, L.; Montanucci, P.; Basta, G.P.; Pensato, A.; Conti, V.; Calafiore, R. Effect of all trans retinoic acid on lysosomal alpha-D-mannosidase activity in HL-60 cell: Correlation with HL-60 cells differentiation. Mol. Cell. Biochem. 2008, 308, 17–24. [Google Scholar] [CrossRef]
  15. He, M.; Zhou, X.; Wang, X. Glycosylation: Mechanisms, biological functions and clinical implications. Signal Transduct. Target. Ther. 2024, 9, 194. [Google Scholar] [CrossRef]
  16. Stanley, P. Genetics of glycosylation in mammalian development and disease. Nat. Rev. Genet. 2024, 25, 715–729. [Google Scholar] [CrossRef]
  17. Wu, T.; Sun, Y.; Wang, D.; Isaji, T.; Fukuda, T.; Suzuki, C.; Hanamatsu, H.; Nishikaze, T.; Tsumoto, H.; Miura, Y.; et al. The acetylglucosaminyltransferase GnT-III regulates erythroid differentiation through ERK/MAPK signaling. J. Biol. Chem. 2024, 300, 108010. [Google Scholar] [CrossRef]
  18. Krishnamoorthy, V.; Daly, J.; Kim, J.; Piatnitca, L.; Yuen, K.A.; Kumar, B.; Taherzadeh Ghahfarrokhi, M.; Bui, T.Q.T.; Azadi, P.; Vu, L.P.; et al. The glycosyltransferase ST3GAL4 drives immune evasion in acute myeloid leukemia by synthesizing ligands for the glyco-immune checkpoint receptor Siglec-9. Leukemia 2025, 39, 346–359. [Google Scholar] [CrossRef]
  19. Cragg, M.S.; Chan, H.T.; Fox, M.D.; Tutt, A.; Smith, A.; Oscier, D.G.; Hamblin, T.J.; Glennie, M.J. The alternative transcript of CD79b is overexpressed in B-CLL and inhibits signaling for apoptosis. Blood 2002, 100, 3068–3076. [Google Scholar] [CrossRef][Green Version]
  20. Chachoua, I.; Pecquet, C.; El-Khoury, M.; Nivarthi, H.; Albu, R.I.; Marty, C.; Gryshkova, V.; Defour, J.P.; Vertenoeil, G.; Ngo, A.; et al. Thrombopoietin receptor activation by myeloproliferative neoplasm associated calreticulin mutants. Blood 2016, 127, 1325–1335. [Google Scholar] [CrossRef]
  21. Marjon, K.D.; Termini, C.M.; Karlen, K.L.; Saito-Reis, C.; Soria, C.E.; Lidke, K.A.; Gillette, J.M. Tetraspanin CD82 regulates bone marrow homing of acute myeloid leukemia by modulating the molecular organization of N-cadherin. Oncogene 2016, 35, 4132–4140. [Google Scholar] [CrossRef]
  22. Wang, H.; Zhang, W.; Zhao, J.; Zhang, L.; Liu, M.; Yan, G.; Yao, J.; Yu, H.; Yang, P. N-Glycosylation pattern of recombinant human CD82 (KAI1), a tumor-associated membrane protein. J. Proteom. 2012, 75, 1375–1385. [Google Scholar] [CrossRef]
  23. Kohlmann, A.; Kipps, T.J.; Rassenti, L.Z.; Downing, J.R.; Shurtleff, S.A.; Mills, K.I.; Gilkes, A.F.; Hofmann, W.K.; Basso, G.; Dell’orto, M.C.; et al. An international standardization programme towards the application of gene expression profiling in routine leukaemia diagnostics: The Microarray Innovations in LEukemia study prephase. Br. J. Haematol. 2008, 142, 802–807. [Google Scholar] [CrossRef]
  24. Haferlach, T.; Kohlmann, A.; Wieczorek, L.; Basso, G.; Kronnie, G.T.; Bene, M.C.; De Vos, J.; Hernandez, J.M.; Hofmann, W.K.; Mills, K.I.; et al. Clinical utility of microarray-based gene expression profiling in the diagnosis and subclassification of leukemia: Report from the International Microarray Innovations in Leukemia Study Group. J. Clin. Oncol. 2010, 28, 2529–2537. [Google Scholar] [CrossRef]
  25. Wang, Y.; Bin, T.; Tang, J.; Xu, X.J.; Lin, C.; Lu, B.; Sun, T.T. Construction of an acute myeloid leukemia prognostic model based on m6A-related efferocytosis-related genes. Front. Immunol. 2023, 14, 1268090. [Google Scholar] [CrossRef]
  26. Hao, Z.; Zhao, B.; Zhu, X.; Zhang, W.; Wang, B. Upregulated BAP31 Links to Poor Prognosis and Tumor Immune Microenvironment in Breast Cancer. Int. J. Mol. Sci. 2025, 26, 5975. [Google Scholar] [CrossRef]
  27. Suzuki, N.; Yoshida, T.; Takeuchi, H.; Sakuma, R.; Sukegawa, S.; Yamaoka, S. Robust Enhancement of Lentivirus Production by Promoter Activation. Sci. Rep. 2018, 8, 15036. [Google Scholar] [CrossRef]
  28. Wang, Y.; Hu, F.; Ke, J. Prognosis of the transformation of myelodysplastic syndromes to acute myeloid leukemia: A retrospective study. Medicine 2025, 104, e43783. [Google Scholar] [CrossRef]
  29. Hirako, N.; Nakano, H.; Takahashi, S. A PU.1 suppressive target gene, metallothionein 1G, inhibits retinoic acid-induced NB4 cell differentiation. PLoS ONE 2014, 9, e103282. [Google Scholar] [CrossRef]
  30. Osada, N.; Nagae, M.; Nakano, M.; Hirata, T.; Kizuka, Y. Examination of differential glycoprotein preferences of N-acetylglucosaminyltransferase-IV isozymes a and b. J. Biol. Chem. 2022, 298, 102400. [Google Scholar] [CrossRef]
  31. Wei, S.; Zhao, M.; Wang, X.; Li, Y.; Wang, K. PU.1 controls the expression of long noncoding RNA HOTAIRM1 during granulocytic differentiation. J. Hematol. Oncol. 2016, 9, 44. [Google Scholar] [CrossRef]
  32. Weng, X.Q.; Sheng, Y.; Ge, D.Z.; Wu, J.; Shi, L.; Cai, X. RAF-1/MEK/ERK pathway regulates ATRA-induced differentiation in acute promyelocytic leukemia cells through C/EBPbeta, C/EBPepsilon and PU.1. Leuk. Res. 2016, 45, 68–74. [Google Scholar] [CrossRef]
  33. Gu, J.; Isaji, T.; Xu, Q.; Kariya, Y.; Gu, W.; Fukuda, T.; Du, Y. Potential roles of N-glycosylation in cell adhesion. Glycoconj. J. 2012, 29, 599–607. [Google Scholar] [CrossRef]
  34. Azcutia, V.; Kelm, M.; Fink, D.; Cummings, R.D.; Nusrat, A.; Parkos, C.A.; Brazil, J.C. Sialylation regulates neutrophil transepithelial migration, CD11b/CD18 activation, and intestinal mucosal inflammatory function. JCI Insight 2023, 8, e167151. [Google Scholar] [CrossRef]
  35. Blidner, A.G.; Bach, C.A.; Garcia, P.A.; Merlo, J.P.; Cagnoni, A.J.; Bannoud, N.; Manselle Cocco, M.N.; Perez Saez, J.M.; Pinto, N.A.; Torres, N.I.; et al. Glycosylation-driven programs coordinate immunoregulatory and pro-angiogenic functions of myeloid-derived suppressor cells. Immunity 2025, 58, 1553–1571.e8. [Google Scholar] [CrossRef]
  36. Suzuki, T.; Seko, A.; Kitajima, K.; Inoue, Y.; Inoue, S. Identification of peptide:N-glycanase activity in mammalian-derived cultured cells. Biochem. Biophys. Res. Commun. 1993, 194, 1124–1130. [Google Scholar] [CrossRef]
  37. Kitajima, K.; Suzuki, T.; Kouchi, Z.; Inoue, S.; Inoue, Y. Identification and distribution of peptide:N-glycanase (PNGase) in mouse organs. Arch. Biochem. Biophys. 1995, 319, 393–401. [Google Scholar] [CrossRef]
  38. Lee, W.B.; Kang, J.S.; Yan, J.J.; Lee, M.S.; Jeon, B.Y.; Cho, S.N.; Kim, Y.J. Neutrophils Promote Mycobacterial Trehalose Dimycolate-Induced Lung Inflammation via the Mincle Pathway. PLoS Pathog. 2012, 8, e1002614. [Google Scholar] [CrossRef]
  39. Shen, D.; Podolnikova, N.P.; Yakubenko, V.P.; Ardell, C.L.; Balabiyev, A.; Ugarova, T.P.; Wang, X. Pleiotrophin, a multifunctional cytokine and growth factor, induces leukocyte responses through the integrin Mac-1. J. Biol. Chem. 2017, 292, 18848–18861. [Google Scholar] [CrossRef]
  40. Kizuka, Y. Regulation of intracellular activity of N-glycan branching enzymes in mammals. J. Biol. Chem. 2024, 300, 107471. [Google Scholar] [CrossRef]
  41. Granovsky, M.; Fata, J.; Pawling, J.; Muller, W.J.; Khokha, R.; Dennis, J.W. Suppression of tumor growth and metastasis in Mgat5-deficient mice. Nat. Med. 2000, 6, 306–312. [Google Scholar] [CrossRef]
  42. Yu, R.; Longo, J.; van Leeuwen, J.E.; Zhang, C.; Branchard, E.; Elbaz, M.; Cescon, D.W.; Drake, R.R.; Dennis, J.W.; Penn, L.Z. Mevalonate Pathway Inhibition Slows Breast Cancer Metastasis via Reduced N-glycosylation Abundance and Branching. Cancer Res. 2021, 81, 2625–2635. [Google Scholar] [CrossRef]
  43. Ohtsubo, K.; Takamatsu, S.; Minowa, M.T.; Yoshida, A.; Takeuchi, M.; Marth, J.D. Dietary and genetic control of glucose transporter 2 glycosylation promotes insulin secretion in suppressing diabetes. Cell 2005, 123, 1307–1321. [Google Scholar] [CrossRef]
  44. Takahashi, M.; Kizuka, Y.; Ohtsubo, K.; Gu, J.; Taniguchi, N. Disease-associated glycans on cell surface proteins. Mol. Asp. Med. 2016, 51, 56–70. [Google Scholar] [CrossRef]
  45. Hanashima, S.; Suga, A.; Yamaguchi, Y. Bisecting GlcNAc restricts conformations of branches in model N-glycans with GlcNAc termini. Carbohydr. Res. 2018, 456, 53–60. [Google Scholar] [CrossRef] [PubMed]
  46. Nakano, M.; Mishra, S.K.; Tokoro, Y.; Sato, K.; Nakajima, K.; Yamaguchi, Y.; Taniguchi, N.; Kizuka, Y. Bisecting GlcNAc Is a General Suppressor of Terminal Modification of N-glycan. Mol. Cell. Proteom. 2019, 18, 2044–2057. [Google Scholar] [CrossRef]
  47. Boscher, C.; Dennis, J.W.; Nabi, I.R. Glycosylation, galectins and cellular signaling. Curr. Opin. Cell Biol. 2011, 23, 383–392. [Google Scholar] [CrossRef]
  48. Haga, Y.; Ishii, K.; Suzuki, T. N-glycosylation is critical for the stability and intracellular trafficking of glucose transporter GLUT4. J. Biol. Chem. 2011, 286, 31320–31327. [Google Scholar] [CrossRef]
  49. Lau, K.S.; Partridge, E.A.; Grigorian, A.; Silvescu, C.I.; Reinhold, V.N.; Demetriou, M.; Dennis, J.W. Complex N-glycan number and degree of branching cooperate to regulate cell proliferation and differentiation. Cell 2007, 129, 123–134. [Google Scholar] [CrossRef] [PubMed]
  50. Morigo, A.; Elin Teppa, R.; Nagae, M.; Yagi, H.; Kizuka, Y.; Harduin-Lepers, A. Evolutionary analyses of the animal glycosyltransferase family 54 reveals two beta1,4-N-acetylglucosaminyltransferase families. iScience 2025, 28, 113788. [Google Scholar] [CrossRef] [PubMed]
  51. Yoshida, A.; Minowa, M.T.; Takamatsu, S.; Hara, T.; Ikenaga, H.; Takeuchi, M. A novel second isoenzyme of the human UDP-N-acetylglucosamine:alpha1,3-D-mannoside beta1,4-N-acetylglucosaminyltransferase family: cDNA cloning, expression, and chromosomal assignment. Glycoconj. J. 1998, 15, 1115–1123. [Google Scholar] [CrossRef]
  52. Yoshida, A.; Minowa, M.T.; Takamatsu, S.; Hara, T.; Oguri, S.; Ikenaga, H.; Takeuchi, M. Tissue specific expression and chromosomal mapping of a human UDP-N-acetylglucosamine: Alpha1,3-d-mannoside beta1, 4-N-acetylglucosaminyltransferase. Glycobiology 1999, 9, 303–310. [Google Scholar] [CrossRef]
  53. Ide, Y.; Miyoshi, E.; Nakagawa, T.; Gu, J.; Tanemura, M.; Nishida, T.; Ito, T.; Yamamoto, H.; Kozutsumi, Y.; Taniguchi, N. Aberrant expression of N-acetylglucosaminyltransferase-IVa and IVb (GnT-IVa and b) in pancreatic cancer. Biochem. Biophys. Res. Commun. 2006, 341, 478–482. [Google Scholar] [CrossRef]
  54. Niimi, K.; Yamamoto, E.; Fujiwara, S.; Shinjo, K.; Kotani, T.; Umezu, T.; Kajiyama, H.; Shibata, K.; Ino, K.; Kikkawa, F. High expression of N-acetylglucosaminyltransferase IVa promotes invasion of choriocarcinoma. Br. J. Cancer 2012, 107, 1969–1977. [Google Scholar] [CrossRef]
  55. Nishino, K.; Yamamoto, E.; Niimi, K.; Sekiya, Y.; Yamashita, Y.; Kikkawa, F. N-acetylglucosaminyltransferase IVa promotes invasion of choriocarcinoma. Oncol. Rep. 2017, 38, 440–448. [Google Scholar] [CrossRef][Green Version]
  56. Zhu, Z.; Sun, J.; Xu, W.; Zeng, Q.; Feng, H.; Zang, L.; He, Y.; He, X.; Sheng, N.; Ren, X.; et al. MGAT4A/Galectin9-Driven N-Glycosylation Aberration as a Promoting Mechanism for Poor Prognosis of Endometrial Cancer with TP53 Mutation. Adv. Sci. 2024, 11, e2409764. [Google Scholar] [CrossRef]
  57. Isaji, T.; Kariya, Y.; Xu, Q.; Fukuda, T.; Taniguchi, N.; Gu, J. Functional roles of the bisecting GlcNAc in integrin-mediated cell adhesion. Methods Enzym. 2010, 480, 445–459. [Google Scholar]
  58. Lloberas, J.; Soler, C.; Celada, A. The key role of PU.1/SPI-1 in B cells, myeloid cells and macrophages. Immunol. Today 1999, 20, 184–189. [Google Scholar] [CrossRef]
  59. Federzoni, E.A.; Valk, P.J.; Torbett, B.E.; Haferlach, T.; Lowenberg, B.; Fey, M.F.; Tschan, M.P. PU.1 is linking the glycolytic enzyme HK3 in neutrophil differentiation and survival of APL cells. Blood 2012, 119, 4963–4970. [Google Scholar] [CrossRef]
  60. Saeed, S.; Logie, C.; Stunnenberg, H.G.; Martens, J.H. Genome-wide functions of PML-RARalpha in acute promyelocytic leukaemia. Br. J. Cancer 2011, 104, 554–558. [Google Scholar] [CrossRef]
  61. Rosenbauer, F.; Tenen, D.G. Transcription factors in myeloid development: Balancing differentiation with transformation. Nat. Rev. Immunol. 2007, 7, 105–117. [Google Scholar] [CrossRef]
  62. Kang, R.; Saito, H.; Ihara, Y.; Miyoshi, E.; Koyama, N.; Sheng, Y.; Taniguchi, N. Transcriptional regulation of the N-acetylglucosaminyltransferase V gene in human bile duct carcinoma cells (HuCC-T1) is mediated by Ets-1. J. Biol. Chem. 1996, 271, 26706–26712. [Google Scholar] [CrossRef]
  63. Takamatsu, S.; Antonopoulos, A.; Ohtsubo, K.; Ditto, D.; Chiba, Y.; Le, D.T.; Morris, H.R.; Haslam, S.M.; Dell, A.; Marth, J.D.; et al. Physiological and glycomic characterization of N-acetylglucosaminyltransferase-IVa and -IVb double deficient mice. Glycobiology 2010, 20, 485–497. [Google Scholar] [CrossRef]
  64. Zheng, R.; Studzinski, G.P. Nuclear ERK5 inhibits progression of leukemic monocytes to macrophages by regulating the transcription factor PU.1 and heat shock protein HSP70. Leuk. Lymphoma 2017, 58, 1468–1480. [Google Scholar] [CrossRef]
  65. Coxon, A.; Rieu, P.; Barkalow, F.J.; Askari, S.; Sharpe, A.H.; von Andrian, U.H.; Arnaout, M.A.; Mayadas, T.N. A novel role for the beta 2 integrin CD11b/CD18 in neutrophil apoptosis: A homeostatic mechanism in inflammation. Immunity 1996, 5, 653–666. [Google Scholar] [CrossRef]
  66. Rosetti, F.; Mayadas, T.N. The many faces of Mac-1 in autoimmune disease. Immunol. Rev. 2016, 269, 175–193. [Google Scholar] [CrossRef]
  67. Chen, J.; Zhong, M.C.; Guo, H.; Davidson, D.; Mishel, S.; Lu, Y.; Rhee, I.; Perez-Quintero, L.A.; Zhang, S.; Cruz-Munoz, M.E.; et al. SLAMF7 is critical for phagocytosis of haematopoietic tumour cells via Mac-1 integrin. Nature 2017, 544, 493–497. [Google Scholar] [CrossRef]
Figure 1. ATRA-induced differentiation of NB4 cells. (A) Western blot analysis of CD11b expression at the indicated time points. GAPDH served as a loading control. Band intensities were quantified and are presented as mean ± SD. (one-way ANOVA with Tukey’s test). (B) qPCR analysis of CD11b mRNA. Values were normalized to untreated wild-type (WT) cells (set as 1.0) and are shown as mean ± SD (n = 3). (one-way ANOVA). (C) Flow cytometric analysis of cell surface CD11b. The dotted line was set based on the fluorescence intensity of the negative control samples. Cells to the right of the vertical line were defined as positive. Quantified data are shown as mean ± SD (n = 3). (D) Cells treated with or without ATRA were stained with Wright–Giemsa stain. Scale bar: 10 μm. (E,F) qPCR analysis of CD11c (E) and MPO (F) mRNA. Normalization and data presentation as in (B). (unpaired Student’s t test). ** p < 0.01, *** p < 0.001, ns, not significant.
Biomolecules 16 00756 g001
Figure 2. Comparison of N-glycan profiles and glycosyltransferase gene expression levels in WT and ATRA-treated NB4 cells. Cells were incubated with or without ATRA at the indicated times. Equal cell lysates were blotted with different lectins: (A) E4-PHA (bisected N-glycans), (B) DSA (β1,4-GlcNAc-branched), (C) L4-PHA (β1,6-GlcNAc-branched), (D) LCA (α1,6-fucose). GAPDH served as a loading control. (E) qPCR analysis of N-acetylglucosaminyltransferase genes involved in GlcNAc-branched N-glycan synthesis. GAPDH was used as an internal control, and values were normalized to the DMSO group (set as 1.0). Data are presented as mean ± SD. * p < 0.05, ** p < 0.01, *** p < 0.001; ns, not significant (one-way ANOVA with Tukey’s post hoc test).
Biomolecules 16 00756 g002
Figure 3. Validating expression levels of N-glycan-related genes in APL patients and their association with prognosis in AML cohorts. (A) Comparison of the expression levels of N-glycans-related genes between APL patients and healthy controls in the GSE13159 dataset. p-values were calculated using an unpaired Student’s t-test. (B) Comparison of survival rates between high and low expression of N-glycans-related genes in the GSE71014 dataset using Kaplan–Meier analysis.
Biomolecules 16 00756 g003
Figure 4. MGAT4A KO impaired ATRA-induced differentiation in NB4 cells. (A) Lectin blot analysis of WT and two independent MGAT4A KO clones, with or without ATRA treatment, using DSA. GAPDH served as a loading control. (B) Morphological assessment of WT and MGAT4A KO cells by Wright–Giemsa staining. Scale bar: 10 μm). One hundred cells in each sample were evaluated. Nucleus and cytoplasm areas were measured using ImageJ software (version 1.50i; National Institutes of Health, Bethesda, MD, USA), and the N/C ratio is shown as a violin plot. *** p < 0.001. (C) Flow cytometric analysis of cell surface CD11b expression. The dotted line was set based on the fluorescence intensity of the negative control samples. Cells to the right of the vertical line were defined as positive. Quantified data are shown as mean ± SD (n = 3). ** p < 0.01, *** p < 0.001. (D) qPCR analysis of CD11b and CD11c mRNA levels in WT and MGAT4A KO cells treated with or without ATRA. GAPDH was used as an internal control, and values were normalized to those in untreated WT cells (set to 1.0). Data are shown as mean ± SD from three independent experiments. *** p < 0.001. (E) Western blot analysis of CD11b expression in the indicated cell lines. GAPDH was used as a loading control. Band intensities were quantified and are presented as mean ± SD from three independent experiments. ** p < 0.01, *** p < 0.001.
Biomolecules 16 00756 g004
Figure 5. MGAT4B KO does not significantly impair ATRA-induced differentiation in NB4 cells. (A) Lectin blot analysis of WT and two independent MGAT4B KO clones, with or without ATRA treatment, using DSA. GAPDH served as a loading control. (B) Western blot analysis of CD11b expression in the indicated cell lines. GAPDH was used as a loading control. Band intensities were quantified and are presented as mean ± SD from three independent experiments. * p < 0.05; ns, not significant. (C) qPCR analysis of CD11b and CD11c mRNA levels in WT and MGAT4B KO cells treated with or without ATRA. GAPDH was used as an internal control, and values were normalized to those in untreated WT cells (set to 1.0). Data are shown as mean ± SD from three independent experiments. *** p < 0.001; ns, not significant.
Biomolecules 16 00756 g005
Figure 6. MGAT4A KO suppressed ATRA-induced differentiation partially through the MEK/ERK-mediated signaling pathway. (A) WT and MGAT4A KO NB4 cells were treated with or without ATRA, and the same amounts of cell lysates were Western blotted with anti-phosphorylated ERK1/2, total ERK1/2, and PU.1 antibodies. GAPDH served as a loading control. (B) Time-course analysis of ERK1/2 phosphorylation in WT NB4 cells treated with or without 1 μM U0126 for the indicated durations. (C) qPCR analysis of CD11b and CD11c mRNA levels in WT cells in the presence of ATRA treated with or without U0126. Values were normalized to GAPDH and are presented as mean ± SD (n = 3). *** p < 0.001; ns, not significant (one-way ANOVA with Tukey’s test). (D) Western blot analysis of CD11b and PU.1 expression. GAPDH was used as a loading control. Quantified data are shown as mean ± SD (n = 3). * p < 0.05; ** p < 0.01; *** p < 0.001; ns, not significant. (E) Flow cytometric analysis of cell surface CD11b expression. The dotted line was set based on the fluorescence intensity of the negative control samples. Cells to the right of the vertical line were defined as positive. Quantified data are shown as mean ± SD (n = 3). ** p < 0.01, *** p < 0.001; ns, not significant.
Biomolecules 16 00756 g006
Figure 7. MGAT4A modified CD11b and increased its stability. Equal amounts of cell lysates were treated with or without PNGase F, and then either lectin-blotted with DSA (A) or Western-blotted with an anti-CD11b antibody (B). GAPDH served as a loading control. (C) Correlation between MGAT4A and CD11b expression and comparison between healthy controls and APL patients in the GSE13159 dataset. (D) A pull-down assay using DSA-agarose. Cell lysates from NB4 cells treated with or without ATRA were incubated with DSA-agarose, and the precipitates were immunoblotted with an anti-CD11b antibody. Input lysates were probed for GAPDH, which served as a loading control. (E) Protein stability assay. WT and MGAT4A KO cells were treated with 50 μM cycloheximide (CHX) for the indicated times. CD11b levels were assessed by Western blotting, with GAPDH as a loading control. Band intensities were quantified and normalized to their value at time 0, which was set to 1.0. Data are presented as mean ± SD from three independent experiments. ** p < 0.01, *** p < 0.001.
Biomolecules 16 00756 g007
Figure 8. Roles of GlcNAc-branched N-glycans and others. Alterations in N-glycosylation patterns are common in tumors, and changes in glycan structures can influence various cellular behaviors. These include altered cell adhesion, migration, invasion, and differentiation, all of which affect tumor progression. In this study, we found that GnT-IVa expression promotes APL cell differentiation.
Biomolecules 16 00756 g008
Table 1. Primer sequences for the target region.
GeneForward PrimerReverse Primer
MGAT4ATGGCTTAGGATTTCTATGCTATGTTTTCAGCTTCGATAAA
MGAT4BGTCTTCCATCACCTGCCACAAGCAACTGAACTTCCGACAG
Table 2. Primer sequences for RT-PCR.
GeneForward PrimerReverse Primer
CD11bCTGCTCCATCGCTGTCTGTCTCCGTCTGGGACCTCA
CD11cCAGGACCAGCAAGACCACGTTCAGCTCCACAGGCAC
MPOCTGGACCTGCCTGCTCTGATGGGCGTGCCATACTGCT
MGAT3GCCGCGTCATCAACGCCATCAACAGGTAGTCGTCGGCGATCCA
MGAT4AGGCTATCACACCGATAGCTGGAGTCCACCATTCCTTCTGCAACACC
MGAT4BACAACCCTCAGTCAGACAAGGAGGGGTACCCTCAGAAGCCCGCAGCTT
MGAT5GACCTGCAGTTCCTTCTTCGCCATGGCAGAAGTCCTGTTT
FUT8GACAGAACTGGTTCAGCGGAGAGCAGTAGACCACATGATGGAGC
GAPDHCGGAGTCAACGGATTTGGTCGTAAGCCTTCTCCATGGTGGTGAAGAC
Disclaimer/Publisher’s Note: The statements, opinions and data contained in all publications are solely those of the individual author(s) and contributor(s) and not of MDPI and/or the editor(s). MDPI and/or the editor(s) disclaim responsibility for any injury to people or property resulting from any ideas, methods, instructions or products referred to in the content.