Article

Integrated Multi-Omics of the Longissimus Dorsal Muscle Transcriptomics and Metabolomics Reveals Intramuscular Fat Accumulation Mechanism with Diet Energy Differences in Yaks

1
Lanzhou Institute of Husbandry and Pharmaceutical Sciences, Chinese Academy of Agricultural Sciences, Lanzhou 730050, China
2
College of Agriculture and Animal Husbandry, Qinghai University, Xining 810016, China
3
Institute of Western Agriculture, Chinese Academy of Agricultural Sciences, Changji 831100, China
4
Agricultural Genomics Institute at Shenzhen, Chinese Academy of Agricultural Sciences, Shenzhen 518000, China
*
Authors to whom correspondence should be addressed.
Biomolecules 2025, 15(7), 1025; https://doi.org/10.3390/biom15071025
Submission received: 4 June 2025 / Revised: 10 July 2025 / Accepted: 11 July 2025 / Published: 16 July 2025
(This article belongs to the Section Molecular Genetics)

Abstract

IMF (intramuscular fat, IMF), as a key index for evaluating meat quality traits (shear force and cooking loss, etc.), and its deposition process are jointly regulated by nutritional and genetic factors. In this study, we analyzed the molecular regulation mechanism of IMF deposition in the LD (longissimus dorsal muscle, LD) by dietary energy level in Pamir yaks. Meat quality assessment showed that the meat quality of the High-energy diet group (1.53 MJ/Kg, G) and the Medium-energy diet group (1.38 MJ/Kg, Z) were significantly improved compared with that of the Low-energy diet group (0.75 MJ/Kg, C), in which IMF content in the LD of yaks in G group was significantly higher (p < 0.05) compared with Z and C groups. Further analysis by combined transcriptomics and lipid metabolomics revealed that the differences in IMF deposition mainly originated from the metabolism of lipids, such as TG (triglycerides, TG), PS (phosphatidylserine, PS), and LPC (lysophosphatidylcholine, LPC), and were influenced by SFRP4, FABP4, GADD45A, PDGFRA, RBP4, and DGAT2 genes, further confirming the importance of lipid–gene interactions in IMF deposition. This study reveals the energy-dependent epigenetic regulatory mechanism of IMF deposition in plateau ruminants, which provides molecular targets for optimizing yak nutritional strategies and quality meat production, while having important theoretical and practical value for the sustainable development of livestock husbandry on the Tibetan Plateau.

1. Introduction

Yaks live on plateaus above 3000 m above sea level, mainly distributed in the Qinghai Tibet Plateau of China [1]. China has a total of 16,556,000 yaks, accounting for more than 94% of the world’s yak resources [2]. Pamir yaks grow on the Pamir Plateau and are highly adaptable to high altitude, cold, and hypoxic environments, and they are characterized by good slaughtering performance and excellent lactation performance [3,4]. Yak meat is rich in protein and minerals with high nutritional value, and its consumption has been increasing in the past few years [5,6]. With the advancement of living standards, consumer demand for high quality meat has increased [7]. Therefore, enhancing the quality of yak meat has emerged as a prominent research focus.
IMF (intramuscular fat, IMF) deposition has been shown to exert a critical influence on improving the flavor and quality of meat. IMF is mainly distributed in the interstitial space of muscle fibers, and its composition is dominated by TG (triglycerides, TG) and PS (phosphatidylserine, PS) [8,9]. Research has demonstrated that IMF significantly influences key meat quality attributes, including flavor, juiciness, color, and tenderness. It is an important indicator of consumer concern [10]. As muscle fibers, adipose tissue, and connective tissue are cross-distributed in muscle, IMF deposition can relax connective tissue and reduce the physical hardness of muscle fiber bundles, thus reducing muscle shear and enhancing meat tenderness [11,12], while IMF-enriched phospholipids with long-chain polyunsaturated fatty acids can enhance meat flavor [13,14]. Therefore, IMF serves as a key factor influencing overall meat quality (edible quality and nutritional quality) parameters.
Dietary energy is a key nutritional limiting factor for animal growth and development [15], and its level has a significant effect on intramuscular fat deposition—the more energy livestock and poultry consume, the higher the fat deposition in their muscles [16]. It was found that increasing dietary energy levels significantly increased intramuscular fat content in yak beef and promoted intramuscular fat deposition by up-regulating intramuscular lipogenic gene expression and down-regulating lipolytic gene expression [17]. Feeding high-energy diets increased the intramuscular fat content of Holstein–Friesian bull beef and can be used as a way to produce high quality IMF beef [18]. Comparative analysis revealed significantly greater IMF content in beef from the High-energy diet cohort relative to the Low-energy group [19]. In summary, increasing feed energy levels significantly elevated muscle IMF content, resulting in improved muscle food quality.
Transcriptomics is a technique used to study all RNA transcripts of an organism [20], focusing on providing information such as the expression, structure, and function of genes to reveal the molecular mechanisms involved in specific biological processes [21], thereby enabling a deeper exploration of the biological functions of related genes [22]. Metabolomics is a technique for systematically identifying and quantifying all metabolites in a specific organism or organism sample [23], while lipid metabolomics is used to analyze the composition and expression changes of lipids in organism samples [24], while playing a role in exploring the lipid family and the functions of lipid molecules in biological processes [25]. At present, both transcriptomics and lipid metabolomics have been applied in domestic animals such as cattle [26], sheep [27], and pigs [28] and have achieved good results; Chen et al. [29] conducted lipidomics analysis on chicken preadipocytes treated with the TMEM182 gene, revealing the metabolic effect of TMEM182 on lipids in chicken preadipocytes. Zhao et al. [30] analyzed the longissimus dorsal muscle of pigs using transcriptomics and screened out potential candidate genes and pathways affecting the IMF. Zhang et al. [31] analyzed the longissimus dorsal muscle of Luchuan pigs and Duroc pigs using transcriptomics and lipidomics, emphasizing that the phenotype of intramuscular fat in Luchuan pigs being higher than that in Duroc pigs might be caused by key differentially expressed genes in the glyceride metabolism signaling pathway. These research results are of great significance for exploring the genetic functions of this species and improving its phenotypic traits.
In this study, 30 yaks from Ta County, Xinjiang were selected for group feeding, and meat quality trait indexes of the LD (longissimus dorsal muscle, LD) were determined by feeding different energy diets. In addition, based on transcriptome and lipid metabolomics analysis, DEGs (differentially expressed genes, DEGs) and SDLs (significant differential lipids, SDLs) were screened in the dorsal muscles of yaks in the groups Low-energy diet group (0.75 MJ/Kg, C), Medium-energy diet group (1.38 MJ/Kg, Z), and High-energy diet group (1.53 MJ/Kg, G) in order to elucidate the molecular mechanism of dietary energy-regulated deposition of IMF in yaks, and to provide theoretical support for the enhancement of meat quality.

2. Materials and Methods

2.1. Experimental Design and Sample Collection

In this experiment, 30 male yaks aged 3–4 years old in Ta County, Xinjiang were selected and randomly divided into three treatment groups—Low-energy diet group (0.75 MJ/Kg, C), Medium-energy diet group (1.38 MJ/Kg, Z), and High-energy diet group (1.53 MJ/Kg, G)—with 10 yaks in each group, and all the total mixed rations (TMRs) being formulated in strict accordance with the “Standard of Beef Cattle Breeding” (NY/T 815-2004) (see Table 1). The pre-test period was 15 days (concentrate was gradually increased) and the official period was 5 months. Three experimental yaks (a total of nine) were randomly selected from each treatment group and slaughtered after fasting for 24 h. The pH and color difference of the longissimus dorsal muscle of the yaks were measured for 45 min and 24 h. The LD was immediately divided into 1–3 cm2 tissue blocks and frozen in liquid nitrogen for storage, while samples of 2–3 kg were collected for meat analysis in the laboratory.

2.2. Longissimus Dorsal Muscle Quality Measurement and Hematoxylin–Eosin Staining (HE Staining)

The meat quality of the longissimus muscle tissue of the back of the yaks brought back was determined. The pH value was measured by inserting a portable pH meter 2 cm into the muscle and continuously for 3 to 5 times. Color determination was carried out using a TCP 2 fully automatic colorimeter. The color differences of meat samples at 45 min and 24 h were measured respectively. The results were expressed as L* (brightness), a* (redness), and b* (yellowness). To determine the cooking loss, the meat needs to be cooked in an 80 °C water bath to raise the internal temperature of yak meat to 75 °C for 45 min. Before cooking, the weight of the meat sample should be W1, and after cooking, the weight of the meat sample should be W2. The formula for calculating the cooking loss is as follows: cooking loss rate (%) = (W1 − W2)/W1 × 100%. The determination of shear force was carried out using the C-LM3B digital display muscle tenderness meter. The longissimus dorsi muscle was fixed with 4% paraformaldehyde and then stained with HE.

2.3. RNA-Seq Library Construction and Sequencing

A total of 9 tissue samples of the longissimus dorsal muscle (3 tissue samples in each group) were collected in this study and sent to Shanghai Ouyi Biomedical Technology Co., Ltd. (Shanghai, China). for transcriptome sequencing. The construction steps of the RNA-seq library are as follows:
After extracting the total RNA of the sample and digesting the DNA with DNase, the mRNA was enriched with magnetic beads of oligo (dT). After fragment synthesis, double-stranded cDNA was synthesized with six-base random primers. The library construction was completed after end repair, addition of A tail, and connection of sequencing adapters. After passing the quality inspection with Agilent 2100 Bioanalyzer, sequencing was performed using a sequencer to remove the adapter and low-quality reads. This was carried out as follows: Obtain clean readings, count the original sequencing volume and effective sequencing volume, and calculate the Q30 and GC content of clean reads. The clean reads were sequentially aligned with the specified reference genome using hisat2 2.1.0. The number of reads aligned to the protein-coding gene in each sample was obtained using htseq-count 0.11.2 software, and counts were obtained through alignment. The calculation of gene expression level was carried out using the FPKM method. Principal component analysis (PCA analysis) was conducted using the quantitative results of the genes. After obtaining the differentially expressed genes, GO functional significance and KEGG pathway significance analyses were conducted on them. The DESeq2 1.22.2 software was used to standardize the counts of each sample gene to calculate the multiple of difference, and NB (negative binomial distribution test) was adopted for the significance of difference test. Finally, the coding genes of differential proteins were screened based on the multiple of difference and the results of the significance of difference test. The conditions for screening differences are that the q-value is <0.05 and the multiple of differences is >2.

2.4. Lipid Extraction and Data Preprocessing

The process was conducted as follows: Take 30 mg of tissue, add 400 μL of pre-cooled methanol-aqueous solution, grind it, then add 400 μL of chloroform, vortex for 30 s, ultrasonically extract for 10 min, let it stand for 20 min, and then centrifuge for 10 min. Take 300 μL of the lower chloroform for volatilization and drying. Resolubilize the residue with 200 μL of isopropanol–methanol, vortex for 30 s, ultrasonicate in an ice bath for 3 min, stand at −20 °C for 2 h, centrifuge, and take 150 μL of the supernatant for LC–MS analysis. Metabolomics analysis was performed using a liquid chromatography–mass spectrometry system composed of ACQUITY UPLC I-Class plus ultra-performance liquid chromatography tandem high-resolution mass spectrometers. Chromatographic conditions were as follows: The chromatographic separation was performed at 55 °C using a binary solvent system—mobile phase A consisting of acetonitrile/water (60:40, v/v) with 10 mM ammonium acetate, and mobile phase B comprising isopropanol/acetonitrile (90:10, v/v) with 10 mM ammonium acetate. The MS data were collected using the Q Exactive LC-MS/MS system. The parameters of the MS system were as follows: Positive ion mode-Spray Voltage (V)—3500; Capillary Temperature—300 °C; Aux gas heater temperature—350 °C; Sheath Gas Flow Rate—45 arb; Aux gas flow rate—10 arb; S-lens RF level—50%; Mass range (m/z)—150–1500. Negative ion mode-Spray Voltage (V)—−3500; Capillary Temperature—300 °C; Aux gas heater temperature—350 °C; Sheath Gas Flow Rate—45 arb; Aux gas flow rate—10 arb; S-lens RF level—50%; Mass range (m/z)—150–1500. The data were preprocessed. Using the Lipid Search software V5.1, the raw format raw data exported by Q Exactive LC-MS/MS was read to obtain the precise mass numbers of MSn and parent ions. Based on the parent ions and multi-stage mass spectrometry data in each independent sample, the lipid molecular structure and the addition patterns of positive and negative ions therein were identified. The search results of each independent sample were aligned within a certain retention time range, and the results combined into a single report to organize the original data matrix. The missing value matrix is the data before the 0-value replacement and the log2 conversion, and the data matrix is the data after the 0-value replacement and the log2 conversion; this is used for subsequent analysis. After the data are normalized, then for the extracted data, where the ion peaks of each group of missing values (0 values) are greater than 50%, are deleted. The remaining missing values (0 values) are replaced with half of the minimum value, and the data processed with 0 values is subjected to log2 processing. Finally, the positive and negative ion data are combined into a data matrix table. This matrix contains all the information that can be used for analysis extracted from the original data, and subsequent analyses are based on this. The screening conditions of the data are p-value < 0.05, FC ≥ 1.2, or FC ≤ 1/1.2.

2.5. Real-Time Fluorescence Quantitative PCR (RT-qPCR)

A total of eight differentially expressed genes (DEGs), COL11A2, HOXC10, FN1, FBN1, AGT, FOS, SCD, and SLC27A6, were selected to verify the mRNA-Seq results by RT-qPCR. β-actin was used as the internal reference gene, and reverse transcription was performed using TransScript First-Strand cDNA Synthesis SuperMix (all-type gold) under the reaction conditions of 42 °C for 15 min, 85 °C for 5 s (1 cycle), and 4 °C for storage. Fluorescence quantitative PCR was performed using the LightCycler®96 SW 1.1 system, and the data were analyzed by 2−∆∆Ct method. The primer sequences are shown in Table 2.

2.6. Statistical Analysis

One-way analysis of variance (ANOVA) was conducted on data such as the quality index of the longissimus dorsal muscle and the diameter of muscle fibers using SPSS 23 software. Multiple comparisons were selected. Pairwise comparisons were used among the three groups to reflect the level of difference, and the significance level was set as p < 0.05.

3. Results

3.1. Determination of pH, Color Difference, Shear, and Cooking Loss of the LD

Samples of three cattle were collected from each group. The meat quality of the longissimus dorsal muscle of Pamir yaks in groups C, Z, and G was measured. Each indicator of each cattle was measured 3 to 5 times. The data were screened and used for subsequent analysis. As shown in Table 3, the pH*45min and pH*24h values of the longissimus dorsal muscle tissue in groups G and Z of yaks were significantly lower than those in group C (p < 0.05), among which the pH*45min and pH*24h values in group G were significantly lower than those in group Z (p < 0.05). The color differences of yaks in group G and group Z (L*45min, L*24h, a*45min, and b*45min) were significantly increased compared with group C (p < 0.05), among which the values of a*45min, a*24h, b*45min and b*24h in group G were significantly increased compared with those in group Z (p < 0.05). The shear force of the longissimus dorsal muscle tissue of yaks in group G was significantly lower than that in group Z and group C (p < 0.05). The intramuscular fat content in group G was significantly higher than that in group Z and group C, respectively (p < 0.05). These results indicate that an increase in the dietary level significantly improves the meat quality of the longissimus dorsal muscle of yaks, especially in terms of intramuscular fat content and tenderness.

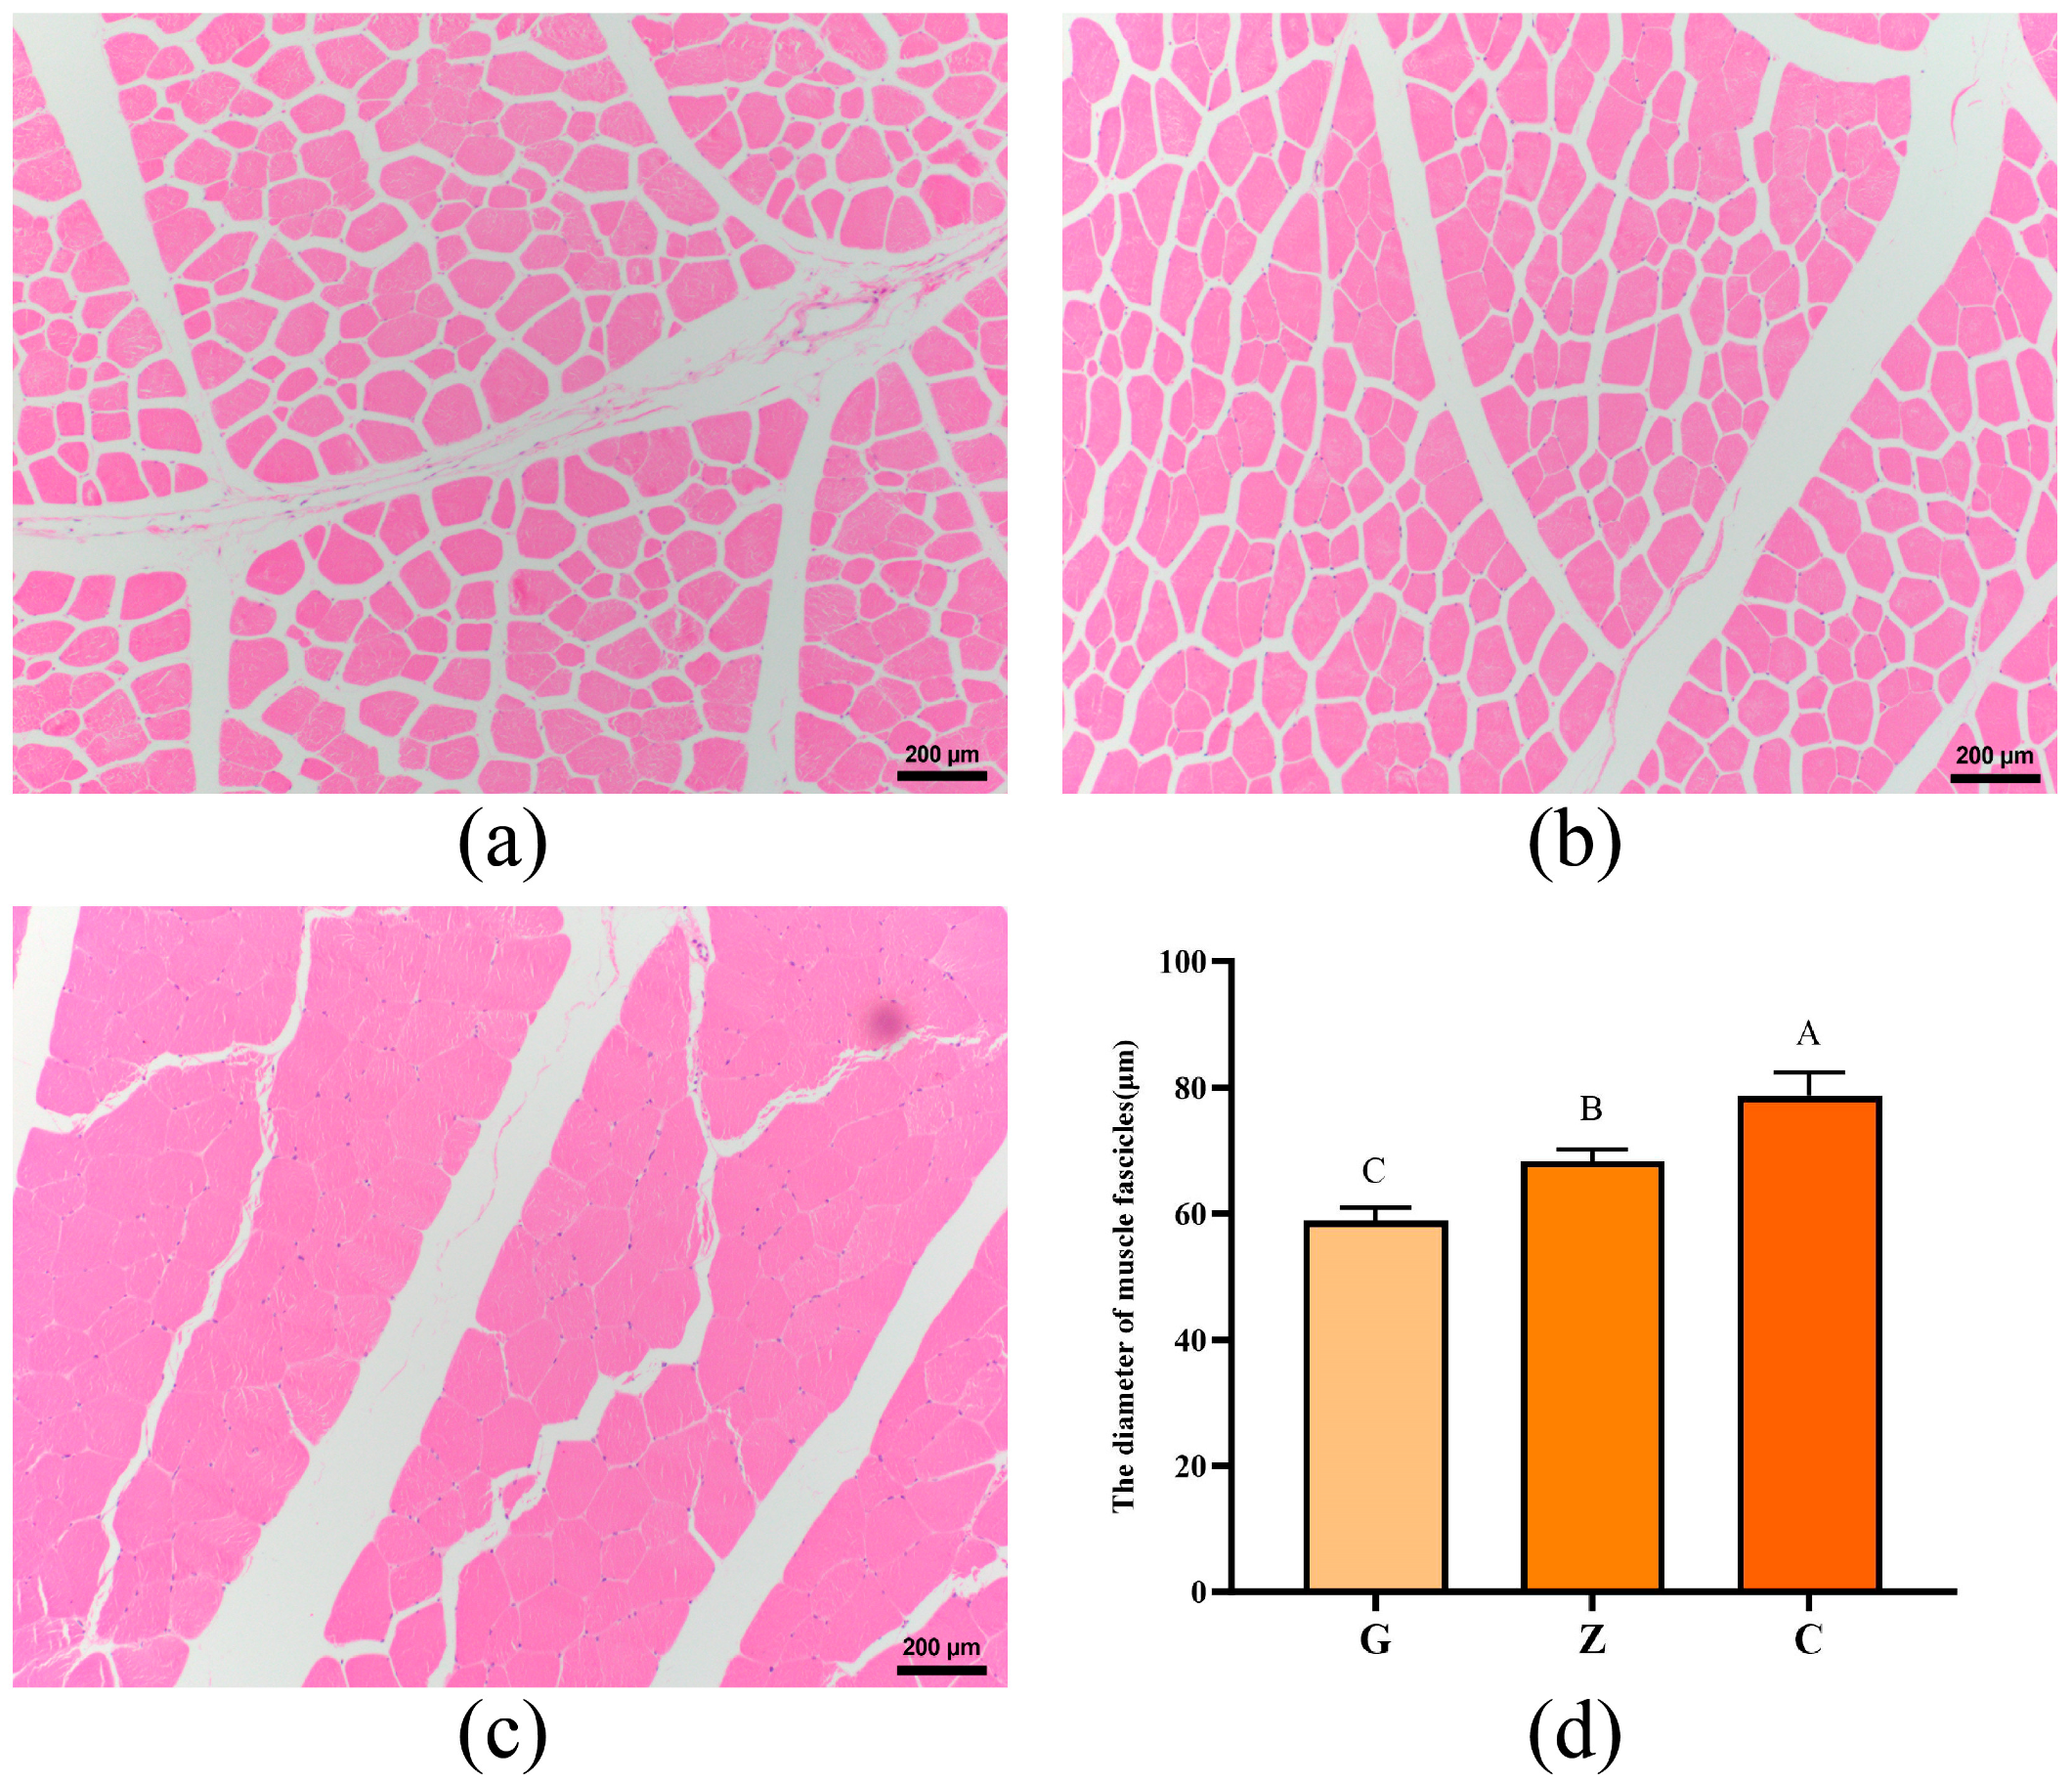
3.2. Histology of the Longissimus Dorsal Muscles

Histological analysis showed that increasing the dietary energy level significantly increased the myofiber gap and decreased the myofiber diameter of the LD of yaks (p < 0.01). Measurement of muscle fiber diameter was carried out as follows: Measure the distances between the longest and shortest two points on the cross-section of each fiber, respectively. Randomly select three fibers and measure three sets of data for each fiber, and take the average value. Among them, the muscle fiber diameters of the High-energy (G), Medium-energy (Z) and Low-energy (C) groups were 58.87 ± 2.11, 68.36 ± 1.90, and 78.73 ± 3.74 μm, respectively (Figure 1).

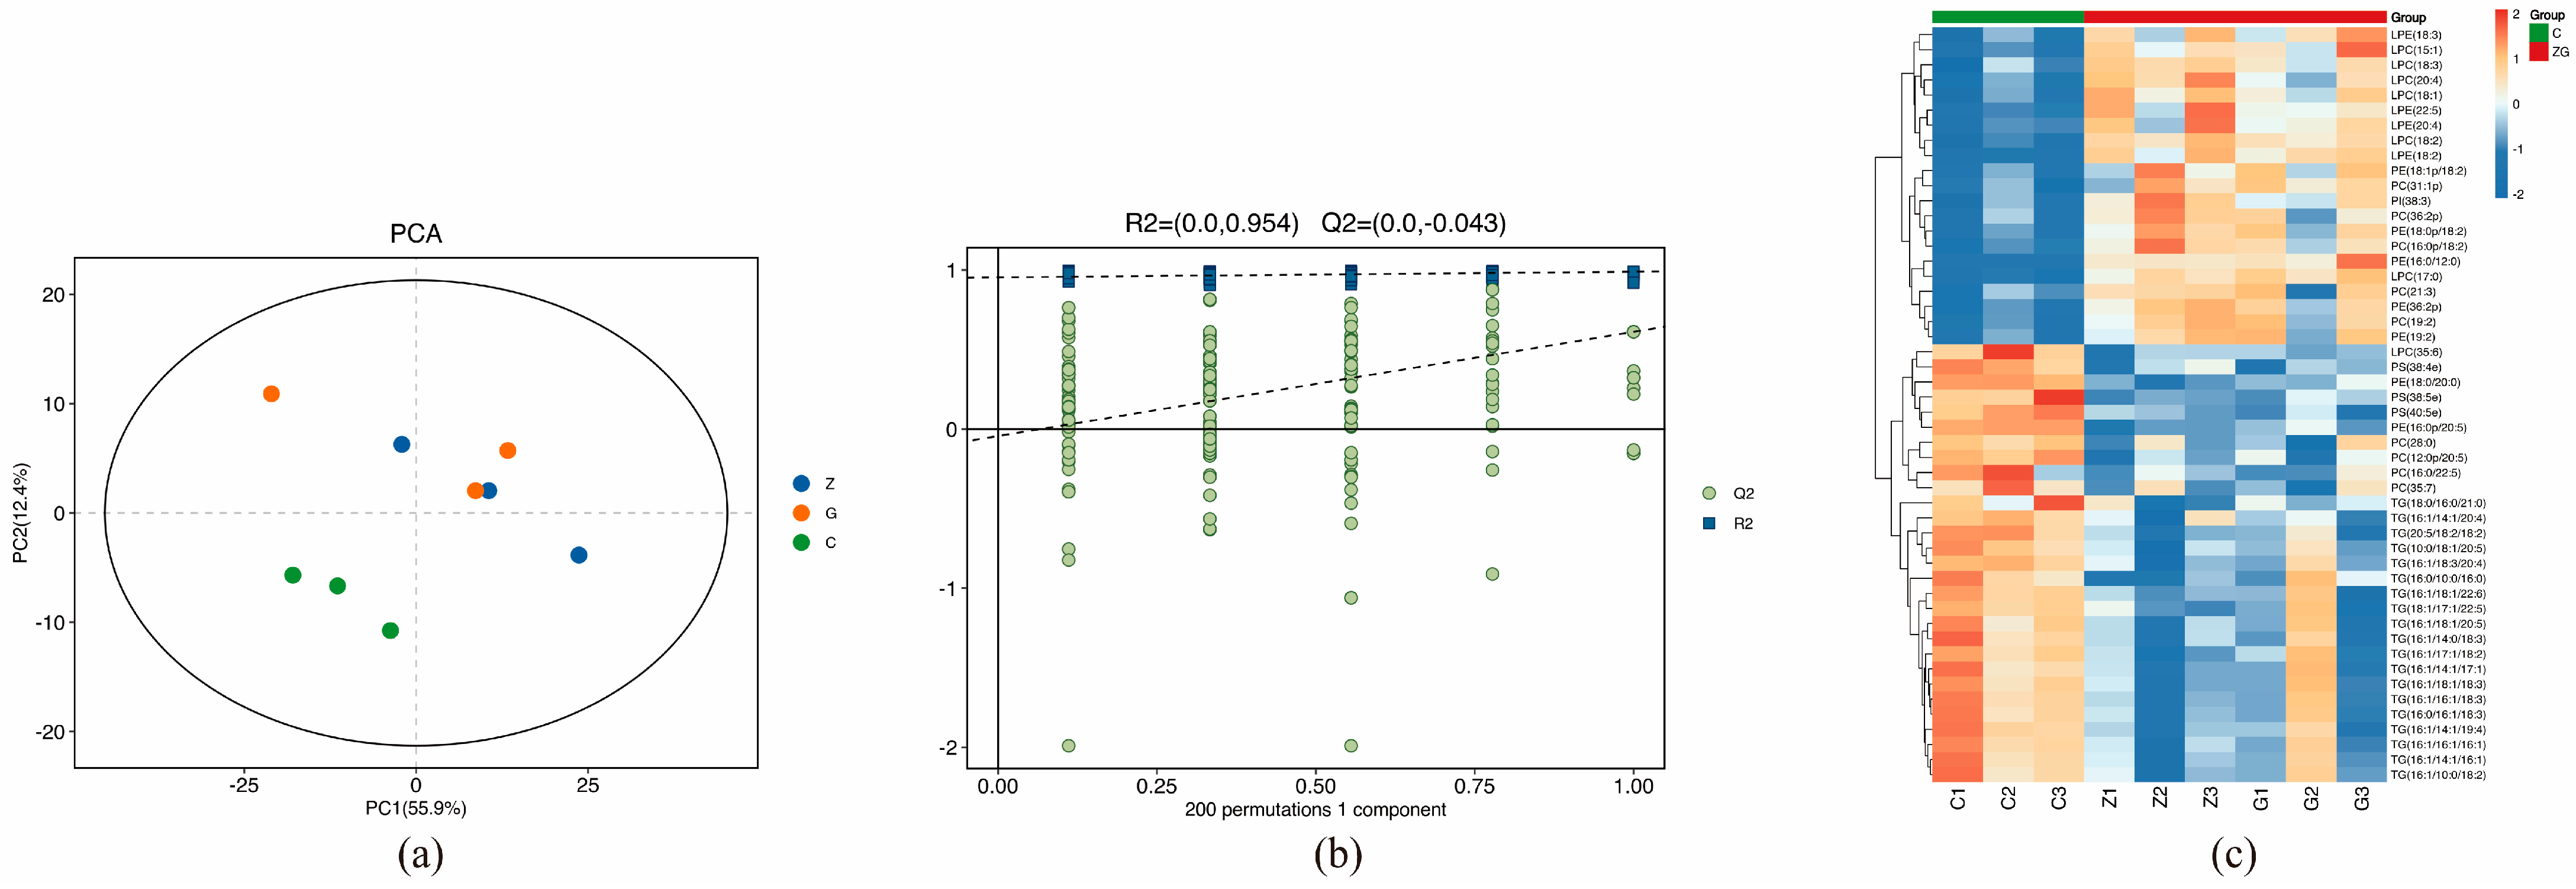
3.3. Lipidomics Results and Analysis

The PCA results of the longissimus dorsal muscle and quality control (QC) samples from groups C, Z, and G are shown in Figure 2a. The OPLS-DA model was further constructed to prevent overfitting. As shown in Figure 2b, R2Y (cum) = (0, 0.954) and Q2 (cum) = (0, 0.43), which met the criteria for evaluating the validity of the model. All the green Q2 values on the left were lower than the original points on the right, indicating that the model was stable and no overfitting occurred; the above results showed that there was a significant difference in the longissimus dorsal muscle among the three groups, suggesting that the energy level of the diets significantly affected the lipids in the longissimus dorsal muscle of yaks. The lipid thermograms of the longissimus dorsal muscle among the groups C, Z, and G are shown in Figure 2c.
C, Z, and G were divided into ZvsC and GvsC for comparative analysis. A total of 86 differentially metabolized lipids were identified in ZvsC, among which 39 were up-regulated and 47 were down-regulated. KEGG pathway enrichment analysis was conducted on differentially metabolized lipids. The results showed that a total of 14 KEGG pathways were enriched, mainly distributed in metabolism, cellular processes, and organismal systems. Fifty-three differential metabolites were identified in GvsC, among which 25 were upregulated and 28 were downregulated. KEGG pathway enrichment analysis was performed on differential metabolic lipids, and the results showed that a total of six KEGG pathways were enriched, mainly distributed in metabolism and cellular processes.
The key lipids screened out by the two comparison groups included TG(17:0/18:1/22:5), TG(18:1/17:1/18:3), TG(16:1/18:1/22:6), TG(16:0/10:0/16:0), TG(16:0/14:0/17:0), and TG(20: 5/18:2/18:2), PS (39:4), PS (38:5e), PS (38:4e), PC (12:0p/20:5), PE (16:0p/20:5), PE (18:0/17:1), PE (16:0p/20:5), PE (33:1p), and PE (17: (1/18:0)).

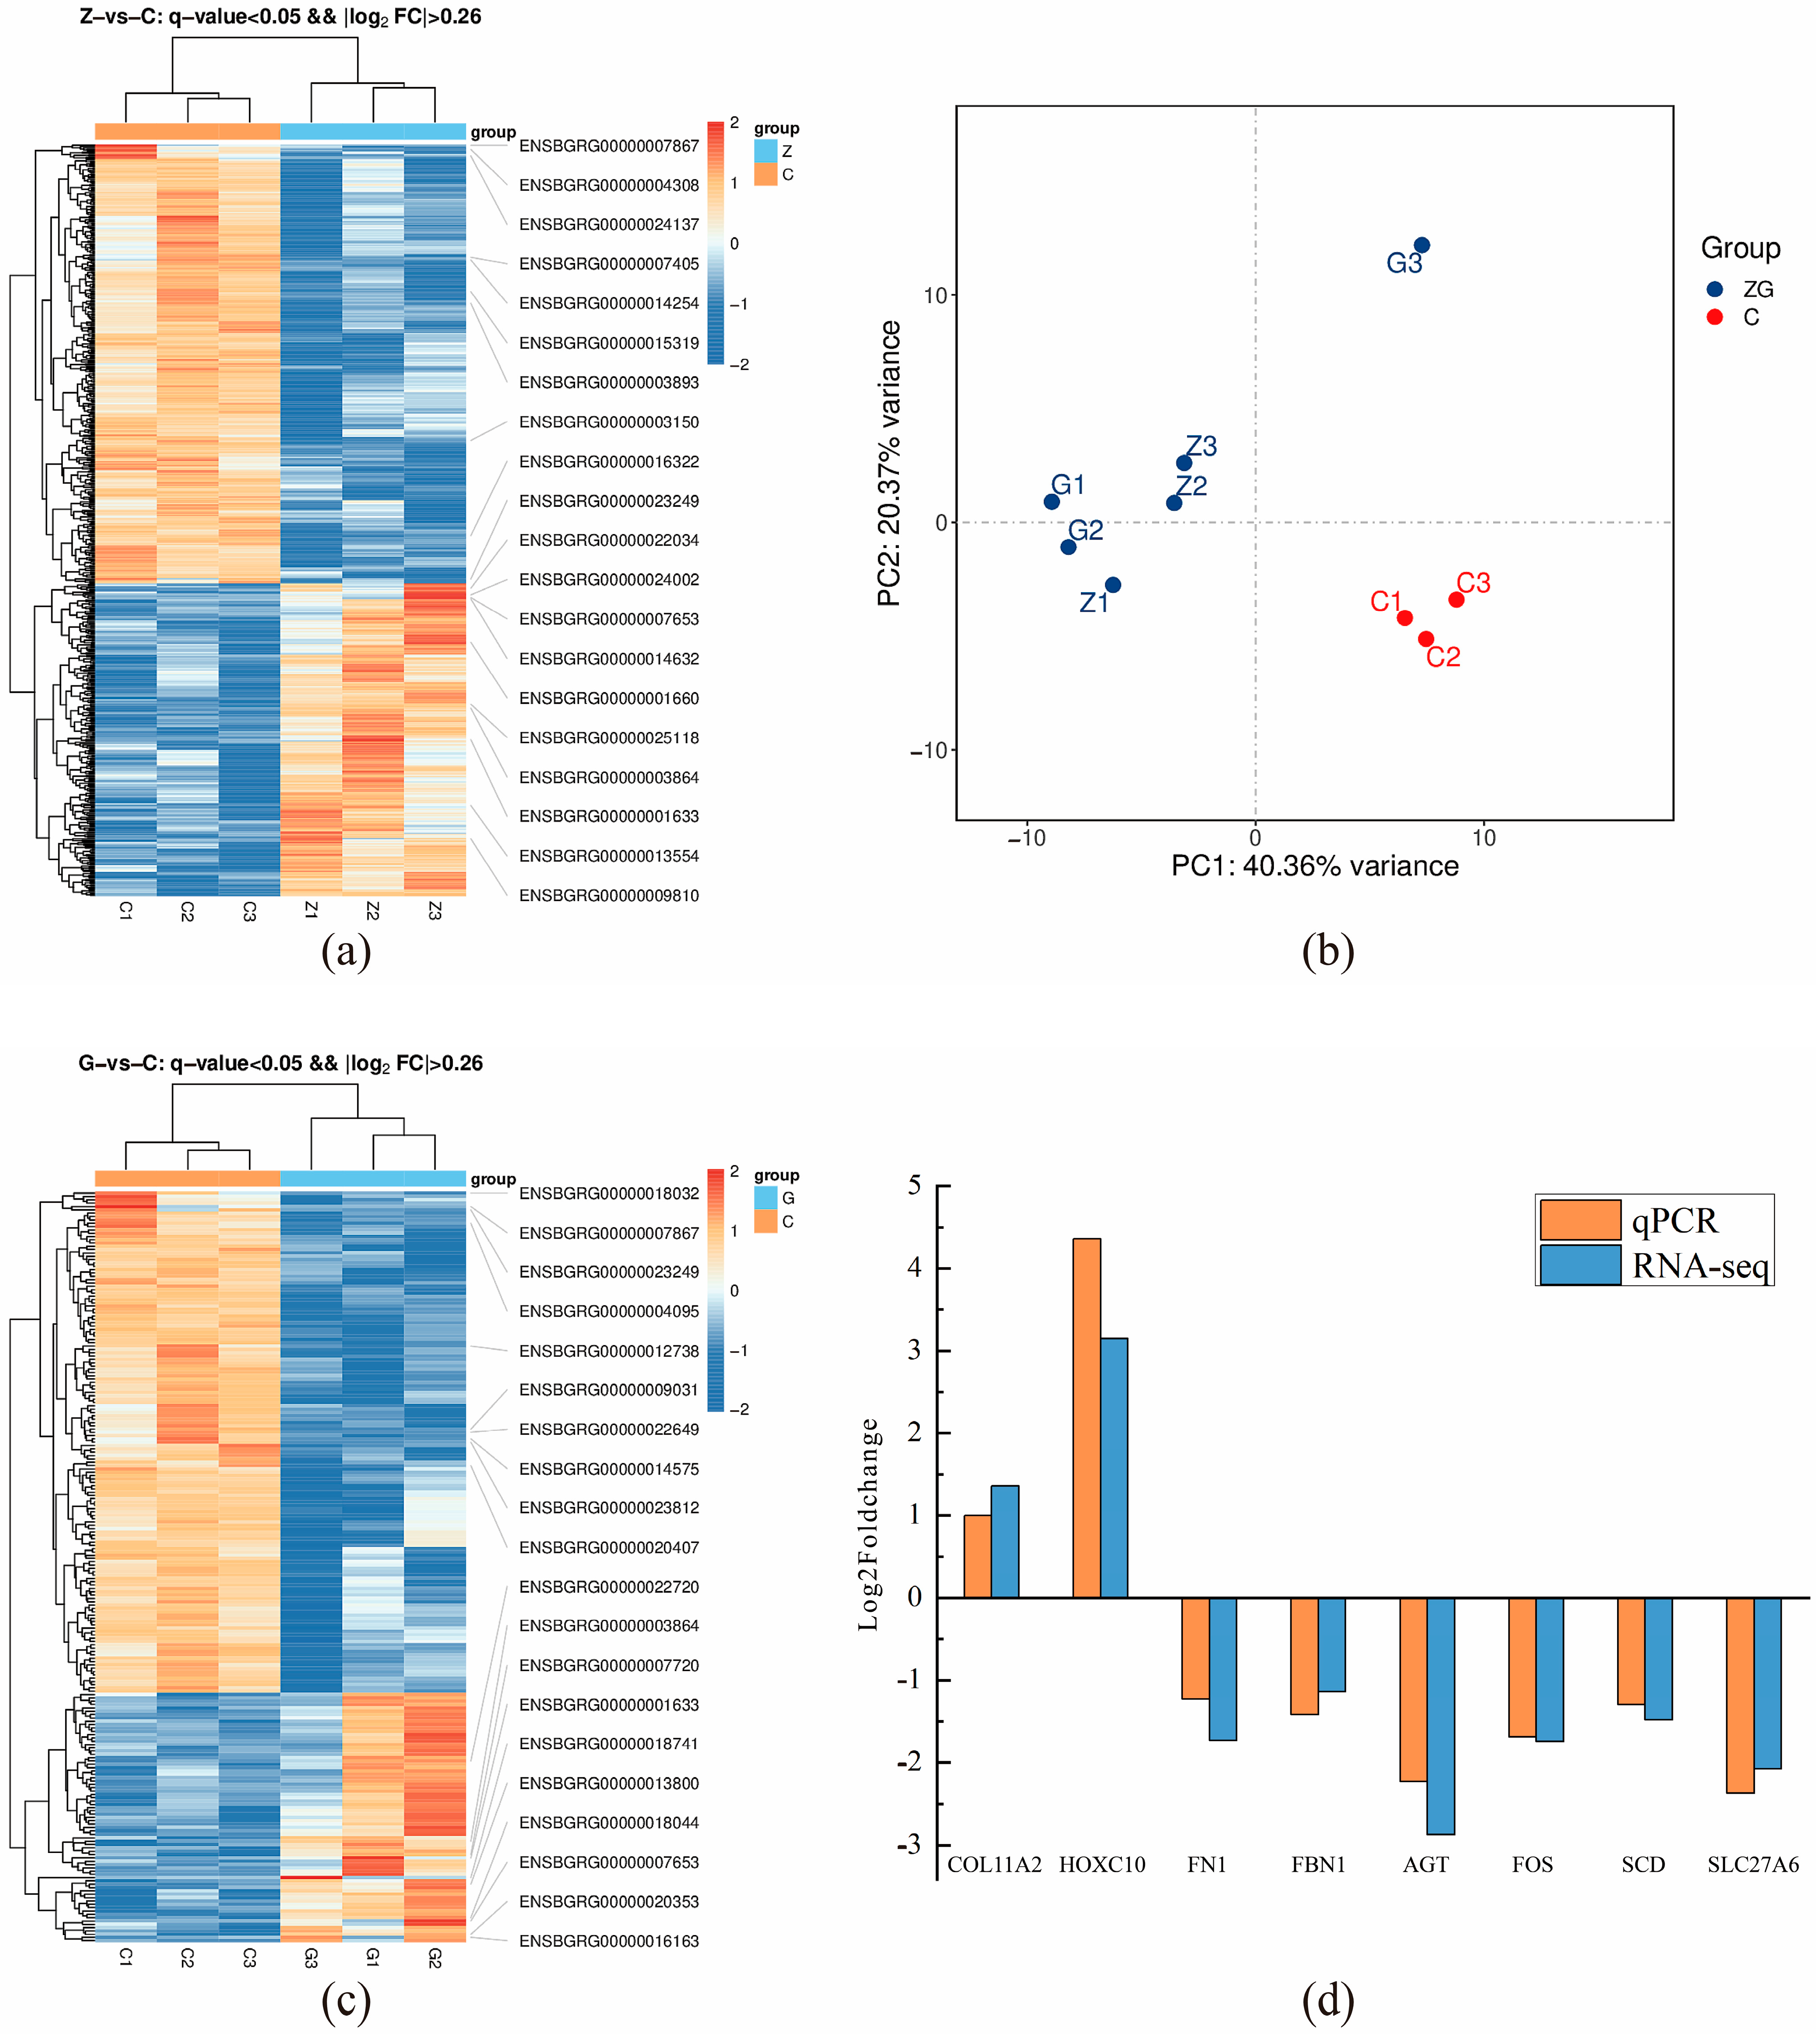
3.4. Transcriptomics Results and Analysis

A total of nine yak longissimus dorsal muscle tissues from three groups were sequenced for transcriptomics; a total of 59.77 G of clean data was obtained. The effective data volume of each sample ranged from 5.87 G to 6.97 G, the distribution of Q30 bases ranged from 95.91 g to 96.81%, and the average GC content was 51.34%. This indicates that the data identification was accurate, the sequencing data quality was reliable, and it could be used for subsequent analysis. The results of PCA showed significant differences between groups G, Z, and C, as shown in Figure 3b, indicating that elevating the energy level of the diet significantly affected the yak longissimus dorsal muscle tissues.
The differentially expressed genes among the three groups were analyzed. A total of 570 DEGs were identified in ZvsC, among which 237 were upregulated and 333 were downregulated (Figure 3a). The significantly enriched items in the differentially expressed genes were identified through GO enrichment analysis. A total of 1965 GO items were significantly enriched in the differentially expressed genes of ZvsC. Among them, the ones mainly involved in fat or IMF regulation included protein homodimerization activity (DCN, GADD45A, NR4A2, and FBLN5), cell adhesion (FN1, PCDH18, PRKCA, LAMC1 and LAMA2), positive regulation of cell migration (PTK2B, PDGFRA, CSF1, F2R and CCAR1), and extracellular space (FABP3, FBLN5, LEP, RBP4, and Sfrp4); KEGG enrichment analysis was conducted on the differentially expressed genes of ZvsC. The differentially expressed genes in the two comparison groups mainly enriched 284 KEGG pathways. Among them, those involving fat or IMF regulation mainly include glycerolipid metabolism (DGAT2, PLPP3 and LIPG) and EGFR tyrosine kinase inhibitor resistance (PDGFRA, VEGFA and IL6R), PPAR signaling pathway (PLIN2 and FABP3), Wnt signaling pathway (Sfrp4, PRKCA and PPP3CA), and PI3K-Akt signaling pathways (FGFR1, PRKCA and TNC).
A total of 226 DEGs were identified in GvsC, among which 75 were upregulated and 151 were downregulated (Figure 3c), significantly enriching 1147 GO entries. Among them, those involving fat or IMF regulation mainly included fextracellular space (Sfrp4). LEP, FBN1, and LHB, skeletal system development (KLF10, GDF11, CDH11, and HOXC10), and negative regulation of protein kinase activity (FABP4, GADD45A, and TRIB1). KEGG enrichment analysis was performed on the differentially expressed genes in the GvsC group, and 221 KEGG pathways were enriched. Among them, the ones involved in fat or IMF regulation mainly include the PPAR signaling pathway (FABP4, PLIN1, SCD, and SLC27A6), AMPK signaling pathway (PFKFB3), and Wnt signaling pathway (Sfrp4, TP53 and FBXW11), as well as the AGE-RAGE signaling pathway in diabetic complications (PLCD4, SERPINE1, and AGT).

3.5. Validation of mRNA Sequencing Using RT-qPCR

As shown in Figure 3d, the expression of COL11A2 in the LD of yaks in group Z and HOXC10 gene in group G was up-regulated compared with that of yaks in group C, whereas the expression of FN1, FBN1, and AGT genes in the LD of group Z and the expression of FOS, SCD, and SLC27A6 genes in group G was down-regulated. A total of eight DEGs in the LDs of yaks in groups C, Z, and G showed a consistent qPCR and mRNA-Seq data. Their expression patterns were consistent, indicating the reliability of the mRNA-Seq data in this study.

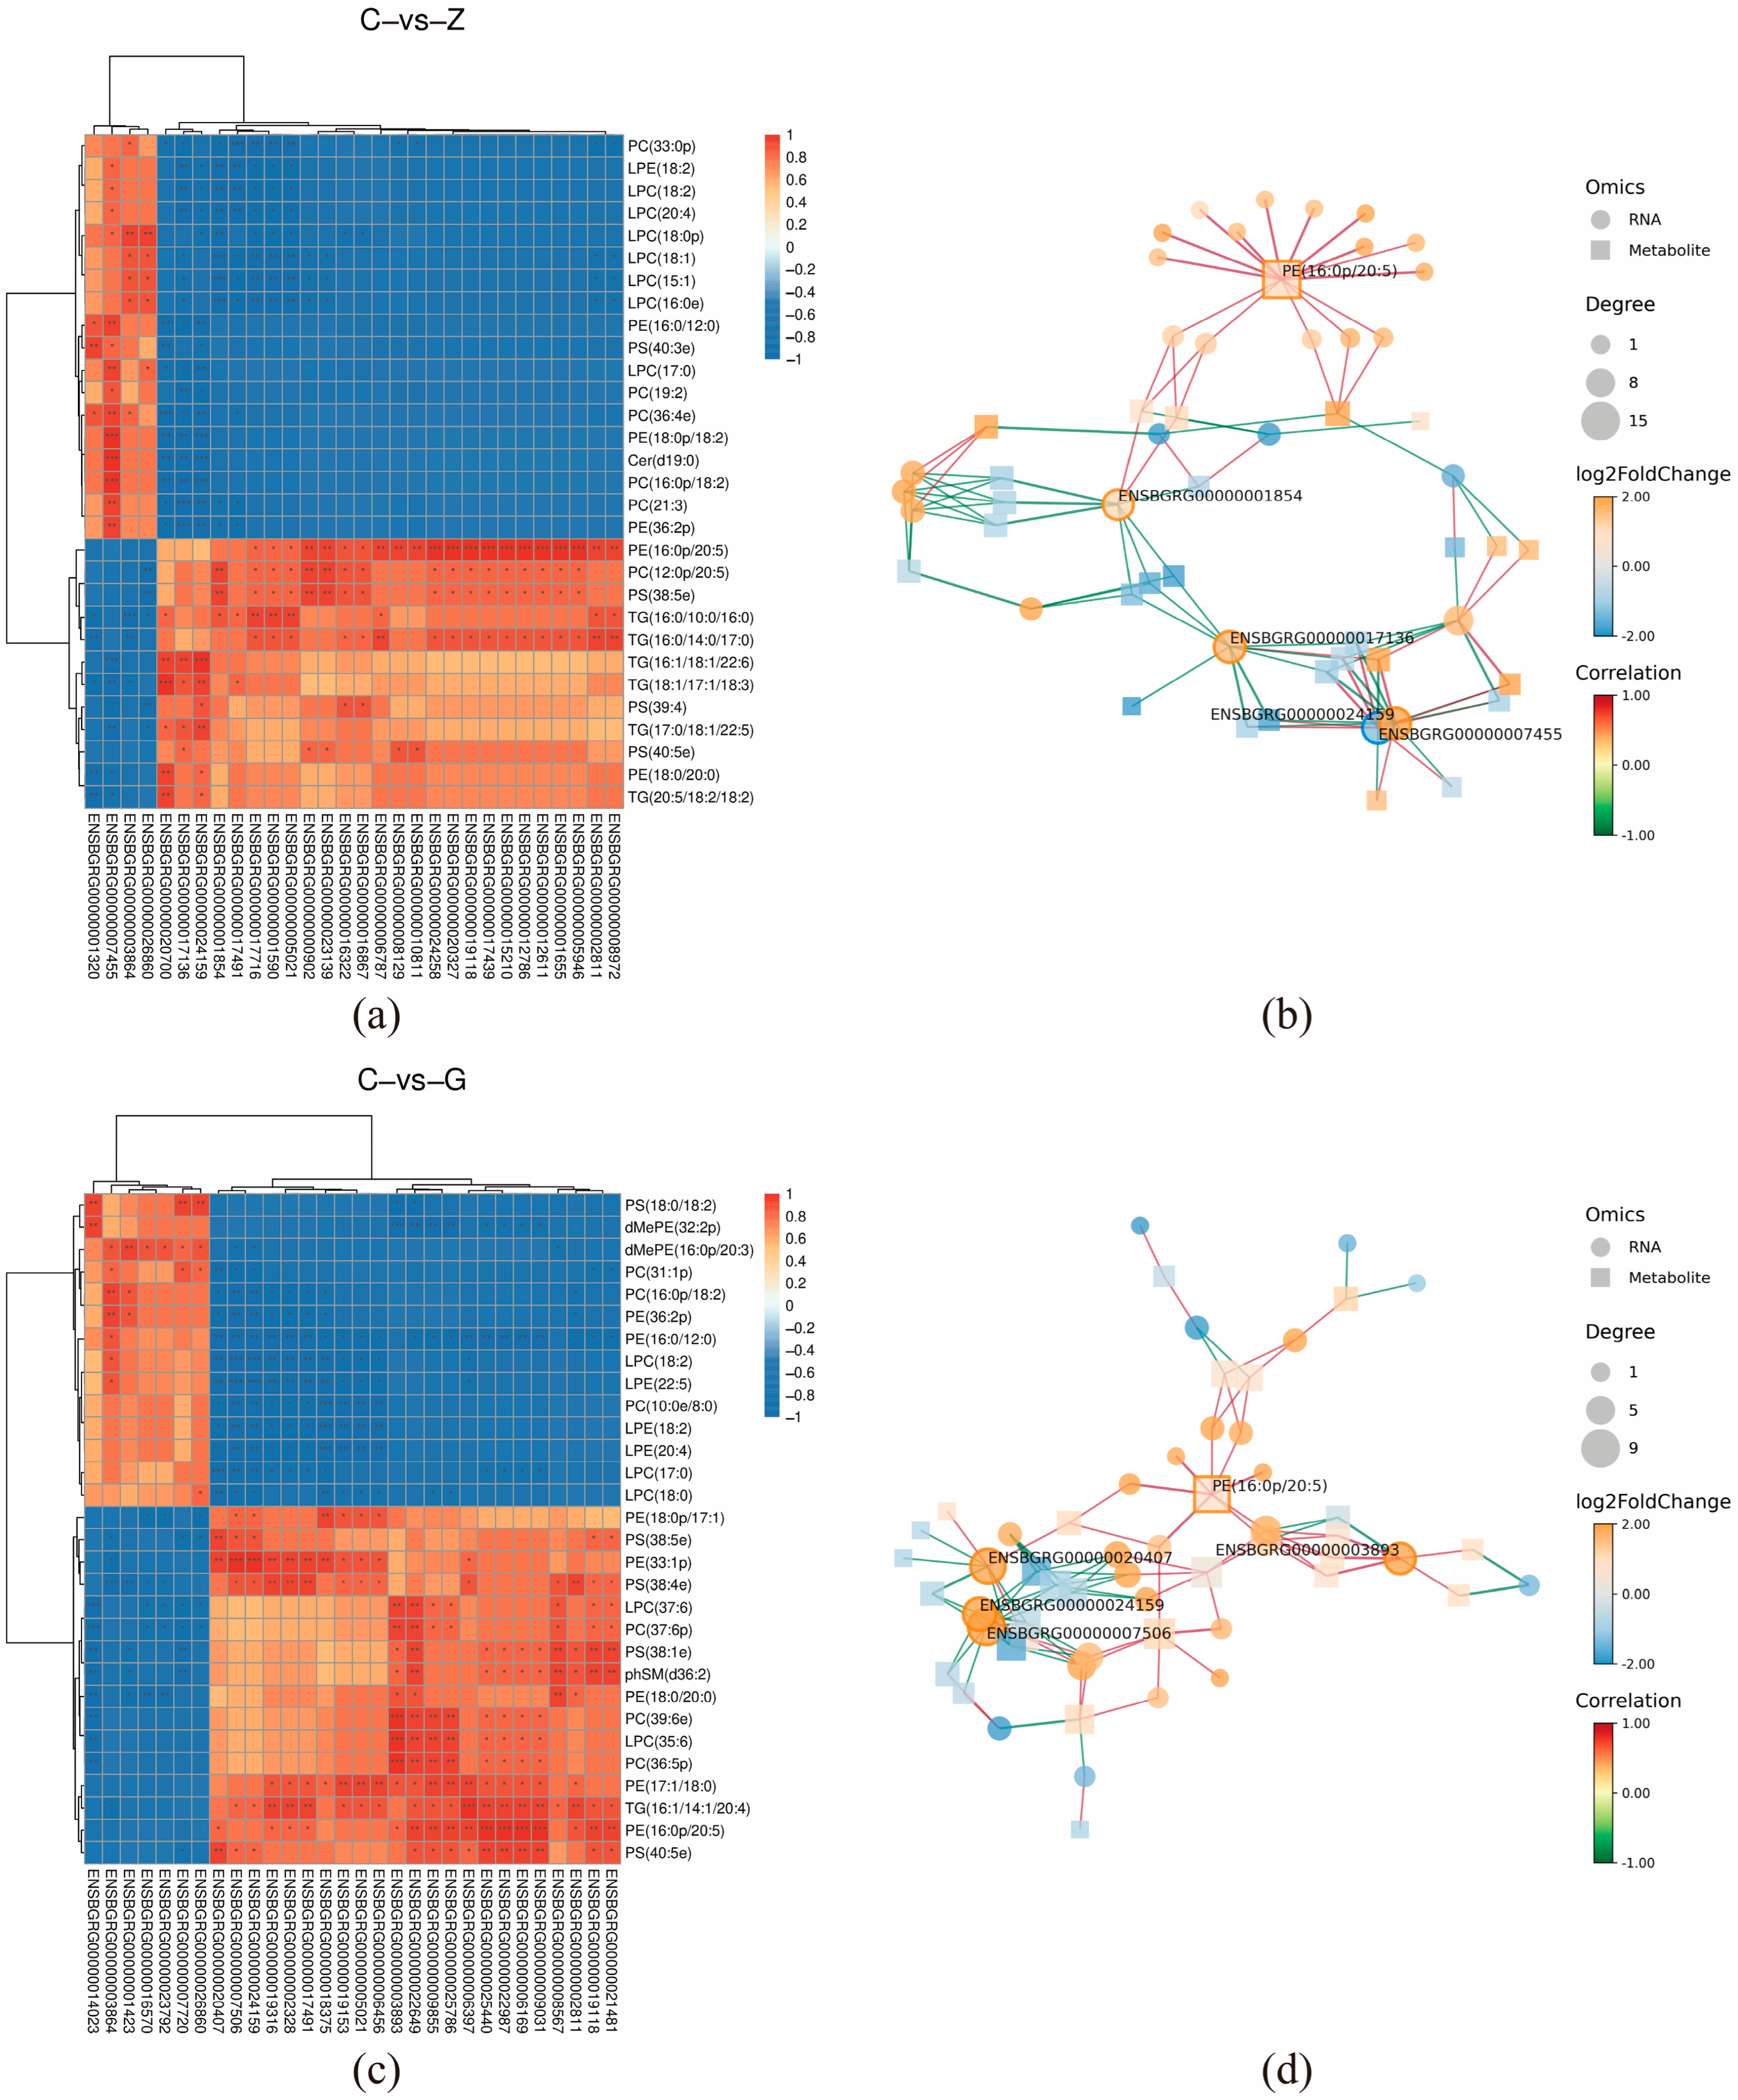
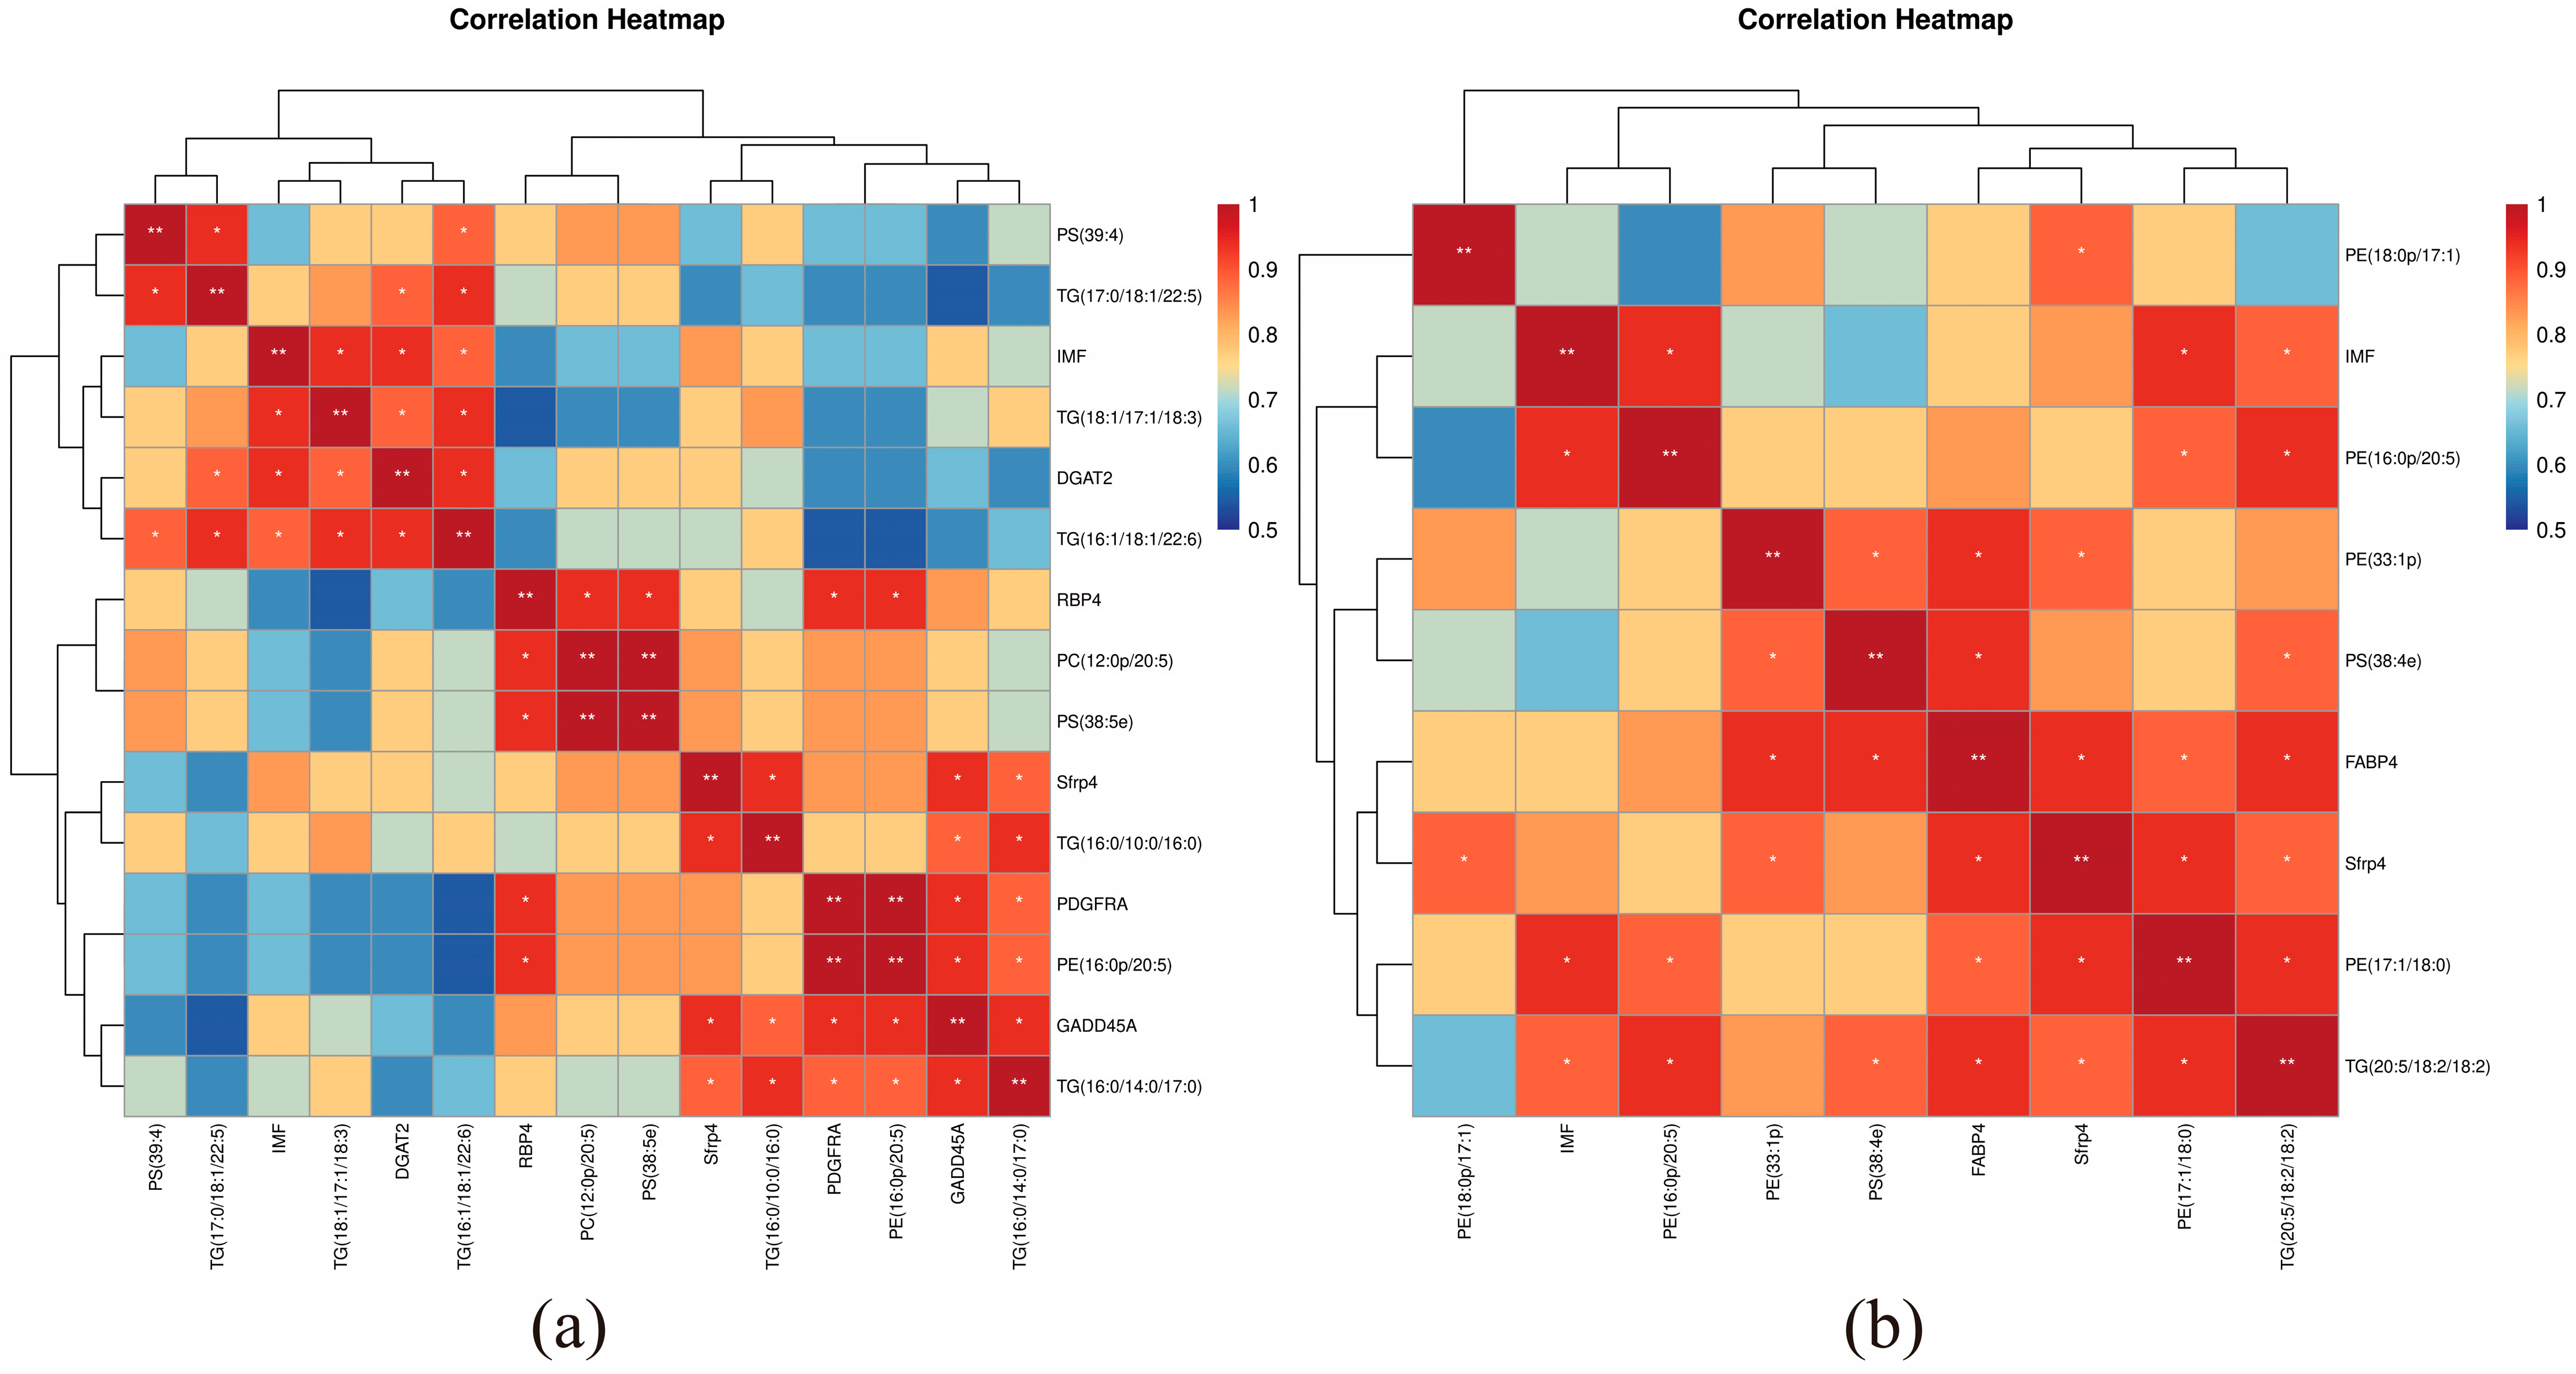
3.6. Correlation Analysis of Lipid Metabolomics and Transcriptomics

In order to uncover the regulatory mechanisms of intramuscular fat deposition in the LD of Pamir yaks, the first 30 differentially metabolized lipids and differential genes in the LD of the two comparison groups, ZvsC and GvsC, respectively, were correlated. The correlations between the differential genes and the lipid metabolites are shown in Figure 4; among them, key DEGs involved in the regulation of IMF content included GADD45A, PDGFRA, RBP4, DGAT2, SFRP4, and FABP4 genes. The results showed significant positive correlation of PDGFRA and RBP4 expression with PE (16:0p/20:5), PC (12:0p/20:5), and PS (38:5e), while GADD45A expression with PE (16:0p/20:5), TG (16:0/10:0/16:0), and TG (16:0/14:0/17:0) were significantly positively correlated with PE (16:0/14:0/17:0), where TG (16:0/14:0/17:0) was also significantly positively correlated with the expression of PDGFRA. In addition, the expression of SFRP4 was significantly positively correlated with PE (16:0p/20:5), PC (12:0p/20:5), PS (38:5e), TG (16:0/10:0/16:0), while TG (16:0/14:0/17:0) were significantly positively correlated, and DGAT2 expression was significantly positively correlated with TG (16:1/18:1/22:6), TG (18:/17:1/18:3), TG (17:0/18:1/22:5), and PS (40:5e). In the joint analysis of GvsC, SFRP4 expression was significantly and positively correlated with PE (18:0p/17:1), PE (33:1p), PS (38:4e), PE (17:1/18:0), and TG (16:1/14:1/20:4), while FABP4 expression was significantly and positively correlated with PE (33:1p), PS (38:4e), PE (17: 1/18:0), TG (16:1/14:1/20:4), and PE (16:0p/20:5) were significantly positively correlated.

3.7. Correlation of IMF, DEG and SDL

By analyzing the correlation of IMF with DEG and SDL, we revealed its regulatory mechanism on fat deposition in the LD of yak, and the results are shown in Figure 5a,b. In Z vs. C, TG (18:1/17:118:3), TG (16:1/18:1/22:6) and DGAT2 showed significant positive correlation with IMF, and in G vs. C, PE (17:1/18:0), PE (16:0p/20:5), and TG (20:5/18:2/18:2) showed significant positive correlation with IMF.

4. Discussion

Yak meat has been popular among consumers for its rich nutrition. Yak meat is rich in protein and essential amino acids, but it is poorer than beef breeds in terms of eating quality, such as muscle tenderness, shear force, and cooking loss [32]. IMF content is closely related to shear force and tenderness, which is one of the determinants of meat characteristics [10]; therefore, it is important to excavate and elucidate the regulatory mechanism of IMF deposition.
In the present study, the IMF content of yak LD in group G exhibited a marked elevation compared to groups Z and C (p < 0.05), and its shear force displayed a substantial drop compared to groups Z and C (p < 0.05). In addition, the cooking loss of yak LD in groups C, Z, and G gradually decreased with the increase of energy level in the diet, and the diameter of muscle fibers of LD in group G was significantly lower than that in groups Z and C (p < 0.05). These results suggest that increasing the energy level in yak diets can effectively improve yak meat quality, especially in increasing IMF content. The results of this study are consistent with those of fattening cattle [33] and buffaloes [34], which both showed that IMF content increased with the increase of dietary energy.
Lipids are key factors in IMF deposition, and the lipids that promote IMF deposition mainly include phosphatidylserine (PS), triglycerides (TG), phosphatidylchloline (PC), and lysophosphatidylcholine (LPC) [35], of which TG is the main component of IMF. In the present study, the significant differential lipids in the two comparison groups were mainly TG, PS, and LPC, etc., and it was hypothesized that these significant differential lipids contributed to the differences in IMF deposition. Lipid deposition is mainly the synthesis of TG, etc., from esterified fatty acids of the glycerol skeleton, which is catalyzed by a range of enzymes and proteins, etc. [36]. Prior research has demonstrated a number of candidate genes (PPAR, DAGT, and AGPAT) associated with IMF deposition, and most of these genes have been linked to the deposition of lipids such as TG and GP [37], suggesting that these genes serve as a critical determinant of IMF deposition by regulating lipid metabolism.
Transcriptome analysis identified six key DEGs (SFRP4, FABP4, GADD45A, PDGFRA, RBP4, and DGAT2) that regulate IMF content. SFRP4 acts as an antagonist of the Wnt/β-catenin signaling pathway [38,39] and promotes adipogenesis through the upregulation of adipogenic gene expression; its expression trend is consistent with IMF content, which serves as a critical determinant of IMF deposition [40], consistent with the positive correlation between IMF content and SFRP4 in bovine LD reported by Tan et al. [41]. FABP4 is a protein expressed in adipocytes, which plays an important role in fatty acid transport and lipid hydrolysis [42], and a strong positive relationship was observed between the expression level and meat quality texture traits, IMF deposition, and adipocytogenesis [43,44,45]. It was also found that lncFABP4, which is transcribed from the antisense strand of FABP4, is upregulated in the lipogenic differentiation of intramuscular preadipocytes and thereby promotes preadipocyte differentiation by regulating FABP4 expression [46]. Notably, both SFRP4 and FABP4 were significantly positively correlated with PE (17:1/18:0) and TG (20:5/18:2/18:2), which were also highly correlated with IMF content, suggesting that these genes may synergistically promote IMF deposition by regulating specific lipid metabolism.
GADD45A was differentially expressed in the LD of two different pig breeds [45], and Pearson correlation analysis showed that the level of GADD45A expression increased with increasing IMF content [47]. In Berkshire pigs, the SNP for GADD45A was significantly correlated with IMF [48], and its expression revealed a statistically significant positive correlation with genes related to lipidogenic differentiation (FABP4, CEBPA, and CEBPB) [49]. The expression level of GADD45A was higher in breeds with high IMF deposition compared to lean breeds with low IMF deposition [50]. In addition, the present study found that GADD45A showed strong positive correlation with the PDGFRA gene and lipid TG (16:0/10:0/16:0), PE (16:0p/20:5), and TG (20:5/18:2/18:2), suggesting that GADD45A is a potentially important gene in regulating IMF deposition.
PDGFRA, an important biomarker of preadipocytes, was expressed at significantly higher levels in adipose pig LD than in lean pig and mediated adipogenesis through the Erk signaling pathway [51]; furthermore, fattened Angus cattle contained significantly higher levels of PDGFRA than Nellore cattle [52], confirming that PDGFRA is a beef intramuscular adipocyte progenitor cell marker [53]. In the context of this investigation, PDGFRA was significantly and positively correlated with GADD45A, RBP4, PE (16:0p/20:5), and TG (16:0/14:0/17:0), suggesting that PDGFRA may modulate TG metabolic pathways through synergistic interactions with GADD45A and RBP4, which may in turn promote IMF deposition.
RBP4 is an adipokine and fatty acid transport protein that plays an important role in fat deposition. Studies have shown that plasma levels of RBP4 in 8-month-old cattle were significantly higher than those in 18-month-old cattle, suggesting that RBP4 is involved in adipose tissue development [54]. In addition, RBP4 has been identified as one of the key genes involved in lipid metabolism in intramuscular adipocytes in the Piedmontese × Hereford and Wagyu × Hereford crosses and was positively associated with IMF deposition in Brahman cattle [55]. Another study showed that RBP4 was differentially expressed in LD of cattle before and after 3 months of fattening [56]. In the context of this investigation, RBP4 was found to be significantly and positively correlated with lipids such as PC, PS, and PE, further confirming the important role of RBP4 in lipid metabolism and IMF deposition in cattle.
DGAT2, as the final step in catalyzing triglyceride synthesis [57], showed a strong positive correlation between its expression level and IMF content [58,59,60]. DGAT2 gene polymorphism was found to affect the tenderness of yak meat and could be used as a genetic marker to improve the tenderness of yak meat [61]. Cellular study level confirmed that DGAT2 overexpression significantly increased TAG deposition in intramuscular precursor adipocytes of goats, while silencing expression of DGAT2 decreased TAG content [62]. This result was validated in 3T3-L1 adipocytes [63], suggesting that DGAT2 plays a key role in IMF deposition. The present experiment showed that DGAT2 not only presented a statistically significant positive correlation with IMF, but also a significant positive correlation with TG (18:1/17:1/18:3), further confirming that DGAT2 is a key candidate gene for regulating IMF deposition.

5. Conclusions

This study mainly discussed the regulation of the energy level in the diet on the deposition of IMF in yak LD. The results show that diets with higher energy levels can improve meat quality to a certain extent and provide consumers with higher quality yak meat products. This study screened some differential genes and lipid metabolites. Among them, the IMF and differential lipids of yak meat were mainly regulated by the SFRP4, FABP4, GADD45A, PDGFRA, RBP4, and DGAT2 genes, which can be used as a theoretical basis to reveal the regulatory effect of IMF deposition in yak meat and improve the deposition of IMF in yak meat.

Author Contributions

Conceptualization, J.D., J.J. and P.Y.; methodology, J.D.; software, J.D., X.C. and P.B.; formal analysis, T.W., S.K. and M.Z.; investigation, N.L., Q.Y. and X.C.; resources, P.B. and N.L.; data curation, J.J., T.W. and P.Y.; writing—original draft, J.D.; writing—review and editing, J.D., P.B. and Q.Y.; visualization, M.Z., N.L. and S.K.; supervision, P.Y.; project administration, J.J. and P.Y.; funding acquisition, J.J. and P.Y. All authors have read and agreed to the published version of the manuscript.

Funding

This research was funded by the Shenzhen Science and Technology Program (KCXFZ20201221173205015), the Xinjiang Tianchi talent research Program (TCYC-TP2023), and the Tingzhou talent research Program (TZYC-TP2023).

Institutional Review Board Statement

All animal studies conducted in this study were approved by the Animal Administration and Ethics Committee of Lanzhou Institute of Husbandry and Pharmaceutical Sciences, Chinese Academy of Agricultural Sciences (SYXK-2014–0002).

Informed Consent Statement

Not applicable.

Data Availability Statement

Data used in this study are available from the corresponding author on reasonable request.

Acknowledgments

The authors would like to thank the Key Laboratory of Animal Genetics and Breeding on Tibetan Plateau, Ministry of Agriculture and Rural Affairs; Key Laboratory of Yak Breeding Engineering of Gansu Province for the classmates and teachers valuable support and constructive suggestions. We also appreciate the helpful comments from the editors and reviewers.

Conflicts of Interest

The authors declare no conflicts of interest.

Abbreviations

The following abbreviations are used in this manuscript:
IMFIntramuscular fat
LDLongissimus dorsi muscle
DEGDifferentially expressed genes
SDLSignificant differential lipids
QCQuality control
PCAPrincipal component analysis
OPLS-DAOrthogonal partial least squares discriminant analysis
KEGGKyoto Encyclopedia of Genes and Genomes

References

  1. Jing, X.P.; Ding, L.M.; Zhou, J.W.; Huang, X.D.; Degen, A.; Long, R.J. The adaptive strategies of yaks to live in the Asian highlands. Anim. Nutr. 2002, 9, 249–258. [Google Scholar] [CrossRef] [PubMed]
  2. Li, Y.; Zong, W.; Zhao, S.; Qie, M.; Yang, X.; Zhao, Y. Nutrition and edible characteristics, origin traceability and authenticity identification of yak meat and milk: A review. Trends Food Sci. Technol. 2023, 139, 104133. [Google Scholar] [CrossRef]
  3. Guo, X.; Wu, X.; Chu, M.; Bao, P.; Xiong, L.; Liang, C.; Ding, X.; Pei, J.; Yan, P. Characterization of the complete mitochondrial genome of the Pamir yak (Bos grunniens). Mitochondrial DNA B Resour. 2019, 4, 3165–3166. [Google Scholar] [CrossRef] [PubMed]
  4. Bao, P.J.; Ding, Z.Q.; Ma, X.M.; La, Y.F.; Guo, T.; Zheng, X.B.; Ma, J.E.D.; Dao, M.; Zhou, C.; Zuo, E.W.; et al. Study on Slaughter Performance and Meat Quality of Pamir Yak. China Herbiv. Sci. 2024, 44, 83–87. [Google Scholar]
  5. Zhong, J.C.; Wang, H.; Chai, Z.X.; Ma, Z.J. Exploitation and innovative utilization of yak germplasm resources. Chin. Livest. Poult. Breed. 2022, 18, 22–29. [Google Scholar]
  6. Zhao, J.; Xu, Z.; Chen, A.; You, X.; Zhao, Y.; He, W.; Zhao, L.; Yang, S. Identification of meat from yak and cattle using SNP markers with integrated allele-specific polymerase chain reaction-capillary electrophoresis method. Meat Sci. 2019, 148, 120–126. [Google Scholar] [CrossRef] [PubMed]
  7. Jin, C.L.; Gao, C.Q.; Wang, Q.; Zhang, Z.M.; Xu, Y.L.; Li, H.C.; Yan, H.C.; Wang, X.Q. Effects of pioglitazone hydrochloride and vitamin E on meat quality, antioxidant status and fatty acid profiles in finishing pigs. Meat Sci. 2018, 145, 340–346. [Google Scholar] [CrossRef] [PubMed]
  8. Hou, B.; Zhao, Y.; He, P.; Xu, C.; Ma, P.; Lam, S.M.; Li, B.; Gil, V.; Shui, G.; Qiang, G.; et al. Targeted lipidomics and transcriptomics profiling reveal the heterogeneity of visceral and subcutaneous white adipose tissue. Life Sci. 2020, 245, 117352. [Google Scholar] [CrossRef] [PubMed]
  9. Dannenberger, D.; Nuernberg, G.; Scollan, N.; Ender, K.; Nuernberg, K. Diet alters the fatty acid composition of individual phospholipid classes in beef muscle. J. Agric. Food Chem. 2007, 55, 452–460. [Google Scholar] [CrossRef] [PubMed]
  10. Wang, H.; Zhong, J.; Zhang, C.; Chai, Z.; Cao, H.; Wang, J.; Zhu, J.; Wang, J.; Ji, Q. The whole-transcriptome landscape of muscle and adipose tissues reveals the ceRNA regulation network related to intramuscular fat deposition in yak. BMC Genom. 2020, 21, 347. [Google Scholar] [CrossRef] [PubMed]
  11. Zhao, W.; Hu, J.; Li, L.; Xue, L.; Tian, J.; Zhang, T.; Yang, L.; Gu, Y.; Zhang, J. Integrating lipidomics and metabolomics to reveal biomarkers of fat deposition in chicken meat. Food Chem. 2025, 464 Pt 2, 141732. [Google Scholar] [CrossRef] [PubMed]
  12. Roy, B.C.; Bruce, H.L. Contribution of intramuscular connective tissue and its structural components on meat tenderness-revisited: A review. Crit. Rev. Food Sci. Nutr. 2024, 64, 9280–9310. [Google Scholar] [CrossRef] [PubMed]
  13. Bravo-Lamas, L.; Barron, L.J.R.; Farmer, L.; Aldai, N. Fatty acid composition of intramuscular fat and odour-active compounds of lamb commercialized in northern Spain. Meat Sci. 2018, 139, 231–238. [Google Scholar] [CrossRef] [PubMed]
  14. Igene, J.O.; Pearson, A.M. Role of phospholipids and triglycerides in warmed-over flavor development in meat model systems. J. Food Sci. 1979, 44, 1285–1290. [Google Scholar] [CrossRef]
  15. Wang, Q.; Wang, Y.; Hussain, T.; Dai, C.; Li, J.; Huang, P.; Li, Y.; Ding, X.; Huang, J.; Ji, F.; et al. Effects of dietary energy level on growth performance, blood parameters and meat quality in fattening male Hu lambs. J. Anim. Physiol. Anim. Nutr. 2020, 104, 418–430. [Google Scholar] [CrossRef] [PubMed]
  16. Li, N.Y.; Yang, M.H.; Bi, B.L.; Kong, L.F.; Gao, S.Z.; Zhao, S.M.; Su, Z.F.; Huang, Y. Effect of Dietary Energy Levels on Gene Expression Related with Intramuscular Fat Deposition in Muscle Tissue of Wujin Pigs. Chin. J. Anim. Sci. 2014, 50, 41–45. [Google Scholar]
  17. Kang, K.; Ma, J.; Wang, H.; Wang, Z.; Peng, Q.; Hu, R.; Zou, H.; Bao, S.; Zhang, W.; Sun, B. High-energy diet improves growth performance, meat quality and gene expression related to intramuscular fat deposition in finishing yaks raised by barn feeding. Vet. Med. Sci. 2020, 6, 755–765. [Google Scholar] [CrossRef] [PubMed]
  18. Wang, H.; Li, H.; Wu, F.; Qiu, X.; Yu, Z.; Niu, W.; He, Y.; Su, H.; Cao, B. Effects of Dietary Energy on Growth Performance, Rumen Fermentation and Bacterial Community, and Meat Quality of Holstein-Friesians Bulls Slaughtered at Different Ages. Animals 2019, 9, 1123. [Google Scholar] [CrossRef] [PubMed]
  19. Li, L.; Zhu, Y.; Wang, X.; He, Y.; Cao, B. Effects of different dietary energy and protein levels and sex on growth performance, carcass characteristics and meat quality of F1 Angus × Chinese Xiangxi yellow cattle. J. Anim. Sci. Biotechnol. 2014, 5, 21. [Google Scholar] [CrossRef] [PubMed] [PubMed Central]
  20. Lowe, R.; Shirley, N.; Bleackley, M.; Dolan, S.; Shafee, T. Transcriptomics technologies. PLoS Comput. Biol. 2017, 13, e1005457. [Google Scholar] [CrossRef] [PubMed]
  21. Dong, Z.; Chen, Y. Transcriptomics: Advances and approaches. Sci. China Life Sci. 2013, 56, 960–967. [Google Scholar] [CrossRef] [PubMed]
  22. Hatzirodos, N.; Irving-Rodgers, H.F.; Hummitzsch, K.; Harland, M.L.; Morris, S.E.; Rodgers, R.J. Transcriptome profiling of granulosa cells of bovine ovarian follicles during growth from small to large antral sizes. BMC Genom. 2014, 15, 24. [Google Scholar] [CrossRef] [PubMed]
  23. Idle, J.R.; Gonzalez, F.J. Metabolomics. Cell Metab. 2007, 6, 348–351. [Google Scholar] [CrossRef] [PubMed]
  24. Nicholson, J.K.; Lindon, J.C.; Holmes, E. ‘Metabonomics’: Understanding the metabolic responses of living systems to pathophysiological stimuli via multivariate statistical analysis of biological NMR spectroscopic data. Xenobiotica 1999, 29, 1181–1189. [Google Scholar] [CrossRef] [PubMed]
  25. Fischer, H.P. Mathematical modeling of complex biological systems: From parts lists to understanding systems behavior. Alcohol. Res. Health 2008, 31, 49–59. [Google Scholar] [PubMed]
  26. Du, L.; Chang, T.; An, B.; Liang, M.; Deng, T.; Li, K.; Cao, S.; Du, Y.; Gao, X.; Xu, L.; et al. Transcriptomics and Lipid Metabolomics Analysis of Subcutaneous, Visceral, and Abdominal Adipose Tissues of Beef Cattle. Genes 2022, 14, 37. [Google Scholar] [CrossRef] [PubMed]
  27. Kong, Y.; Zhang, X.; Wang, Z.; Li, F.; Yue, X. Integrating lipidomics and transcriptomics to reveal the heterogeneity of sheep adipose tissues. Food Biosci. 2024, 60, 104393. [Google Scholar] [CrossRef]
  28. Meyer, S.; Gessner, D.K.; Braune, M.S.; Friedhoff, T.; Most, E.; Höring, M.; Liebisch, G.; Zorn, H.; Eder, K.; Ringseis, R. Comprehensive evaluation of the metabolic effects of insect meal from Tenebrio molitor L. in growing pigs by transcriptomics, metabolomics and lipidomics. J. Anim. Sci. Biotechnol. 2020, 11, 20. [Google Scholar] [CrossRef] [PubMed]
  29. Chen, G.; Lin, Z.; Peng, H.; Zhang, S.; Zhang, Z.; Zhang, X.; Nie, Q.; Luo, W. The transmembrane protein TMEM182 promotes fat deposition and alters metabolomics and lipidomics. Int. J. Biol. Macromol. 2024, 259 Pt 1, 129144. [Google Scholar] [CrossRef] [PubMed]
  30. Zhao, X.; Hu, H.; Lin, H.; Wang, C.; Wang, Y.; Wang, J. Muscle Transcriptome Analysis Reveals Potential Candidate Genes and Pathways Affecting Intramuscular Fat Content in Pigs. Front. Genet. 2020, 11, 877. [Google Scholar] [CrossRef] [PubMed]
  31. Zhang, Z.; Liao, Q.; Sun, Y.; Pan, T.; Liu, S.; Miao, W.; Li, Y.; Zhou, L.; Xu, G. Lipidomic and Transcriptomic Analysis of the Longissimus Muscle of Luchuan and Duroc Pigs. Front. Nutr. 2021, 8, 667622. [Google Scholar] [CrossRef] [PubMed]
  32. Bo, Q. Intramuscular Fat (IMF) Deposition Pattern and its FatMetabolism Mechanism in Yaks of Different Ages. Ph.D. Thesis, Southwest Minzu University, Chengdu, China, 2023. [Google Scholar]
  33. Peng, Q.H.; Wang, Z.S.; Tan, C.; Zhang, H.B.; Hu, Y.N.; Zou, H.W. Effects of different pomace and pulp dietary energy density on growth performance and intramuscular fat deposition relating mRNA expression in beef cattle. J. Food Agric. Environ. 2012, 10, 404–407. [Google Scholar]
  34. Smet, S.D.; Webb, E.C.; Claeys, E.; Uytterhaegen, L.; Demeyer, D.I. Effect of dietary energy and protein levels on fatty acid composition of intramuscular fat in double-muscled Belgian Blue bulls. Meat Sci. 2000, 56, 73–79. [Google Scholar] [CrossRef] [PubMed]
  35. Zhou, J.; Zhang, Y.; Wu, J.; Qiao, M.; Xu, Z.; Peng, X.; Mei, S. Proteomic and lipidomic analyses reveal saturated fatty acids, phosphatidylinositol, phosphatidylserine, and associated proteins contributing to intramuscular fat deposition. J. Proteomics 2021, 241, 104235. [Google Scholar] [CrossRef] [PubMed]
  36. Li, M.; Zhu, M.; Chai, W.; Wang, Y.; Song, Y.; Liu, B.; Cai, C.; Song, Y.; Sun, X.; Xue, P.; et al. Determination of the Heterogeneity of Intramuscular Fat and Visceral Adipose Tissue from Dezhou Donkey by Lipidomics and Transcriptomics Profiling. Front. Nutr. 2021, 8, 746684. [Google Scholar] [CrossRef] [PubMed]
  37. Ahmadian, M.; Suh, J.M.; Hah, N.; Liddle, C.; Atkins, A.R.; Downes, M.; Evans, R.M. PPARγ signaling and metabolism: The good, the bad and the future. Nat. Med. 2013, 19, 557–566. [Google Scholar] [CrossRef] [PubMed]
  38. Jeong, J.Y.; Kim, J.S.; Nguyen, T.H.; Lee, H.J.; Baik, M. Wnt/β-catenin signaling and adipogenic genes are associated with intramuscular fat content in the longissimus dorsi muscle of Korean cattle. Anim. Genet. 2013, 44, 627–635. [Google Scholar] [CrossRef] [PubMed]
  39. Hörbelt, T.; Knebel, B.; Fahlbusch, P.; Barbosa, D.; de Wiza, D.H.; Van de Velde, F.; Van Nieuwenhove, Y.; Lapauw, B.; Thoresen, G.H.; Al-Hasani, H.; et al. The adipokine sFRP4 induces insulin resistance and lipogenesis in the liver. Biochim. Biophys. Acta Mol. Basis. Dis. 2019, 1865, 2671–2684. [Google Scholar] [CrossRef] [PubMed]
  40. Cheng, F.; Liang, J.; Yang, L.; Lan, G.; Wang, L.; Wang, L. Systematic Identification and Comparison of the Expressed Profiles of lncRNAs, miRNAs, circRNAs, and mRNAs with Associated Co-Expression Networks in Pigs with Low and High Intramuscular Fat. Animals 2021, 11, 3212. [Google Scholar] [CrossRef] [PubMed]
  41. Tan, Z.; Jiang, H. Molecular and Cellular Mechanisms of Intramuscular Fat Development and Growth in Cattle. Int. J. Mol. Sci. 2024, 25, 2520. [Google Scholar] [CrossRef] [PubMed]
  42. Goszczynski, D.E.; Papaleo-Mazzucco, J.; Ripoli, M.V.; Villarreal, E.L.; Rogberg-Muñoz, A.; Mezzadra, C.A.; Melucci, L.M.; Giovambattista, G. Genetic Variation in FABP4 and Evaluation of Its Effects on Beef Cattle Fat Content. Anim. Biotechnol. 2017, 28, 211–219. [Google Scholar] [CrossRef] [PubMed]
  43. Liu, L.; Cui, H.; Dong, N.; Zhu, X.; Li, S.; Ma, X.; Niu, D. Effects of phosphatidylethanolamine on intramuscular fat deposition and key gene identification by transcriptome sequencing in broiler chickens. Poult. Sci. 2025, 104, 104914. [Google Scholar] [CrossRef] [PubMed]
  44. Pannier, L.; Mullen, A.M.; Hamill, R.M.; Stapleton, P.C.; Sweeney, T. Association analysis of single nucleotide polymorphisms in DGAT1, TG and FABP4 genes and intramuscular fat in crossbred Bos taurus cattle. Meat Sci. 2010, 85, 515–518. [Google Scholar] [CrossRef] [PubMed]
  45. Li, R.; Zhu, R.; Yang, X.; Feng, Y.; He, Q.; Wang, H.; Liu, Q.; Shi, D.; Huang, J. The role of lncFABP4 in modulating adipogenic differentiation in buffalo intramuscular preadipocytes. Anim. Sci. J. 2024, 95, e13951. [Google Scholar] [CrossRef] [PubMed]
  46. Yu, K.; Shu, G.; Yuan, F.; Zhu, X.; Gao, P.; Wang, S.; Wang, L.; Xi, Q.; Zhang, S.; Zhang, Y.; et al. Fatty acid and transcriptome profiling of longissimus dorsi muscles between pig breeds differing in meat quality. Int. J. Biol. Sci. 2013, 9, 108–118. [Google Scholar] [CrossRef] [PubMed]
  47. Sadkowski, T.; Ciecierska, A.; Majewska, A.; Oprządek, J.; Dasiewicz, K.; Ollik, M.; Wicik, Z.; Motyl, T. Transcriptional background of beef marbling—Novel genes implicated in intramuscular fat deposition. Meat Sci. 2014, 97, 32–41. [Google Scholar] [CrossRef] [PubMed]
  48. Cho, E.S.; Lee, K.T.; Choi, J.W.; Jeon, H.J.; Lee, S.W.; Cho, Y.M.; Kim, T.H. Novel SNPs in the growth arrest and DNA damage-inducible protein 45 alpha gene (GADD45A) associated with meat quality traits in Berkshire pigs. Genet. Mol. Res. 2015, 14, 8581–8588. [Google Scholar] [CrossRef] [PubMed]
  49. You, W.; Liu, S.; Ji, J.; Ling, D.; Tu, Y.; Zhou, Y.; Chen, W.; Valencak, T.G.; Wang, Y.; Shan, T. Growth arrest and DNA damage-inducible alpha regulates muscle repair and fat infiltration through ATP synthase F1 subunit alpha. J. Cachexia Sarcopenia Muscle 2023, 14, 326–341. [Google Scholar] [CrossRef] [PubMed]
  50. Wu, T.; Zhang, Z.; Yuan, Z.; Lo, L.J.; Chen, J.; Wang, Y.; Peng, J. Distinctive genes determine different intramuscular fat and muscle fiber ratios of the longissimus dorsi muscles in Jinhua and landrace pigs. PLoS ONE 2013, 8, e53181. [Google Scholar] [CrossRef] [PubMed]
  51. Bénézech, C.; Mader, E.; Desanti, G.; Khan, M.; Nakamura, K.; White, A.; Ware, C.F.; Anderson, G.; Caamaño, J.H. Lymphotoxin-β receptor signaling through NF-κB2-RelB pathway reprograms adipocyte precursors as lymph node stromal cells. Immunity 2012, 37, 721–734. [Google Scholar] [CrossRef] [PubMed]
  52. Sun, Y.M.; Qin, J.; Liu, S.G.; Cai, R.; Chen, X.C.; Wang, X.M.; Pang, W.J. PDGFRα Regulated by miR-34a and FoxO1 Promotes Adipogenesis in Porcine Intramuscular Preadipocytes through Erk Signaling Pathway. Int. J. Mol. Sci. 2017, 18, 2424. [Google Scholar] [CrossRef] [PubMed]
  53. Martins, T.S.; Sanglard, L.M.; Silva, W.; Chizzotti, M.L.; Rennó, L.N.; Serão, N.V.; Silva, F.F.; Guimarães, S.E.; Ladeira, M.M.; Dodson, M.V.; et al. Molecular Factors Underlying the Deposition of Intramuscular Fat and Collagen in Skeletal Muscle of Nellore and Angus Cattle. PLoS ONE 2015, 10, e0139943. [Google Scholar] [CrossRef] [PubMed]
  54. Blaner, W.S. Retinol-binding protein: The serum transport protein for vitamin A. Endocr. Rev. 1989, 10, 308–316. [Google Scholar] [CrossRef] [PubMed]
  55. de Jager, N.; Hudson, N.J.; Reverter, A.; Barnard, R.; Cafe, L.M.; Greenwood, P.L.; Dalrymple, B.P. Gene expression phenotypes for lipid metabolism and intramuscular fat in skeletal muscle of cattle. J. Anim. Sci. 2013, 91, 1112–1128. [Google Scholar] [CrossRef] [PubMed]
  56. Liu, Y.; Albrecht, E.; Dannenberger, D.; Hammon, H.M.; Kuehn, C.; Sauerwein, H.; Yang, R.; Zhao, Z.; Maak, S. Retinol binding protein 4 abundance in plasma and tissues is related to body fat deposition in cattle. Sci. Rep. 2019, 9, 8056. [Google Scholar] [CrossRef] [PubMed]
  57. Mao, H.; Yin, Z.; Wang, M.; Zhang, W.; Raza, S.H.A.; Althobaiti, F.; Qi, L.; Wang, J. Expression of DGAT2 Gene and Its Associations with Intramuscular Fat Content and Breast Muscle Fiber Characteristics in Domestic Pigeons (Columba livia). Front. Vet. Sci. 2022, 9, 847363. [Google Scholar] [CrossRef] [PubMed]
  58. Cui, J.X.; Zeng, Y.Q.; Wang, H.; Chen, W.; Du, J.F.; Chen, Q.M.; Hu, Y.X.; Yang, L. The effects of DGAT1 and DGAT2 mRNA expression on fat deposition in fatty and lean breeds of pig. Livest. Sci. 2011, 140, 292–296. [Google Scholar] [CrossRef]
  59. Wang, H.; Wang, J.; Yang, D.D.; Liu, Z.L.; Zeng, Y.Q.; Chen, W. Expression of lipid metabolism genes provides new insights into intramuscular fat deposition in Laiwu pigs. Asian-Australas. J. Anim. Sci. 2020, 33, 390–397. [Google Scholar] [CrossRef] [PubMed]
  60. Jeong, J.; Kwon, E.G.; Im, S.K.; Seo, K.S.; Baik, M. Expression of fat deposition and fat removal genes is associated with intramuscular fat content in longissimus dorsi muscle of Korean cattle steers. J. Anim. Sci. 2012, 90, 2044–2053. [Google Scholar] [CrossRef] [PubMed]
  61. Hu, J.; Shi, B.; Xie, J.; Zhou, H.; Wang, J.; Liu, X.; Li, S.; Zhao, Z.; Luo, Y. Tissue Expression and Variation of the DGAT2 Gene and Its Effect on Carcass and Meat Quality Traits in Yak. Animals 2019, 9, 61. [Google Scholar] [CrossRef] [PubMed]
  62. Yang, C.; Li, Q.; Lin, Y.; Wang, Y.; Shi, H.; Xiang, H.; Zhu, J. Diacylglycerol acyltransferase 2 promotes the adipogenesis of intramuscular preadipocytes in goat. Anim. Biotechnol. 2023, 34, 2376–2383. [Google Scholar] [CrossRef] [PubMed]
  63. Nian, Z.; Sun, Z.; Yu, L.; Toh, S.Y.; Sang, J.; Li, P. Fat-specific protein 27 undergoes ubiquitin-dependent degradation regulated by triacylglycerol synthesis and lipid droplet formation. J. Biol. Chem. 2010, 285, 9604–9615. [Google Scholar] [CrossRef] [PubMed]
Figure 1. Histological analysis of the LD. hematoxylin–eosin staining of longitudinal sections of the longissimus dorsal muscle of yaks in groups G (a), Z (b), C (c). (d) Myofiber diameters of the LD of yaks in groups G, Z, C. Different letter marks indicate significant differences (p < 0.01).
Biomolecules 15 01025 g001
Figure 2. (a) PCA score plot showing lipid profiles in yak dorsal muscle across dietary energy groups (C: green, Z: blue, G: orange). (b) OPLS-DA permutation test results with overall sample scores; R2 (R-squared), Q2 (Q-squared). (c) Thermograms depicting lipid variations in yak muscle, where red and blue represent increased and decreased SDL concentrations, respectively.
Biomolecules 15 01025 g002
Figure 3. (a) Heatmap of differentially expressed genes in the longissimus dorsal muscle of yaks in groups C and Z, (b) PCA score plot of differentially expressed genes in yak dorsal muscle across dietary energy levels. (c) Heatmap showing gene expression differences between groups C and G. (d) Comparison of log2FC values for eight DEGs (COL11A2, HOXC10, FN1, FBN1, AGT, FOS, SCD, SLC27A6) between qPCR and mRNA-Seq results.
Biomolecules 15 01025 g003
Figure 4. (a) Heatmap displaying the top 30 lipids and DEGs in yak dorsal muscle (groups C vs. Z). Red/blue indicate positive/negative correlations (“*” indicates that the correlation p-value is <0.05, “**” indicates that the correlation p-value is <0.01, and “***” indicates that the correlation p-value is <0.001.). (b) Network diagram of the top 20 lipids and differentially expressed genes in the longissimus dorsal muscle of yaks in group C vs. Z. Node shape, size, and color indicate the histological type, connectivity size, and corresponding degree of difference, respectively; and node color from red to blue corresponds to log2FoldChange from positive to negative. (c) Heatmap of the top 30 lipids and differentially expressed genes in the longissimus dorsal muscle of yaks from groups C and G. (d) Network diagram of the top 20 lipids and differentially expressed genes in the longissimus dorsal muscle of yaks in group C vs. G.
Biomolecules 15 01025 g004
Figure 5. (a) Correlation heatmap of intramuscular fat content, DEGs and SDLs in yak dorsal muscle (groups C vs. Z). Red/blue indicate positive/negative correlations (“*” indicates that the correlation p-value is <0.05, “**” indicates that the correlation p-value is <0.01. (b) Corresponding analysis for groups C vs. G.
Biomolecules 15 01025 g005
Table 1. Pamir yak fattening concentrate feed formula table (DM).
ItemLow Energy Supply (C)Medium Energy Supply (Z)High Energy Supply (G)
Ingredient (%)
Corn37.459.568.8
46 Cotton meal09.210
43 Soybean meal012.113
Soybean Oil001.2
Bran (especially wheat)7.611.72
Syrup02.50
Premix ②555
Total100.00100.00100.00
Nutrient Level ①
Crude protein (%)9.9519.3819.17
Net energy of weight Gain (MJ/Kg)0.751.381.53
Note: ① Crude protein level is measured value (Kjeldahl method), and net weight gain energy is theoretical calculated value. ② Each kilogram of premix contains Fe 2500 mg, Zn 1000 mg, Cu 1000 mg, Mn 1000 mg, Se 7.5 mg, I 20 mg, Vitamin A 300,000 IU, Vitamin D 5000 IU, Vitamin E 4000 IU.
Table 2. Primer sequences.
GenePrimer Sequences (5′–3′)Annealing Temperature (°C)
COL11A2F: ACCACCAAGACTTCACAGGC
R: GGGGTGGGGTCCTGATAAT
60.3
HOXC10F: CGACAACGAAGCAAAAGAGGAG
R: TCCAGCGTCTGGTGTTTAGT
60.3
FN1F: CCCTGGTGTCACAGAAGCTA
R: CTGGGGGAGCTCATCTGTCTT
60.3
FBN1F: TGGCTCCAGATCCATCCAACA
R: CCTTTCTGGCACAGACAGTGA
60.3
AGTF: GACCCAAATCTCGCTGCTGA
R: GAAGCCCCTCATCTTTCCTTGG
60.3
FOSF: AGGGGCAAGGTAGAACAGTTG
R: CTAGTTGGTCTGTCTCCGCTT
60.3
SCDF: TCCCGACGTGGCTTTTTCTT
R: CACCAGGTTTGTAGTACCTCCT
60.3
SLC27A6F: TGTGGTTGTGCCAGGTTATGA
R: AAAACTGTGGACGAGCGTAAG
60.3
β-actinF: GCAGGTCATCACCATCGG
R: CCGTGTTGGCGTAGAGGT
60.3
Table 3. Determination of meat quality traits in yaks fed diets with different energy levels.
ItemGroup CGroup ZGroup G
pH*45min6.99 ± 0.00 a6.7 ± 0.02 b5.49 ± 0.03 c
L*45min9.25 ± 0.03 c9.48 ± 0.02 a9.32 ± 0.04 b
a*45min20.78 ± 0.03 c21.31 ± 0.22 b21.70 ± 0.11 a
b*45min3.39 ± 0.03 c3.54 ± 0.02 b3.82 ± 0.03 a
pH*24h6.42 ± 0.02 a5.64 ± 0.03 b5.28 ± 0.02 c
L*24h9.78 ± 0.06 b10.75 ± 0.10 a10.79 ± 0.05 a
a*24h21.39 ± 0.13 b21.51 ± 0.07 b23.49 ± 0.02 a
b*24h4.50 ± 0.12 b3.95 ± 0.06 c4.77 ± 0.00 a
Steaming loss (%)30.42 ± 1.1529.71 ± 2.9827.67 ± 2.86
Shearing force (kg f)100.90 ± 0.61 a98.27 ± 1.78 a83.69 ± 1.89 b
Intramuscular fat (g/100 g)0.97 ± 0.02 b1.25 ± 0.07 b2.04 ± 0.42 a
Note: Different lowercase letters marked in the table indicate significant differences (p < 0.05).
Disclaimer/Publisher’s Note: The statements, opinions and data contained in all publications are solely those of the individual author(s) and contributor(s) and not of MDPI and/or the editor(s). MDPI and/or the editor(s) disclaim responsibility for any injury to people or property resulting from any ideas, methods, instructions or products referred to in the content.

