Article

Targeting Sodium Transport Reveals CHP1 Downregulation as a Novel Molecular Feature of Malignant Progression in Clear Cell Renal Cell Carcinoma: Insights from Integrated Multi-Omics Analyses

by
Yun Wu
1,†,
Ri-Ting Zhu
1,2,†,
Jia-Ru Chen
1,2,
Xiao-Min Liu
1,2,
Guo-Liang Huang
1,
Jin-Cheng Zeng
1,3,
Hong-Bing Yu
1,
Xin Liu
4,* and
Cui-Fang Han
1,*
1
Guangdong Provincial Key Laboratory of Medical Immunology and Molecular Diagnostics, Guangdong Medical University, Dongguan 523808, China
2
School of Pharmacy, Guangdong Medical University, Dongguan 523808, China
3
Dongguan Key Laboratory of Medical Bioactive Molecular Developmental and Translational Research, Guangdong Medical University, Dongguan 523808, China
4
Dongguan Key Laboratory of Public Health Laboratory Science, School of Public Health, Guangdong Medical University, Dongguan 523808, China
*
Authors to whom correspondence should be addressed.
These authors contributed equally to this work.
Biomolecules 2025, 15(7), 1019; https://doi.org/10.3390/biom15071019
Submission received: 24 April 2025 / Revised: 27 June 2025 / Accepted: 11 July 2025 / Published: 15 July 2025
(This article belongs to the Section Bioinformatics and Systems Biology)

Abstract

Clear cell renal cell carcinoma (ccRCC), the most common RCC subtype, displays significant intratumoral heterogeneity driven by metabolic reprogramming, which complicates our understanding of disease progression and limits treatment efficacy. This study aimed to construct a comprehensive cellular and transcriptional landscape of ccRCC, with emphasis on gene expression dynamics during malignant progression. An integrated analysis of 90 scRNA-seq samples comprising 534,227 cells revealed a progressive downregulation of sodium ion transport-related genes, particularly CHP1 (calcineurin B homologous protein isoform 1), which is predominantly expressed in epithelial cells. Reduced CHP1 expression was confirmed at both mRNA and protein levels using bulk RNA-seq, CPTAC proteomics, immunohistochemistry, and ccRCC cell lines. Survival analysis showed that high CHP1 expression correlated with improved prognosis. Functional analyses, including pseudotime trajectory, Mfuzz clustering, and cell–cell communication modeling, indicated that CHP1+ epithelial cells engage in immune interaction via PPIA–BSG signaling. Transcriptomic profiling and molecular docking suggested that CHP1 modulates amino acid transport through SLC38A1. ZNF460 was identified as a potential transcription factor of CHP1. Virtual screening identified arbutin and imatinib mesylate as candidate CHP1-targeting compounds. These findings establish CHP1 downregulation as a novel molecular feature of ccRCC progression and support its utility as a prognostic biomarker.

1. Introduction

Cancer remains a leading cause of premature death and poses a major threat to global public health, with profound social and economic consequences [1]. According to the 2022 GLOBOCAN report, approximately 20 million new cancer cases and 10 million cancer-related deaths were recorded worldwide, with projections indicating a rise to over 35 million new cases annually by 2050 due to population growth and aging. In China, lung, colorectal, thyroid, liver, and gastric cancers are the most prevalent, whereas kidney cancer was ranked as the tenth most commonly diagnosed malignancy among men in 2022. Renal cell carcinoma (RCC), originating from renal tubular epithelial cells, accounts for the majority of kidney cancers and is increasing in incidence by 1.5% annually [2,3]. Among its subtypes, ccRCC is the most common, comprising 65–70% of RCC cases, and is characterized by a high degree of aggressiveness and recurrence [4]. Genetically, ccRCC is frequently marked by deletions of chromosome 3p and loss-of-function mutations in the Von Hippel–Lindau (VHL) gene, which occur in over 90% of cases [5].
VHL mutations are early molecular events in ccRCC and result in the stabilization of hypoxia-inducible factors HIF-1α and HIF-1β, creating a pseudohypoxic state that promotes glycolysis and enhances fatty acid and glycogen biosynthesis. This metabolic reprogramming leads to a lactate-rich microenvironment and widespread intracellular accumulation of cholesterol and other lipids within lipid droplets (LDs). These LDs not only store energy but also regulate lipid uptake, membrane biogenesis, and redox balance, all of which facilitate tumor growth. Immune checkpoint inhibitors (ICIs), particularly those targeting programmed death protein 1 (PD-1) and cytotoxic T-lymphocyte-associated antigen-4 (CTLA-4), such as nivolumab and ipilimumab, have improved clinical outcomes and are now first-line treatments for ccRCC [6,7,8]. However, resistance and relapse remain significant challenges.
Calcineurin B homologous proteins (CHPs) are regulatory cofactors of Na+/H+ exchangers (NHEs), which maintain intracellular pH homeostasis and influence tumor proliferation, invasion, and apoptosis [9]. Among the three CHP isoforms—CHP1, CHP2, and CHP3—CHP1 was first identified as an essential cofactor for sodium/proton exchanger 1 (NHE1) [10]. Encoded on chromosome 15q15.1, CHP1 is ubiquitously expressed and enhances NHE1 activity through direct binding and glycosylation [11]. CHP1 also interacts with glycerol-3-phosphate acyltransferase-4 (GPAT4), facilitating triglyceride synthesis and endoplasmic reticulum function [12]. These roles underscore the importance of CHP1 in energy storage, membrane formation, and possibly tumor biology. Additionally, altered CHP1 expression has been associated with neurological disorders such as autosomal recessive spinal muscular atrophy (SMA) [13]. CHP2 functions as a tumor-associated antigen in several cancers and was initially identified in hepatocellular carcinoma as HCA520 [14]. CHP3, also known as Tescalcin, is primarily expressed in the heart, brain, and kidneys and has been linked to tissue differentiation [15].
scRNA-seq has revolutionized cancer research by enabling high-resolution transcriptomic profiling at the cellular level. scRNA-seq has been used to reveal cellular heterogeneity, uncover novel cell subpopulations, and facilitate the exploration of the tumor microenvironment (TME), cell–cell communication, and lineage differentiation. When integrated with multi-omics technologies, scRNA-seq provides deeper insights into gene regulation, protein expression, metabolic states, and chromatin structure [16]. These capabilities make scRNA-seq a powerful tool for understanding tumorigenesis, identifying biomarkers, and developing personalized therapies.
Several recent studies have applied scRNA-seq to ccRCC. Alchahin et al. identified a malignant cell cluster enriched in SAA1, SAA2, and APOL1, which correlated with poor survival and metastasis, while cell interaction analyses implicated the CXCL9/CXCL10–CXCR3 and CD70–CD27 axes as therapeutic targets [17]. Another study integrating scRNA-seq, single-cell assay for transposase-accessible chromatin sequencing (scATAC-seq), and WES identified subtype-specific regulatory features that promoted invasion and migration [18]. Zvirblyte et al. characterized a novel vascular cell subpopulation associated with the epithelial–mesenchymal transition (EMT) and poor survival, highlighting clinically relevant stromal–immune interactions [19]. Zhang et al. discovered PDGFR-β+GPR91+ pericytes as a methionine source for cancer stem cells, driving resistance to tyrosine kinase inhibitors (TKIs). Targeting these cells reduced methionine levels, depleted cancer stem cells (CSCs), and enhanced TKI efficacy [20].
Beyond discovery, scRNA-seq has become integral to drug development. It enables cellular-level target identification, supports biomarker discovery and patient stratification, and aids in understanding drug mechanisms and resistance [21]. With advances in multi-omics integration, decreasing costs, and enhanced computational tools, scRNA-seq is expected to play an increasingly central role in personalized medicine.
Although CHP1 has been implicated in multiple physiological processes, its role in cancer, particularly in ccRCC, remains largely unexplored. Therefore, this study aimed to investigate the expression dynamics, functional role, and molecular mechanism of CHP1 in ccRCC using scRNA-seq, offering new insights into both tumor biology and potential therapeutic strategies.

2. Materials and Methods

2.1. Collection of Single-Cell Transcriptomic Data

Four scRNA-seq datasets were obtained and curated for this study: GSE178481 [17], GSE207493 [18], and GSE242299 [19] from the Gene Expression Omnibus (GEO) (accessed on 28 August 2024), and PRJNA917036 [20] from the Sequence Read Archive (SRA) (accessed on 28 August 2024). These datasets comprised a total of 64 primary ccRCC samples and 26 adjacent normal kidney samples. Additionally, one spatial transcriptomic dataset (GSE175540) derived from ccRCC tissues [22] was retrieved from GEO (accessed on 10 November 2024) for spatial gene expression analysis.

2.2. Preprocessing of scRNA-Seq Data

Initial scRNA-seq data processing was conducted using the Scanpy package (v1.10.3) in Python (v3.8.2) [23], following established protocols (https://scanpy.readthedocs.io/en/stable/tutorials/basics/clustering-2017.html, accessed on 6 September 2024). Low-quality cells and genes were excluded based on the following criteria: genes must be expressed in ≥3 cells, cells must express ≥200 genes, and cells with <500 total transcripts or >20% mitochondrial content were removed. To further enhance data quality, Scrublet was used to detect and exclude doublets and red blood cells [24]. Following quality control, total transcript counts were normalized using the normalize_total function and log-transformed with log1p. Highly variable genes (n = 2000) were selected using highly_variable_genes for downstream analyses. Dimensionality reduction was performed using PCA (sc.tl.pca, sc.pl.pca), retaining the top 50 principal components (PCs). To correct for batch effects across samples, the harmony_integrate function was applied [25]. Cell–cell similarities were computed with the neighbors function, and clustering was conducted using the Leiden algorithm with a resolution of 0.4. For visualization, UMAP was employed (umap function) [26]. After preprocessing, the integrated dataset comprised 534,227 cells, including 447,929 tumor cells and 86,298 adjacent normal cells.

2.3. Cell Subtype Annotation

Cell clusters were annotated based on Leiden clustering results [27] using canonical marker genes referenced from the CellMarker database (v2.0; http://bio-bigdata.hrbmu.edu.cn/CellMarker, accessed on 6 September 2024) [28]. Marker gene expression patterns were visualized using the dotplot function to depict the distribution of cell subtypes in low-dimensional space.

2.4. Mfuzz-Based Expression Pattern Clustering and Functional Enrichment Analysis

To explore dynamic transcriptional changes during tumor progression, the expression profiles of epithelial cells were extracted. Genes missing in more than 25% of cells were excluded. The average gene expression across WHO/ISUP tumor grades was calculated and standardized using the standardize function from the datawizard package. Time-series clustering was then performed using the Mfuzz algorithm (v2.66.0) [29], which grouped genes into 10 clusters based on shared expression trends. Enrichment was performed using the enrichGO function from the clusterProfiler package (v4.14.4) [30,31]. The cnetplot and dotplot functions from the enrichplot package were used for visualization.

2.5. Chromosomal Copy Number Variation (CNV) Analysis

Chromosomal CNV inference was performed using the inferCNVpy package (v0.6.0). Gene position annotations were sourced from GENCODE (https://www.gencodegenes.org/human/, accessed on 30 September 2024) [32]. Reference cell types were derived from adjacent normal tissues. CNV profiles were generated by comparing the average gene expression in epithelial cells with that of the reference populations, grouped by chromosomal location. The CNV analysis identified 62,235 tumor cells and 42,802 non-malignant epithelial cells. UMAP plots were used to visualize these subpopulations and to map gene expression patterns associated with key biological processes. Heatmaps were generated to illustrate CNV intensity across chromosomal segments and to visualize the expression of CHP1 across different tumor grades.

2.6. Public Database Analysis of CHP1 Expression

Transcriptomic and clinical data for ccRCC patients were obtained from The Cancer Genome Atlas − Kidney Renal Clear Cell Carcinoma (TCGA − KIRC) cohort via the TCGA portal (https://portal.gdc.cancer.gov/, accessed on 28 August 2024). CHP1 expression levels were compared between 542 tumor samples and 72 adjacent normal tissues using Student’s t-test. After removing duplicates and incomplete records, a refined dataset of 495 tumor samples and 33 normal tissues was used for subsequent analysis. Protein expression of CHP1 was assessed using UALCAN (https://ualcan.path.uab.edu/index.html, accessed on 10 October 2024) [33], which integrates TCGA and clinical proteomic tumor analysis consortium (CPTAC) proteomic datasets. This analysis validated transcript-level findings and offered additional clinical relevance.

2.7. Immunohistochemistry

To assess protein-level expression of CHP1, immunohistochemical (IHC) staining was performed on a tissue microarray (ZLKIC1601, Wellbio, Shanghai, China) containing 80 ccRCC samples and 80 matched adjacent normal tissues. The sections were stained using an anti-CHP1 antibody (1:200 dilution; GTX113936, GeneTex, Irvine, CA, USA). Clinical variables, including sex, age, tumor size, grade, and TNM staging, were available for correlation analysis. The study protocol was approved by the Ethics Committee of Shanghai ZuoLi Biotechnology Co., Ltd. (Approval No. LLSM-15-01, Shanghai, China). IHC images were quantified using Visiopharm software (Version 2023 01.2.13695, Visiopharm, Hoersholm, Denmark), and H-scores were computed to reflect staining intensity and the proportion of CHP1-positive cells [34].

2.8. Cell Culture and Western Blotting

HEK293T, human renal tubular epithelial cells (HK-2), and ccRCC cell lines (769-P, A498, Caki-1, and 786-O) were cultured under standard conditions. HEK293T, HK-2, and A498 cells were maintained in DMEM; 769-P and 786-O in RPMI-1640; and Caki-1 in McCoy’s 5A medium. Total protein was extracted using a commercial kit (Takara, Otsu, Japan), and concentration was measured using the BCA method. Western blotting was performed using anti-CHP1 (1:1000, GTX113936, GeneTex, Irvine, CA, USA), anti-FLAG (1:2000, 80801-2-RR, Proteintech, Rosemont, IL, USA), anti-SLC38A1 (1:1000, 28632-1-AP, Proteintech, Rosemont, IL, USA), and anti-β-actin (1:2000, T0022, Affinity Biosciences, Cincinnati, OH, USA) antibodies. HEK293T, HK-2, 769-P, A498, and Caki-1 cells were purchased from Fenghui Biotech Co., Ltd. (Hunan, China), and 786-O cells were purchased from Pricella Biotechnology Co., Ltd. (Wuhan, China) with an STR report.

2.9. Prognostic Analysis of CHP1 in ccRCC Patients

To assess the prognostic relevance of CHP1, patients from the TCGA-KIRC cohort were stratified into high- and low-expression groups based on the median CHP1 mRNA level (CHP1-High: n = 248; CHP1-Low: n = 247). Kaplan–Meier (KM) survival analysis was conducted using the survfit function from the survival package (v3.5-5), with plots generated by using ggsurvplot from the survminer package (v0.4.9). Univariate and multivariate Cox proportional hazards models were constructed using the coxph function (survival v3.5.5), and forest plots displaying hazard ratios (HRs), 95% confidence intervals (CIs), and p-values were generated with the forestplot package (v3.1.1). A prognostic nomogram predicting OS probabilities was developed using the nomogram function in the rms package (v6.7.0).

2.10. Pseudotime Trajectory Analysis

The Monocle2 package was used to reconstruct differentiation trajectories of malignant cells [35]. Before analysis, expression data were normalized, denoised, and scaled, and low-quality cells and low-variance genes were removed. A Monocle object was created using the newCellDataSet function. Dimensionality reduction was then conducted with reduceDimension, followed by cell ordering using orderCells. The developmental trajectories of tumor cells were visualized with plot_cell_trajectory, illustrating transitions between distinct cellular states.

2.11. CNV Burden Analysis

We first applied the inferCNV algorithm (https://github.com/broadinstitute/inferCNV, accessed on 13 June 2025) to establish a reference set comprising B cells, T cells, NK cells, macrophages, and endothelial cells from the tumor microenvironment, all of which lacked large-scale copy number variations (CNVs). Based on this reference, we computed a cell-by-gene CNV matrix to quantify CNV levels across individual cells. Using this matrix as a baseline, we calculated a CNV score for each cell. To investigate the relationship between CNV burden and CHP1 expression, we then performed Pearson correlation analysis between CNV scores and CHP1 expression levels.

2.12. Cell–Cell Communication Analysis

Epithelial cells were divided into CHP1-negative (CHP1neg, n = 75,182) and CHP1-positive (CHP1pos, n = 29,855) populations based on CHP1 expression. The CellChat package (v2.1.0) was used to infer communication pathways between CHP1pos/CHP1neg epithelial cells and six other cell types. CellChat identifies biologically significant signaling interactions at the cell subtype level, with a focus on ligand–receptor (L–R) pairs [36]. Both incoming and outgoing signals were inferred, and L–R interaction networks were visualized using the netVisual_heatmap and netVisual_bubble functions.

2.13. Spatial Co-Localization Analysis

To estimate the spatial distribution of cell types, deconvolution analysis was performed on the spatial transcriptomic dataset GSE175540 [22] using the Tangram package (v0.4.0) [37]. Tangram integrates scRNA-seq data to predict cell-type proportions and assign scores to each spatial spot based on transcriptomic similarity. Gene–gene expression correlations were further assessed in spatial coordinates. To visualize gene expression density, smoothed spatial distributions were generated using the KernelDensity function from scikit-learn (v1.6.1) [38]. Pearson correlation analysis was applied to evaluate the spatial co-expression of gene pairs. For each sample, smoothed spatial expression values were used to compute correlation coefficients (r) and corresponding p-values using the pearsonr function from the scipy package (v1.14.1) [39]. This analysis identified spatially co-expressed or functionally associated gene pairs within the tissue microenvironment.

2.14. Differential Gene Expression Analysis

CHP1 expression was used to stratify tumor cells into CHP1neg (n = 46,442) and CHP1pos (n = 15,793) groups. Differentially expressed genes (DEGs) between the two groups were identified using the FindMarkers function in Seurat (v5.0.1) [40], with a threshold of p < 0.05 and a log fold change (logFC) > 0. The identified DEGs were subjected to gene set enrichment analysis (GSEA) to explore associated biological pathways.

2.15. Protein–Protein Interaction Analysis

To investigate potential interactions between CHP1 and amino acid transporters (AATs), 59 AATs were selected as target proteins [41]. Preliminary screening of protein–protein interaction predictions using AlphaFold3 was performed, with ipTM thresholds greater than 0.6 and predicted template modeling score (pTM) greater than 0.5 (https://alphafoldserver.com/, accessed on 15 December 2024) [42]. Three-dimensional (3D) crystal structures of CHP1 and SLC38A1 were retrieved from the UniProt database (https://www.uniprot.org/, accessed on 26 December 2024) [43]. Protein–protein docking was performed using the HDOCK server (http://hdock.phys.hust.edu.cn/, accessed on 26 December 2024) [44], a hybrid algorithm combining template-based and ab initio strategies. Docking results were visualized using PyMOL [45]. Docking strength was assessed using the docking scores and confidence scores, with lower docking scores and confidence scores > 0.7 indicating stronger binding potential. The model with the lowest predicted binding energy was selected for further analysis. Non-covalent interaction types between CHP1 and SLC38A1 were evaluated using the PLIP platform [46].

2.16. Plasmids and Cell Transfection

The coding sequences (CDSs) of human CHP1 were cloned into expression plasmid pEnCMV-Flag vector, which was purchased from Miaoling Bio (Wuhan, China). The pEnCMV-Flag-CHP1 fusion expression plasmid was successfully obtained. HEK293T cells were purchased from the Fenghui Biotech Co., Ltd. (Hunan, China) and cultured under standard conditions. Cells were transfected with indicated plasmids using Lipofectamine 3000 (Invitrogen, Carlsbad, CA, USA) according to the manufacturer’s protocol.

2.17. Co-Immunoprecipitation Analysis

Forty-eight hours after being transfected with the indicated constructs, HEK293T cells were extracted by TNE buffer (10 mm Tris, pH 8.0, 150 mm NaCl, 1 mm EDTA, 1% NP-40, 10% glycerol with protease inhibitors). Lysates were clarified by centrifugation at 14,000× g for 15 min at 4 °C. After centrifugation, the soluble supernatants were incubated with anti-FLAG magnetic beads (Thermo Fisher Scientific, Waltham, MA, USA) overnight at 4 °C. The beads were then washed three times with TNE buffer, eluted by boiling in sample buffer for SDS-PAGE, and at last, subjected to immunoblotting to analyze the indicated antibodies.

2.18. Transcription Factor Prediction

Potential transcription factor binding sites in the target gene promoter were predicted using JASPAR (https://jaspar.elixir.no/, accessed on 12 June 2025) with default parameters [47].

2.19. Dual-Luciferase Reporter Gene Assay

A dual-luciferase reporter gene assay was performed to investigate the effect of ZNF460 on the promoter activity of CHP1. The luciferase reporter plasmids containing the CHP1 promoter region wild-type (CHP1-WT) and deletion mutant (deletion sequence: GCCTCAGCCTCCCGAG, CHP1-MUT) sequences were constructed and synthesized by Miaoling Bio (Wuhan, China). HEK293T cells were co-transfected with these plasmids, and the luciferase assays were performed after transfection for 48 h by using a Dual-Luciferase Reporter Gene Assay Kit (Promega, Madison, WI, USA).

2.20. Virtual Screening and Molecular Docking of FDA-Approved Drugs

Virtual screening was performed to identify potential FDA-approved compounds targeting CHP1. The crystal structure of CHP1 (PDB ID: 7X2U) was retrieved from the RCSB Protein Data Bank (https://www.rcsb.org/, accessed on 20 December 2024) and processed using the “Protein Preparation Wizard” in Schrödinger Maestro (v12.8). The preparation steps included retention of chain C, hydrogen addition, and energy minimization using the OPLS2005 force field (RMSD = 0.30 Å).
Binding pocket prediction was performed using the “sitemap” module, defining a grid box (20 Å × 20 Å × 20 Å) centered on Site1 (GLN77/ALA69/ASP64/HIE116). A total of 3400 compounds were downloaded from the FDA drug database (https://www.accessdata.fda.gov/scripts/cder/daf/, accessed on 20 December 2024), processed via the “LigPrep” module to generate optimized 3D conformations, and screened using the “Glide” module [48]. High-throughput virtual screening (HTVS) was followed by standard precision (SP) and extra precision (XP) docking. The top 20% of compounds at each stage advanced to the next. The docking results were visualized using PyMOL (v2.5).

2.21. Molecular Dynamics Simulation

Molecular dynamics (MD) simulations were performed using GROMACS 2022 (version 2022.6, the source code of which is available at Zenodo (URL: https://zenodo.org/records/8134375, accessed on 11 May 2025). Force field parameters were obtained using the pdb2gmx tool and the AutoFF web server. The receptor protein was parameterized using the CHARMM36 force field, while ligand parameters were generated with the CGenFF force field [49]. The system was solvated in a TIP3P cubic water box with a 1 nm buffer in all directions and neutralized by adding counterions via the gmx genion tool [50]. Long-range electrostatic interactions were treated using the Particle Mesh Ewald (PME) method with a 1.0 nm cutoff. All covalent bonds were constrained using the SHAKE algorithm, and integration was carried out using the Verlet leapfrog algorithm with a 1 fs time step. Key structural and dynamic properties were analyzed throughout the simulation. These included root-mean-square deviation (RMSD), root-mean-square fluctuation (RMSF), hydrogen bonding, radius of gyration (Rg), and solvent-accessible surface area (SASA).

2.22. Statistical Analysis

Statistical analyses were conducted using Python (v3.8.2), R (v4.3.3), and their associated packages. For normally distributed data, results were presented as mean ± standard deviation and compared using Student’s t-test. For non-normally distributed data, medians and interquartile ranges were reported and compared using the Wilcoxon rank-sum test. One-way ANOVA was used to compare means among multiple groups.
Survival analyses were conducted using KM curves, with significance evaluated via the log-rank test. H-score comparisons were performed using GraphPad Prism (v10.12). Pearson and Spearman correlation coefficients were computed using pearsonr and spearmanr from the scipy package (v1.14.1), respectively. All tests were two-sided, with p < 0.05 considered statistically significant.

3. Results

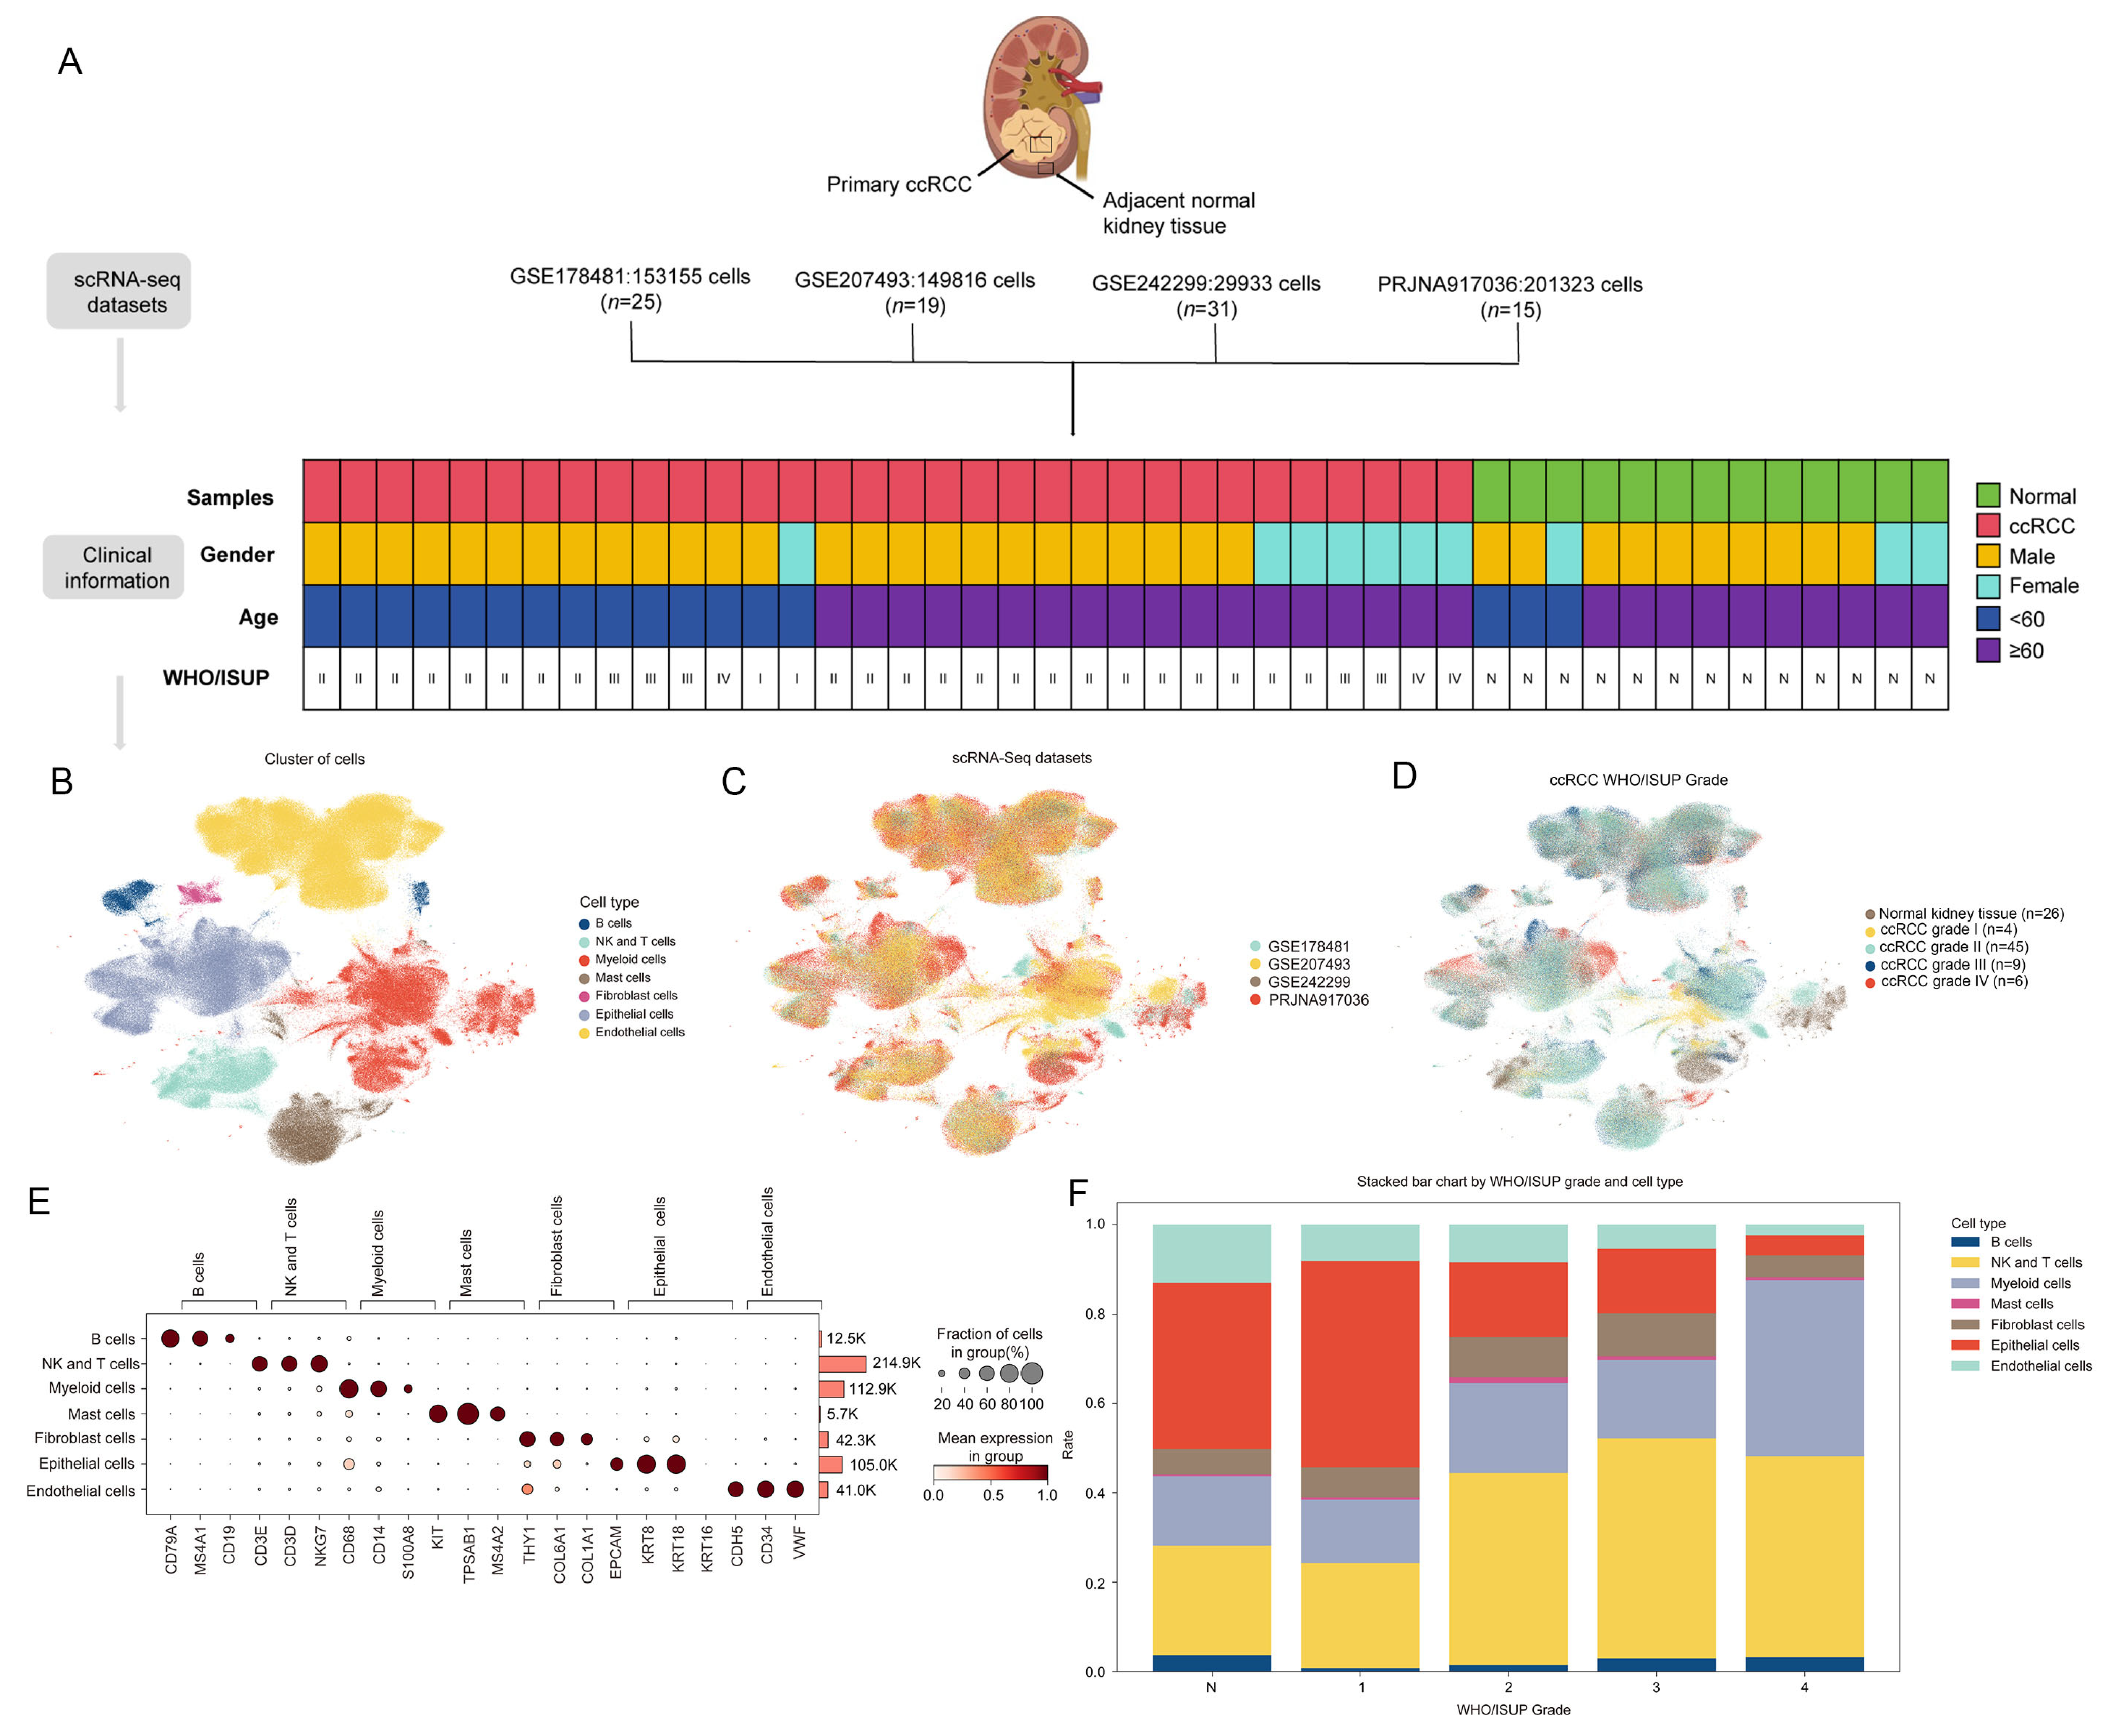
3.1. Cellular Atlas of ccRCC

To construct a comprehensive single-cell landscape of ccRCC, we integrated four scRNA-seq datasets: GSE178481 (153,155 cells; n = 25), GSE207493 (149,816 cells; n = 19), GSE242299 (29,933 cells; n = 31), and PRJNA917036 (201,323 cells; n = 15), comprising 64 primary tumor samples and 26 matched adjacent normal kidney tissues (Figure 1A). In total, 534,227 cells were analyzed, including 447,929 tumor cells and 86,298 adjacent normal cells. Based on canonical marker genes, we identified seven major cell types: B cells (CD79A, MS4A1, CD19), endothelial cells (CDH5, CD34, VWF), epithelial cells (EPCAM, KRT8, KRT18, KRT16), fibroblasts (THY1, COL6A1, COL1A1), mast cells (KIT, TPSAB1, MS4A2), myeloid cells (CD68, CD14, S100A8), and NK and T cells (CD3E, CD3D, NKG7) (Figure 1B).
The distribution of the datasets and tumor grades was visualized using UMAP (Figure 1C,D). The dot plots display the expression of representative marker genes across cell subtypes (Figure 1E), and the bar plots illustrate the relative abundance of each cell type across WHO/ISUP grades (Figure 1F). Notably, the proportion of epithelial cells decreased progressively with increasing tumor grade, suggesting a potential link between epithelial depletion and malignant progression.

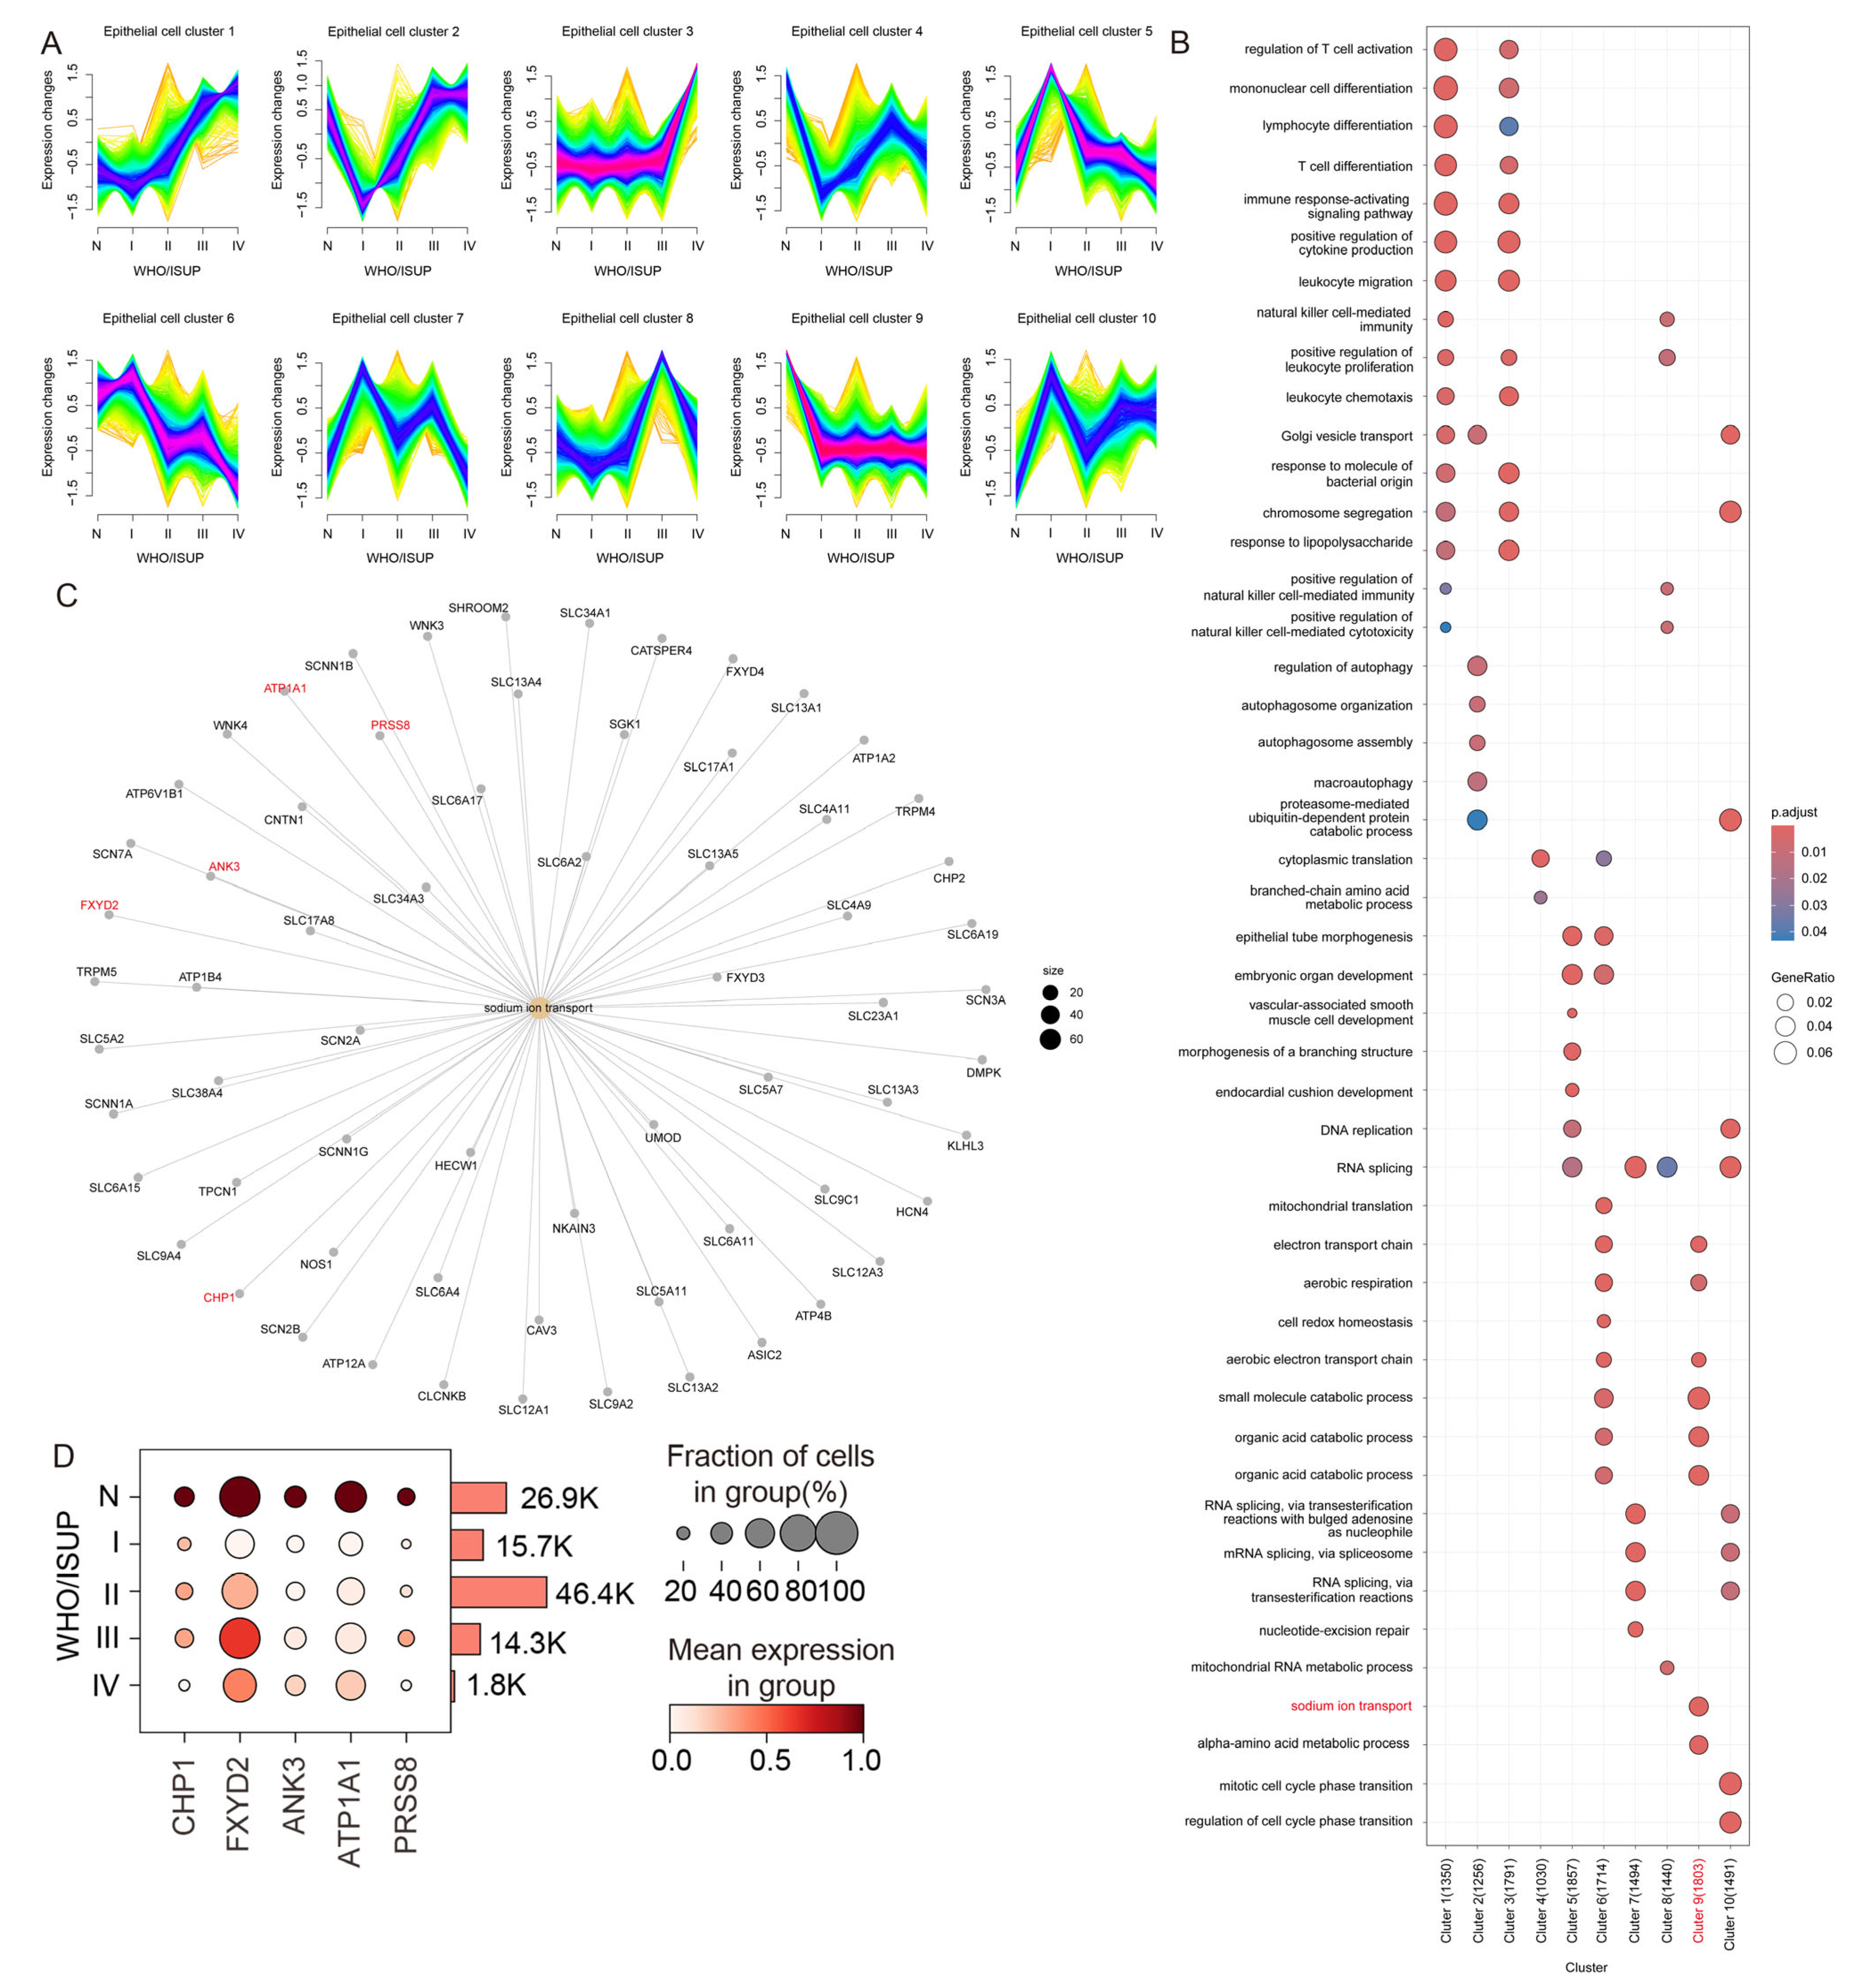
3.2. Gene Expression Profiling of Epithelial Subpopulations During ccRCC Progression

To analyze gene expression changes during the malignant progression of ccRCC, epithelial cells were selected for further investigation. Based on the gene expression patterns across WHO/ISUP grades, these cells were stratified using the Mfuzz algorithm, which identified ten distinct clusters (Figure 2A). Among them, Clusters 1 and 3 were characterized by increased expression during tumor progression, whereas Clusters 6 and 9 displayed downregulated gene expression.
To understand the biological functions associated with each cluster, GO enrichment analysis was performed. Interestingly, genes involved in sodium ion transport were significantly enriched only in Cluster 9 (Figure 2B). Considering the kidney’s essential role in electrolyte balance and acid–base regulation, this pathway was prioritized for further analysis. A pathway–gene interaction network revealed sixty-four genes associated with sodium ion transport, of which five—CHP1, FXYD2, ANK3, ATP1A1, and PRSS8—were expressed in over 10% of epithelial cells (Figure 2C). All five genes were found to be significantly downregulated in ccRCC tissues (Figure 2D).

3.3. Sodium Ion Transport-Related Genes Are Significantly Downregulated in Malignant Tumor Cells

To distinguish malignant from non-malignant epithelial cells, chromosomal CNV analysis was performed using the remaining seven cell types as reference populations. The CNV heatmaps reveal extensive genomic alterations in malignant cells, including a prominent loss of chromosome 3 and gains in chromosomes 5, 7, and 12 (Figure 3A), which is consistent with known early events in ccRCC pathogenesis; in particular, chromosome 3p deletions were present in over 90% of cases.
A total of 62,235 tumor cells and 42,802 non-malignant epithelial cells were mapped on a UMAP plot (Figure 3B). Their distribution across WHO/ISUP grades confirmed the validity of cell-type classification, with normal tissues primarily aligning with the non-malignant group. We then examined the expression of the five sodium ion transport-related genes in both populations, using CD274 (PD-L1)—a canonical immune evasion marker—as a comparator. All five genes exhibited marked downregulation in malignant epithelial cells relative to the non-malignant counterparts (Figure 3B).
Focusing on CHP1, we observed that its expression was predominantly restricted to epithelial cells and significantly decreased in tumor tissues (Figure 3C). This pattern was validated in the TCGA-KIRC cohort, where CHP1 expression was significantly reduced in ccRCC samples (n = 542) compared with normal tissues (n = 72) (Figure 3D, p < 0.001). The patients were further stratified into CHP1-High (n = 248) and CHP1-Low (n = 247) groups based on the median expression level. KM analysis revealed that higher CHP1 expression was significantly associated with improved OS (p < 0.05) (Figure 3E), suggesting its potential prognostic value in ccRCC.

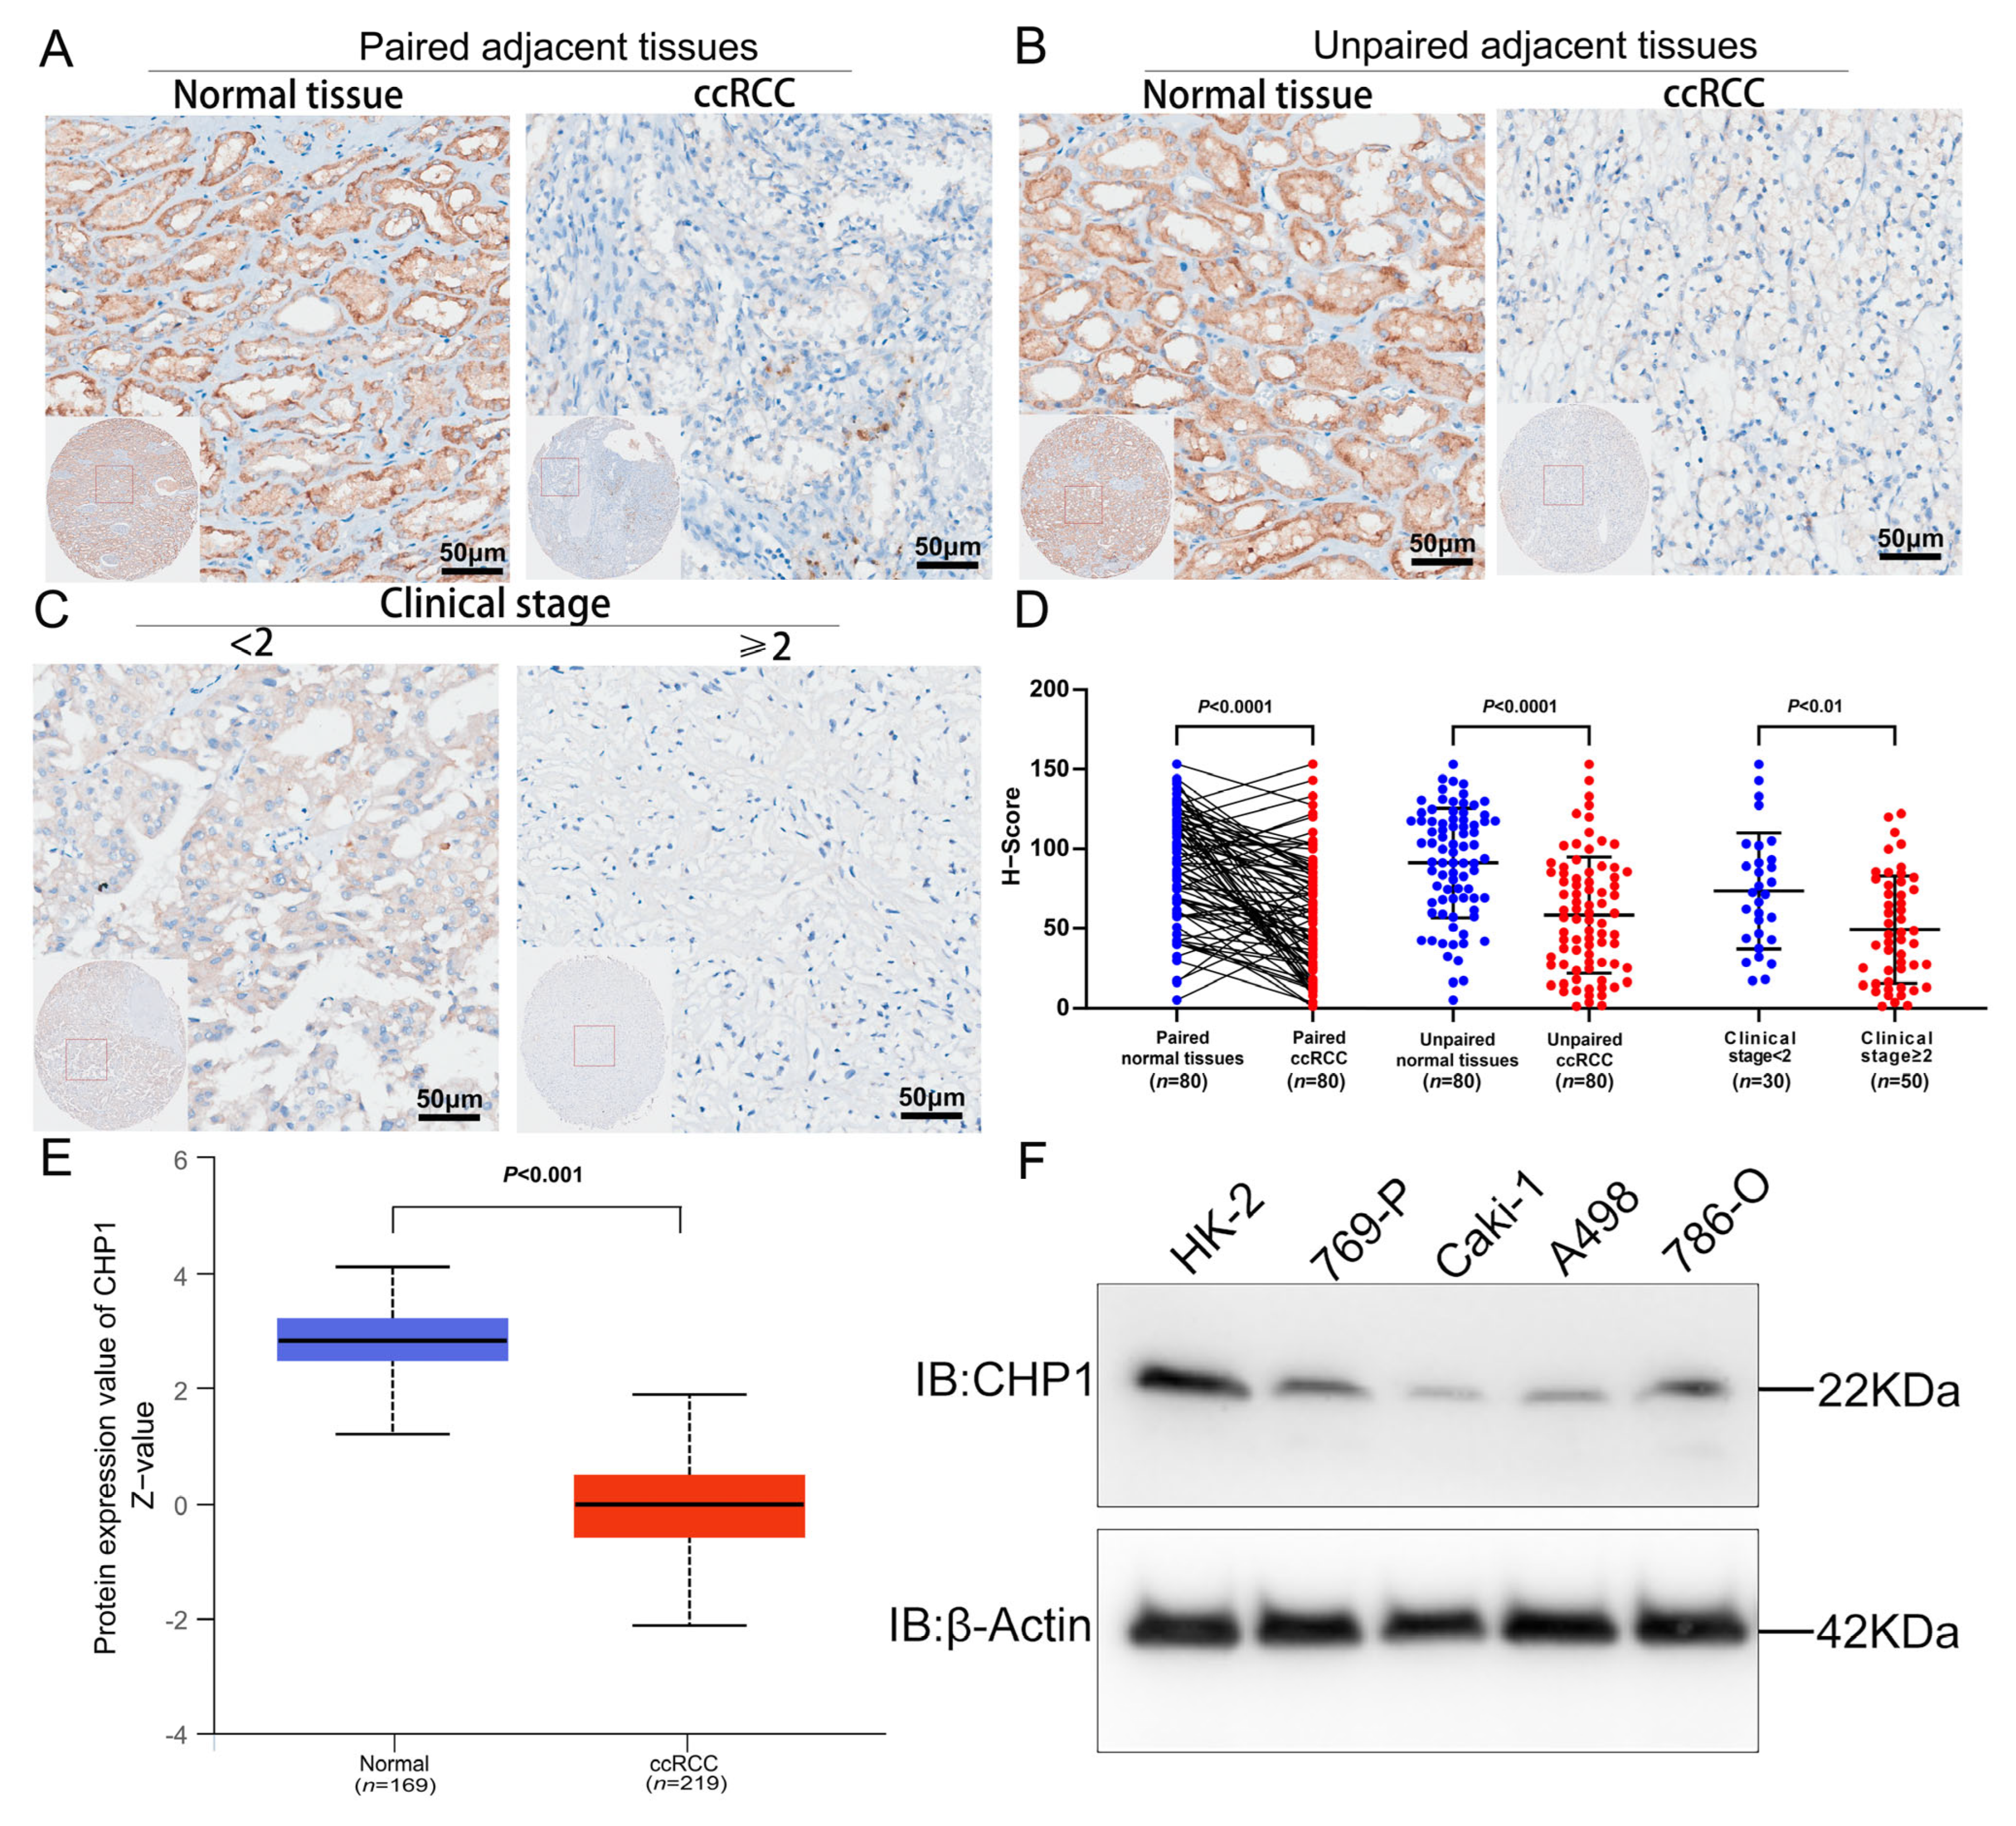
3.4. Reduced CHP1 Protein Expression in ccRCC Tissues and Cell Lines

To evaluate CHP1 protein expression in ccRCC, we conducted IHC on 80 pairs of tumor and matched adjacent kidney tissues (160 samples in total) and Western blotting on the ccRCC cell lines. The IHC results demonstrate a marked reduction in CHP1 protein levels in ccRCC tissues (Figure 4A,B). Further subgroup analysis revealed that CHP1 expression was lower in advanced-stage samples than in early-stage cases (Figure 4C). Quantitative assessment with H-scores analyzed using Visiopharm software confirmed this trend, showing significantly reduced CHP1 expression in both ccRCC tissues overall and in late-stage tumors (Figure 4D).
Consistent with these findings, data from the CPTAC proteomic database also indicated significantly decreased CHP1 protein levels in ccRCC relative to adjacent kidney tissues (Figure 4E). The Western blot analysis corroborated these observations. Using HK-2 cells as a control, CHP1 protein levels were found to be significantly reduced in all tested ccRCC cell lines (769-P, A498, Caki-1, and 786-O) (Figure 4F).

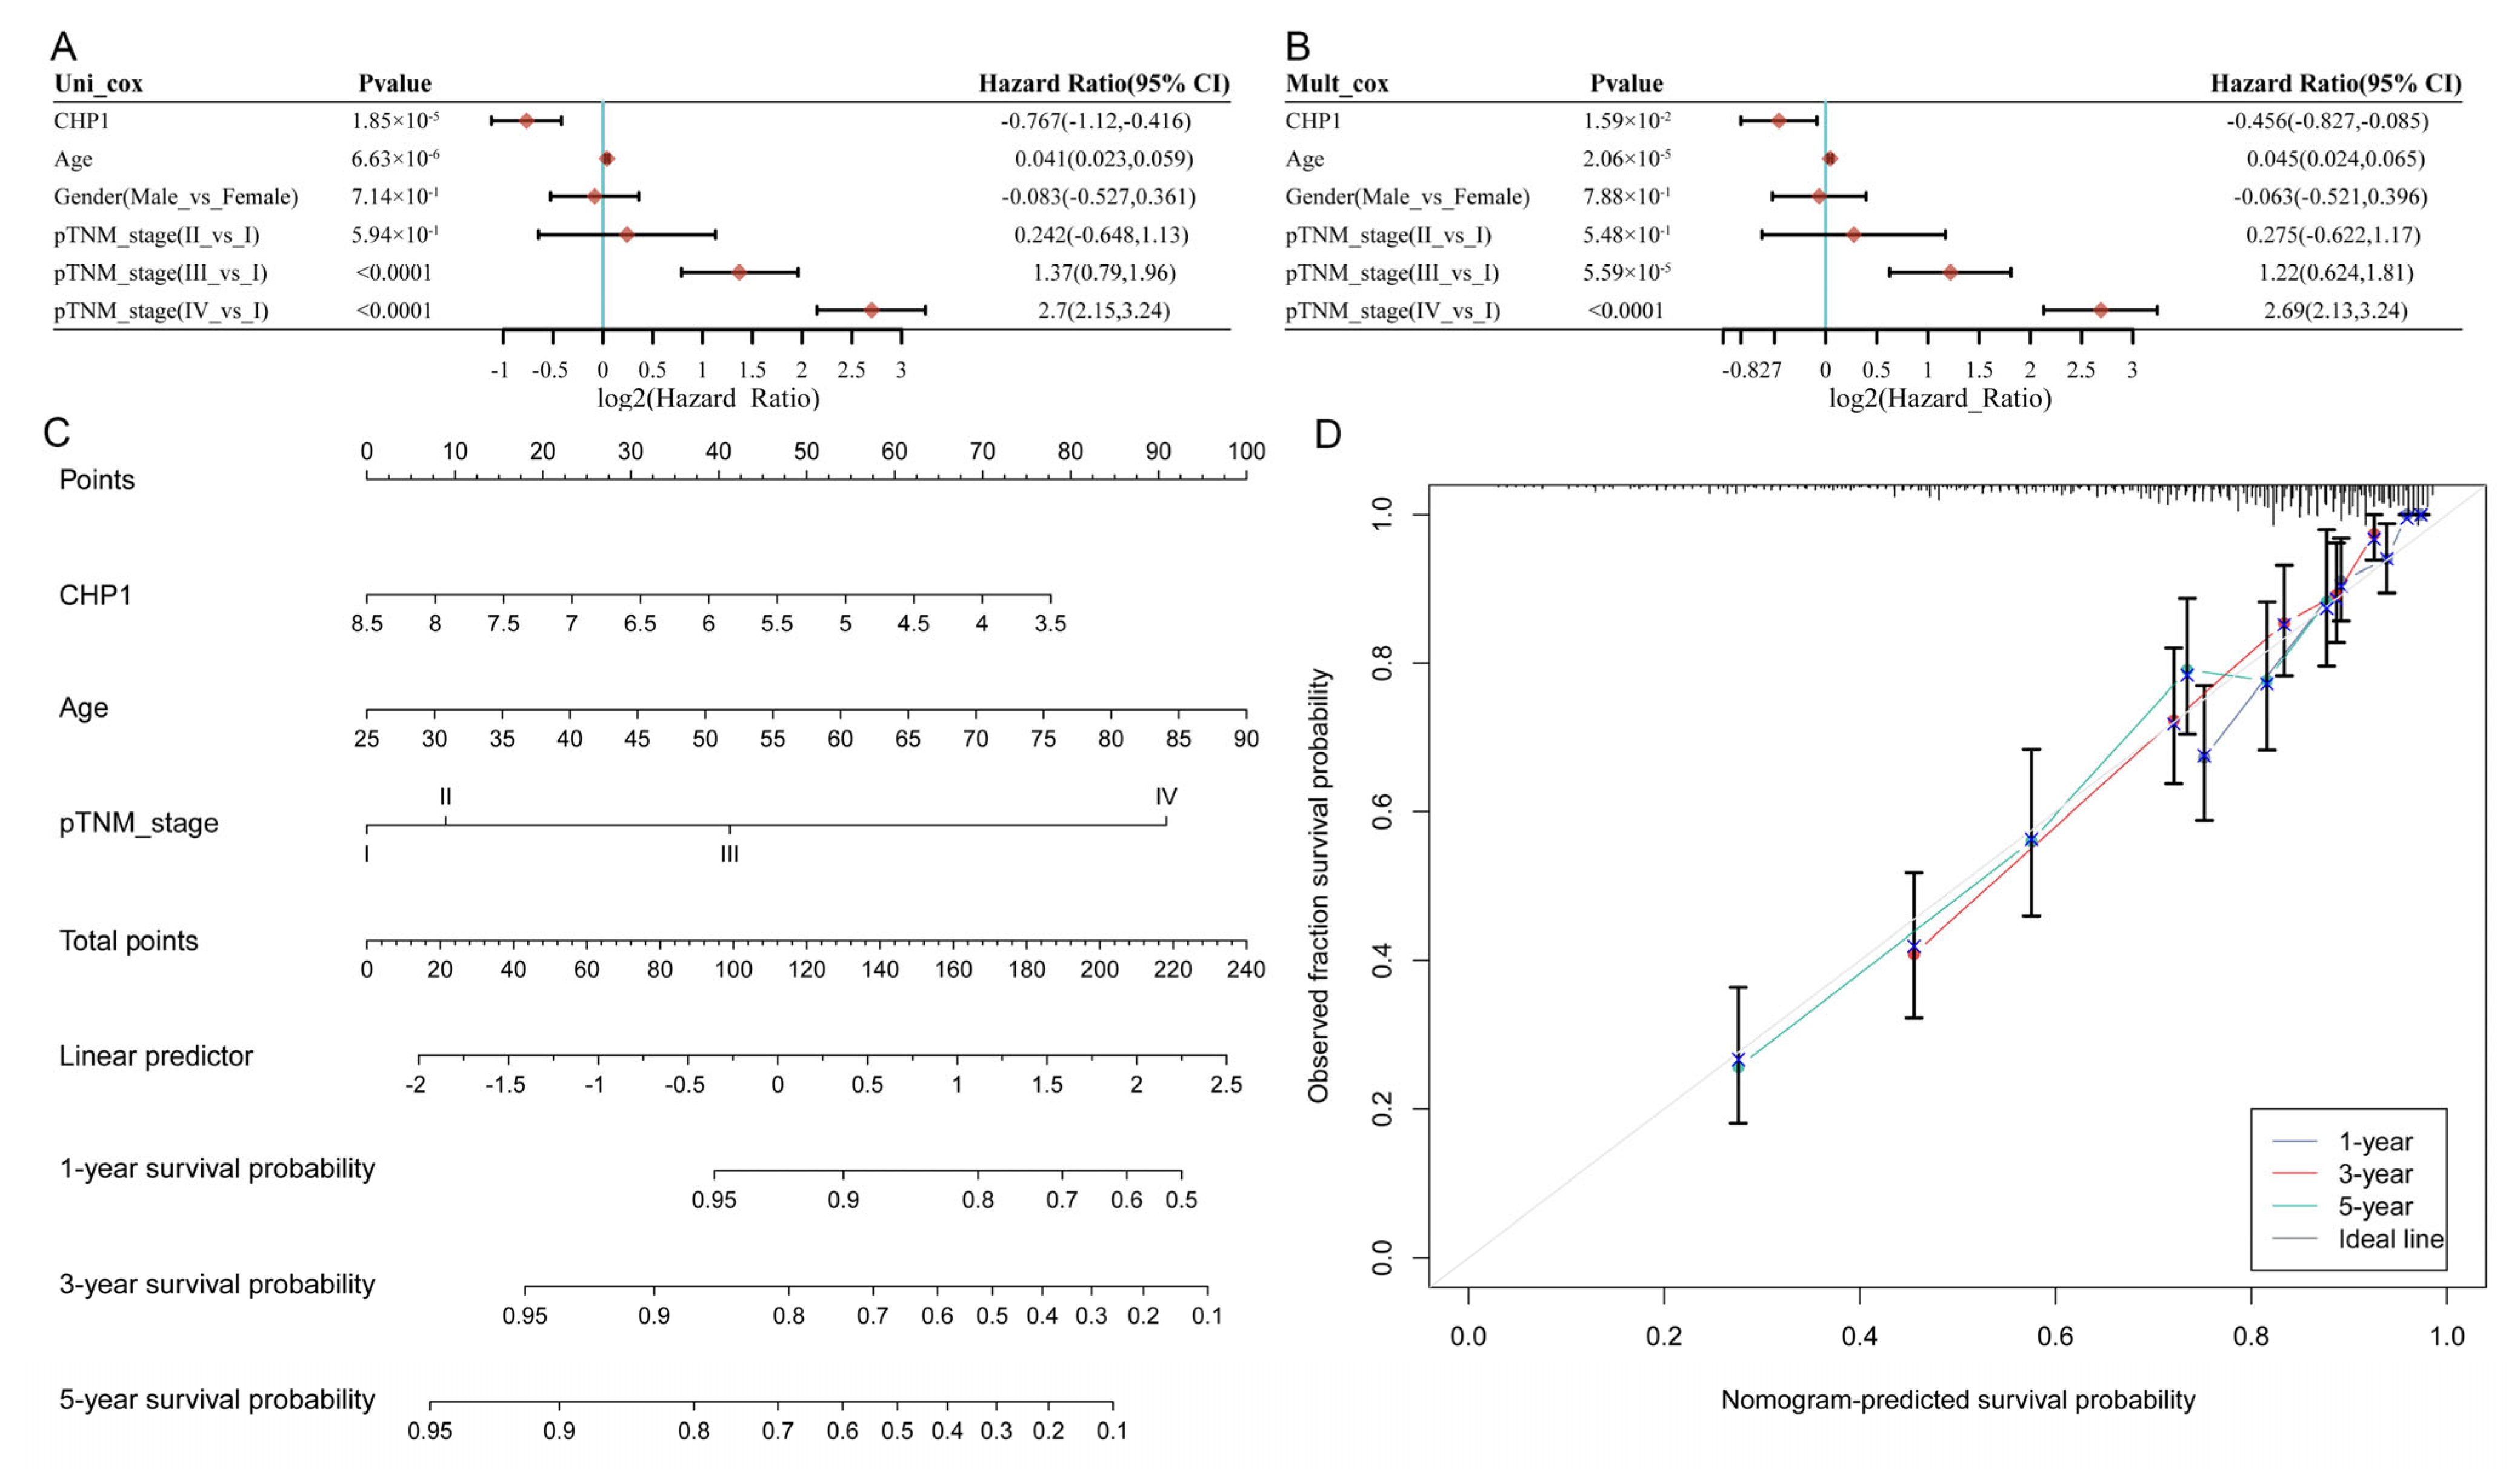
3.5. CHP1 Serves as a Favorable Prognostic Indicator in KIRC

To assess the prognostic significance of CHP1 in ccRCC, univariate Cox regression analysis was conducted using data from the TCGA-KIRC cohort (Figure 5A). The results indicate that CHP1 expression, age, and advanced pathological TNM stage (stage III/IV) were significantly associated with OS, whereas other variables were not statistically significant. Subsequently, multivariate Cox regression analysis confirmed that low CHP1 expression is an independent prognostic factor, with age and TNM stage III/IV also identified as independent risk factors (Figure 5B).
A prognostic nomogram was constructed incorporating CHP1 expression, age, and TNM stage to estimate individual risk scores and predict 1-, 3-, and 5-year OS probabilities (Figure 5C). As shown in the figure, low CHP1 expression, older age, and advanced tumor stage contributed to higher risk scores, which were inversely associated with survival probability. The calibration curves demonstrated the high concordance between predicted and observed OS at 1, 3, and 5 years, supporting the nomogram’s predictive accuracy (Figure 5D).

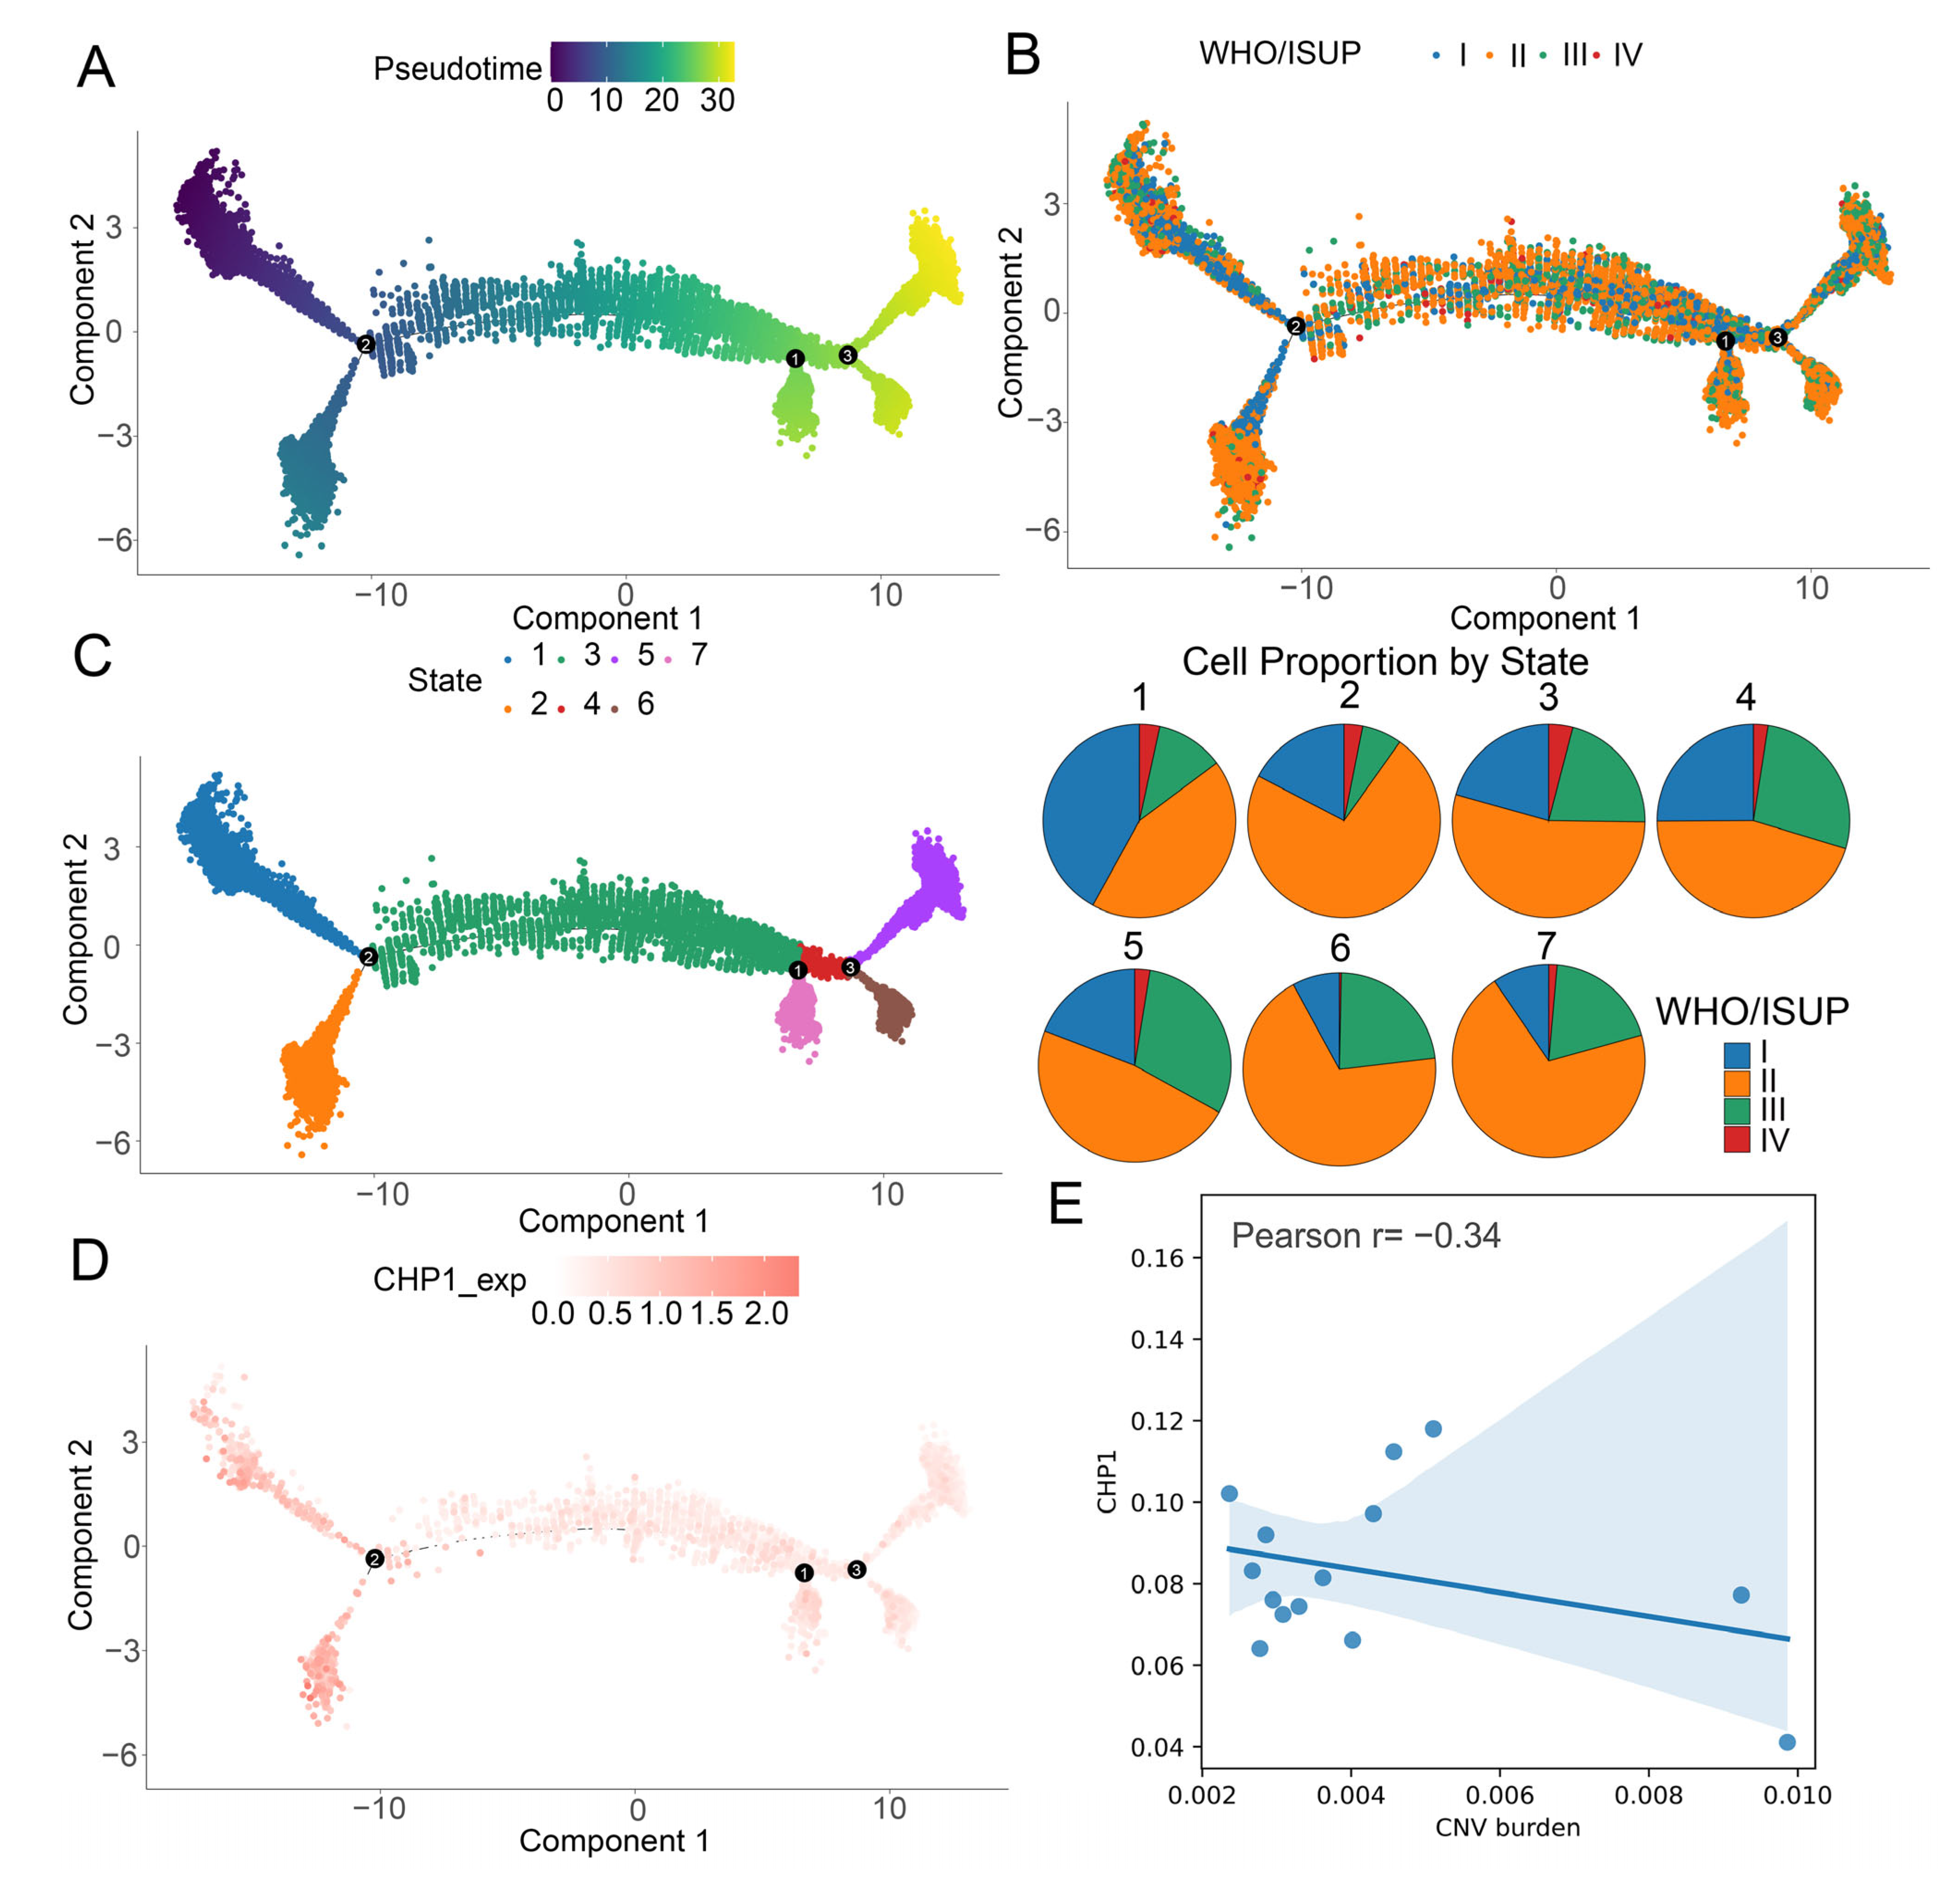
3.6. Gradual Decrease in CHP1 Expression Along the Developmental Trajectory of Tumor Cells

To investigate the temporal dynamics of tumor progression, pseudotime trajectory analysis was performed on ccRCC tumor cells using Monocle2. The inferred trajectory featured three major branch points, reflecting the differentiation continuum of malignant cells (Figure 6A). Tumor cells from WHO/ISUP stage I patients predominantly localized to the early pseudotime regions, while those from stage III and IV patients were enriched in later stages (Figure 6B).
The cells were further categorized into seven groups along the trajectory. The proportion of stage I cells progressively declined, whereas the proportion of stage III cells increased with pseudotime advancement (Figure 6C), consistent with biological tumor progression and validating the trajectory’s relevance.
Notably, CHP1 expression was predominantly observed in early-stage tumor cells and gradually diminished along the pseudotime axis, indicating a potential role of CHP1 in early-stage tumor biology and differentiation (Figure 6D). In addition, CHP1 expression was found to be negatively associated with CNV burden (Figure 6E).

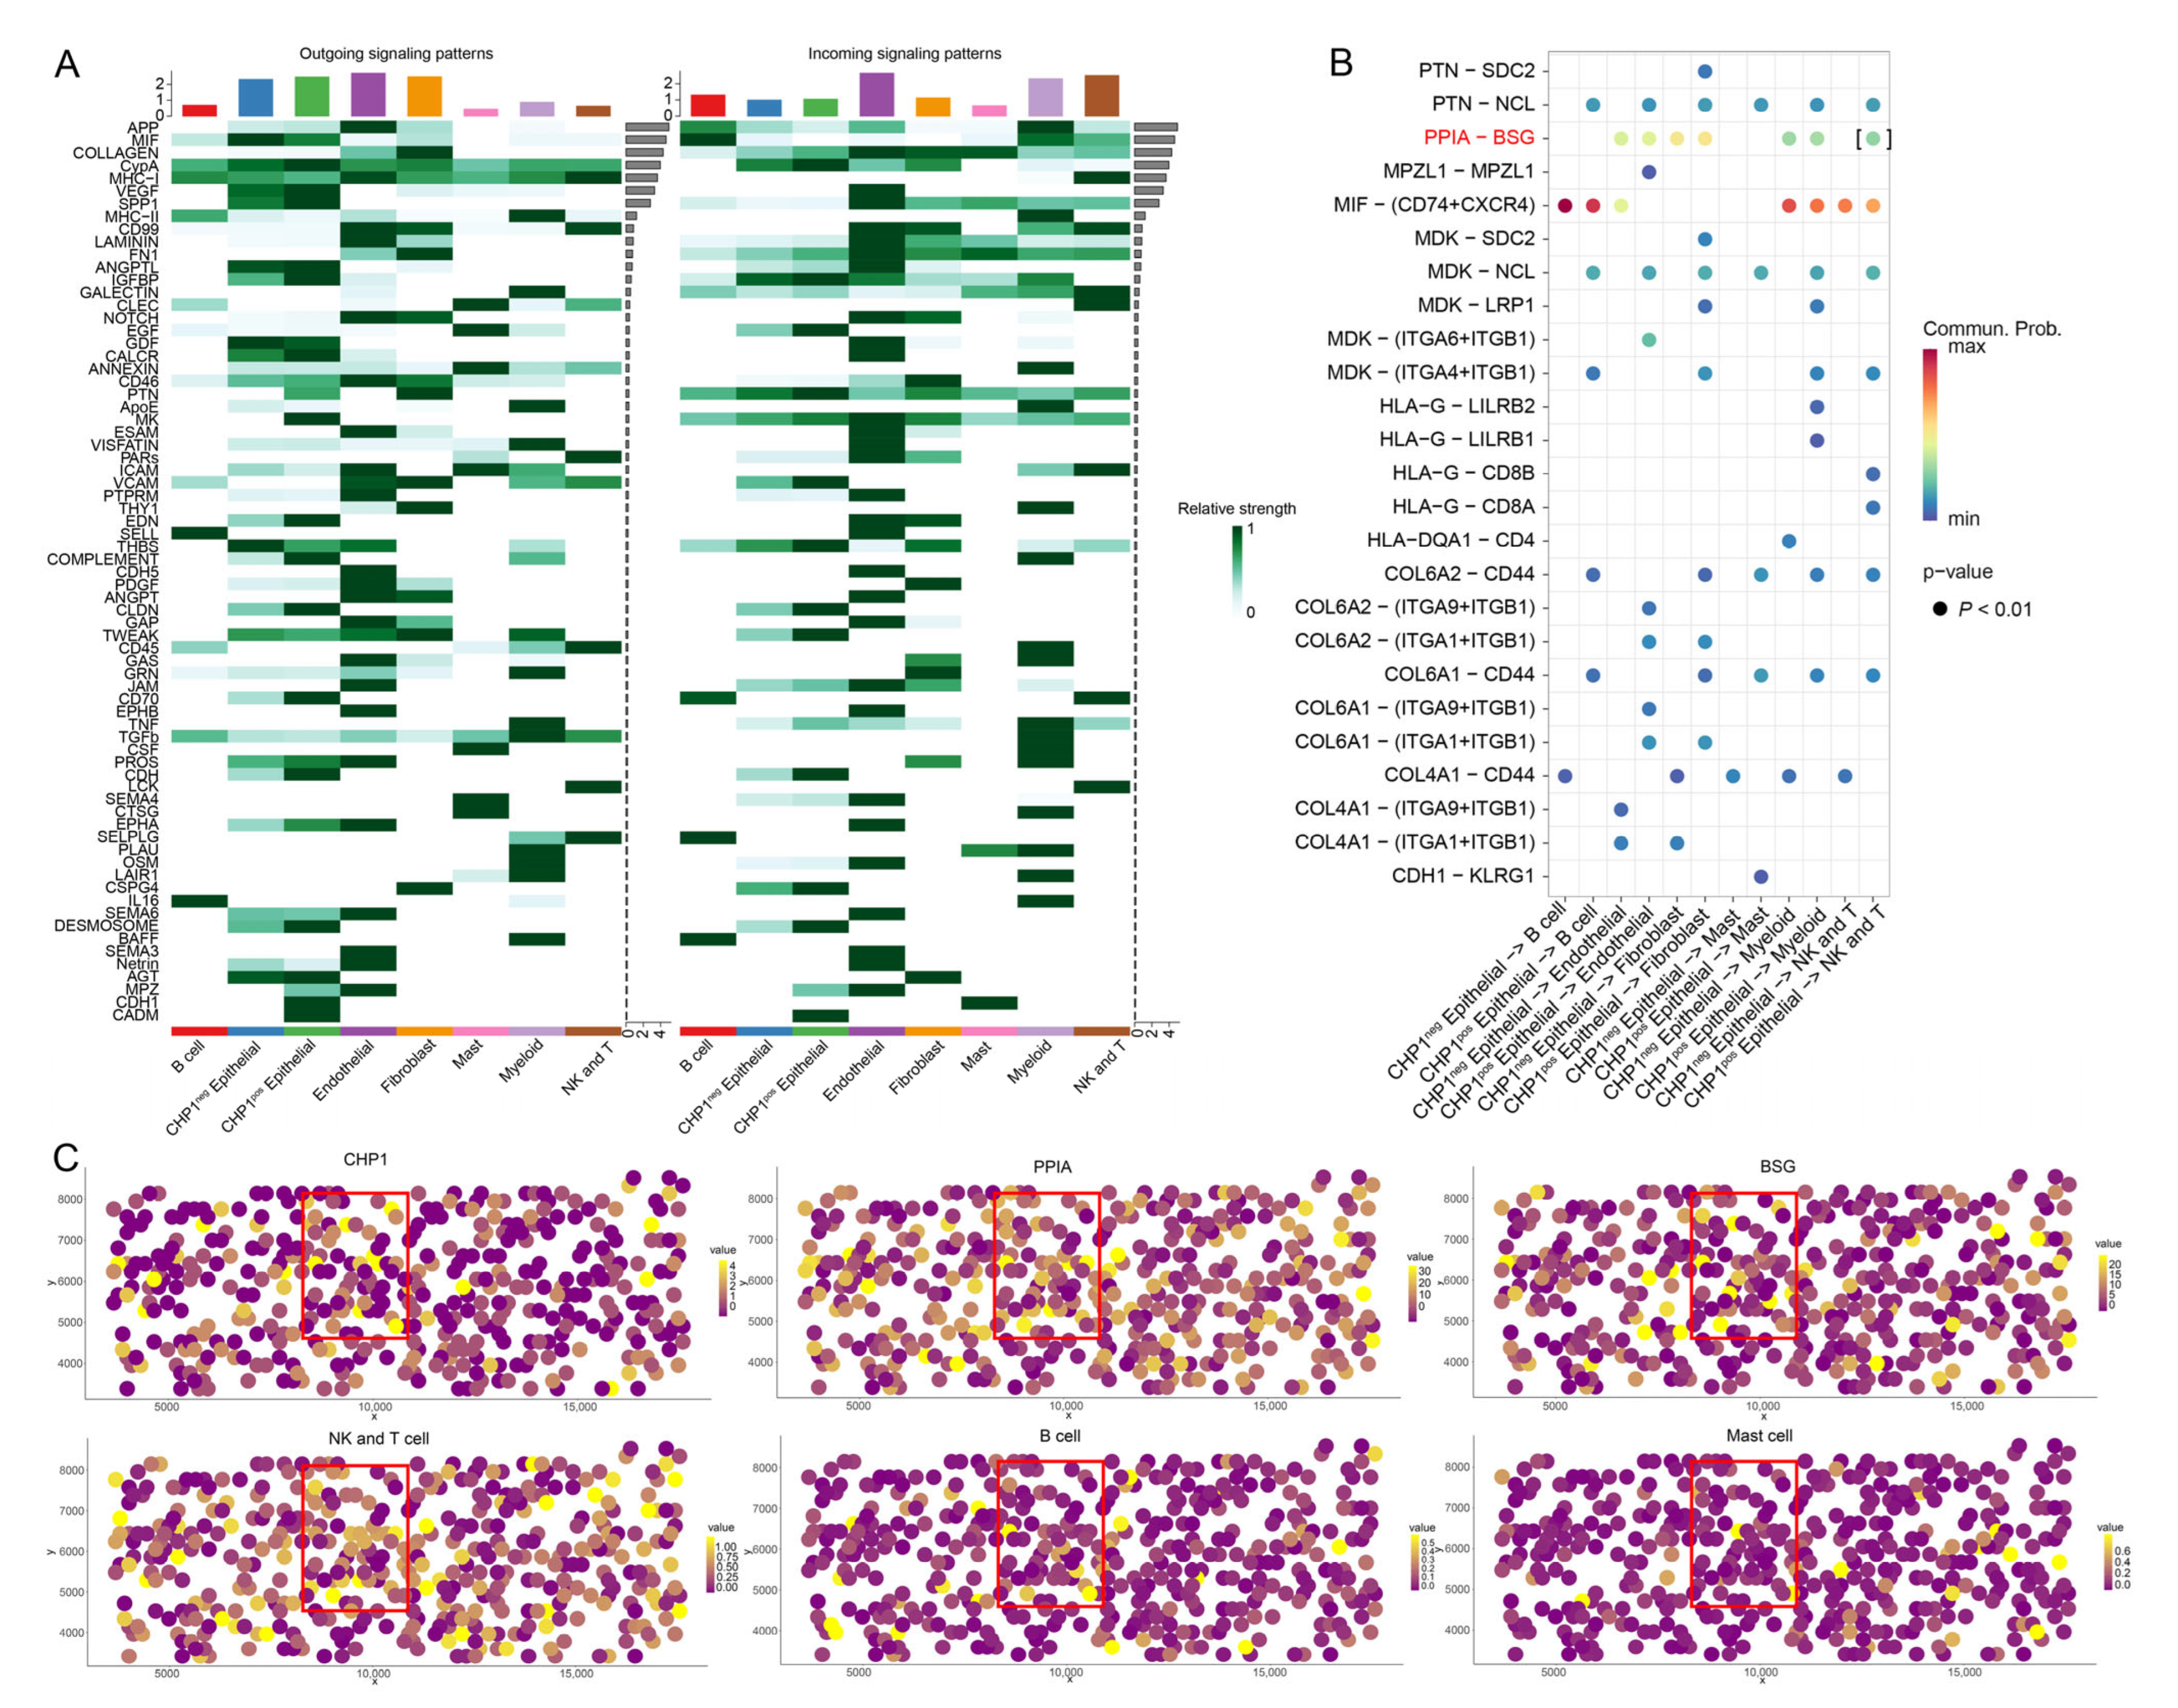
3.7. Impact of CHP1 Expression on Cell–Cell Communication

To investigate how CHP1 expression may influence cell–cell signaling in ccRCC, we assessed intercellular interactions by comparing the signaling patterns between CHP1-positive (CHP1pos) and CHP1-negative (CHP1neg) epithelial cells.
Based on single-cell expression data, epithelial cells were stratified into 75,182 CHP1neg and 29,855 CHP1pos cells. CellChat analysis was applied across all cell types to evaluate outgoing and incoming signaling activities (Figure 7A). CHP1pos epithelial cells exhibited enhanced outgoing signals via the MK, MPZ, CDH1, and CADM pathways and stronger incoming signals through the MPZ and CADM pathways compared with CHP1neg cells, suggesting greater intercellular communication capacity among CHP1pos epithelial cells.
To further discern specific ligand–receptor interactions, we compared CHP1pos and CHP1neg epithelial cells in terms of their communication with six other cell populations. Dot plot visualization revealed a notably increased interaction between CHP1pos epithelial cells and NK and T cells, which was primarily mediated through the PPIA–BSG signaling axis (Figure 7B).
We validated these findings using spatial transcriptomic data to assess the co-localization of CHP1, its associated ligand (PPIA), receptor (BSG), and the relevant cell populations (Figure 7C). The spatial mapping confirmed that CHP1, PPIA, BSG, and NK and T cells were enriched in overlapping regions, whereas B cells and macrophages did not co-localize with CHP1 expression. These results support the role of PPIA–BSG signaling in mediating interactions between CHP1pos epithelial cells and NK and T cells in the ccRCC tumor microenvironment.

3.8. CHP1 Expression Affects Amino Acid Transport in Tumor Cells

To further elucidate the molecular mechanisms underlying CHP1′s role in ccRCC development, tumor cells were stratified into 46,442 CHP1neg and 15,793 CHP1pos populations. Differential gene expression analysis using the FindMarkers function identified genes significantly upregulated in CHP1pos cells (criteria: p < 0.05 and logFC > 0), and subsequent GSEA revealed a strong enrichment of these genes in the “amino acid transmembrane transport” pathway (Figure 8A,B). This result suggests that CHP1 expression substantially influences amino acid transport processes in tumor cells.
Previous studies have established that CHP1 acts as a critical auxiliary factor for NHE1—directly binding to its extracellular domain to enhance exchange activity under physiological conditions [11,51]—and that CHP1 interacts with GPAT4, a rate-limiting enzyme in lipid biosynthesis required for ER-based triglyceride synthesis [12]. Building on this multifunctional role, we hypothesized that CHP1 might also affect amino acid transport by interacting with specific amino acid transporters.
To test this hypothesis, we conducted protein–protein molecular docking between CHP1 and 59 known AATs [41]. Among these, CHP1 demonstrated a significant interaction solely with the solute carrier family 38 member 1 (SLC38A1). Using the HDOCK server, docking between CHP1 and SLC38A1 yielded a docking score of −325.46 and a confidence score of 0.9709, indicating a high binding probability. The calculated MM/GBSA binding free energy was −88.27 kcal/mol. Further analysis with the PLIP platform identified seven hydrogen bonds—specifically between SLC38A1-SER466 and CHP1-ARG158, between SLC38A1-HIS487 and CHP1-ARG34, between SLC38A1-GLU485 and CHP1-ILE67, between SLC38A1-SER481 and CHP1-ASN60, between SLC38A1-ILE474 and CHP1-TYR122, and between SLC38A1-SER273 and CHP1-GLN187—and one salt bridge between SLC38A1-ASP476 and CHP1-LYS188 (Figure 8C).
To investigate the interaction between CHP1 and SLC38A1, we performed exogenous co-immunoprecipitation (Co-IP) in HEK293T cells using FLAG-tagged CHP1. The results confirmed that CHP1 binds to SLC38A1 (Figure 8D). These findings suggest that CHP1 may recruit SLC38A1 and regulate amino acid transport.

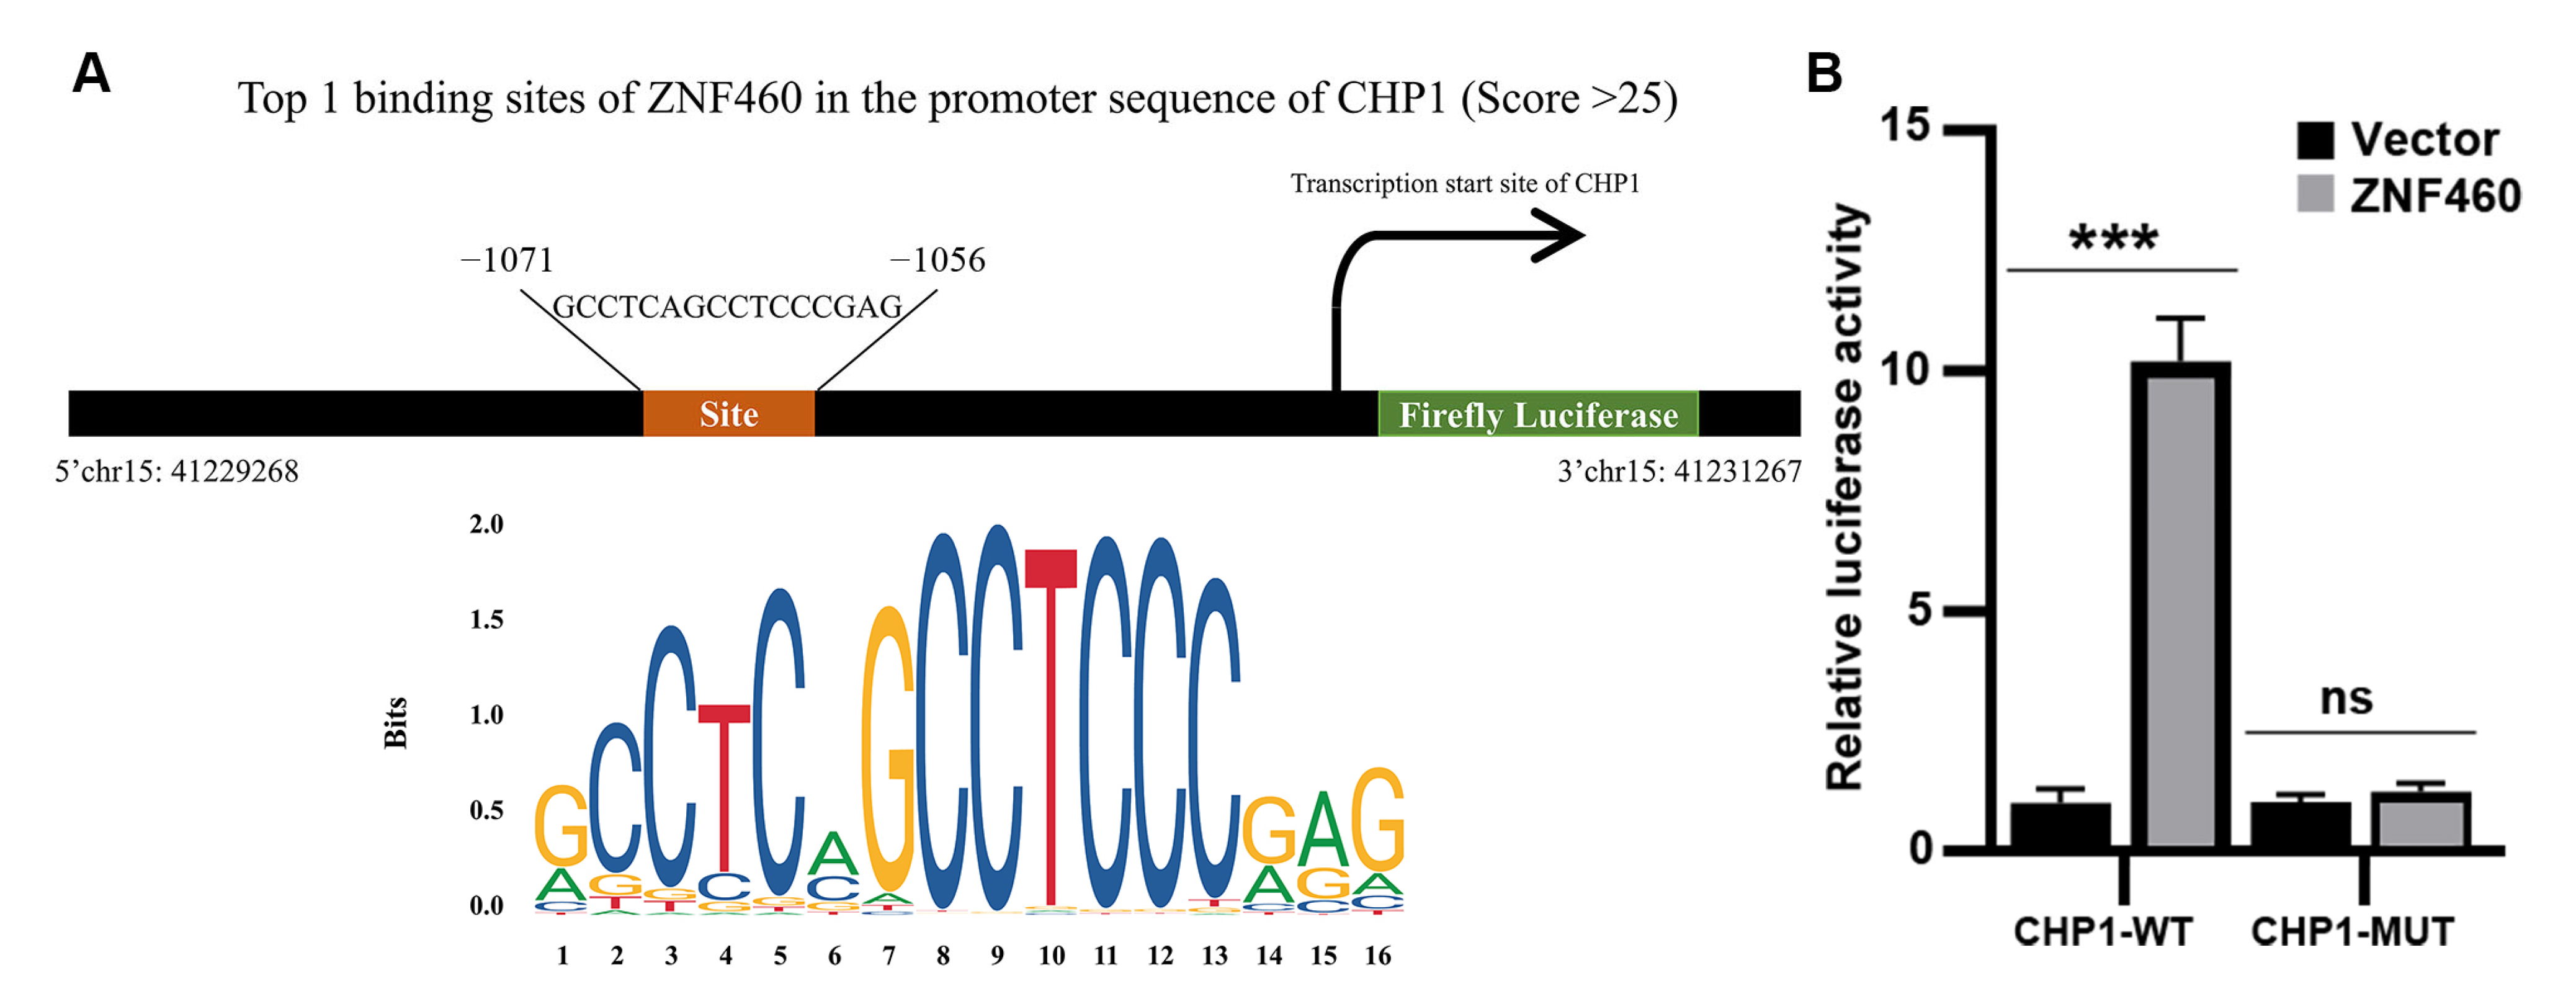
3.9. Prediction of Transcription Factors Involved in Regulating CHP1 Expression

Using the JASPAR database, we identified ZNF460 (zinc finger protein 460) as a candidate transcription factor with a relative score > 0.9 (Figure 9A). The binding site with the highest score (−1071 to −1056) was selected for the luciferase reporter assay. The results showed that mutations in the CHP1 promoter sequence significantly reduced transcriptional activity compared with the wild-type sequence (Figure 9B). These findings indicate that ZNF460 acts as a transcription factor that promotes CHP1 expression.

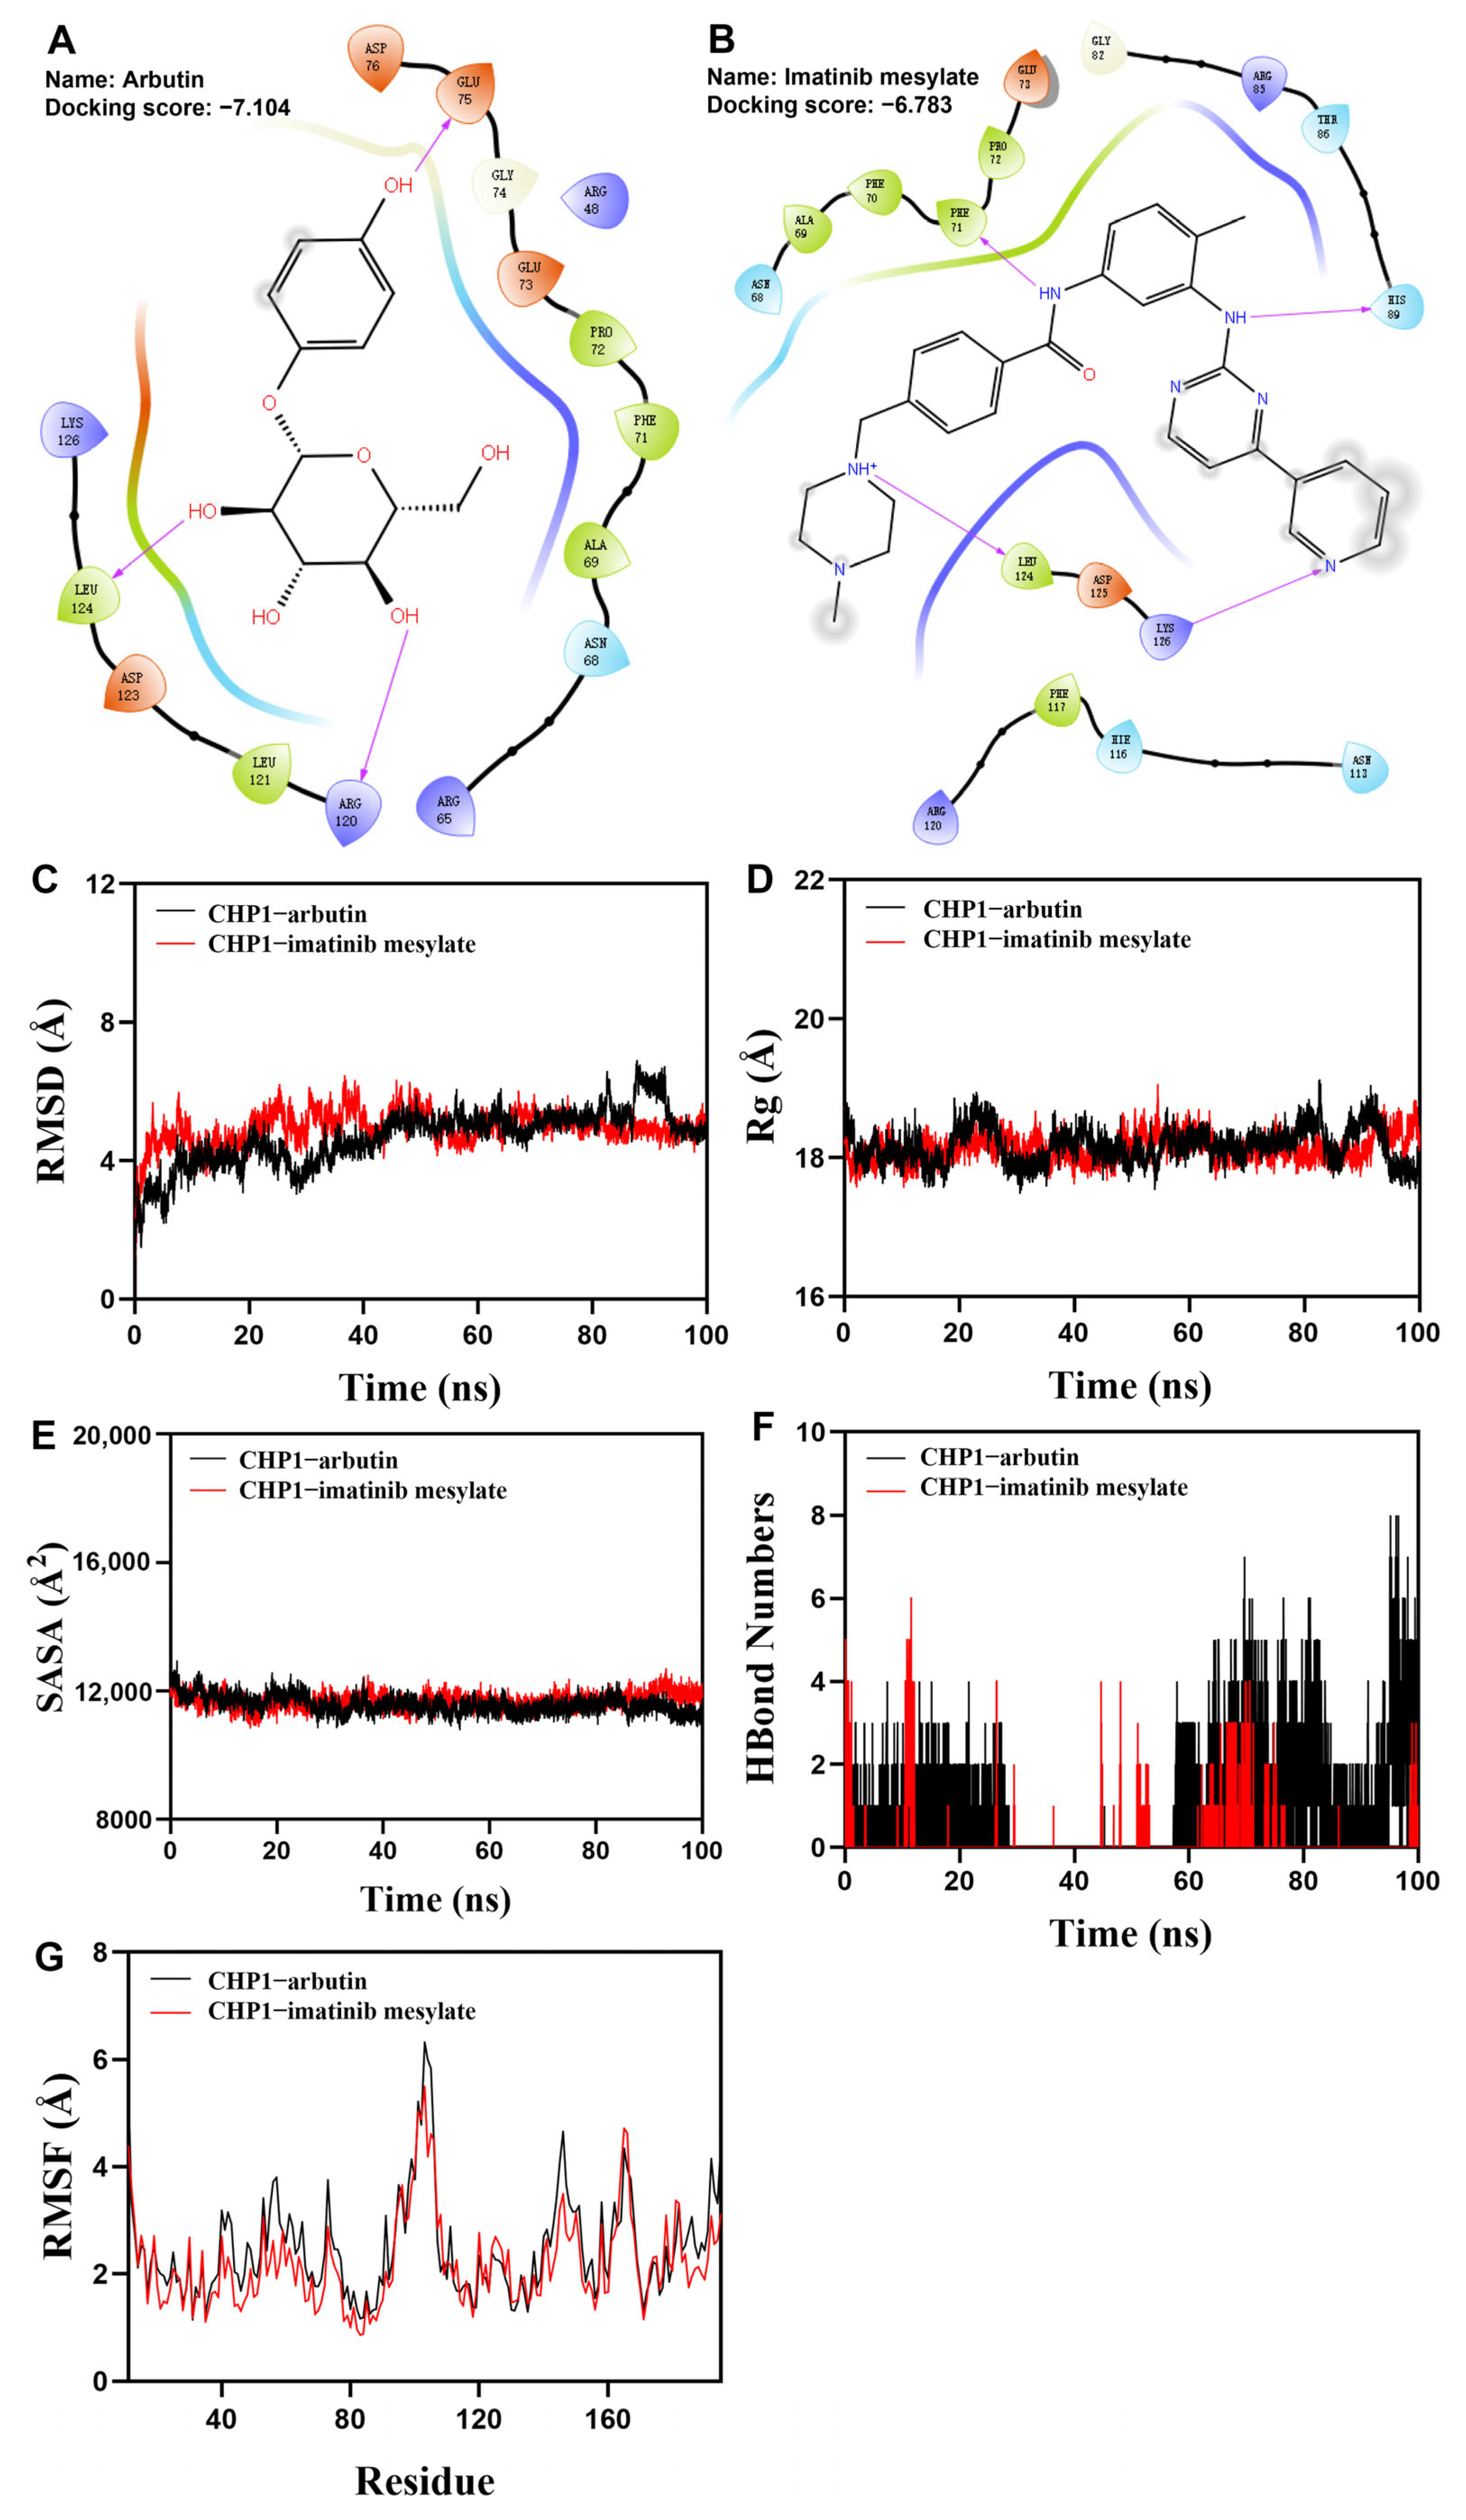
3.10. Virtual Drug Screening Identifies Two Compounds Binding to CHP1 Protein

To identify potential therapeutic compounds targeting CHP1, we performed molecular docking using its crystal structure and an FDA-approved compound library. Docking simulations were carried out in Schrödinger Maestro. Two top-ranking compounds, arbutin and imatinib mesylate, demonstrated high binding affinity to CHP1. Arbutin formed three hydrogen bonds with LEU-124, ARG-120, and GLU-75 on CHP1 (Figure 10A). Imatinib mesylate formed four hydrogen bonds involving LEU-174, PHE-71, and HIS-89 and also exhibited a hydrogen bond interaction between LYS-126 and the nitrogen atom on its pyridine ring (Figure 10B). These results suggest that arbutin and imatinib mesylate may serve as candidate compounds for modulating CHP1-related pathways in ccRCC.
RMSD is a reliable indicator for assessing the conformational stability of proteins and ligands, reflecting the deviation of atomic positions from their initial coordinates. Smaller deviations indicate greater structural stability. Therefore, RMSD was used to evaluate the equilibrium state of the simulation systems. As shown in Figure 10C, the RMSD of the CHP1–arbutin complex stabilized between 45 ns and 90 ns, with a slight upward trend after 90 ns, but overall fluctuated below 4.58 Å. The CHP1–imatinib mesylate complex reached equilibrium after 50 ns and fluctuated around 4.66 Å, indicating that both ligands exhibited stable binding with CHP1. Rg reflects the compactness and global conformational changes in the protein. Larger Rg values typically suggest a more expanded structure. As shown in Figure 10D, both CHP1–arbutin and CHP1–imatinib mesylate complexes exhibited only slight fluctuations in Rg during the simulation, indicating minor conformational changes in the protein–ligand complexes. SASA was calculated to evaluate changes in the protein surface upon ligand binding (Figure 10E). The results showed no significant changes in SASA after ligand binding, suggesting that neither arbutin nor imatinib mesylate induced major structural rearrangements in CHP1. Hydrogen bonds play a crucial role in ligand–protein interactions. As shown in Figure 10F, the number of hydrogen bonds between CHP1 and each ligand fluctuated between zero and six, with an average of approximately one hydrogen bond maintained throughout most of the simulation. This indicates favorable hydrogen bonding interactions between the ligands and CHP1. RMSF was used to evaluate the flexibility of amino acid residues. As shown in Figure 10G, both CHP1–arbutin and CHP1–imatinib mesylate complexes exhibited relatively low RMSF values (mostly below 4 Å), suggesting limited flexibility and high structural stability. In summary, both CHP1–arbutin and CHP1–imatinib mesylate complexes demonstrated stable binding, favorable hydrogen bonding interactions, and minimal structural perturbations. These results indicate strong and stable interactions between arbutin or imatinib mesylate and the target protein CHP1.

4. Discussion

Sodium ions play a central role in maintaining osmotic pressure, acid–base balance, and epithelial function. Dysregulation of sodium transport mechanisms has been increasingly linked to cancer development, including ccRCC. The Na+/K+-ATPase complex, composed of α and β subunits, is essential for ion homeostasis in renal epithelial cells. Both NAKα1 and NAKβ1 are predominantly expressed in the kidney, and decreased NAKβ protein levels have been reported in ccRCC tumor tissues, potentially contributing to tumor aggressiveness [52]. Selvakumar et al. further demonstrated that ATP1B1, the gene encoding NAKβ, undergoes promoter methylation-mediated silencing in RCC cell lines and tissues [53]. Additionally, acid-sensing ion channels (ASICs), a subgroup of the epithelial sodium channel (ENaC) family, are activated under acidic conditions and have been proposed as novel biomarkers and therapeutic targets in ccRCC [54,55]. The FXYD2 gene, which modulates Na+/K+-ATPase activity, is downregulated in ccRCC and is associated with tumor progression, unfavorable prognosis, and increased regulatory T cells (Tregs) infiltration [56]. Members of the ENaC complex—including SCNN1A, SCNN1B, and SCNN1G—are essential for sodium and fluid homeostasis in epithelial tissues [57]. The expression of SCNN1 genes is reduced at both the mRNA and protein levels in ccRCC, with the expression levels of SCNN1B and SCNN1G being positively correlated with disease progression and poor clinical outcomes [58].
In this study, malignant tumor cells were distinguished from other cell subpopulations based on chromosomal CNV scores, which enabled us to separate them from non-malignant epithelial cells. A comparative analysis revealed that five sodium ion transport-related genes—FXYD2, ANK3, ATP1A1, PRSS8, and CHP1—were significantly downregulated in malignant cells, implicating their potential involvement in tumor suppression.
FXYD2, located on chromosome 11q23, encodes the γ-subunit of Na+/K+-ATPase (NAKγ) [59]. It exists in two isoforms—FXYD2a and FXYD2b—and is primarily expressed in the distal tubules of the renal medulla [60]. Interestingly, while FXYD2 is downregulated in ccRCC, it is upregulated in other tumor types, such as colorectal, hepatocellular, and ovarian clear cell carcinomas, where its high expression correlates with advanced disease and poor prognosis [61].
ANK3, a member of the membrane-associated cytoskeletal protein family, functions as an anchoring protein for ion channels and is significantly downregulated in KIRC tissues. Reduced ANK3 expression has been associated with poor survival, supporting its potential role as both a prognostic marker and a modulator of the immune microenvironment [62].
ATP1A1, which encodes the NAKα1 subunit, belongs to the P-type ATPase family. Although it is essential for ionic homeostasis, ATP1A1 is hypomethylated and overexpressed in aggressive tumors such as triple-negative breast cancer (TNBC). Its high expression is associated with poor prognosis in TCGA datasets, and functional studies have shown that ATP1A1 knockout reduces cell viability and tumorsphere formation in TNBC models. These findings suggest a context-dependent role of ATP1A1 across cancer types [63].
PRSS8 encodes a glycosylphosphatidylinositol (GPI)-anchored serine protease that acts as a tumor suppressor. In vivo, conditional knockout of Prss8 in mice leads to spontaneous intestinal inflammation and tumor formation, while PRSS8 overexpression suppresses tumor growth, invasion, and metastasis. Mechanistically, PRSS8 has been shown to inhibit the Wnt/β-catenin, EMT, and cancer stemness pathways, particularly in colorectal cancer [64].
Together, these findings reinforce the notion that sodium transport-related genes, which are downregulated in ccRCC, may play broader roles in tumor suppression, immune regulation, and cancer metabolism. Their altered expression profiles highlight their potential mechanistic links to disease progression and prognosis in ccRCC.
The role of CHP1 in cancer remains largely underexplored. A recent study in hepatocellular carcinoma (HCC) identified a five-gene natural killer cell-related signature (NKRLSig), which included CHP1, and demonstrated that patients in the low-risk group exhibited improved responses to immunotherapy [65]. In our previous work, we developed a glycosylation–tumor microenvironment (GLY/TME) classifier using 15 glycosylation-related genes, where CHP1 emerged as a favorable prognostic marker in HCC. Patients with a low GLY score and a high TME score exhibited better survival outcomes and treatment responses [66].
The pseudotime trajectory analysis revealed that CHP1 is predominantly expressed in early-stage tumor cells, with its expression gradually declining along the developmental timeline, which is consistent with its potential role in tumor suppression. Cell–cell communication analysis showed that CHP1pos epithelial cells exhibit more extensive interactions with immune and stromal populations than CHP1neg cells. Notably, interaction mapping identified PPIA–BSG signaling as a key communication axis between CHP1pos epithelial cells and NK and T cells.
PPIA (peptidylprolyl isomerase A) is implicated in multiple human cancers. Liao et al. reported that PPIA knockdown significantly inhibited invasion and migration in oral squamous cell carcinoma (OSCC) cells, while recombinant PPIA enhanced proliferation and activated the ERK1/2 and p38MAPK pathways through CD147 (BSG) [67]. BSG/CD147 is a multifunctional membrane protein involved in tumor initiation, progression, and metastasis in various cancers, including laryngeal, gastric, renal, and triple-negative breast cancers. Overexpression of CD147 has also been linked to metastatic potential in colorectal, ovarian, cervical, and skin cancers [68]. These findings support the biological plausibility of the CHP1–PPIA–BSG axis as a contributor to immune regulation and tumor progression in ccRCC.
An in-depth analysis of the molecular mechanisms underlying CHP1 function in ccRCC revealed that CHP1 might modulate amino acid transmembrane transport, a process essential to tumor cell survival and metabolism. Protein–protein docking analysis of CHP1 against 59 amino acid transporters identified a specific and high-confidence interaction with SLC38A1, a known glutamine transporter.
Amino acids are not only fundamental to cell structure and metabolism but also critical mediators of cancer progression. AATs maintain intracellular amino acid homeostasis and regulate diverse processes such as pH balance, redox control, energy production, and biosynthesis. Dysregulated AAT activity is a hallmark of metabolic reprogramming in cancer and contributes to tumor growth, immune evasion, and therapeutic resistance [41].
Among AATs, SLC38A1 plays a central role in glutamine transport, and its overexpression is frequently observed in cancers, including breast, lung, colon, and endometrial malignancies [69,70,71,72,73]. In ccRCC specifically, glutamine depletion by tumor cells leads to the activation of HIF1α in infiltrating macrophages, thereby promoting IL-23 secretion and contributing to poor clinical outcomes [74].
The therapeutic potential of targeting CHP1 is further supported by our identification of arbutin and imatinib mesylate as candidate binding agents. Arbutin, a naturally occurring hydroquinone glucoside, is widely recognized for its dermatological applications, but it also exhibits broad-spectrum anticancer, anti-inflammatory, and antioxidant properties, with demonstrated efficacy across various tumor types and minimal toxicity [75]. Imatinib mesylate, a clinically approved tyrosine kinase inhibitor (TKI) for chronic myeloid leukemia and gastrointestinal stromal tumors, is known to interact with transferrin and may be repurposed based on its newly predicted affinity for CHP1 [76,77].
ccRCC remains a therapeutically challenging malignancy due to its high heterogeneity and immunosuppressive tumor microenvironment. Our integrative single-cell analysis identified CHP1 as a previously unrecognized prognosis-associated gene in ccRCC. Given its involvement in sodium homeostasis, pH regulation, lipid metabolism, and amino acid transport, further functional studies on CHP1 may provide new avenues for therapeutic targeting and precision management of ccRCC.

5. Conclusions

Our findings highlight CHP1 as a novel prognostic biomarker and functional mediator in ccRCC, with roles in amino acid metabolism, transcriptional regulation, immune cell interaction, and potential drug targeting. These insights warrant further validation and suggest new therapeutic avenues for ccRCC management.

Supplementary Materials

The following supporting information can be downloaded at: https://www.mdpi.com/article/10.3390/biom15071019/s1. Title: Original Western Blot Images.

Author Contributions

Conceptualization, C.-F.H. and X.L.; methodology, J.-R.C. and R.-T.Z.; software, Y.W. and R.-T.Z.; validation, G.-L.H. and R.-T.Z.; investigation, C.-F.H. and Y.W.; resources, J.-C.Z. and H.-B.Y.; data curation, X.L. and H.-B.Y.; writing—original draft preparation, C.-F.H. and R.-T.Z.; writing—review and editing, X.L. and Y.W.; visualization, R.-T.Z., J.-R.C. and X.-M.L.; supervision, J.-C.Z.; project administration, C.-F.H.; funding acquisition, C.-F.H. All authors have read and agreed to the published version of the manuscript.

Funding

This research was funded by the National Natural Science Foundation of China, grant number 81902855; the Guangdong Basic and Applied Basic Research Foundation, grant number 2023A1515140151; and the Discipline Construction Project of Guangdong Medical University, grant number 4SG24029G.

Institutional Review Board Statement

Our study complies with all relevant ethical regulations and was approved by the Ethics Committee of Shanghai Zhuoli Biotech Company (Shanghai, China) (Ethics number: LLS M-15-01).

Informed Consent Statement

Not applicable.

Data Availability Statement

The data presented in this study are available from the corresponding author upon request.

Conflicts of Interest

The authors declare no conflicts of interest.

Abbreviations

scRNA-seq: single-cell RNA sequencing; ccRCC, clear cell renal cell carcinoma; CHP1, calcineurin B homologous protein 1; TCGA, The Cancer Genome Atlas; CNV, copy number variation; CPTAC, clinical proteomic tumor analysis consortium; EMT, epithelial–mesenchymal transition; GEO, Gene Expression Omnibus; GO, Gene Ontology; GPAT4, glycerol-3-phosphate acyltransferase-4; ICIs, immune checkpoint inhibitors; IHC, immunohistochemistry; KIRC, kidney renal clear cell carcinoma; NHE1, sodium/proton exchanger 1; OS, overall survival; TME, tumor microenvironment; AATs, amino acid transporters; TF, transcription factor; Treg, regulatory T-cell; UMAP, uniform manifold approximation and projection; WES, whole-exome sequencing.

References

  1. Chen, S.; Cao, Z.; Prettner, K.; Kuhn, M.; Yang, J.; Jiao, L.; Wang, Z.; Li, W.; Geldsetzer, P.; Barnighausen, T.; et al. Estimates and Projections of the Global Economic Cost of 29 Cancers in 204 Countries and Territories From 2020 to 2050. JAMA Oncol. 2023, 9, 465–472. [Google Scholar] [CrossRef] [PubMed]
  2. Siegel, R.L.; Giaquinto, A.N.; Jemal, A. Cancer statistics, 2024. CA Cancer J. Clin. 2024, 74, 12–49. [Google Scholar] [CrossRef] [PubMed]
  3. Lindgren, D.; Eriksson, P.; Krawczyk, K.; Nilsson, H.; Hansson, J.; Veerla, S.; Sjolund, J.; Hoglund, M.; Johansson, M.E.; Axelson, H. Cell-Type-Specific Gene Programs of the Normal Human Nephron Define Kidney Cancer Subtypes. Cell Rep. 2017, 20, 1476–1489. [Google Scholar] [CrossRef]
  4. Moch, H.; Amin, M.B.; Berney, D.M.; Comperat, E.M.; Gill, A.J.; Hartmann, A.; Menon, S.; Raspollini, M.R.; Rubin, M.A.; Srigley, J.R.; et al. The 2022 World Health Organization Classification of Tumours of the Urinary System and Male Genital Organs-Part A: Renal, Penile, and Testicular Tumours. Eur. Urol. 2022, 82, 458–468. [Google Scholar] [CrossRef]
  5. Jonasch, E.; Walker, C.L.; Rathmell, W.K. Clear cell renal cell carcinoma ontogeny and mechanisms of lethality. Nat. Rev. Nephrol. 2021, 17, 245–261. [Google Scholar] [CrossRef]
  6. Zhu, Z.; Jin, Y.; Zhou, J.; Chen, F.; Chen, M.; Gao, Z.; Hu, L.; Xuan, J.; Li, X.; Song, Z.; et al. PD1/PD-L1 blockade in clear cell renal cell carcinoma: Mechanistic insights, clinical efficacy, and future perspectives. Mol. Cancer 2024, 23, 146. [Google Scholar] [CrossRef]
  7. Hwang, A.; Mehra, V.; Chhetri, J.; Ali, S.; Tran, M.; Roddie, C. Current Treatment Options for Renal Cell Carcinoma: Focus on Cell-Based Immunotherapy. Cancers 2024, 16, 1209. [Google Scholar] [CrossRef]
  8. Miao, D.; Margolis, C.A.; Gao, W.; Voss, M.H.; Li, W.; Martini, D.J.; Norton, C.; Bosse, D.; Wankowicz, S.M.; Cullen, D.; et al. Genomic correlates of response to immune checkpoint therapies in clear cell renal cell carcinoma. Science 2018, 359, 801–806. [Google Scholar] [CrossRef]
  9. Pang, T.; Su, X.; Wakabayashi, S.; Shigekawa, M. Calcineurin homologous protein as an essential cofactor for Na+/H+ exchangers. J. Biol. Chem. 2001, 276, 17367–17372. [Google Scholar] [CrossRef]
  10. Di Sole, F.; Vadnagara, K.; Moe, O.W.; Babich, V. Calcineurin homologous protein: A multifunctional Ca2+-binding protein family. Am. J. Physiol. Ren. Physiol. 2012, 303, F165–F179. [Google Scholar] [CrossRef]
  11. Liu, Y.; Zaun, H.C.; Orlowski, J.; Ackerman, S.L. CHP1-mediated NHE1 biosynthetic maturation is required for Purkinje cell axon homeostasis. J. Neurosci. 2013, 33, 12656–12669. [Google Scholar] [CrossRef] [PubMed]
  12. Zhu, X.G.; Nicholson Puthenveedu, S.; Shen, Y.; La, K.; Ozlu, C.; Wang, T.; Klompstra, D.; Gultekin, Y.; Chi, J.; Fidelin, J.; et al. CHP1 Regulates Compartmentalized Glycerolipid Synthesis by Activating GPAT4. Mol. Cell 2019, 74, 45–58.e7. [Google Scholar] [CrossRef] [PubMed]
  13. Janzen, E.; Mendoza-Ferreira, N.; Hosseinibarkooie, S.; Schneider, S.; Hupperich, K.; Tschanz, T.; Grysko, V.; Riessland, M.; Hammerschmidt, M.; Rigo, F.; et al. CHP1 reduction ameliorates spinal muscular atrophy pathology by restoring calcineurin activity and endocytosis. Brain 2018, 141, 2343–2361. [Google Scholar] [CrossRef] [PubMed]
  14. Pang, T.; Wakabayashi, S.; Shigekawa, M. Expression of calcineurin B homologous protein 2 protects serum deprivation-induced cell death by serum-independent activation of Na+/H+ exchanger. J. Biol. Chem. 2002, 277, 43771–43777. [Google Scholar] [CrossRef]
  15. Gutierrez-Ford, C.; Levay, K.; Gomes, A.V.; Perera, E.M.; Som, T.; Kim, Y.M.; Benovic, J.L.; Berkovitz, G.D.; Slepak, V.Z. Characterization of tescalcin, a novel EF-hand protein with a single Ca2+-binding site: Metal-binding properties, localization in tissues and cells, and effect on calcineurin. Biochemistry 2003, 42, 14553–14565. [Google Scholar] [CrossRef]
  16. Tirosh, I.; Suva, M.L. Cancer cell states: Lessons from ten years of single-cell RNA-sequencing of human tumors. Cancer Cell 2024, 42, 1497–1506. [Google Scholar] [CrossRef]
  17. Alchahin, A.M.; Mei, S.; Tsea, I.; Hirz, T.; Kfoury, Y.; Dahl, D.; Wu, C.L.; Subtelny, A.O.; Wu, S.; Scadden, D.T.; et al. A transcriptional metastatic signature predicts survival in clear cell renal cell carcinoma. Nat. Commun. 2022, 13, 5747. [Google Scholar] [CrossRef]
  18. Yu, Z.; Lv, Y.; Su, C.; Lu, W.; Zhang, R.; Li, J.; Guo, B.; Yan, H.; Liu, D.; Yang, Z.; et al. Integrative Single-Cell Analysis Reveals Transcriptional and Epigenetic Regulatory Features of Clear Cell Renal Cell Carcinoma. Cancer Res. 2023, 83, 700–719. [Google Scholar] [CrossRef]
  19. Zvirblyte, J.; Nainys, J.; Juzenas, S.; Goda, K.; Kubiliute, R.; Dasevicius, D.; Kincius, M.; Ulys, A.; Jarmalaite, S.; Mazutis, L. Single-cell transcriptional profiling of clear cell renal cell carcinoma reveals a tumor-associated endothelial tip cell phenotype. Commun. Biol. 2024, 7, 780. [Google Scholar] [CrossRef]
  20. Zhang, C.; Du, Z.; Gao, Y.; Lim, K.S.; Zhou, W.; Huang, H.; He, H.; Xiao, J.; Xu, D.; Li, Q. Methionine secreted by tumor-associated pericytes supports cancer stem cells in clear cell renal carcinoma. Cell Metab. 2024, 36, 778–792.e710. [Google Scholar] [CrossRef]
  21. Van de Sande, B.; Lee, J.S.; Mutasa-Gottgens, E.; Naughton, B.; Bacon, W.; Manning, J.; Wang, Y.; Pollard, J.; Mendez, M.; Hill, J.; et al. Applications of single-cell RNA sequencing in drug discovery and development. Nat. Rev. Drug Discov. 2023, 22, 496–520. [Google Scholar] [CrossRef]
  22. Meylan, M.; Petitprez, F.; Becht, E.; Bougouin, A.; Pupier, G.; Calvez, A.; Giglioli, I.; Verkarre, V.; Lacroix, G.; Verneau, J.; et al. Tertiary lymphoid structures generate and propagate anti-tumor antibody-producing plasma cells in renal cell cancer. Immunity 2022, 55, 527–541.e5. [Google Scholar] [CrossRef]
  23. Wolf, F.A.; Angerer, P.; Theis, F.J. SCANPY: Large-scale single-cell gene expression data analysis. Genome Biol. 2018, 19, 15. [Google Scholar] [CrossRef] [PubMed]
  24. Wolock, S.L.; Lopez, R.; Klein, A.M. Scrublet: Computational Identification of Cell Doublets in Single-Cell Transcriptomic Data. Cell Syst. 2019, 8, 281–291.e289. [Google Scholar] [CrossRef] [PubMed]
  25. Korsunsky, I.; Millard, N.; Fan, J.; Slowikowski, K.; Zhang, F.; Wei, K.; Baglaenko, Y.; Brenner, M.; Loh, P.R.; Raychaudhuri, S. Fast, sensitive and accurate integration of single-cell data with Harmony. Nat. Methods 2019, 16, 1289–1296. [Google Scholar] [CrossRef] [PubMed]
  26. Healy, J.; McInnes, L. Uniform manifold approximation and projection. Nat. Rev. Methods Primers 2024, 4, 82. [Google Scholar] [CrossRef]
  27. Traag, V.A.; Waltman, L.; van Eck, N.J. From Louvain to Leiden: Guaranteeing well-connected communities. Sci. Rep. 2019, 9, 5233. [Google Scholar] [CrossRef]
  28. Hu, C.; Li, T.; Xu, Y.; Zhang, X.; Li, F.; Bai, J.; Chen, J.; Jiang, W.; Yang, K.; Ou, Q.; et al. CellMarker 2.0: An updated database of manually curated cell markers in human/mouse and web tools based on scRNA-seq data. Nucleic Acids Res. 2023, 51, D870–D876. [Google Scholar] [CrossRef]
  29. Kumar, L.; Futschik, M.E. Mfuzz: A software package for soft clustering of microarray data. Bioinformation 2007, 2, 5–7. [Google Scholar] [CrossRef]
  30. Ashburner, M.; Ball, C.A.; Blake, J.A.; Botstein, D.; Butler, H.; Cherry, J.M.; Davis, A.P.; Dolinski, K.; Dwight, S.S.; Eppig, J.T.; et al. Gene ontology: Tool for the unification of biology. The Gene Ontology Consortium. Nat. Genet. 2000, 25, 25–29. [Google Scholar] [CrossRef]
  31. Yu, G.; Wang, L.G.; Han, Y.; He, Q.Y. clusterProfiler: An R package for comparing biological themes among gene clusters. OMICS 2012, 16, 284–287. [Google Scholar] [CrossRef]
  32. Harrow, J.; Frankish, A.; Gonzalez, J.M.; Tapanari, E.; Diekhans, M.; Kokocinski, F.; Aken, B.L.; Barrell, D.; Zadissa, A.; Searle, S.; et al. GENCODE: The reference human genome annotation for The ENCODE Project. Genome Res. 2012, 22, 1760–1774. [Google Scholar] [CrossRef]
  33. Chandrashekar, D.S.; Karthikeyan, S.K.; Korla, P.K.; Patel, H.; Shovon, A.R.; Athar, M.; Netto, G.J.; Qin, Z.S.; Kumar, S.; Manne, U.; et al. UALCAN: An update to the integrated cancer data analysis platform. Neoplasia 2022, 25, 18–27. [Google Scholar] [CrossRef] [PubMed]
  34. McClelland, R.A.; Finlay, P.; Walker, K.J.; Nicholson, D.; Robertson, J.F.; Blamey, R.W.; Nicholson, R.I. Automated quantitation of immunocytochemically localized estrogen receptors in human breast cancer. Cancer Res. 1990, 50, 3545–3550. [Google Scholar] [PubMed]
  35. Qiu, X.; Mao, Q.; Tang, Y.; Wang, L.; Chawla, R.; Pliner, H.A.; Trapnell, C. Reversed graph embedding resolves complex single-cell trajectories. Nat. Methods 2017, 14, 979–982. [Google Scholar] [CrossRef] [PubMed]
  36. Jin, S.; Plikus, M.V.; Nie, Q. CellChat for systematic analysis of cell–cell communication from single-cell transcriptomics. Nat. Protoc. 2025, 20, 180–219. [Google Scholar] [CrossRef]
  37. Biancalani, T.; Scalia, G.; Buffoni, L.; Avasthi, R.; Lu, Z.; Sanger, A.; Tokcan, N.; Vanderburg, C.R.; Segerstolpe, A.; Zhang, M.; et al. Deep learning and alignment of spatially resolved single-cell transcriptomes with Tangram. Nat. Methods 2021, 18, 1352–1362. [Google Scholar] [CrossRef]
  38. Pham, D.; Tan, X.; Balderson, B.; Xu, J.; Grice, L.F.; Yoon, S.; Willis, E.F.; Tran, M.; Lam, P.Y.; Raghubar, A.; et al. Robust mapping of spatiotemporal trajectories and cell-cell interactions in healthy and diseased tissues. Nat. Commun. 2023, 14, 7739. [Google Scholar] [CrossRef]
  39. Virtanen, P.; Gommers, R.; Oliphant, T.E.; Haberland, M.; Reddy, T.; Cournapeau, D.; Burovski, E.; Peterson, P.; Weckesser, W.; Bright, J.; et al. SciPy 1.0: Fundamental algorithms for scientific computing in Python. Nat. Methods 2020, 17, 261–272. [Google Scholar] [CrossRef]
  40. Satija, R.; Farrell, J.A.; Gennert, D.; Schier, A.F.; Regev, A. Spatial reconstruction of single-cell gene expression data. Nat. Biotechnol. 2015, 33, 495–502. [Google Scholar] [CrossRef]
  41. Kandasamy, P.; Gyimesi, G.; Kanai, Y.; Hediger, M.A. Amino acid transporters revisited: New views in health and disease. Trends Biochem. Sci. 2018, 43, 752–789. [Google Scholar] [CrossRef] [PubMed]
  42. Abramson, J.; Adler, J.; Dunger, J.; Evans, R.; Green, T.; Pritzel, A.; Ronneberger, O.; Willmore, L.; Ballard, A.J.; Bambrick, J.; et al. Accurate structure prediction of biomolecular interactions with AlphaFold 3. Nature 2024, 630, 493–500. [Google Scholar] [CrossRef] [PubMed]
  43. UniProt, C. UniProt: A worldwide hub of protein knowledge. Nucleic Acids Res. 2019, 47, D506–D515. [Google Scholar] [CrossRef]
  44. Yan, Y.; Tao, H.; He, J.; Huang, S.Y. The HDOCK server for integrated protein-protein docking. Nat. Protoc. 2020, 15, 1829–1852. [Google Scholar] [CrossRef]
  45. Mooers, B.H.M. Shortcuts for faster image creation in PyMOL. Protein Sci. 2020, 29, 268–276. [Google Scholar] [CrossRef]
  46. Salentin, S.; Schreiber, S.; Haupt, V.J.; Adasme, M.F.; Schroeder, M. PLIP: Fully automated protein-ligand interaction profiler. Nucleic Acids Res. 2015, 43, W443–W447. [Google Scholar] [CrossRef]
  47. Rauluseviciute, I.; Riudavets-Puig, R.; Blanc-Mathieu, R.; Castro-Mondragon, J.A.; Ferenc, K.; Kumar, V.; Lemma, R.B.; Lucas, J.; Cheneby, J.; Baranasic, D.; et al. JASPAR 2024: 20th anniversary of the open-access database of transcription factor binding profiles. Nucleic Acids Res. 2024, 52, D174–D182. [Google Scholar] [CrossRef]
  48. Friesner, R.A.; Banks, J.L.; Murphy, R.B.; Halgren, T.A.; Klicic, J.J.; Mainz, D.T.; Repasky, M.P.; Knoll, E.H.; Shelley, M.; Perry, J.K.; et al. Glide: A new approach for rapid, accurate docking and scoring. 1. Method and assessment of docking accuracy. J. Med. Chem. 2004, 47, 1739–1749. [Google Scholar] [CrossRef]
  49. Jo, S.; Kim, T.; Iyer, V.G.; Im, W. CHARMM-GUI: A web-based graphical user interface for CHARMM. J. Comput. Chem. 2008, 29, 1859–1865. [Google Scholar] [CrossRef]
  50. Mark, P.; Nilsson, L. Structure and dynamics of the TIP3P, SPC, and SPC/E water models at 298 K. J. Phys. Chem. A 2001, 105, 9954–9960. [Google Scholar] [CrossRef]
  51. Dong, Y.; Gao, Y.; Ilie, A.; Kim, D.; Boucher, A.; Li, B.; Zhang, X.C.; Orlowski, J.; Zhao, Y. Structure and mechanism of the human NHE1-CHP1 complex. Nat. Commun. 2021, 12, 3474. [Google Scholar] [CrossRef] [PubMed]
  52. Rajasekaran, S.A.; Ball, W.J., Jr.; Bander, N.H.; Liu, H.; Pardee, J.D.; Rajasekaran, A.K. Reduced expression of beta-subunit of Na,K-ATPase in human clear-cell renal cell carcinoma. J. Urol. 1999, 162, 574–580. [Google Scholar] [CrossRef] [PubMed]
  53. Selvakumar, P.; Owens, T.A.; David, J.M.; Petrelli, N.J.; Christensen, B.C.; Lakshmikuttyamma, A.; Rajasekaran, A.K. Epigenetic silencing of Na,K-ATPase beta 1 subunit gene ATP1B1 by methylation in clear cell renal cell carcinoma. Epigenetics 2014, 9, 579–586. [Google Scholar] [CrossRef]
  54. Krishtal, O. The ASICs: Signaling molecules? Modulators? Trends Neurosci. 2003, 26, 477–483. [Google Scholar] [CrossRef]
  55. Li, Y.; Xu, G.; Huang, K.; Wang, J.; Zhang, J.; Liu, J.; Wang, Z.; Chen, G. Alteration of ASIC1 expression in clear cell renal cell carcinoma. OncoTargets Ther. 2015, 8, 2121–2127. [Google Scholar] [CrossRef]
  56. Zhang, Z.; Tang, Y.; Li, L.; Yang, W.; Xu, Y.; Zhou, J.; Ma, K.; Zhang, K.; Zhuang, H.; Gong, Y.; et al. Downregulation of FXYD2 Is Associated with Poor Prognosis and Increased Regulatory T Cell Infiltration in Clear Cell Renal Cell Carcinoma. J. Immunol. Res. 2022, 2022, 4946197. [Google Scholar] [CrossRef]
  57. Moore, P.J.; Tarran, R. The epithelial sodium channel (ENaC) as a therapeutic target for cystic fibrosis lung disease. Expert. Opin. Ther. Targets 2018, 22, 687–701. [Google Scholar] [CrossRef]
  58. Zheng, Q.; Wang, Y.; Zhao, R.; Han, P.; Zhao, J.; Li, L.; Zhou, X.; Li, P.; Mo, Y.; Pan, X.; et al. Inactivation of epithelial sodium ion channel molecules serves as effective diagnostic biomarkers in clear cell renal cell carcinoma. Genes. Genom. 2023, 45, 855–866. [Google Scholar] [CrossRef]
  59. Sweadner, K.J.; Wetzel, R.K.; Arystarkhova, E. Genomic organization of the human FXYD2 gene encoding the gamma subunit of the Na,K-ATPase. Biochem. Biophys. Res. Commun. 2000, 279, 196–201. [Google Scholar] [CrossRef]
  60. Geering, K. Function of FXYD proteins, regulators of Na, K-ATPase. J. Bioenerg. Biomembr. 2005, 37, 387–392. [Google Scholar] [CrossRef]
  61. Cordeiro, B.M.; Leite Fontes, C.F.; Meyer-Fernandes, J.R. Molecular Basis of Na, K-ATPase Regulation of Diseases: Hormone and FXYD2 Interactions. Int. J. Mol. Sci. 2024, 25, 13398. [Google Scholar] [CrossRef]
  62. Somsuan, K.; Aluksanasuwan, S. Bioinformatic analyses reveal the prognostic significance and potential role of ankyrin 3 (ANK3) in kidney renal clear cell carcinoma. Genom. Inf. Inform. 2023, 21, e22. [Google Scholar] [CrossRef] [PubMed]
  63. Kim, Y.; Ko, J.Y.; Kong, H.K.; Lee, M.; Chung, W.; Lim, S.; Son, D.; Oh, S.; Park, J.W.; Kim, D.Y.; et al. Hypomethylation of ATP1A1 Is Associated with Poor Prognosis and Cancer Progression in Triple-Negative Breast Cancer. Cancers 2024, 16, 1666. [Google Scholar] [CrossRef] [PubMed]
  64. Bao, Y.; Guo, Y.; Yang, Y.; Wei, X.; Zhang, S.; Zhang, Y.; Li, K.; Yuan, M.; Guo, D.; Macias, V.; et al. PRSS8 suppresses colorectal carcinogenesis and metastasis. Oncogene 2019, 38, 497–517. [Google Scholar] [CrossRef] [PubMed]
  65. Xi, D.; Wang, J.; Yang, Y.; Ji, F.; Li, C.; Yan, X. A novel natural killer-related signature to effectively predict prognosis in hepatocellular carcinoma. BMC Med. Genom. 2023, 16, 211. [Google Scholar] [CrossRef]
  66. Wu, Y.; Chen, J.; Zhu, R.; Huang, G.; Zeng, J.; Yu, H.; He, Z.; Han, C. Integrating TCGA and Single-Cell Sequencing Data for Hepatocellular Carcinoma: A Novel Glycosylation (GLY)/Tumor Microenvironment (TME) Classifier to Predict Prognosis and Immunotherapy Response. Metabolites 2024, 14, 51. [Google Scholar] [CrossRef]
  67. Liao, E.C.; Law, C.H.; Chen, H.Y.; Wei, Y.S.; Tsai, Y.T.; Lin, L.H.; Lin, M.W.; Wang, Y.S.; Chou, H.C.; Chan, H.L. PPIA enhances cell growth and metastasis through CD147 in oral cancer. Arch. Biochem. Biophys. 2025, 765, 110328. [Google Scholar] [CrossRef]
  68. Nyalali, A.M.K.; Leonard, A.U.; Xu, Y.; Li, H.; Zhou, J.; Zhang, X.; Rugambwa, T.K.; Shi, X.; Li, F. CD147: An integral and potential molecule to abrogate hallmarks of cancer. Front. Oncol. 2023, 13, 1238051. [Google Scholar] [CrossRef]
  69. Zhou, F.F.; Xie, W.; Chen, S.Q.; Wang, X.K.; Liu, Q.; Pan, X.K.; Su, F.; Feng, M.H. SLC38A1 promotes proliferation and migration of human colorectal cancer cells. J. Huazhong Univ. Sci. Technol. Med. Sci. 2017, 37, 30–36. [Google Scholar] [CrossRef]
  70. Liu, L.; Su, S.; Ye, D.; Yu, Z.; Lu, W.; Li, X. Long non-coding RNA OGFRP1 regulates cell proliferation and ferroptosis by miR-299-3p/SLC38A1 axis in lung cancer. Anticancer. Drugs 2022, 33, 826–839. [Google Scholar] [CrossRef]
  71. Feng, H.G.; Wu, C.X.; Zhong, G.C.; Gong, J.P.; Miao, C.M.; Xiong, B. Integrative analysis reveals that SLC38A1 promotes hepatocellular carcinoma development via PI3K/AKT/mTOR signaling via glutamine mediated energy metabolism. J. Cancer Res. Clin. Oncol. 2023, 149, 15879–15898. [Google Scholar] [CrossRef]
  72. Wang, K.; Cao, F.; Fang, W.; Hu, Y.; Chen, Y.; Ding, H.; Yu, G. Activation of SNAT1/SLC38A1 in human breast cancer: Correlation with p-Akt overexpression. BMC Cancer 2013, 13, 343. [Google Scholar] [CrossRef]
  73. Li, S.; Zhang, Z.; Li, Z.; Yang, L.; Liu, J.; Liu, Y.; Liu, Y.; Hou, Y.; Mei, M.; Huang, Y. CENPA promotes glutamine metabolism and tumor progression by up-regulating SLC38A1 in endometrial cancer. Cell. Signal. 2024, 117, 111110. [Google Scholar] [CrossRef] [PubMed]
  74. Fu, Q.; Xu, L.; Wang, Y.; Jiang, Q.; Liu, Z.; Zhang, J.; Zhou, Q.; Zeng, H.; Tong, S.; Wang, T.; et al. Tumor-associated Macrophage-derived Interleukin-23 Interlinks Kidney Cancer Glutamine Addiction with Immune Evasion. Eur. Urol. 2019, 75, 752–763. [Google Scholar] [CrossRef] [PubMed]
  75. Nahar, L.; Al-Groshi, A.; Kumar, A.; Sarker, S.D. Arbutin: Occurrence in Plants, and Its Potential as an Anticancer Agent. Molecules 2022, 27, 8786. [Google Scholar] [CrossRef]
  76. Savage, D.G.; Antman, K.H. Imatinib mesylate--a new oral targeted therapy. N. Engl. J. Med. 2002, 346, 683–693. [Google Scholar] [CrossRef] [PubMed]
  77. Sliwinska-Hill, U. Interaction of imatinib mesylate with human serum transferrin: The comparative spectroscopic studies. Spectrochim. Acta A Mol. Biomol. Spectrosc. 2017, 173, 468–475. [Google Scholar] [CrossRef]
Figure 1. scRNA-seq data collection and identification of cellular subpopulations. (A) Overview of the clinical metadata from four integrated scRNA-seq datasets. The flowchart summarizes the number of cells and samples in each dataset, as well as combined statistics including gender, age, and WHO/ISUP grade distribution. (B) UMAP projection of 534,227 cells from 64 primary tumor and 26 adjacent normal kidney tissue samples. Each dot represents one cell, and different colors indicate distinct cell subpopulations. (C) UMAP plot showing the origin of cells based on the source dataset (GSE178481, GSE207493, GSE242299, or PRJNA917036). Each dataset is represented by a unique color. (D) UMAP plot illustrating the distribution of cells by tumor WHO/ISUP grade, including both adjacent normal and primary tumor tissues. Each cell is colored according to its associated grade. (E) Dot plot displaying the expression patterns of the top three marker genes for each of the seven cell types. The cell counts per type are shown on the right. (F) Bar plot summarizing the relative abundance of each cell type across WHO/ISUP grades. Each bar is segmented by color to represent different cell subpopulations.
Biomolecules 15 01019 g001
Figure 2. Gene expression profiling of epithelial subpopulations during malignant progression in ccRCC. (A) Mfuzz clustering of epithelial cell gene expression across WHO/ISUP tumor grades reveals ten distinct expression patterns. Each curve represents the temporal trend of an individual gene. (B) GO enrichment analysis of gene clusters identified by Mfuzz. (C) Network diagram of genes involved in the “sodium ion transport” pathway. Red-labeled genes are expressed in more than 10% of epithelial cells, highlighting them as potential key regulators. (D) Dot plot showing the expression levels of five representative sodium ion transport-related genes (CHP1, FXYD2, ANK3, ATP1A1, and PRSS8) across WHO/ISUP grades. The dot color indicates average gene expression, and the cell counts for each grade are summarized on the right.
Biomolecules 15 01019 g002
Figure 3. Downregulation of sodium ion transport-related genes in malignant tumor cells and prognostic significance of CHP1 in ccRCC. (A) CNV analysis comparing primary ccRCC and adjacent normal kidney tissues. CNV scores are color-coded by chromosome, with red indicating DNA gains and blue indicating DNA losses. (B) UMAP projections displaying the distribution of malignant versus non-malignant epithelial cells, WHO/ISUP tumor grades, and the expression of five sodium ion transport-related genes (CHP1, FXYD2, ANK3, ATP1A1, PRSS8) and the immune checkpoint marker CD274. The gene expression values have been normalized based on transcript count. (C) Heatmap of CHP1 expression across different cell types and tumor grades. The color intensity reflects the average expression level. (D) Box plot comparing CHP1 expression between adjacent normal kidney tissues (n = 72) and ccRCC tissues (n = 542) in the TCGA-KIRC cohort. Expression values are presented as log2 (TPM + 1); individual dots represent samples. Blue and red dots denote normal and tumor tissues, respectively. (E) KM survival curve of OS in the TCGA-KIRC cohort, stratified by CHP1 expression level. Red and green lines represent CHP1-Low and CHP1-High groups, respectively.
Biomolecules 15 01019 g003
Figure 4. Reduced CHP1 protein expression in ccRCC tissues and cell lines. (A) IHC staining showing CHP1 protein expression in matched ccRCC and adjacent normal kidney tissues. (B) IHC staining comparing CHP1 protein levels in unmatched ccRCC and adjacent normal tissues. (C) IHC results stratified by clinical stage, illustrating CHP1 expression in ccRCC tissues with stages < 2 and ≥2. Scale bar = 50 μm (magnified images). (D) Quantitative analysis of IHC H-scores in 80 matched ccRCC and adjacent kidney tissue pairs. Each dot represents an individual sample. (E) CHP1 protein expression levels in the CPTAC dataset, comparing between ccRCC and adjacent normal kidney tissues using the Wilcoxon rank-sum test. Blue and red indicate adjacent kidney and ccRCC tissues, respectively. (F) Western blot analysis of CHP1 protein levels in 769-P, A498, Caki-1, and 786-O cells relative to HK-2 cells. The original Western blot images can be found in the Supplementary Materials.
Biomolecules 15 01019 g004
Figure 5. Association between CHP1 expression, clinicopathological features, and OS in ccRCC. (A) Forest plot of univariate Cox regression analysis in the TCGA-KIRC cohort, showing the hazard ratios (HRs) and p-values for CHP1 expression and clinical variables. (B) Forest plot of multivariate Cox regression analysis displaying the HRs and p-values for the independent variables—CHP1 expression, age, and TNM stage. (C) Prognostic nomogram constructed using CHP1 expression, age, and pathological TNM stage to estimate the 1-, 3-, and 5-year OS probabilities in ccRCC patients. (D) Calibration curves comparing predicted versus observed OS probabilities at 1, 3, and 5 years, demonstrating the predictive accuracy of the nomogram.
Biomolecules 15 01019 g005
Figure 6. Gradual decrease in CHP1 expression along the developmental trajectory of tumor cells. (A) Pseudotime trajectory of ccRCC tumor cells inferred using Monocle2. Each dot represents a single cell, colored according to pseudotime progression. Numbers in black circles indicate branch points along the trajectory. (B) Distribution of WHO/ISUP tumor grades mapped onto the pseudotime trajectory. Each dot represents a single cell, with different colors corresponding to different WHO/ISUP grades. (C) Cell group classification along the developmental trajectory. Left: cell stages are colored according to group identity; right: corresponding pie charts displaying the proportion of cells for each WHO/ISUP grade. (D) Expression dynamics of CHP1 along the pseudotime trajectory. Each dot represents a single cell, with the color intensity reflecting the expression level of CHP1. (E) The relationship between CNV burden and CHP1 expression.
Biomolecules 15 01019 g006
Figure 7. Impact of CHP1 expression on cell–cell communication in the ccRCC tumor microenvironment. (A) Heatmap showing the strength of outgoing and incoming signaling interactions among seven cell populations. Variation in color intensity represents communication probability. The top bar plot summarizes the total incoming and outgoing signal strengths for each cell population, while the right bar plot indicates the overall contribution of each signaling pathway. (B) Dot plot depicting ligand-derived signals from CHP1neg and CHP1pos tumor cells to six other cell types. Dot color represents communication probability, and dot size reflects statistical significance (p < 0.01). (C) Spatial co-localization analysis using the MISTy framework for three genes (CHP1, peptidylprolyl isomerase A (PPIA), basigin (BSG)) and three cell populations (NK and T cells, B cells, macrophages). Each dot represents a spatial location within the tissue. Red boxes highlight regions where gene expression and cell populations are co-localized. Axes denote spatial coordinates; gene values indicate expression levels, and cell-type values represent spatial deconvolution scores derived from integrated scRNA-seq data.
Biomolecules 15 01019 g007
Figure 8. CHP1 expression influences amino acid transport in tumor cells. (A) Differential expression analysis comparing CHP1neg and CHP1pos tumor cells. Each dot represents an individual gene. (B) GSEA of DEGs between CHP1neg and CHP1pos tumor cells. The colors in the ridge plot correspond to adjusted p-values for pathway enrichment. (C) Structural visualization of the predicted protein–protein interaction between CHP1 and SLC38A1 using PyMOL. The lower left panel summarizes binding free energy (MM/GBSA), docking score, and confidence score. The right panel shows the predicted non-covalent interactions based on PLIP analysis. Color scheme: SLC38A1 (purple), CHP1 (blue); hydrogen bonds (blue solid lines), hydrophobic interactions (gray dashed lines), and salt bridges (yellow dashed lines). (D) CHP1 interacts with SLC38A1. Lysates of HEK-293T cells transfected with FLAG-tagged CHP1 were subjected to immunoprecipitation with anti-FLAG antibody, followed by immunoblotting with anti-FLAG and anti-SLC38A1 antibodies, respectively. The original Western blot images can be found in the Supplementary Materials.
Biomolecules 15 01019 g008
Figure 9. (A) The JASPAR database predicted a putative ZNF460 binding site within the CHP1 promoter region. (B) Luciferase reporter assay confirmed the direct binding of ZNF460 to the CHP1 promoter. (Data are presented as the mean ± SD, *** p < 0.001 and ns, no significance).
Biomolecules 15 01019 g009
Figure 10. Molecular docking analysis of FDA-approved compounds with the CHP1 protein. (A) Predicted binding mode of arbutin with CHP1. (B) Predicted binding mode of imatinib mesylate with CHP1. Top left: docking score; center: chemical structure. Color coding: orange = negative charge; purple = positive charge; white = glycine; green = hydrophobic region; blue = polar region. Interaction types: purple solid lines = hydrogen bonds; blue–red solid lines = salt bridges; red lines = π–cation interactions. (C) Root-mean-square deviation (RMSD) analysis, (D) Radius of gyration (Rg) analysis, (E) Solvent-accessible surface area (SASA) analysis, (F) Hydrogen bond analysis, (G) Root mean square fluctuation (RMSF) analysis of CHP1–arbutin and CHP1–imatinib mesylate.
Biomolecules 15 01019 g010
Disclaimer/Publisher’s Note: The statements, opinions and data contained in all publications are solely those of the individual author(s) and contributor(s) and not of MDPI and/or the editor(s). MDPI and/or the editor(s) disclaim responsibility for any injury to people or property resulting from any ideas, methods, instructions or products referred to in the content.

