Abstract
The tumor suppressor gene NKX3.1 and the LPL gene are located in close proximity on chromosome 8, and their deletion has been reported in multiple studies. However, the significance of LPL loss may be misinterpreted due to its co-deletion with NKX3.1, a well-established event in prostate carcinogenesis. This study investigates whether LPL deletion represents a biologically relevant event or occurs merely as a bystander to NKX3.1 loss. We analyzed 28 formalin-fixed paraffin-embedded prostate cancer samples with confirmed LPL deletion and 28 without. Immunohistochemical staining was performed, and previously published whole-genome sequencing data from 103 prostate cancer patients were reanalyzed. Deletion of the 8p21.3 region was associated with higher Gleason grade groups. While NKX3.1 expression was significantly reduced in prostate cancer compared to benign prostatic hyperplasia, LPL protein expression showed no significant difference between cancerous and benign tissue, nor was it affected by the 8p21.3 deletion status. Copy number analysis confirmed the co-deletion of NKX3.1 and LPL in 54 patients. Notably, NKX3.1 loss without accompanying LPL deletion was observed in eight additional cases. These findings suggest that LPL deletion is a passenger event secondary to NKX3.1 loss and underscore the importance of cautious interpretation of cytogenetic findings involving the LPL locus.
1. Introduction
Although the incidence of prostate cancer continues to rise and its mortality rate remains steady, it is now widely recognized as a manageable disease. The ability to diagnose prostate cancer at an early stage has significantly contributed to this trend, allowing for effective treatment before metastasis occurs. However, prostate cancer remains a major health burden and is the second-leading cause of cancer death in developed countries [1,2].
The NKX3.1 gene is a tumor suppressor gene that plays a key role in regulating prostate development and function, helping to prevent tumor formation. The NKX3.1 gene regulates prostate cell proliferation, which is important for maintaining regular prostate size [3]. It also supports the differentiation of prostate cells, which is essential for normal prostate functioning. It is involved in DNA damage repair, a critical process for preventing mutations that could lead to tumor formation. NKX3.1 interacts with other proteins involved in cellular processes such as the cell cycle and apoptosis [4]. Mutations or reduced expression of NKX3.1 can dysregulate these processes and may contribute to the development of prostate cancer. Therefore, NKX3.1 is considered a key factor in maintaining healthy prostate and preventing its malignant transformation [5]. Deletion of the NKX3.1 gene disrupts normal prostate epithelium, initiating the oncogenic cascade [3].
The LPL gene encodes the enzyme lipoprotein lipase, which is crucial for lipid metabolism. This enzyme hydrolyzes triglycerides in lipoproteins (such as chylomicrons and very low-density lipoproteins—VLDL), releasing fatty acids and glycerol to be used by the body’s cells. LPL activity is essential for maintaining normal levels of triglycerides and other lipids in the blood [6]. Mutations in the LPL gene can lead to hyperlipidemia, which increases the risk of atherosclerosis and cardiovascular diseases. The released fatty acids are either oxidized for energy or stored in adipose tissue, making lipoprotein lipase a significant player in energy metabolism and fat storage [7]. Lipoprotein lipase in the prostate contributes to local lipid metabolism [8]. It hydrolyzes triglycerides into free fatty acids and glycerol, which can be used for energy or as building blocks for cell membrane synthesis. Fatty acids obtained through LPL activity can serve as signaling molecules that regulate cell proliferation and growth, which is important for maintaining the health and regeneration of prostate tissue [9]. In the context of prostate cancer, increased LPL activity may promote tumor cell growth. Tumor cells often display altered lipid metabolism, characterized by increased lipolysis and the use of fatty acids as both an energy source and building blocks for rapid cell division. Lipids and fatty acids can also influence hormonal signaling in the prostate, which is sensitive to androgens. In this way, LPL can indirectly affect the growth and function of prostate cells by modifying the lipid environment [10].
NKX3.1 is located in the 8p21.2 region, while LPL is in the 8p21.3 region, only 3.7 Mbp apart [11]. An established cytogenetic probe against the LPL locus has been repeatedly used in prostate cancer research [9,12,13,14]. This study aims to demonstrate that deletion of the LPL gene, frequently mentioned in prostate cancer research, occurs incidentally alongside the tumor suppressor NKX3.1, a well-known event in prostate carcinogenesis. This finding could enhance the understanding and interpretation of cytogenetic results with the LPL probe.
2. Materials and Methods
2.1. Patients
Our cohort includes 56 patients (Table 1), who were assessed for the expression of NKX3.1 and LPL proteins by immunohistochemistry on the same paraffin blocks used for FISH testing (Table S1). Twenty-eight patients with a confirmed LPL (8p21.3) deletion were selected, along with 28 control patients with normal status.

Table 1.
Patients’ characteristics with known LPL (8p21.3) deletion status (N = 56).
The second cohort has previously been published by Camacho et al. [15]. These authors performed the whole-genome DNA sequencing of 103 prostate cancer patients, and the most frequent copy number variation (loss in 62 patients) was found at 8p21.3–p21.2, where 16 genes are located, including NKX3.1 and LPL (Table S2). The corresponding author, Professor Daniel S. Brewer, kindly provided us with the complete data, which enabled us to perform our reanalysis (see below).
2.2. Immunohistochemistry
Immunohistochemistry was conducted on formalin-fixed, paraffin-embedded (FFPE) samples obtained from radical prostatectomy. Paraffin sections, 5 μm thick and stretched on electrostatic slides, underwent staining using a Ventana BenchMark Ultra automated stainer (Roche, Rotkreuz, Switzerland). The monoclonal rabbit antibody NKX3.1 (clone EP356, catalogue number 07859759001, ready-to-use, Cell Marque, Roche, Rotkreuz, Switzerland) was applied with an incubation period of 20 min. Additionally, the monoclonal mouse LPL antibody (clone OTI3A10, catalogue number NBP2-01395, Novus Biological, Centennial, CO, USA) was diluted at 1:150, with an incubation time of 60 min. The evaluation of both proteins utilized the final histoscore, derived from the product of the percentage of positive cells and their staining intensity. Positive cells were categorized into intervals: 0 (negative), 25 (1–25% positive cells), 50 (26–50% positive cells), 75 (51–75% positive cells), and 100 (76–100% positive cells). Staining intensity was scored on a scale of 0 (negative), 1 (weakly positive), 2 (moderately positive), and 3 (strongly positive). Expression assessment was performed in the prostate cancer and benign prostatic hyperplasia. Using appropriate statistical methods, we also examined the correlation between age and Gleason Grade Groups for both NKX3.1 and LPL.
2.3. FISH
Fluorescence in situ hybridization (FISH) was performed on the same blocks used for immunohistochemistry. Prior to hybridization, slides are pretreated following Kreatech’s tissue Digestion Kit (Leica Biosystems, Deer Park, TX, USA) protocol: Bake the slides at 80 °C for 1–2 h. Deparaffinize the warm slides by soaking in xylene for 2 × 8 min. Rehydrate the slides by soaking them in 100%, 85%, and 70% ethanol for 3 min each. Wash with dH2O for 3 min at room temperature. Place slides in 0.01 M sodium citrate at 96–98 °C for 15 min. Rinse in dH2O for 3 min at room temperature. Cover the paraffin section with Pepsin Solution and incubate at room temperature for 30–35 min. Dehydrate the slides by soaking in 70%, 80%, and 100% ethanol for 1 min each. Air-dry and apply 10 µL of LPL/MYC/SE 8 CP probe (catalogue number KBI-00114, Kreatech Diagnostics, Leica Biosystems, Deer Park, TX, USA) on the paraffin section and cover with a cover slip. The coverslip was sealed with Fixogum rubber cement. Slide and probe were co-denatured at 80 °C for 5 min, followed by overnight hybridization at 37 °C in the ThermoBrite. The next morning, the slides were washed for 2 min in 0.4× SSC, 0.3% NP-40 at 72 °C for 2 min, and subsequently for 2 min in 2× SSC, 0.1% NP-40 at room temperature. Finally, slides were dehydrated in 70%, 80%, and 100% ethanol, air-dried and embedded using DAPI/Antifade, and covered with cover glass. The evaluation was based on 50–100 tumor nuclei and included the following criteria: Normal finding: <10% of cells with 3 or more signals and <55% of cells with 1 or 0 signals for CEP 8. Loss 8: >55% of cells with 1 or 0 signals for CEP 8. Loss 8p22: 8p22/CEP8 signal ratio < 0.85.
2.4. Reanalysis of WGS Data
We reanalyzed the whole-genome sequencing (WGS) data originally published by Camacho et al. [15], focusing on copy number variation (CNV) profiles. From their dataset, we selected patients who showed deletions on chromosome 8 that overlapped both of our genes of interest. The CNV regions were identified using their publicly available CNV call files, which we filtered based on genomic coordinates corresponding to these loci.
For downstream analysis, we used R (version 4.3.2) and several specialized packages. We used R\CNViz (version 1.14.0) [16] to visualize and interpret CNV calls, including plotting genome-wide and locus-specific copy number changes. The R\ggplot2 package (version 3.5.1) [17] was used for generating custom plots to illustrate CNV patterns across patient samples. Additionally, R\gggenes (version 0.5.1) was employed to create gene structure diagrams to map the positions of the genes of interest within the deleted regions.
2.5. Statistical Analysis
Numerical variables are presented as medians and ranges. Categorical variables are introduced as absolute and relative frequencies (%). Between-group differences are analyzed using the Mann–Whitney test or Fisher’s exact test. The paired Wilcoxon test is used to analyze differences in NKX3.1 and LPL protein histoscore between benign prostatic hyperplasia and prostate cancer. The association of selected parameters was visualized using a 100% stacked bar plot or paired boxplots. The significance level was set to 0.05, and the statistical analysis was performed using R software (version 4.3.2) with the maximum available data.
3. Results
3.1. LPL (8p21.3) Deletion Is Associated with a Poor Gleason Score
We analyzed a cohort of prostate cancer patients examined by FISH between 2007 and 2017, consisting of 28 patients with confirmed LPL (8p21.3) deletion and 28 patients without this aberration. Clinicopathological data are summarized in Table 1.
Notably, Gleason Grade Groups were significantly associated with the deletion status (p = 0.009, Table 1). Among patients without the LPL (8p21.3) deletion, less aggressive GG1–GG2 were predominant (86% of cases), while GG3–GG5 were found only in 14% of cases. However, among patients with the LPL (8p21.3) deletion, the percentage of GG3–GG5 (Gleason score 4 + 3 and higher) increased to 50%. This information suggests an association between the LPL (8p21.3) deletion and worse Gleason score, i.e., 4 + 3 and higher (GG3-GG5; Table 1).
3.2. Expression of NKX3.1 Is Decreased in Cancer in Comparison to Benign Prostatic Hyperplasia, but Without Relation to 8p21.3 Deletion
Immunohistochemistry for NKX3.1 and LPL proteins was performed on the same tissue blocks used for FISH (Figure 1 and Figure 2). NKX3.1 histoscore was significantly lower in carcinoma compared to benign hyperplasia in both patient groups, with (p < 0.001) and without 8p21.3 deletion (p < 0.001) (Figure 3). In contrast, LPL expression was very low and showed no significant association with tissue structure, cancer presence, or deletion status (Figure 4).
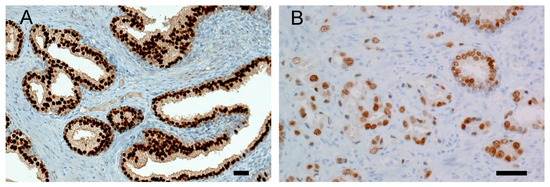
Figure 1.
Representative NKX3.1 immunohistochemistry: (A) Strong nuclear positivity of NKX3.1 is present in benign prostatic hyperplasia, histoscore 300. (B) Prostate cancer cells show reduced expression of NKX3.1 protein, histoscore 100. Malignant glands are smaller, irregular, more crowded, and lack branching and papillary infoldings. A scale bar represents 50 μm.
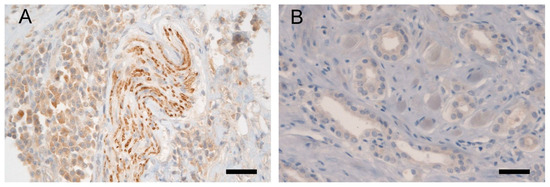
Figure 2.
Representative LPL immunohistochemistry: (A) Validation of the anti-LPL antibody in bladder tissue, showing positivity in nerve bundles (in the middle of the picture) and in bladder cells (predominantly on the left side in the picture); (B) Weak cytoplasmic expression of LPL protein in malignant cells of irregular glands in adenocarcinoma of the prostate, histoscore 50. A scale bar represents 50 μm.
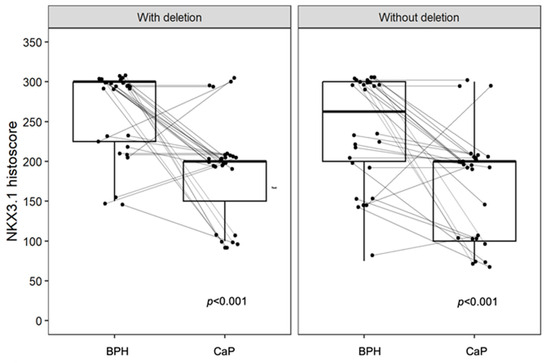
Figure 3.
The expression of NKX3.1 is decreased in CaP but shows no significant association with deletion status. A significant difference is observed in BPH compared to CaP in both groups, with a p-values < 0.001. Without deletion, there is a larger overlap in the distribution of data within the box plot, whereas with deletion, the data distribution is more distinctly separated. Box plots represent the median, 25–75% percentiles, and range of values. Histoscores for individual patients with BPH and CaP are also shown.
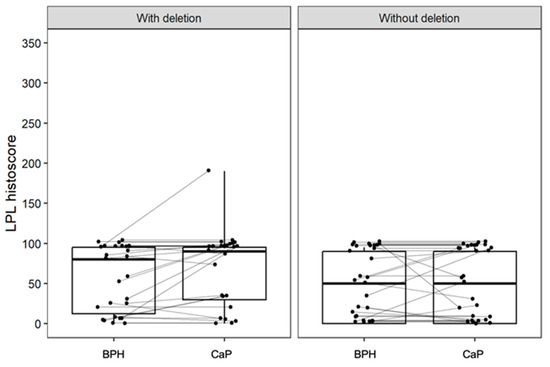
Figure 4.
The expression of LPL is low and is not significantly different between groups with and without deletion, and with respect to the tissue architecture (BPH or CaP). Box plots represent the median, 25–75% percentiles, and range of values. The histoscores for individual patients with BPH and CaP are also shown.
Similarly, low LPL expression was observed in publicly available single-cell sequencing data (Figure 5, [18,19]). These findings highlight the significant reduction in NKX3.1 protein expression, but not LPL, during the transition from benign to malignant prostate tissue, potentially driven by deletion and other mechanisms.
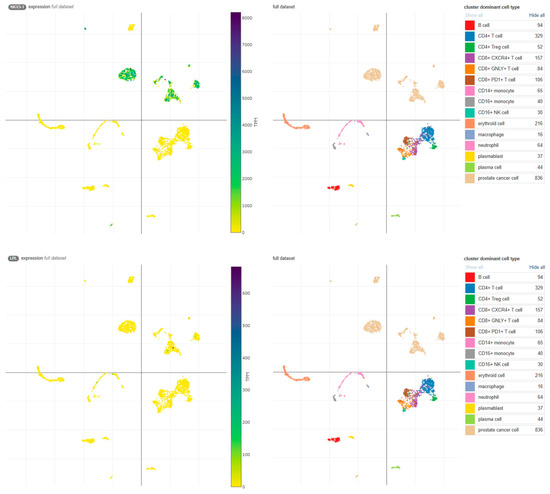
Figure 5.
Expression of NKX3.1 and LPL transcripts in the Single Cell Portal [18]. High NKX3.1 expression is observed in prostate cancer cells (upper panel), whereas LPL expression is limited to a few cells (lower panel). Data were obtained from the study ‘Transcriptional mediators of treatment resistance in lethal prostate cancer’ [19]. TPM, transcripts per million.
3.3. Whole-Genome Copy Number Analysis Shows Co-Deletion of LPL and NKX3.1 Genes
We did not perform a genetic analysis on our cohort. However, detailed results were publicly available from the whole-genome DNA sequencing of 103 prostate cancer patients [15]. The most frequent copy number variation (loss in 62 patients) was found at 8p21.3–p21.2, where 16 genes are located, including NKX3.1. Supplementary Materials for chromosome 8 also clearly displayed large deletions, affecting many more genes, presumably also the LPL [15]. Our reanalysis of complete data confirmed the co-deletion of NKX3.1 and LPL in 54 patients (Figure 6, pink reads). The remaining eight patients lost the NKX3.1 gene, but not LPL (Figure 6, blue reads).
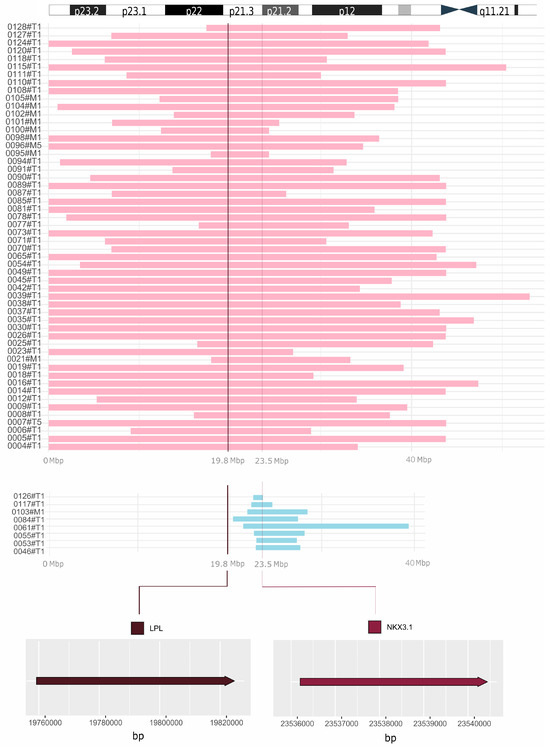
Figure 6.
Comprehensive visualization of deletions unveiled by reanalysis of WGS data. Co-deletion of NKX3.1 and LPL is displayed in pink (54 prostate cancer patients). The remaining 8 patients lost the NKX3.1 gene, but not LPL (blue reads). In the upper part of the figure, the short arm of chromosome 8 is depicted for a closer orientation of the position of the LPL and NKX3.1 genes. At the bottom, the exact locations of the LPL (chr8: 19,796,764–19,824,770) and NKX3.1 (chr8: 23,536,206–23,540,451) genes are shown. On the left, designation of samples from the study by Camacho et al. is provided [15]. T, tumor; M, metastasis; Mbp, megabase pairs.
4. Discussion
Our study presents a statistically significant association between the 8p21.3 deletion and the tumor’s Gleason Grade Groups. Among patients with the deletion, Gleason Grade Groups GG1–GG2 were as prevalent as GG3–GG5, whereas in patients without the deletion, GG1–GG2 predominated, with GG3–GG5 being less common. Similarly, Trock et al. addressed this relationship in their 2016 study, focusing on the GG3 component and various Gleason scores [20]. Gallucci et al. also reported a statistically significant relationship between the deletion of 8p21 and higher Gleason score [8]. Importantly, Kluth et al. performed a large study on chromosome 8 deletions with respect to prostate cancer prognosis [21]. Typically, these deletions involved the entire short arm of chromosome 8 and were associated with both an adverse Gleason score and shorter biochemical recurrence. The prognostic value of 8p deletion was further enhanced when PTEN deletion was also present (10q23.31).
Additionally, our study demonstrates a decline in the NKX3.1 histoscore in cancer compared to benign hyperplasia, irrespective of the presence or absence of the 8p21.3 deletion. Bethel et al. reported that NKX3.1 expression is reduced in atrophic areas, prostatic intraepithelial neoplasia (PIN), and adenocarcinoma compared to normal epithelium [22]. Similarly, our previous study also observed lower NKX3.1 intensity in PIN and prostate cancer regions in comparison to BPH [23]. While Bethel et al. identified an association between the 8p21.3 deletion and reduced NKX3.1 expression [22], our study did not reproduce this finding, potentially due to variations in immunohistochemical staining resulting from the slow fixation of prostate tissues [23,24]. Moreover, NKX3.1 expression may be influenced by methylation [25]. A substantial fraction of NKX3.1 target genes also overlap with direct targets of the oncoprotein Myc. It has been shown that NKX3.1 depletion cooperates with Myc overexpression to promote prostate cancer in transgenic mice [26]. Conversely, a certain level of NKX3.1 expression is retained even in metastatic lesions [27] and is essential for the survival of androgen-dependent prostate cancer cells [28]. Overall, NKX3.1 appears to function as a haploinsufficient tumor suppressor gene, where its reduced expression compromises normal cellular functions, contributing to tumor development [29,30].
Expression of LPL was low and without significant association with the tissue structure or the deletion status. Considering the importance of lipid metabolism for steroidogenesis and cancer growth [31], enhanced expression of LPL has been reported in advanced prostate cancer cell lines [32]. On the other hand, Kim et al. explored the hypothesis that LPL may be a tumor suppressor gene, inactivated by somatic deletion and hypermethylation in prostate cancer [33]. Hemizygous deletion of the LPL gene was observed in 45% of tumor samples, with promoter hypermethylation occurring in 45% of cases with the deletion and 22% without it. Kuemmerle et al. observed perinuclear LPL positivity in the small immunohistochemistry analysis of ten samples with their in-house antibody [34]. Importantly, they also found low LPL expression in all prostate cancer cell lines, which they explained with the frequent loss of the LPL locus due to a nearby tumor suppressor gene, however, without naming NKX3.1 [35].
Camacho et al. reported loss of the 8p21.3–8p21.2 region, which encompasses NKX3.1 and LPL, as the most frequent deletion in 62 out of 103 prostate cancer patients [15]. By reanalyzing the complete data, we showed the co-deletion of NKX3.1 and LPL in 54 out of 62 patients. Importantly, the remaining eight patients lost the NKX3.1 gene, but not LPL. The findings support the well-known role of NKX3.1 as a prostate tumor suppressor, while the LPL gene is often deleted alongside NKX3.1 due to their close proximity. Thus, the designation of LPL for the 8p21.3 probe may be considered misleading.
5. Conclusions
NKX3.1 expression was significantly lower in carcinoma than in benign hyperplasia, highlighting its role in cancer progression. In contrast, LPL expression was very low and showed no difference between BPH and cancer. While 8p21.3 deletion was associated with a poor Gleason score, it was not linked to NKX3.1 or LPL expression in our prostate cancer cohort. Beyond genetic loss, other mechanisms may contribute to NKX3.1 downregulation during carcinogenesis. Notably, genome copy number analysis confirmed the co-deletion of NKX3.1 and LPL in 54 of 62 patients, while the remaining 8 patients lost NKX3.1 but retained LPL. These findings reinforce NKX3.1’s well-established role as a prostate tumor suppressor, while suggesting that LPL is frequently deleted due to its proximity rather than functional significance. Thus, designating LPL for the 8p21.3 probe may be misleading.
Supplementary Materials
The following supporting information can be downloaded at: https://www.mdpi.com/article/10.3390/biom15060758/s1, Table S1: Results of immunohistochemistry; Table S2: Results of WGS reanalysis.
Author Contributions
Conceptualization, T.V., M.W. and J.B.; methodology, T.V., J.Ž. and J.B.; software, A.K. and J.S.; validation, T.V., M.W. and J.B.; formal analysis, T.V. and V.Ž.; investigation, T.V. and M.W.; resources, T.V., J.D., J.S. and J.B.; data curation, A.K. and J.S.; writing—original draft preparation, T.V., J.Ž., J.S. and J.B.; writing—review and editing, T.V., V.Ž., J.Ž. J.D., A.K., J.S., M.G. and J.B.; visualization, A.K. and J.S.; supervision, V.Ž., J.D. and J.B.; project administration, T.V.; funding acquisition, T.V., M.W. and V.Ž. All authors have read and agreed to the published version of the manuscript.
Funding
This study was supported by the Ministry of Health of the Czech Republic (grants no. NW24-03-00265, DRO FNOs/2020, and DRO FNOl00098892), MEYS and the European Regional Development Fund (DRO 61989592 and BBMRI-CZ No. CZ.02.1.01/0.0/0.0/16_013/0001674) and by the National Institute for Cancer Research (Programme EXCELES, project LX22NPO5102, funded by the European Union—Next Generation EU).
Institutional Review Board Statement
The study was conducted in accordance with the Declaration of Helsinki, and approved by the Ethical Committee of the University Hospital Ostrava (ref. no. 372/2020, 30 April 2020).
Informed Consent Statement
According to the Czech Law (Act. No. 373/11, and its amendment Act No. 202/17), it is not necessary to obtain informed consent in fully anonymized retrospective studies on formalin-fixed paraffin-embedded tissues. At least one tissue block for each patient was retained in the archive to allow future clinical use, such as re-evaluation or further studies.
Data Availability Statement
The original contributions presented in this study are included in the article. Further inquiries can be directed to the corresponding authors.
Acknowledgments
The authors would like to thank Daniel S. Brewer who kindly provided us with complete data from their study [15]. These data allowed us to test our hypothesis.
Conflicts of Interest
The authors declare no conflicts of interest.
Abbreviations
The following abbreviations are used in this manuscript: BPH, benign prostatic hyperplasia; CaP, prostate cancer; FISH, fluorescence in situ hybridization; FFPE, formalin-fixed paraffin-embedded; PIN, prostatic intraepithelial neoplasia; PSA, prostate-specific antigen; pT, pathological staging of the primary tumor; WGS, whole-genome sequencing.
References
- Elias, M.; Bouchal, J.; Kral, M.; Kurfurstova, D. Contemporary Review of Prognostic Markers of Prostate Cancer from a Pathologist Perspective. Biomed. Pap. 2025, 169, 1–12. [Google Scholar] [CrossRef] [PubMed]
- Kral, M.; Kurfurstova, D.; Zemla, P.; Elias, M.; Bouchal, J. New Biomarkers and Multiplex Tests for Diagnosis of Aggressive Prostate Cancer and Therapy Management. Front. Oncol. 2025, 15, 1542511. [Google Scholar] [CrossRef]
- Antao, A.M.; Ramakrishna, S.; Kim, K.S. The Role of Nkx3.1 in Cancers and Stemness. Int. J. Stem Cells 2021, 14, 168–179. [Google Scholar] [CrossRef] [PubMed]
- Song, L.N.; Bowen, C.; Gelmann, E.P. Structural and Functional Interactions of the Prostate Cancer Suppressor Protein NKX3.1 with Topoisomerase I. Biochem. J. 2013, 453, 125–136. [Google Scholar] [CrossRef]
- Abate-Shen, C.; Shen, M.M.; Gelmann, E. Integrating Differentiation and Cancer: The Nkx3.1 Homeobox Gene in Prostate Organogenesis and Carcinogenesis. Differentiation 2008, 76, 717–727. [Google Scholar] [CrossRef] [PubMed]
- Wu, S.A.; Kersten, S.; Qi, L. Lipoprotein Lipase and Its Regulators: An Unfolding Story. Trends Endocrinol. Metab. 2021, 32, 48–61. [Google Scholar] [CrossRef]
- Li, Y.; He, P.P.; Zhang, D.W.; Zheng, X.L.; Cayabyab, F.S.; Yin, W.D.; Tang, C.K. Lipoprotein Lipase: From Gene to Atherosclerosis. Atherosclerosis 2014, 237, 597–608. [Google Scholar] [CrossRef]
- Gallucci, M.; Merola, R.; Farsetti, A.; Orlandi, G.; Sentinelli, S.; De Carli, P.; Leonardo, C.; Carlini, P.; Guadagni, F.; Sperduti, I.; et al. Cytogenetic Profiles as Additional Markers to Pathological Features in Clinically Localized Prostate Carcinoma. Cancer Lett. 2006, 237, 76–82. [Google Scholar] [CrossRef]
- Gallucci, M.; Merola, R.; Leonardo, C.; De Carli, P.; Farsetti, A.; Sentinelli, S.; Sperduti, I.; Mottolese, M.; Carlini, P.; Vico, E.; et al. Genetic Profile Identification in Clinically Localized Prostate Carcinoma. Urol. Oncol. Semin. Orig. Investig. 2009, 27, 502–508. [Google Scholar] [CrossRef]
- Zeković, M.; Bumbaširević, U.; Živković, M.; Pejčić, T. Alteration of Lipid Metabolism in Prostate Cancer: Multifaceted Oncologic Implications. Int. J. Mol. Sci. 2023, 24, 1391. [Google Scholar] [CrossRef]
- Martin, F.J.; Amode, M.R.; Aneja, A.; Austine-Orimoloye, O.; Azov, A.G.; Barnes, I.; Becker, A.; Bennett, R.; Berry, A.; Bhai, J.; et al. Ensembl 2023. Nucleic Acids Res. 2023, 51, D933–D941. [Google Scholar] [CrossRef] [PubMed]
- König, J.J.; Teubel, W.; van Steenbrugge, G.J.; Romijn, J.C.; Hagemeijer, A. Characterization of chromosome 8 aberrations in the prostate cancer cell line LNCaP-FGC and sublines. Urol. Res. 1999, 27, 3–8. [Google Scholar] [CrossRef] [PubMed]
- Qian, J.; Hirasawa, K.; Bostwick, D.G.; Bergstralh, E.J.; Slezak, J.M.; Anderl, K.L.; Borell, T.J.; Lieber, M.M.; Jenkins, R.B. Loss of p53 and c-myc overrepresentation in stage T(2-3)N(1-3)M(0) prostate cancer are potential markers for cancer progression. Mod. Pathol. 2002, 15, 35–44. [Google Scholar] [CrossRef] [PubMed][Green Version]
- Zhang, Y.; Perez, T.; Blondin, B.; Du, J.; Liu, P.; Escarzaga, D.; Coon, J.S.; Morrison, L.E.; Pestova, K. Identification of FISH Biomarkers to Detect Chromosome Abnormalities Associated with Prostate Adenocarcinoma in Tumour and Field Effect Environment. BMC Cancer 2014, 14, 129. [Google Scholar] [CrossRef][Green Version]
- Camacho, N.; Van Loo, P.; Edwards, S.; Kay, J.D.; Matthews, L.; Haase, K.; Clark, J.; Dennis, N.; Thomas, S.; Kremeyer, B.; et al. Appraising the Relevance of DNA Copy Number Loss and Gain in Prostate Cancer Using Whole Genome DNA Sequence Data. PLoS Genet. 2017, 13, e1007001. [Google Scholar] [CrossRef] [PubMed]
- Ramesh, R.G.; Bigdeli, A.; Rushton, C.; Rosenbaum, J.N. CNViz: An R/Shiny Application for Interactive Copy Number Variant Visualization in Cancer. J. Pathol. Inform. 2022, 13, 100089. [Google Scholar] [CrossRef]
- Wilkinson, L. Ggplot2: Elegant Graphics for Data Analysis by WICKHAM, H. Biometrics 2011, 67, 678–679. [Google Scholar] [CrossRef]
- Tarhan, L.; Bistline, J.; Chang, J.; Galloway, B.; Hanna, E.; Weitz, E. Single Cell Portal: An Interactive Home for Single-Cell Genomics Data. bioRxiv 2023. [Google Scholar] [CrossRef]
- He, M.X.; Cuoco, M.S.; Crowdis, J.; Bosma-Moody, A.; Zhang, Z.; Bi, K.; Kanodia, A.; Su, M.J.; Ku, S.Y.; Garcia, M.M.; et al. Transcriptional Mediators of Treatment Resistance in Lethal Prostate Cancer. Nat. Med. 2021, 27, 426–433. [Google Scholar] [CrossRef]
- Trock, B.J.; Fedor, H.; Gurel, B.; Jenkins, R.B.; Knudsen, B.S.; Fine, S.W.; Said, J.W.; Carter, H.B.; Lotan, T.L.; De Marzo, A.M. PTEN Loss and Chromosome 8 Alterations in Gleason Grade 3 Prostate Cancer Cores Predicts the Presence of Un-Sampled Grade 4 Tumor: Implications for Active Surveillance. Mod. Pathol. 2016, 29, 764–771. [Google Scholar] [CrossRef]
- Kluth, M.; Amschler, N.N.; Galal, R.; Möller-Koop, C.; Barrow, P.; Tsourlakis, M.C.; Jacobsen, F.; Hinsch, A.; Wittmer, C.; Steurer, S.; et al. Deletion of 8p is an independent prognostic parameter in prostate cancer. Oncotarget 2017, 8, 379–392. [Google Scholar] [CrossRef]
- Bethel, C.R.; Faith, D.; Li, X.; Guan, B.; Hicks, J.L.; Lan, F.; Jenkins, R.B.; Bieberich, C.J.; De Marzo, A.M. Decreased NKX3.1 Protein Expression in Focal Prostatic Atrophy, Prostatic Intraepithelial Neoplasia, and Adenocarcinoma: Association with Gleason Score and Chromosome 8p Deletion. Cancer Res. 2006, 66, 10683–10690. [Google Scholar] [CrossRef] [PubMed]
- Kurfurstova, D.; Bartkova, J.; Vrtel, R.; Mickova, A.; Burdova, A.; Majera, D.; Mistrik, M.; Kral, M.; Santer, F.R.; Bouchal, J.; et al. DNA Damage Signalling Barrier, Oxidative Stress and Treatment-Relevant DNA Repair Factor Alterations during Progression of Human Prostate Cancer. Mol. Oncol. 2016, 10, 879–894. [Google Scholar] [CrossRef] [PubMed]
- Howat, W.J.; Wilson, B.A. Tissue Fixation and the Effect of Molecular Fixatives on Downstream Staining Procedures. Methods 2014, 70, 12–19. [Google Scholar] [CrossRef] [PubMed]
- Asatiani, E.; Huang, W.X.; Wang, A.; Rodriguez Ortner, E.; Cavalli, L.R.; Haddad, B.R.; Gelmann, E.P. Deletion, methylation, and expression of the NKX3.1 suppressor gene in primary human prostate cancer. Cancer Res. 2005, 65, 1164–1173. [Google Scholar] [CrossRef]
- Anderson, P.D.; McKissic, S.A.; Logan, M.; Roh, M.; Franco, O.E.; Wang, J.; Doubinskaia, I.; Van Der Meer, R.; Hayward, S.W.; Eischen, C.M.; et al. Nkx3.1 and Myc Crossregulate Shared Target Genes in Mouse and Human Prostate Tumorigenesis. J. Clin. Investig. 2012, 122, 1907–1919. [Google Scholar] [CrossRef]
- Gan, Q.; Joseph, C.T.; Guo, M.; Zhang, M.; Sun, X.; Gong, Y. Utility of NKX3.1 Immunostaining in the Detection of Metastatic Prostatic Carcinoma on Fine-Needle Aspiration Smears. Am. J. Clin. Pathol. 2019, 152, 495–501. [Google Scholar] [CrossRef]
- Tan, P.Y.; Chang, C.W.; Chng, K.R.; Wansa, K.D.; Sung, W.K.; Cheung, E. Integration of regulatory networks by NKX3-1 promotes androgen-dependent prostate cancer survival. Mol. Cell. Biol. 2012, 32, 399–414. [Google Scholar] [CrossRef]
- Inoue, K.; Fry, E.A. Haploinsufficient tumor suppressor genes. Adv. Med. Biol. 2017, 118, 83–122. [Google Scholar]
- Magee, J.A.; Abdulkadir, S.A.; Milbrandt, J. Haploinsufficiency at the Nkx3.1 locus. A paradigm for stochastic, dosage-sensitive gene regulation during tumor initiation. Cancer Cell 2003, 3, 273–283. [Google Scholar] [CrossRef]
- Neuwirt, H.; Bouchal, J.; Kharaishvili, G.; Ploner, C.; Jöhrer, K.; Pitterl, F.; Weber, A.; Klocker, H.; Eder, I.E. Cancer-Associated Fibroblasts Promote Prostate Tumor Growth and Progression through Upregulation of Cholesterol and Steroid Biosynthesis. Cell Commun. Signal. 2020, 18, 11. [Google Scholar] [CrossRef] [PubMed]
- Lazniewska, J.; Li, K.L.; Johnson, I.R.D.; Sorvina, A.; Logan, J.M.; Martini, C.; Moore, C.; Ung, B.S.Y.; Karageorgos, L.; Hickey, S.M.; et al. Dynamic Interplay between Sortilin and Syndecan-1 Contributes to Prostate Cancer Progression. Sci. Rep. 2023, 13, 13489. [Google Scholar] [CrossRef] [PubMed]
- Kim, J.W.; Cheng, Y.; Liu, W.; Li, T.; Yegnasubramanian, S.; Zheng, S.L.; Xu, J.; Isaacs, W.B.; Chang, B.L. Genetic and Epigenetic Inactivation of LPL Gene in Human Prostate Cancer. Int. J. Cancer 2009, 124, 734–738. [Google Scholar] [CrossRef]
- Kuemmerle, N.B.; Rysman, E.; Lombardo, P.S.; Flanagan, A.J.; Lipe, B.C.; Wells, W.A.; Pettus, J.R.; Froehlich, H.M.; Memoli, V.A.; Morganelli, P.M.; et al. Lipoprotein Lipase Links Dietary Fat to Solid Tumor Cell Proliferation. Mol. Cancer Ther. 2011, 10, 427–436. [Google Scholar] [CrossRef] [PubMed]
- Bova, G.S.; Carter, B.S.; Bussemakers, M.J.; Emi, M.; Fujiwara, Y.; Kyprianou, N.; Jacobs, S.C.; Robinson, J.C.; Epstein, J.I.; Walsh, P.C.; et al. Homozygous deletion and frequent allelic loss of chromosome 8p22 loci in human prostate cancer. Cancer Res. 1993, 53, 3869–3873. [Google Scholar] [PubMed]
Disclaimer/Publisher’s Note: The statements, opinions and data contained in all publications are solely those of the individual author(s) and contributor(s) and not of MDPI and/or the editor(s). MDPI and/or the editor(s) disclaim responsibility for any injury to people or property resulting from any ideas, methods, instructions or products referred to in the content. |
© 2025 by the authors. Licensee MDPI, Basel, Switzerland. This article is an open access article distributed under the terms and conditions of the Creative Commons Attribution (CC BY) license (https://creativecommons.org/licenses/by/4.0/).