1. Introduction
Pulmonary hypertension (PH) is defined as a mean pulmonary arterial pressure (mPAP) exceeding 20 mmHg at rest, measured by right heart catheterization at sea level. The elevated pulmonary artery pressure exacerbates right ventricular load, leading to right heart dysfunction and eventually right heart failure [
1]. Notably, HPH is the third subgroup of PH, with a worse prognosis and higher mortality among all subgroups of PH [
2]. Current therapies for PH primarily target the prostacyclin, nitric oxide (NO), and endothelin pathways. Although these pharmacological interventions provide symptomatic alleviation and confer modest survival benefits, they fail to reverse disease progression [
3]. Furthermore, therapeutic drugs with the above targets are not recommended for the treatment of HPH [
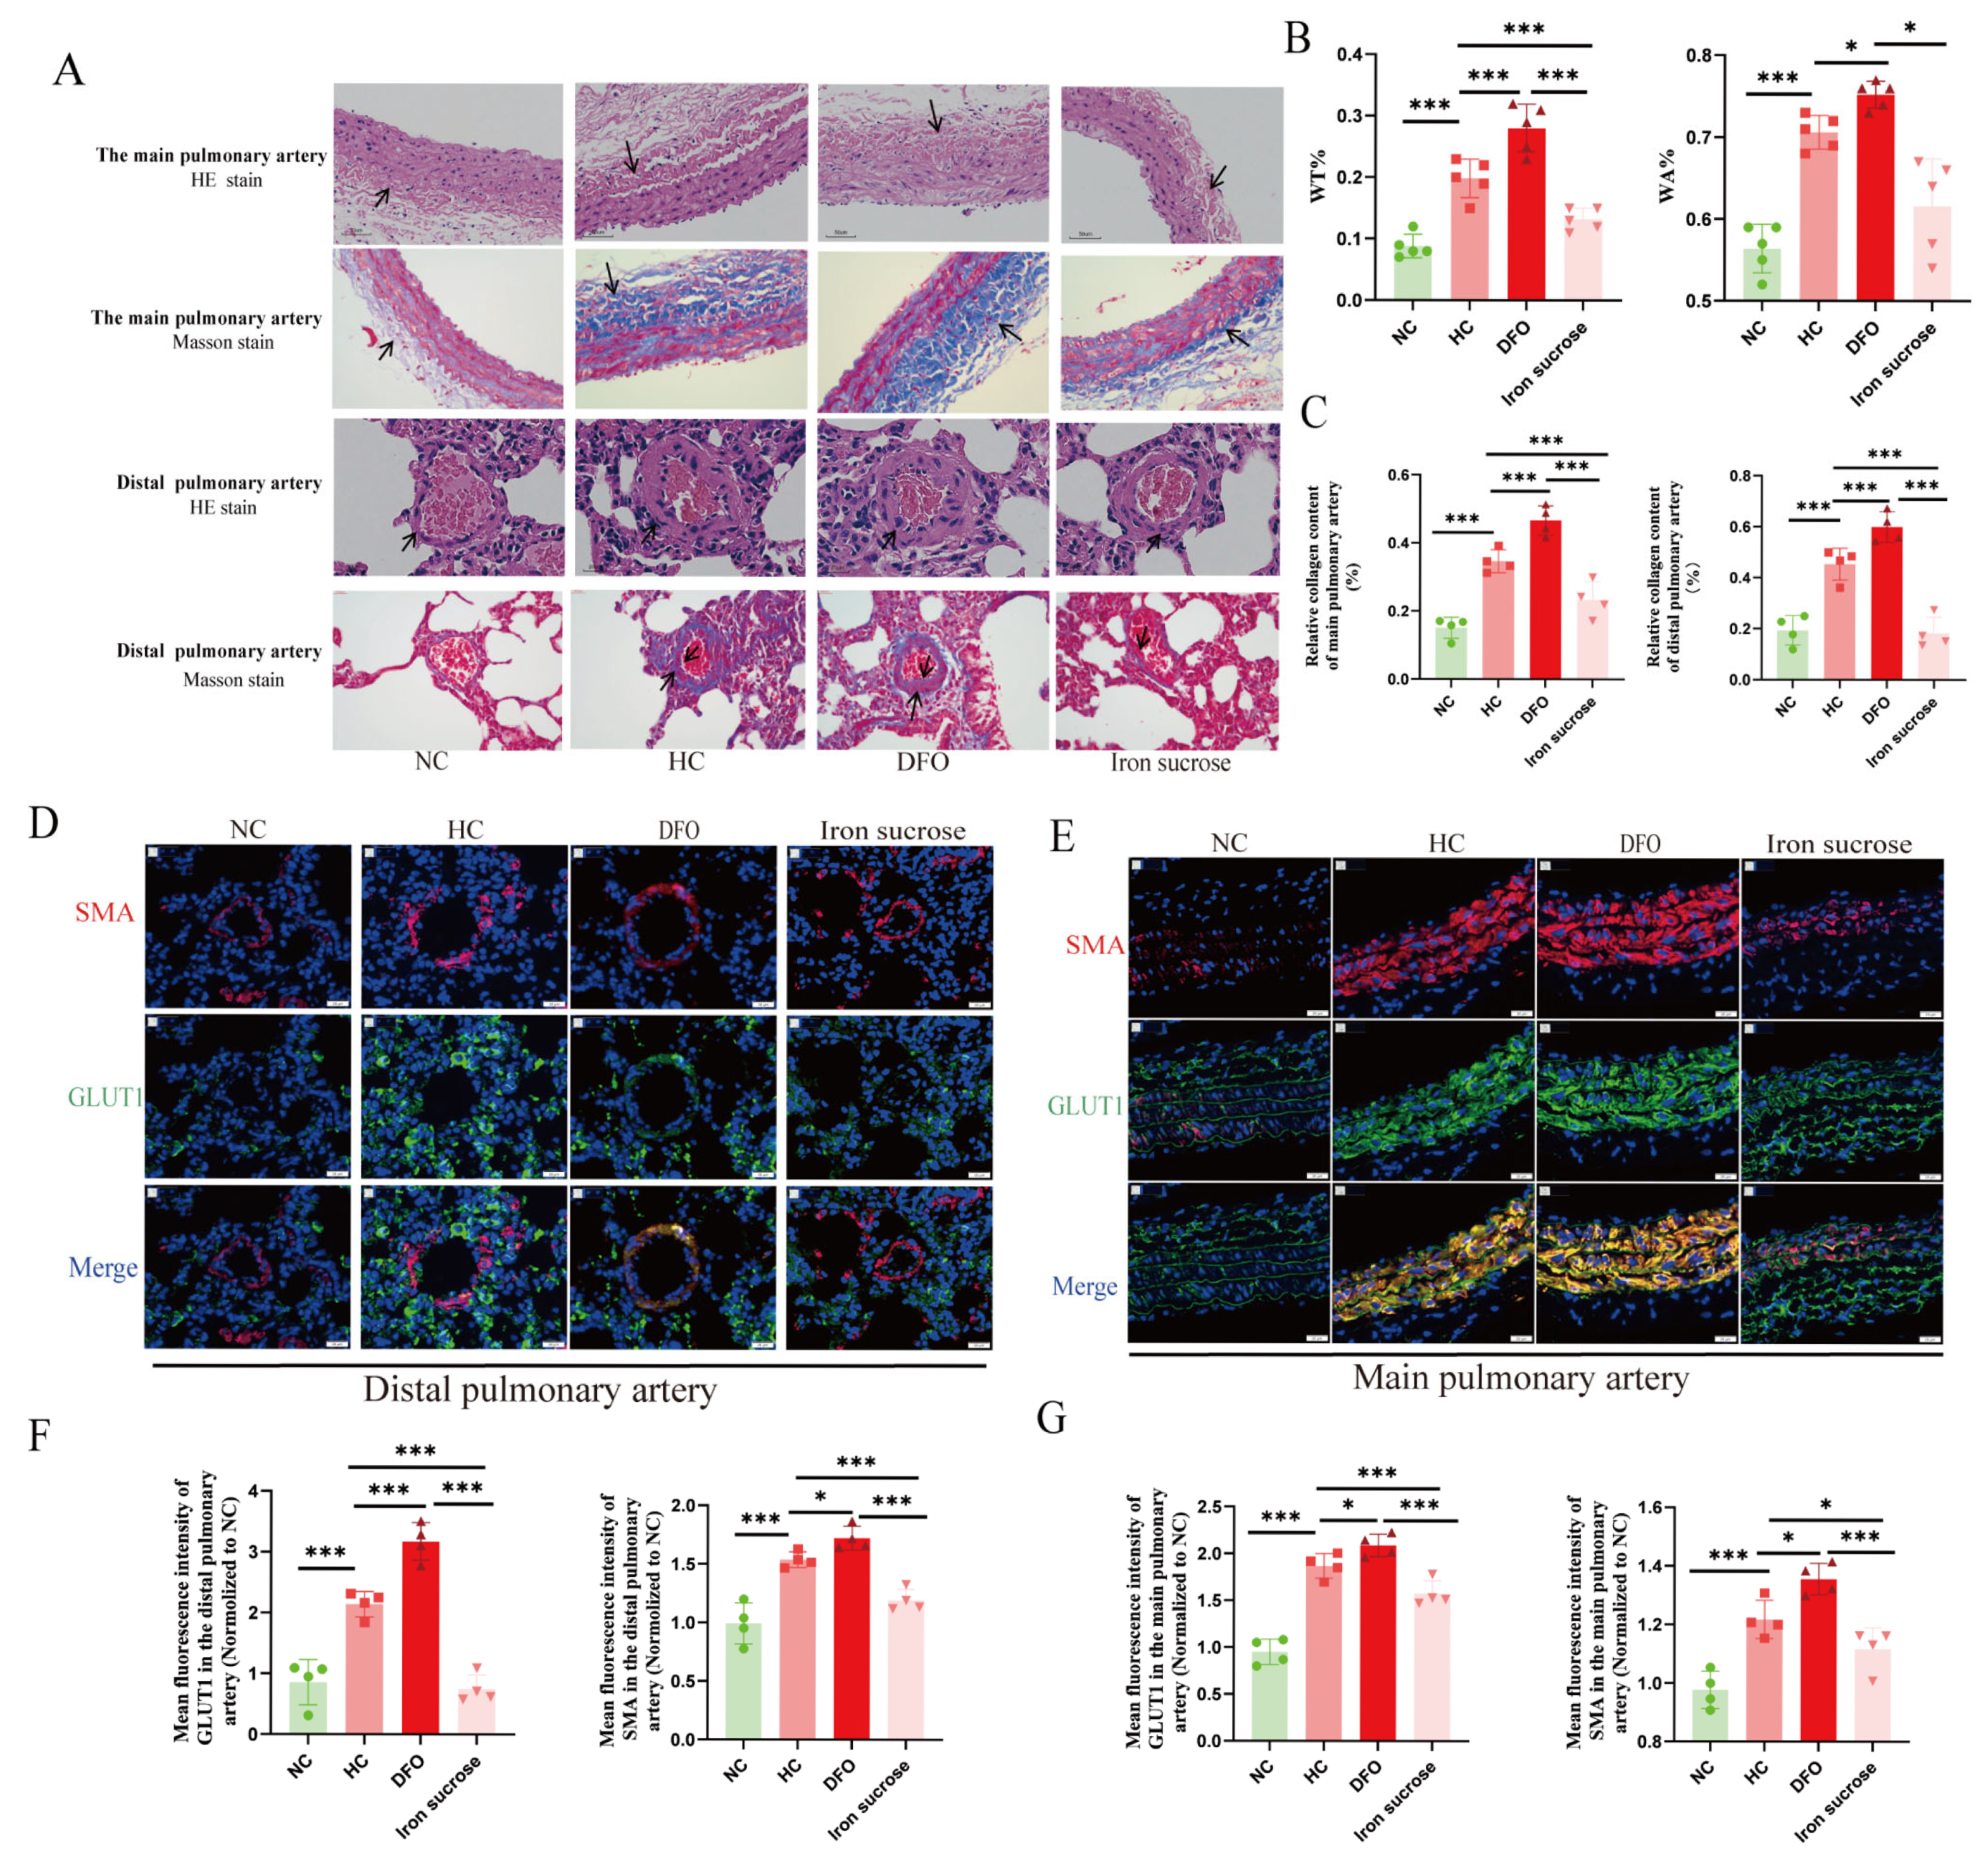
4]. Therefore, the identification of novel therapeutic targets for HPH has emerged as an urgent clinical imperative. The histological hallmarks of HPH are typical pulmonary vascular remodeling (PVR), manifested as increased sclerosis of proximal elastic pulmonary arterioles and muscularization of distal pulmonary arterioles [
5]. Accumulating evidence demonstrates that metabolic reprogramming, characterized by enhanced aerobic glycolysis and suppressed oxidative phosphorylation, plays a pivotal role in PVR pathogenesis [
6]. This tumor-like metabolic shift promotes pulmonary vascular cell proliferation and apoptosis imbalance, ultimately contributing to PH development [
1,
6,
7,
8,
9,
10].
Iron deficiency has been identified across various PH subtypes and is associated with adverse clinical outcomes, including elevated mPAP and reduced six-minute walk distance, both of which are responsive to iron supplementation therapy [
11,
12,
13,
14]. However, there is still a gap in the data on iron metabolism in HPH. The role of iron in HPH has been relatively little studied and is controversial [
15,
16,
17]. Moreover, there are even fewer mechanistic studies linking iron to HPH. Iron ions are essential for synthesizing mitochondrial iron/sulfur clusters, critical cofactors of complexes I and III. These mitochondrial complexes serve as key sites for hypoxic reactive oxygen species (ROS) generation [
18,
19,
20,
21]. Therefore, we hypothesize that iron exerts indirect regulatory effects on mitochondrial ROS generation through modulation of electron transport chain components.
Hypoxia-inducible factor 2α (HIF2α), a key transcriptional regulator of chronic hypoxic adaptation, demonstrates tissue-specific expression with prominent upregulation in pulmonary endothelial cells under hypoxic conditions [
22]. Beyond oxygen availability, cellular iron status represents a crucial regulator of HIF2α stability. Under conditions of hypoxia or iron depletion, diminished prolyl hydroxylase (PHD) activity prevents HIF2α ubiquitination and proteasomal degradation, facilitating its nuclear translocation and subsequent activation of downstream gene expression [
23]. However, the deficiency of iron regulatory protein 2, a key protein regulating iron metabolism, can induce the activation of HIF2α [
24], thereby inhibiting the biosynthesis of mitochondrial iron/sulfur clusters and the process of oxidative phosphorylation [
25]. Studies show that the application of HIF2α inhibitors can not only improve the morphological characteristics of mitochondria and enhance their quality but also reshape the energy balance in cells, promoting the restoration of the energy metabolism pattern to mainly oxidative phosphorylation [
26,
27]. While HIF2α-mediated metabolic reprogramming has been extensively studied in oncology, its role in HPH pathogenesis remains poorly understood.
To explore the role of iron in HPH, we modulated the iron metabolism in animal models through dietary and pharmacological interventions. The results demonstrated that iron deficiency exacerbated HPH, whereas iron supplementation alleviated the progression of HPH. Both in vivo and in vitro experiments revealed that iron could regulate the expression of HIF2α in PAECs. Furthermore, we utilized small molecule inhibitors to interfere with the activity of HIF2α in vivo and in vitro and found that HIF2α inhibitors restored the PAECs’ proliferation/apoptosis homeostasis and inhibited the development of HPH by enhancing the complexes I and III expression, decreasing mitochondrial ROS generation, and remodeling the energy metabolism.
2. Materials and Methods
2.1. Patient Data
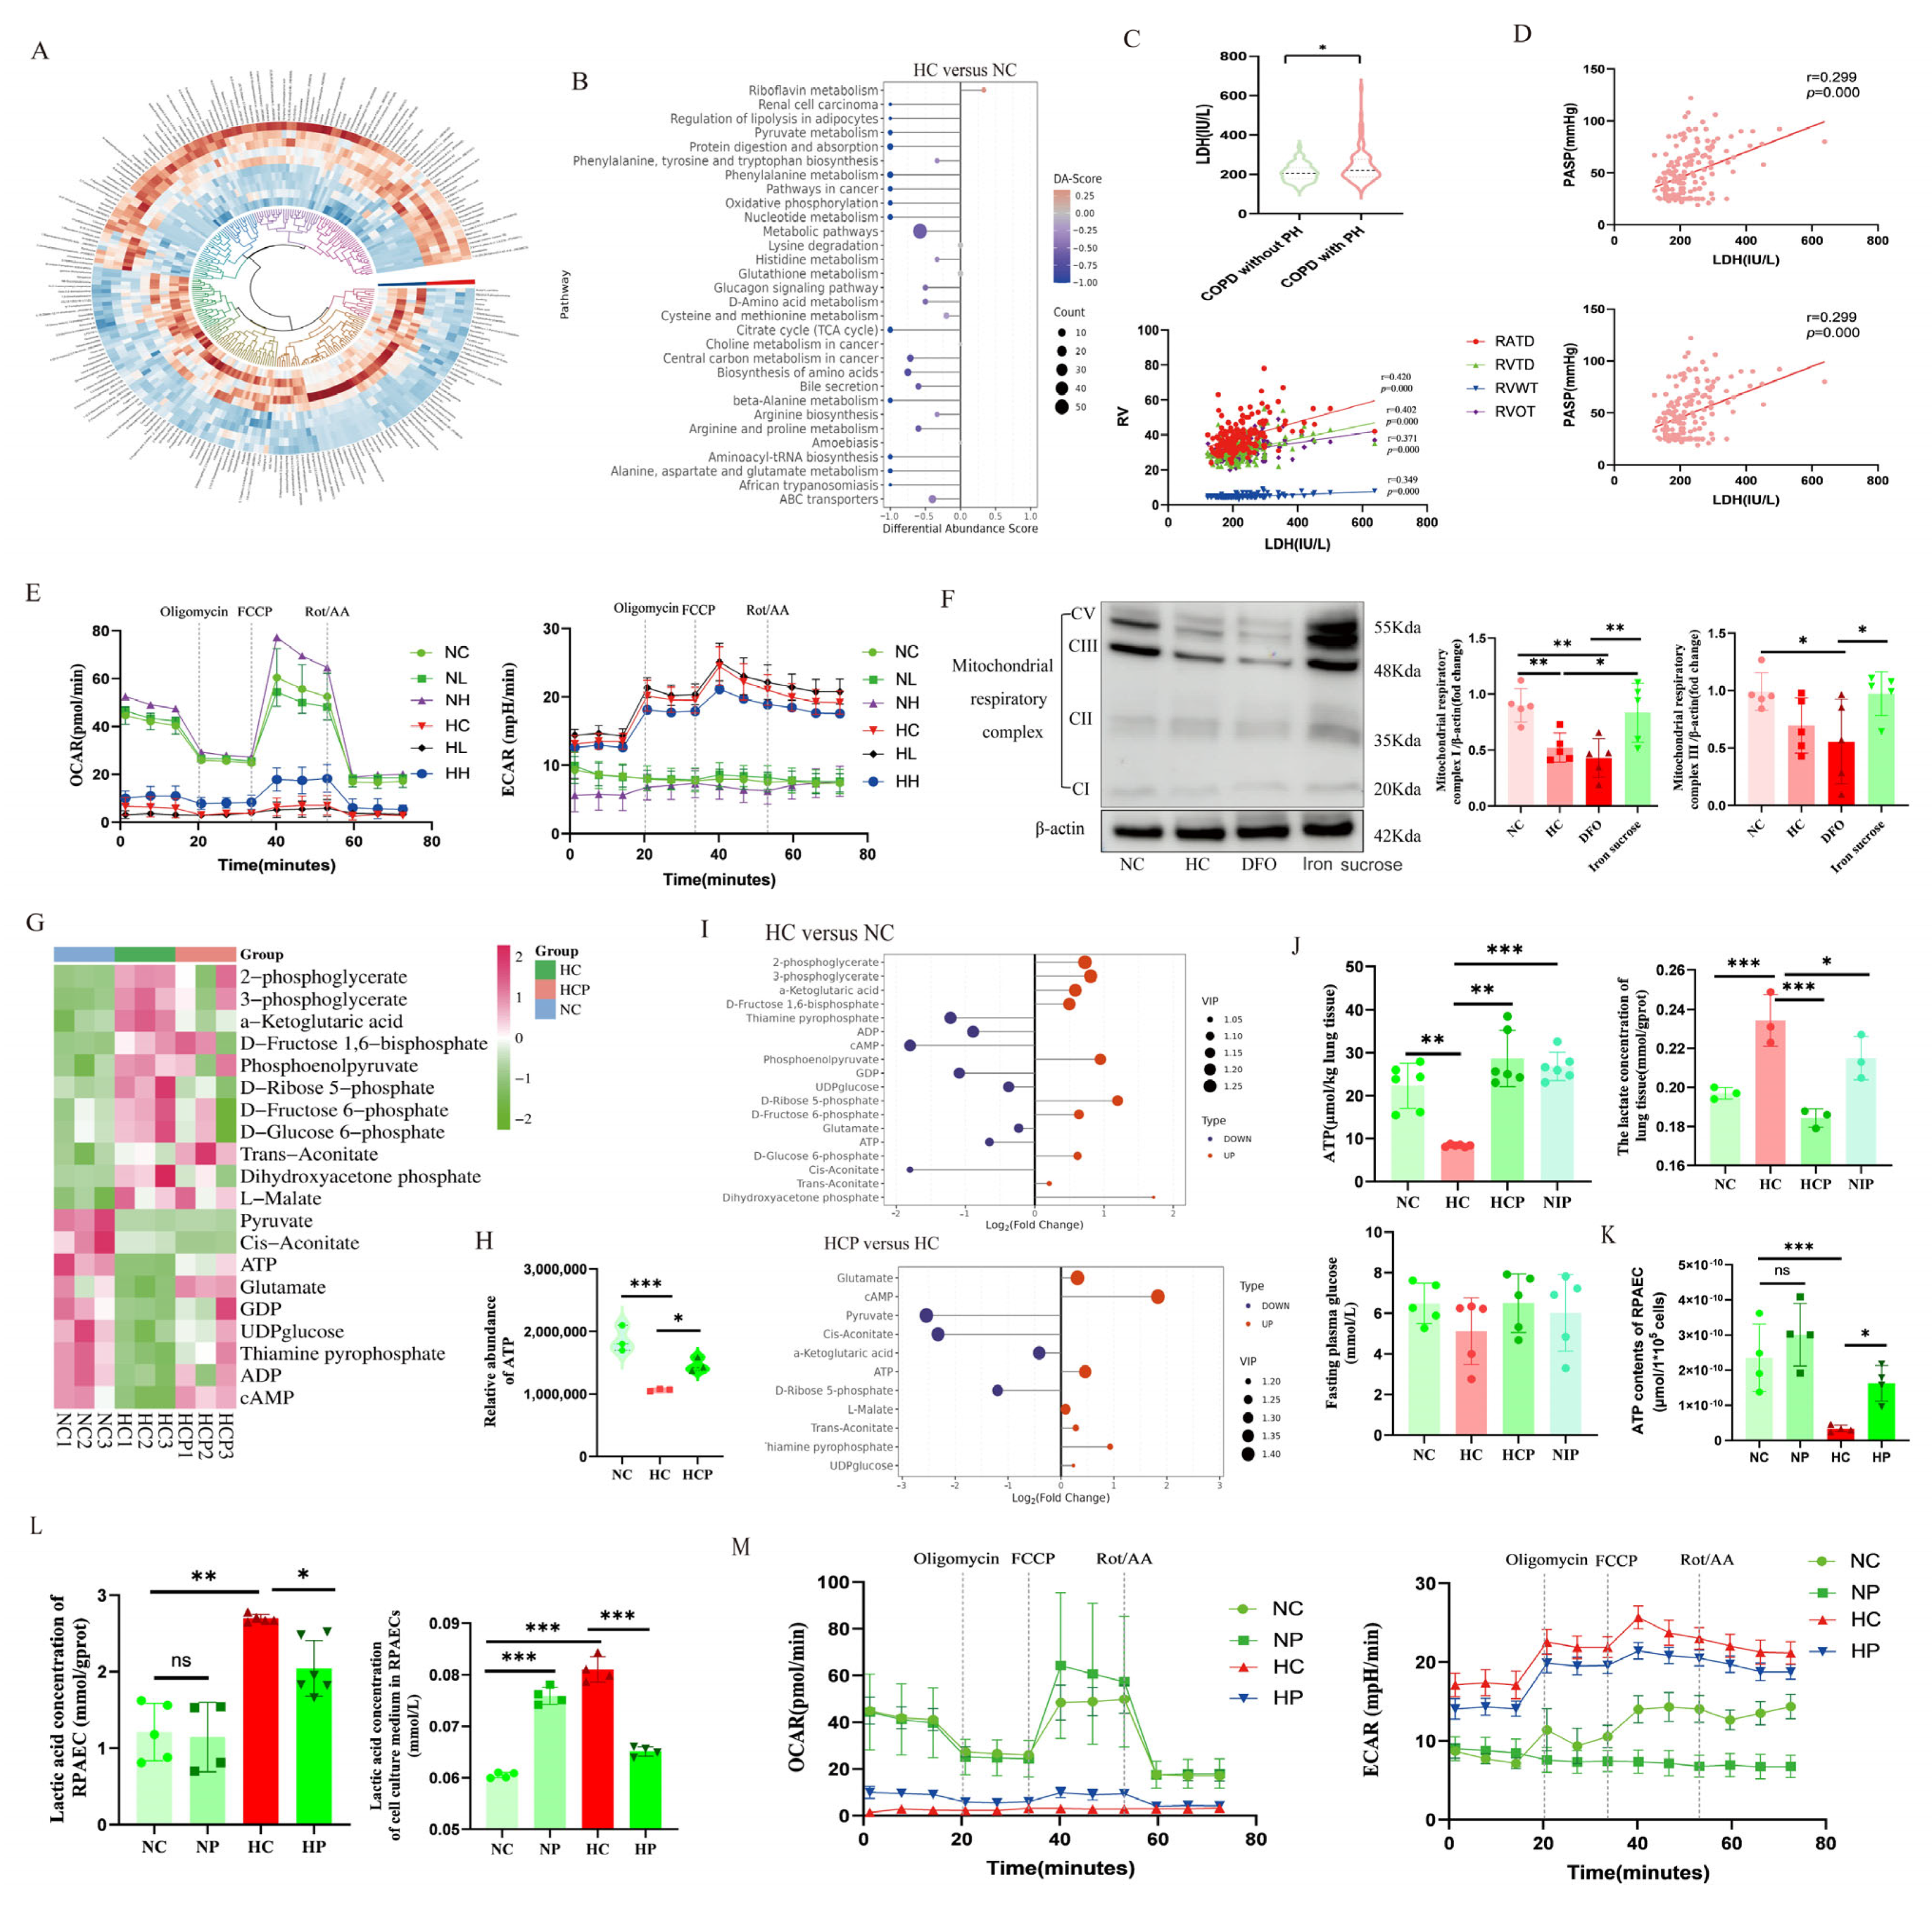
This retrospective analysis involved patients who were hospitalized in the Department of Respiratory and Critical Care Medicine of Qinghai Provincial People’s Hospital from September 2016 to September 2023. Clinical data were collected from two distinct patient cohorts: (1) chronic hypoxic lung disease patients without PH, encompassing obstructive sleep apnea-hypopnea syndrome, chronic obstructive pulmonary disease (COPD), and pulmonary interstitial fibrosis, and (2) corresponding patients with PH. Patients with PH secondary to other etiologies, including left heart disease, connective tissue disorders, and chronic thromboembolic PH, were excluded from the study. Patient enrollment was conducted through systematic screening based on the predefined inclusion/exclusion criteria, followed by comprehensive collection of clinical parameters and subsequent statistical analysis.
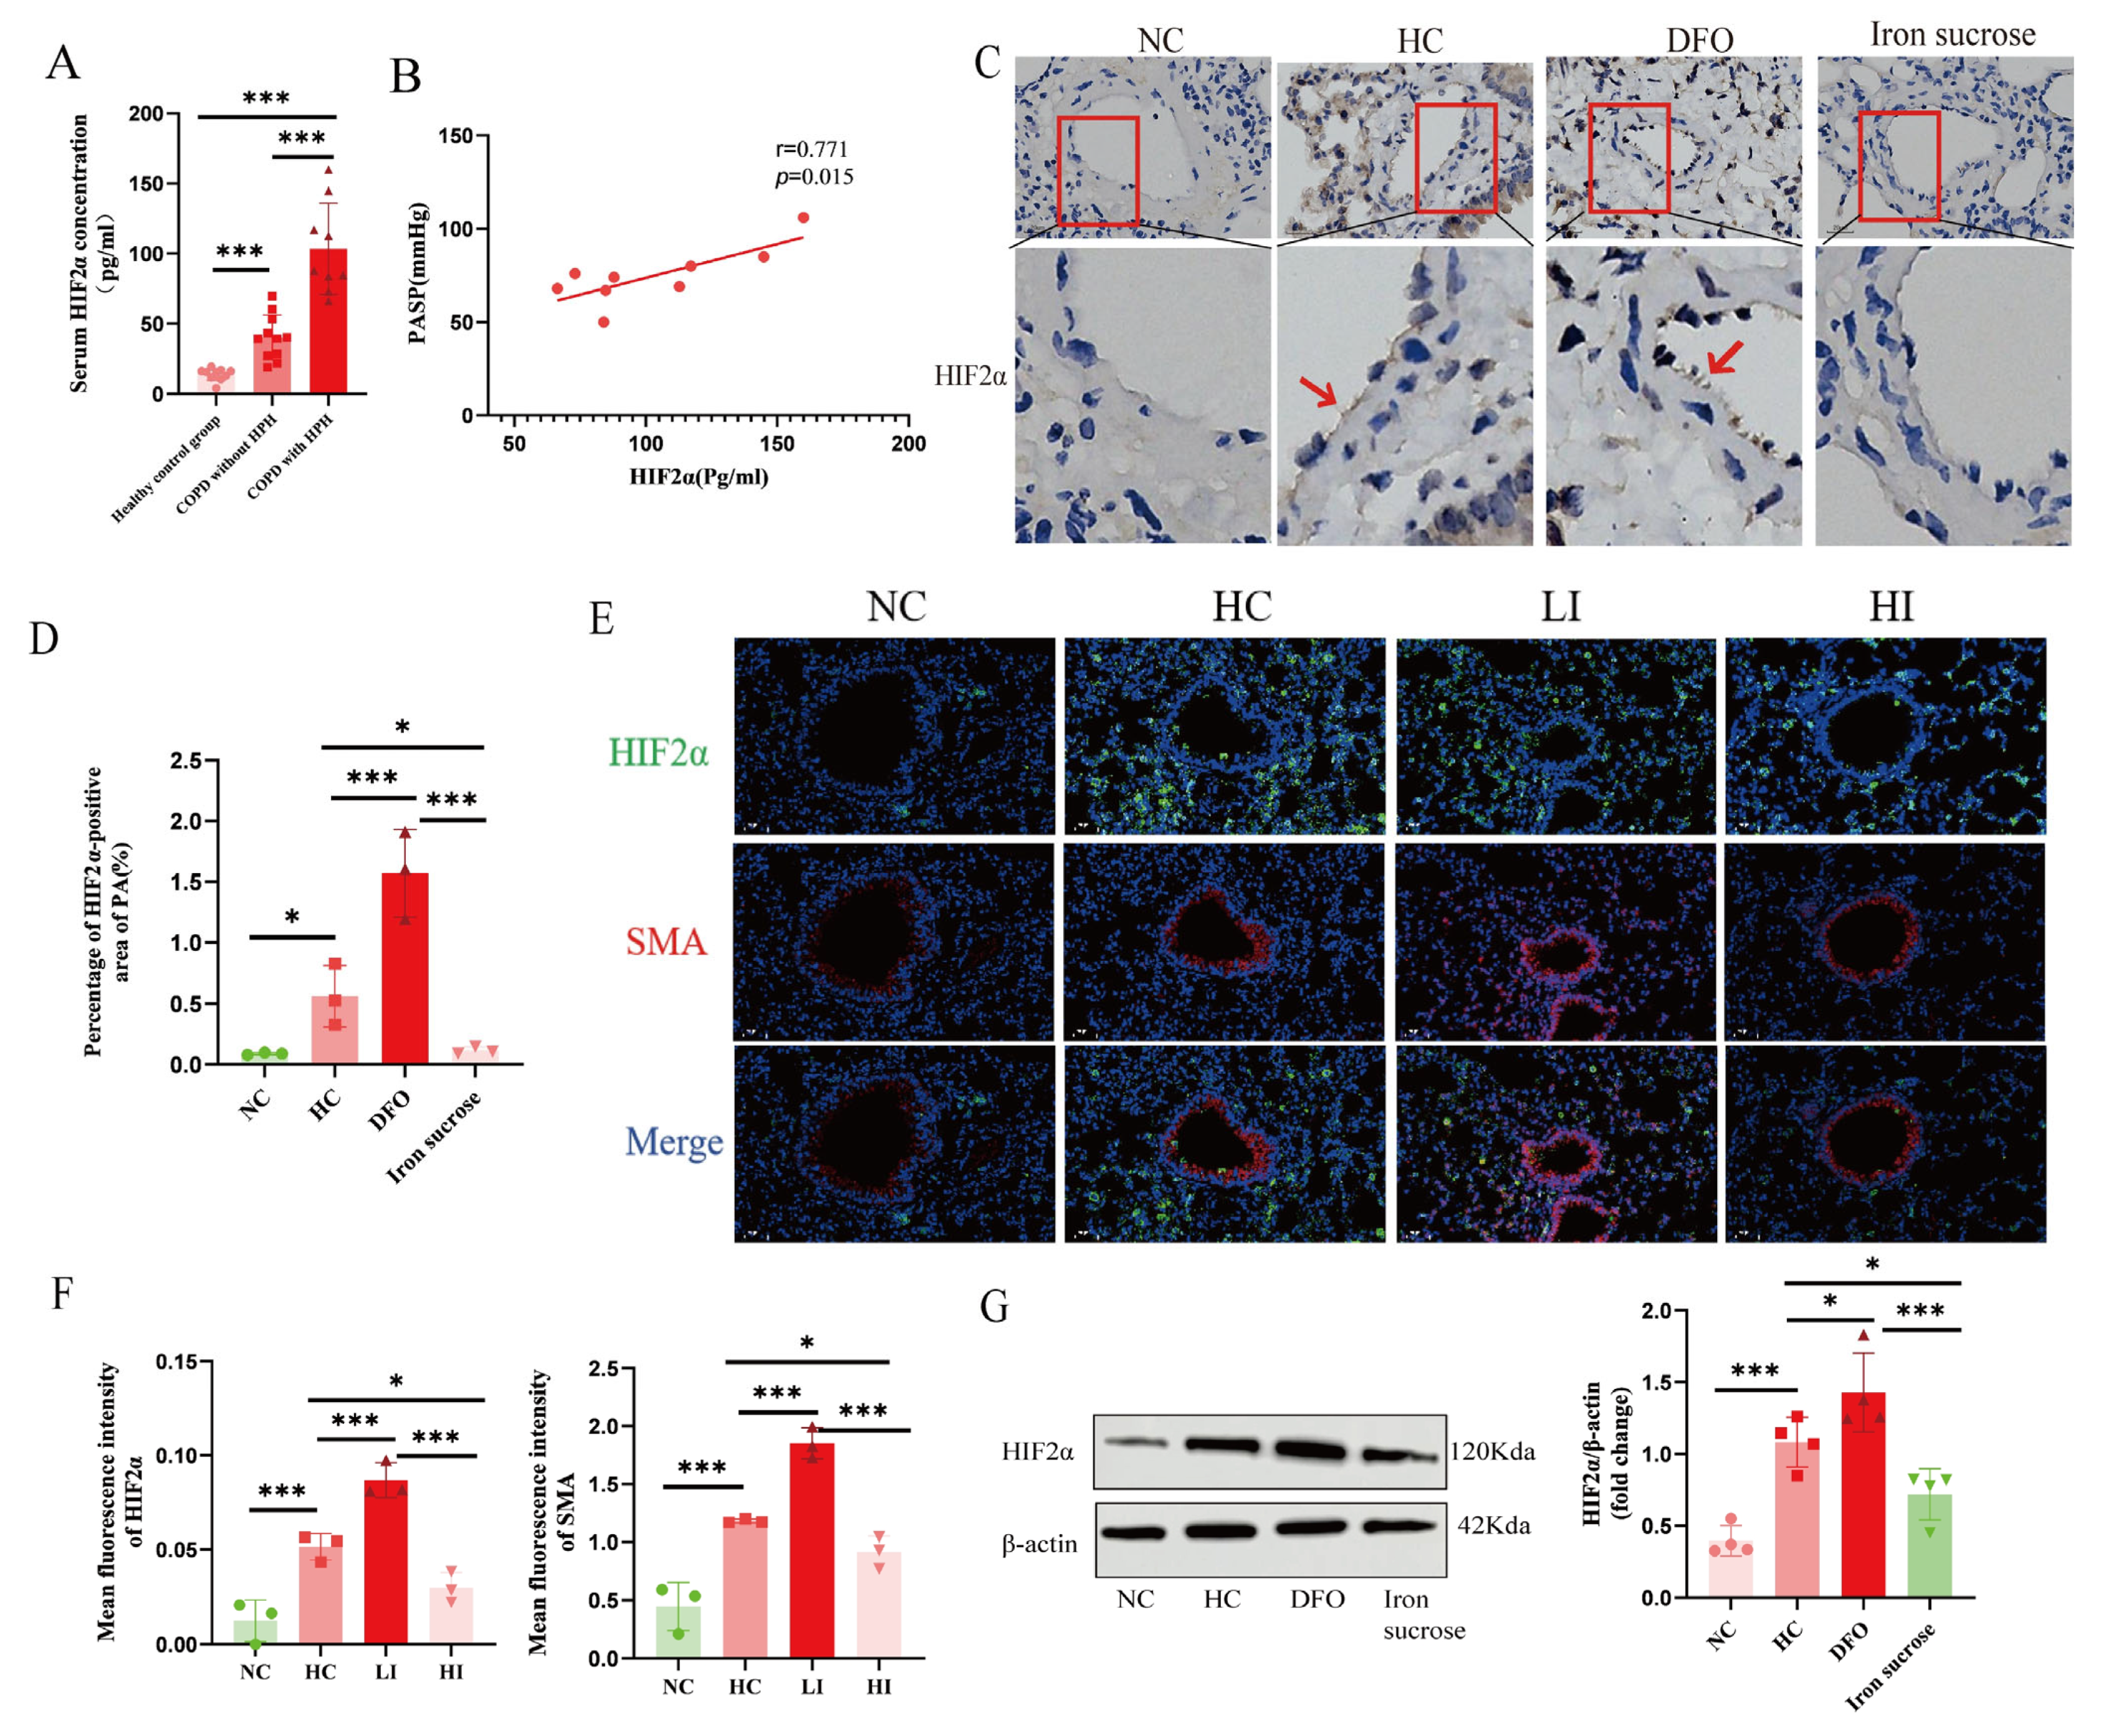
Serum samples were obtained from three cohorts: healthy controls without cardiopulmonary diseases, COPD patients without PH, and PH patients. HIF2α expression was quantified in all samples using a commercial ELISA kit (Cat. # CSB-E12113h, Huamei Biological Engineering Co., Ltd., Wuhan, China).
The study protocol was approved by the Ethics Committee of Human Genetics, Ministry of Science and Technology of China (Approval No. 2023[CJ0189], date: 15 September 2023), the Institutional Review Board of Qinghai Provincial People’s Hospital (Approval No. 2023-047, date: 18 May 2023), and the Institutional Review Board of Medical College, Qinghai University (Approval No. 2022-92, date: 14 October 2022). For this retrospective analysis based on medical records, a waiver of informed consent was granted by the institutional review board. However, written informed consent was specifically obtained from all participants for blood sample collection and subsequent ELISA testing.
2.2. Animal Experiments
Experimental protocols and animal care in this study received approvals from the Ethics Committee of the Affiliated Hospital of Qinghai University (Approval No. P-SL-2022-058, date: 1 July 2022) and the Medical Ethics Committee of Qinghai Provincial People’s Hospital (Approval No. 2023-95, date: 20 June 2023). Male Sprague–Dawley (SD) rats (weight 200–250 g) and wild-type C57 BL/6J mice aged 8–10 weeks were purchased from Huachuang Xinnuo Pharmaceutical Science and Technology Co., Ltd. (Taizhou, China); each group was composed of 10 animals (n = 10).
Chronic hypoxia-induced PH model: Animals were kept in a hypobaric hypoxia compartment for 4 weeks (DYC-300, FengLei Oxygen Chamber Co., Ltd., Anshun, China). The air pressure and oxygen content align with an altitude of 5000 m above sea level. The pressure was 52.9 KPa, the O
2 concentration was 10%, the temperature was 22.0 °C, the relative humidity was 50%, and the light and dark cycle was carried out for 12 h [
28,
29]. The following PH parameters were assessed after 4 weeks.
Rat Model Established by Pharmacological Intervention: Male SD rats were given deferoxamine (DFO group, 200 mg/kg; HY-B0988, MedChemExpress LLC, Monmouth Junction, NJ, USA) [
30] and iron sucrose (iron sucrose group, 20 mg/kg; HY-B2068, MedChemExpress LLC, NJ, USA) intraperitoneally every other day and placed into a hypoxia or normoxia (10%) environment for 4 weeks, respectively, as previously described. Controls were given the same amount of solvent intraperitoneally.
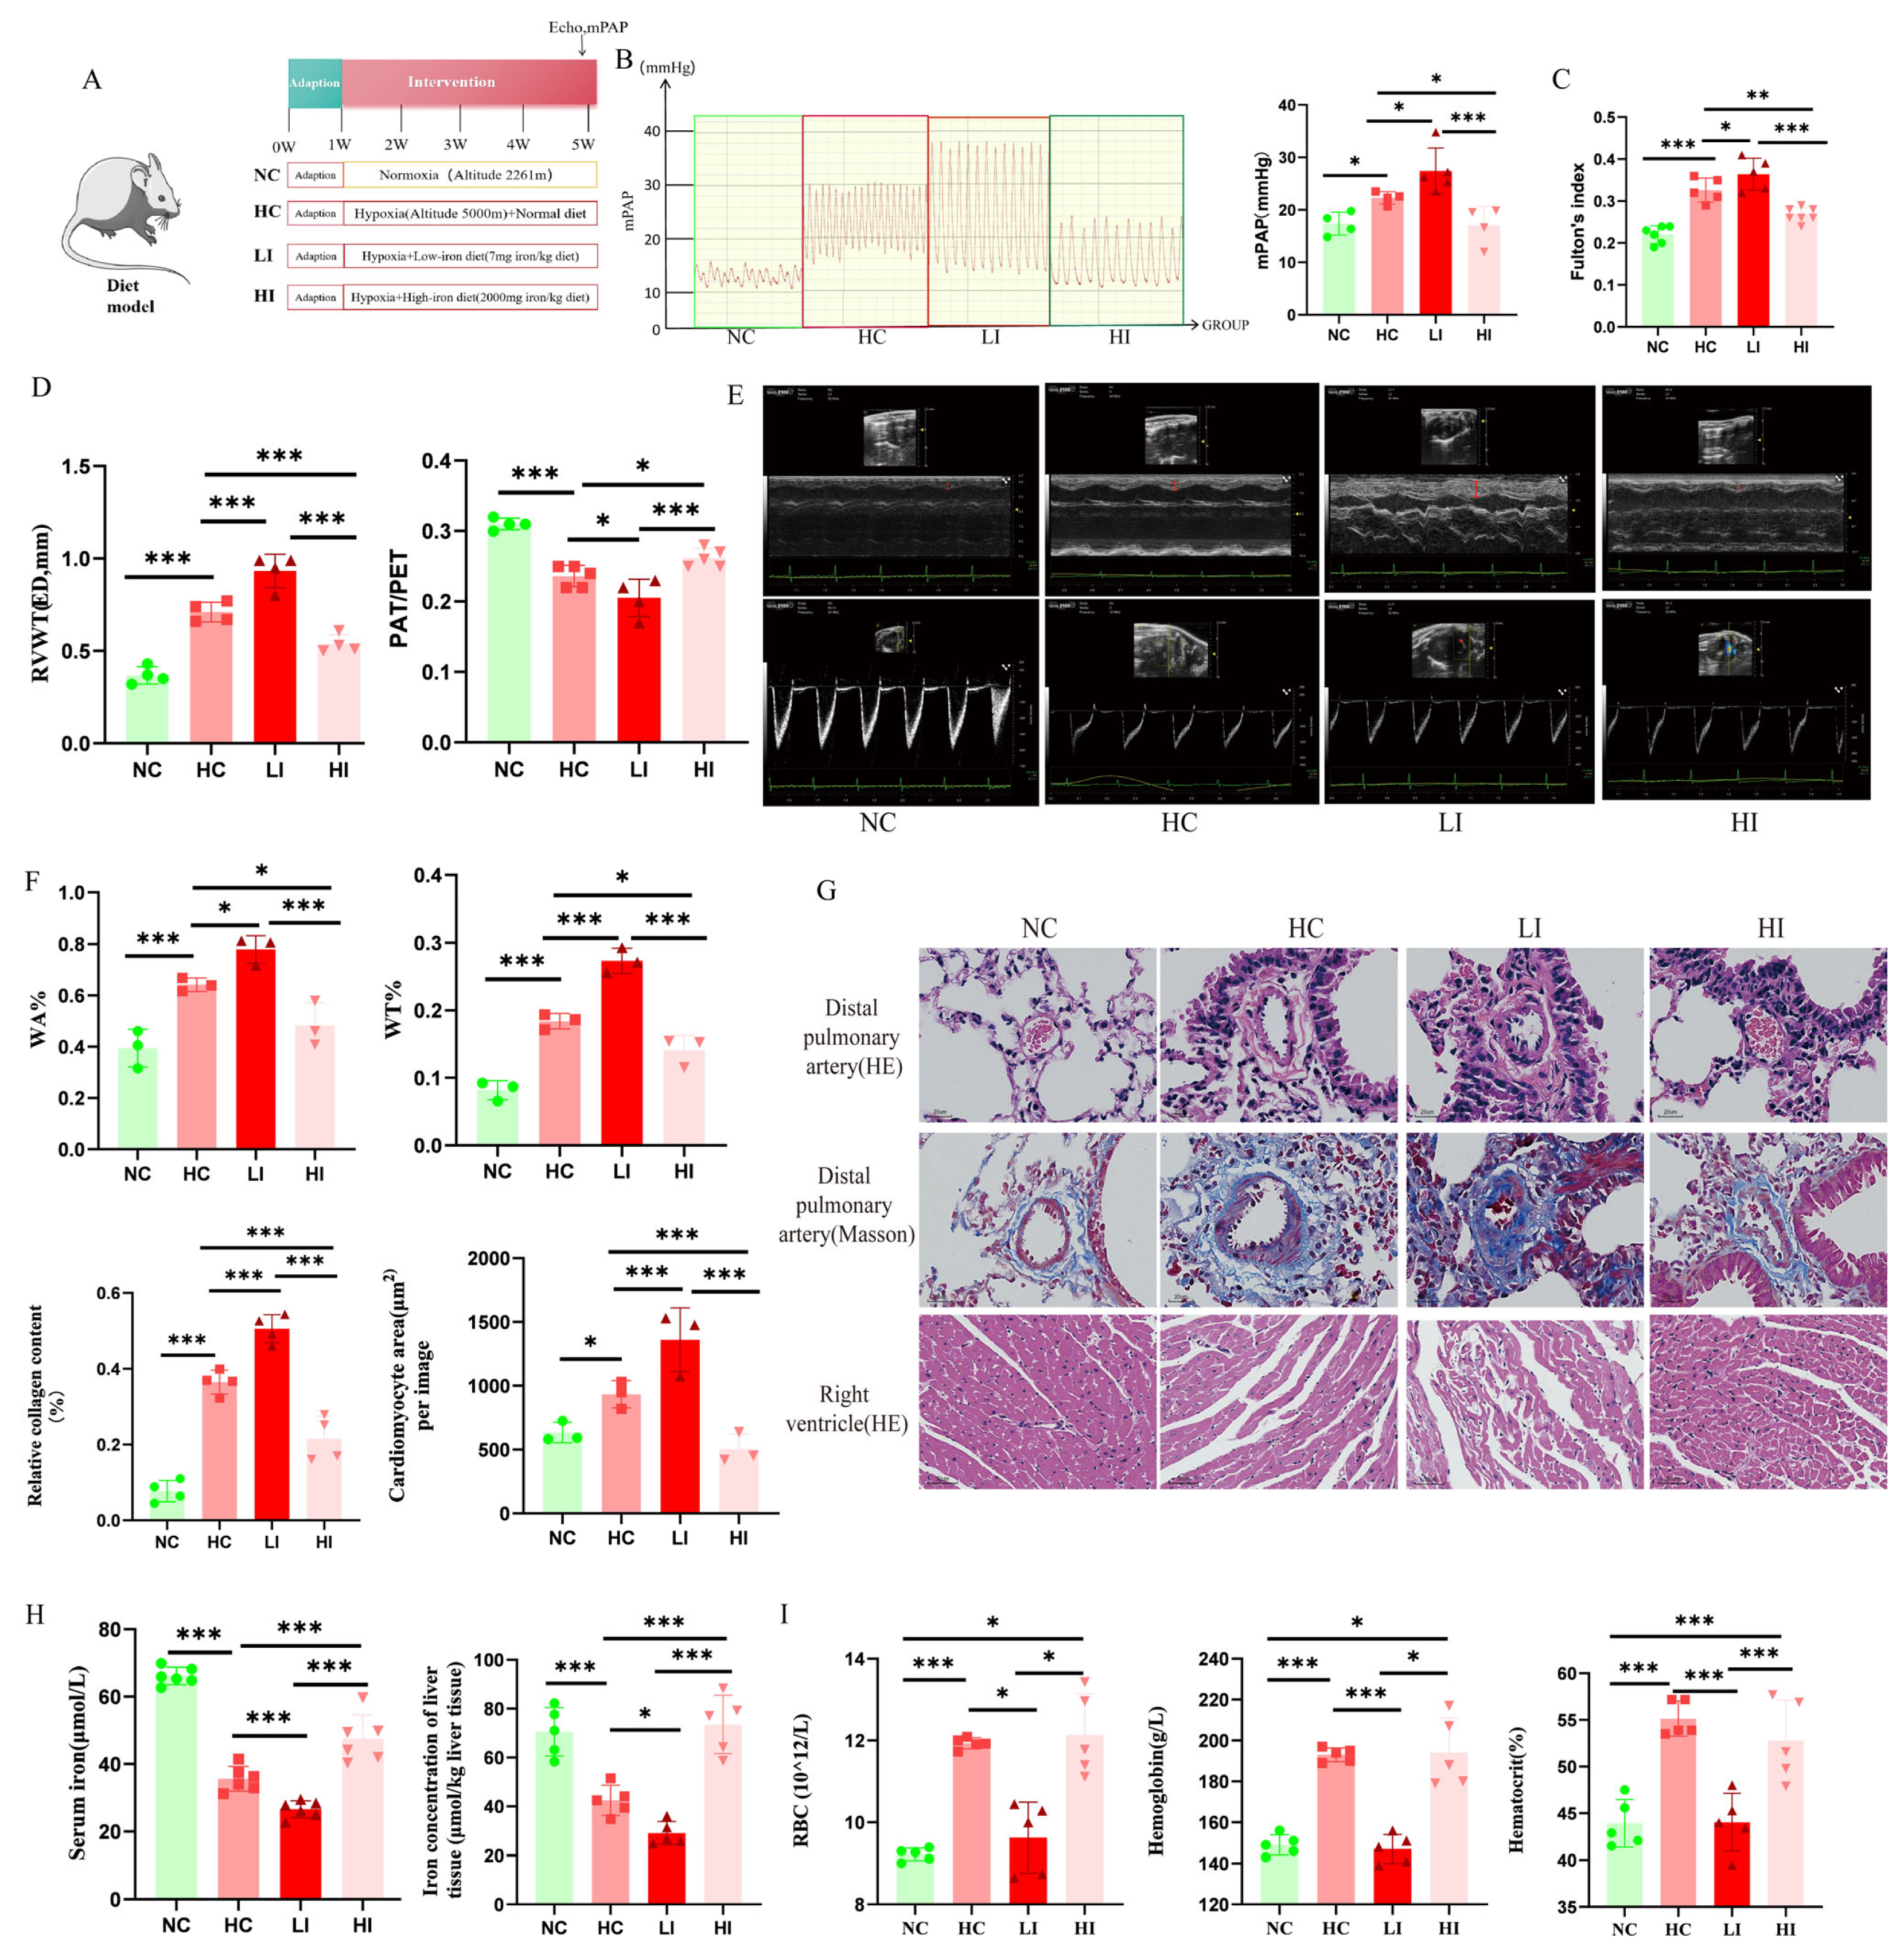
Mouse Model Established by Dietary Intervention: Male C57 BL/6J mice were given a low iron diet (LI group, 7 mg iron/kg; M22070401, Moldiets, Biopike Technology Co., Ltd., China), a high iron diet (HI group, 2000 mg iron/kg; M22070402, Moldiets, Biopike Technology Co., Ltd., China) [
15], and a standard chow (control), respectively. They were placed into a hypoxia (10%) or normoxia environment for 4 weeks, as previously described.
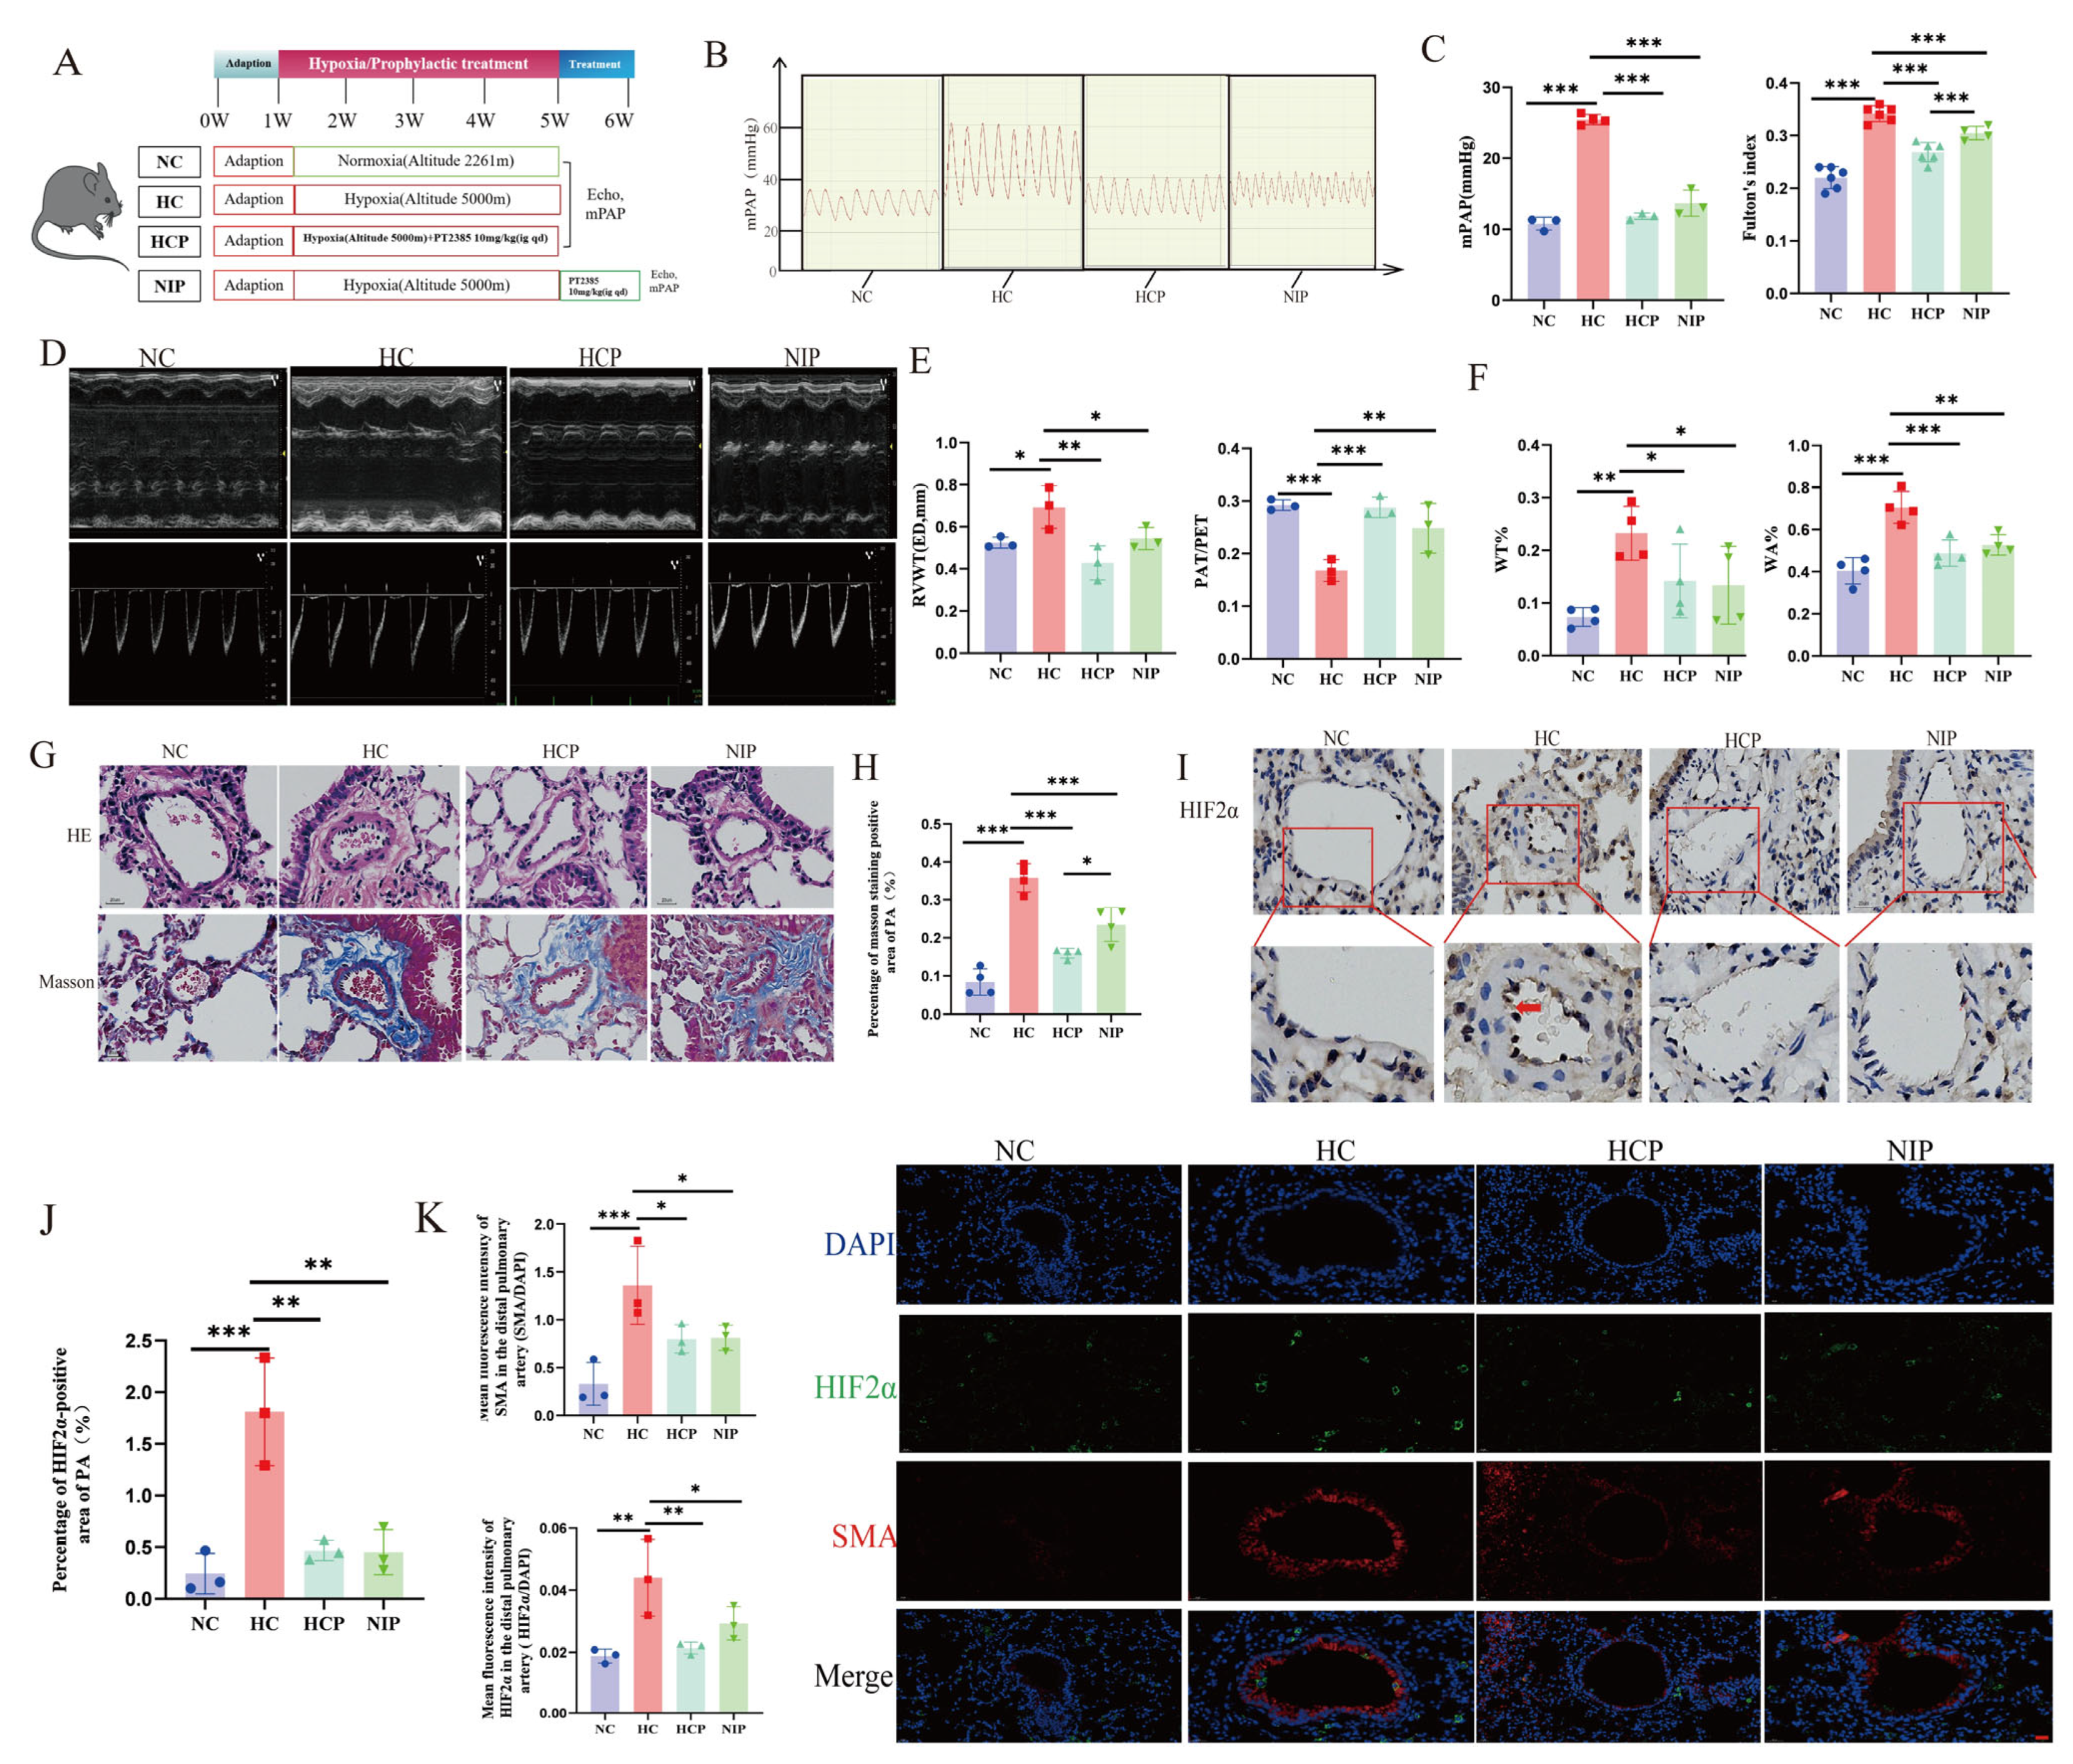
Mouse Model Intervened by HIF2α Inhibitor PT2385: Male C57BL/6J mice in the HCP group were kept in hypoxia (10%) for 4 weeks with daily oral gavage of PT2385 (10 mg/kg; HY-12867, MedChemExpress LLC, NJ, USA) as previously described [
31]. PH parameters were assessed after 4 weeks. Mice in the NIP group were subjected to chronic hypoxic exposure (10% O
2) for 4 weeks, followed by daily oral gavage administration of PT2385 (10 mg/kg; HY-12867, MedChemExpress LLC, NJ, USA) under normoxic conditions for an additional week. The control group was given the same amount of solvent by gavage.
2.3. Transthoracic Echocardiography
Transthoracic echocardiography was utilized to evaluate right ventricular changes in animals according to previously described steps [
32]. Animals were anesthetized by inhalation of isoflurane through a mask (rats: induction 3%, maintenance 2.0–2.5% in room air; mice: induction 2%, maintenance 1.0–1.5% in room air). Transthoracic echo detection was performed using the VisualSonics Vevo2100 (VisualSonics Inc., Toronto, ON, Canada) and sensor (MS-250, 13–24 MHz), and pulsed-wave Doppler ultrasound was employed to determine the pulmonary blood flow, pulmonary artery acceleration time (PAT), and pulmonary artery ejection time (PET) at the level of the aortic valve in the long-axis position. The maximal layer of the right ventricular cavity is capable of being examined in M-mode at the parasternal long-axis right ventricular outflow tract (RVOT). Right ventricular end-diastolic wall thickness (RVWT, ED) and right ventricular end-systolic wall thickness (RVWT, SD) were determined at the end-diastole and end-systole, respectively. All echocardiographic parameters were calculated using the visual Sonic Vevo770 System tool module (VisualSonics Inc., Toronto, ON, Canada), and all measurements were performed blinded by an experienced sonographer. After ultrasonography, animal models were used for hemodynamic and histological assessment.
2.4. Invasive Hemodynamic Measurement
Isoflurane gas anesthesia was continued after the end of ultrasound measurements in the animal model, and the right heart catheter was employed to determine the mPAP. The catheter was placed from the right exterior jugular vein, and the catheter passed via the right ventricle into the pulmonary artery. The insertion position was measured through the waveform on a bio-signal acquisition system (MP150, BIOPAC Systems, Inc., CA, USA). Following the completion of right heart catheterization, experimental animals were euthanized via cervical dislocation, with confirmation of death verified through cessation of cardiac and respiratory functions, coupled with absence of pain reflexes. The right ventricle (RV), left ventricle (LV), and septum (S) of each animal were segregated from the margin of the interventricular septum at the end of catheterization. The Fulton’s index was determined to rate the right ventricular hypertrophy based on the ratio of RV/(LV + S).
2.5. Animal Hematological Analysis
Blood samples were collected via cardiac puncture under anesthesia. A portion was transferred to anticoagulant tubes for complete blood count analysis. Samples were thoroughly mixed, loaded into a hematology analyzer (YAN-305A, Yuyan Scientific Instruments Co., Ltd., Shanghai, China), and analyzed using species-specific parameters. Data were exported for further processing.
2.6. Transmission Electron Microscope
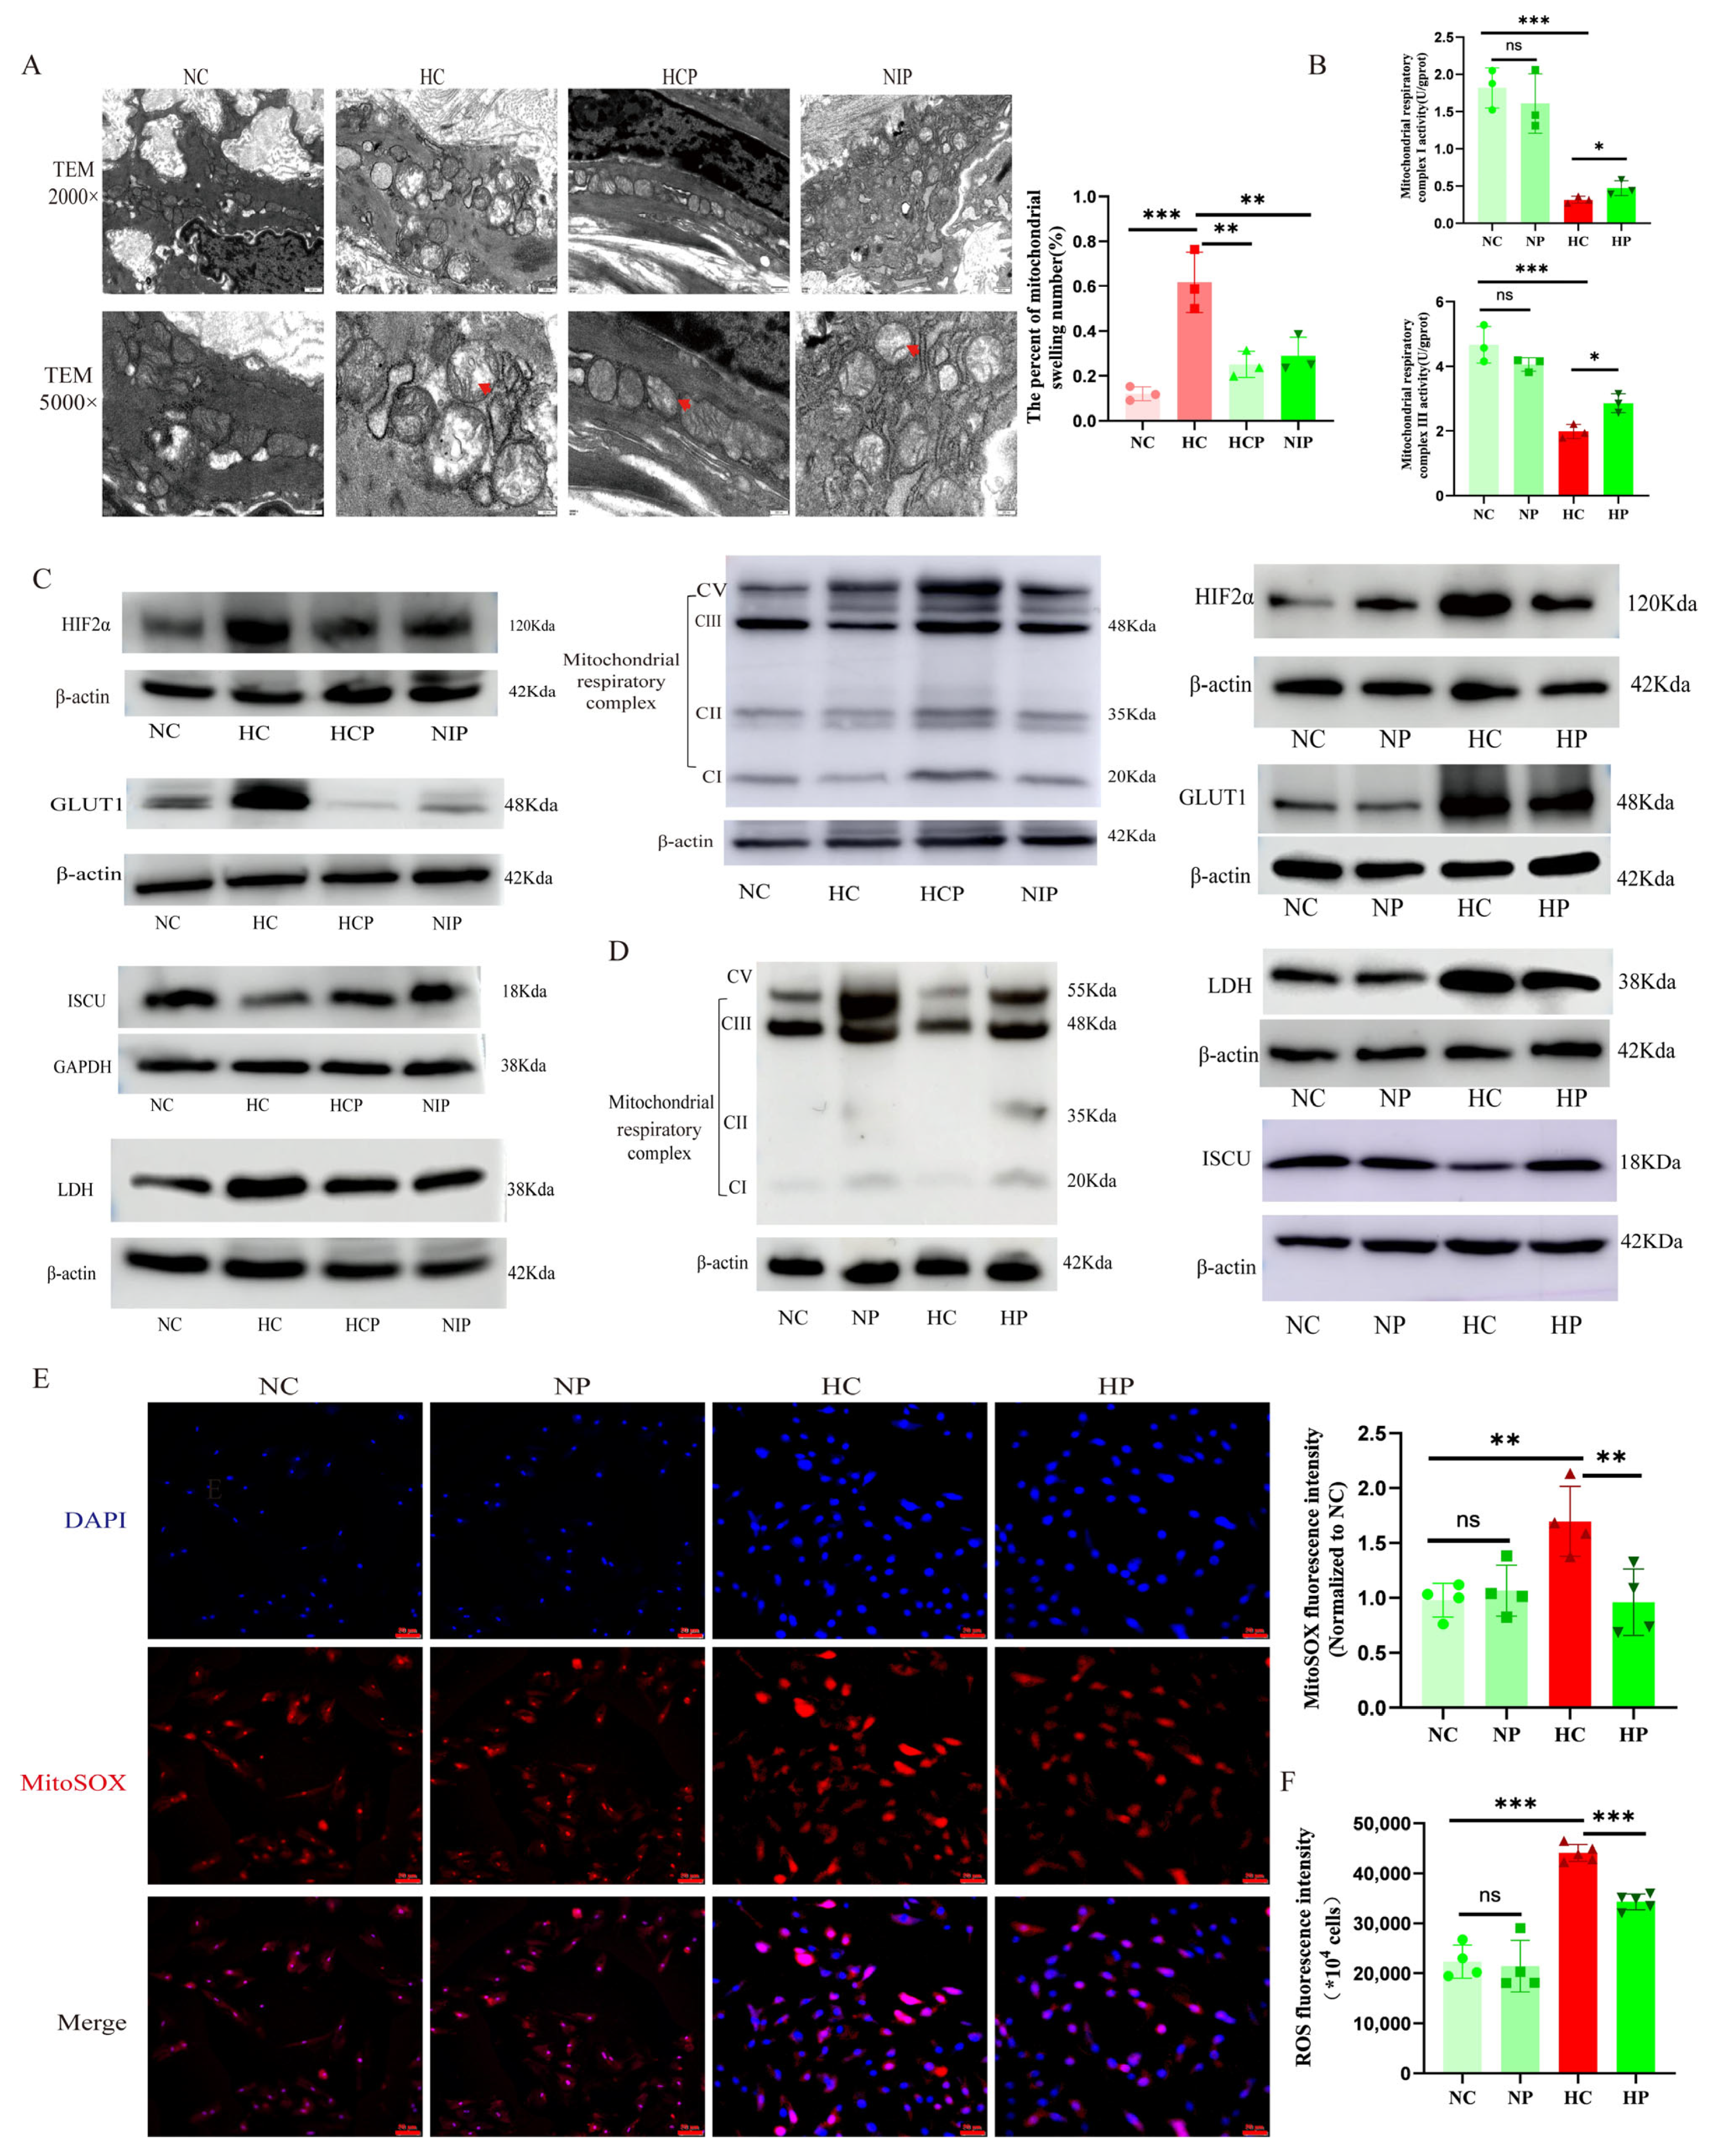
After anesthetizing and euthanizing the rats, the heart and lungs were simultaneously removed and placed in 1 × PBS. The main pulmonary artery and its branches were carefully isolated from the rat right ventricle. Subsequently, the artery was stabilized with 3% glutaraldehyde before the post-fixation under 1% osmium tetroxide. Dehydration occurred through a graded series of acetone treatments, followed by infiltration with Epox 812 and embedding. Semithin sections underwent methylene blue staining, while Ultrathin slides were delicately sliced using a diamond knife and dual-stained with uranyl acetate and lead citrate. The slides were then meticulously observed under the JEM-1400-FLASH Transmission Electron Microscope( Japan Electron Optics Laboratory Co., Ltd., Tokyo, Japan).
2.7. Morphological Analysis of the Lung Vessels
The lung tissue and main pulmonary artery were fixed, embedded, and sectioned according to a generalized method, followed by hematoxylin and eosin staining (H&E), while fibrosis in the pulmonary vasculature was assessed by Masson’s trichrome staining (collagen was stained blue). The Prussian blue staining of the liver (enhanced method) was performed using a specific kit (Cat. # G1428, Solarbio Science & Technology Co., Ltd., Beijing, China). Images were acquired using a BA400 digital microscope with a digital interface (Motic China Group Co., Ltd., Xiamen, China). Finally, ImageJ software (version 1.54) was adopted to determine pulmonary artery wall thickness ratios (WT%) and pulmonary artery wall areas (WA%) as well as to assess the quantification of collagen fibers.
2.8. Immunohistochemical Assay
Immunohistochemical experiments were performed using paraffin-embedded sections, deparaffinized with xylene and diluted with ethanol. Next, 0.01 M sodium citrate buffer solution (pH 6.0) was heated in a water bath to 95 °C. The tissue sections were then incubated in this buffer at 95 °C for 20 min. After the buffer cooled down naturally, the sections were retrieved, thus completing the antigen-repair process. After blocking the pulmonary vascular sections with an immunostaining blocking solution at room temperature for 1 h, tissue sections were sequentially incubated with primary antibodies: rabbit anti-Hepcidin monoclonal antibody (1:500; Cat. # ET1704-22; Hua’an Biotechnology Co., Ltd., Hangzhou, China) and rabbit anti-HIF-2α polyclonal antibody (1:100; Cat. # PA1-16510; Thermo Fisher Scientific, Waltham, MA, USA) overnight at 4 °C, followed by horseradish peroxidase (HRP)-conjugated secondary antibodies (1:100; Cat. # GB2003; Servicebio Technology Co., Ltd., Wuhan, China) for 60 min at room temperature. Then, DAB was used to develop the color, hematoxylin was used to re-stain the nuclei, and neutral gum was used to seal the film. A BA400 digital microscope (Motic China Group Ltd., Xiamen, China) was used for observation, with ImageJ software utilized to quantify the HIF2α expression.
2.9. Immunofluorescence Assay
For the immunofluorescence assay in animal models, pulmonary vascular sections underwent dewaxing and dehydration, followed by the antigenic repair procedure. The citrate buffer (pH 6.0) was heated to 95 °C in a water bath. The tissue sections were then incubated in this buffer at 95 °C for 20 min. After natural cooling of the buffer, the sections were removed. Following incubation with the immunostaining blocking solution at room temperature for 1 hour, HIF2α (1:100, Cat. # PA1-16510, Invitrogen Corporation, CA, USA), smooth muscle actin (SMA, 1:100, Cat. # A2547, Sigma-Aldrich Co. LLC., MO, USA), and glucose transporter 1 (GLUT1, 1:100, Cat. # ab115730, Abcam public limited Company, Cambridge, UK) antibodies were added and samples incubated overnight at 4 °C. Following three routine washes with 1× PBS, the slides were incubated with a fluorescent secondary antibody at room temperature for 1 h. The nuclei were re-stained with DAPI, and the image was examined through a confocal laser microscope (FV1000, Olympus Corporation, Tokyo, Japan). For the immunofluorescence assay in the cellular model, the treated PAECs were fixed, permeabilized, and blocked following standard procedures. They were then incubated with the primary antibody Caspase 3 (1:1000, Cat. # 19677-1-AP, Proteintech Biotechnology Co., Ltd., Wuhan, China) at 4 °C overnight. Subsequently, they were incubated with Alexa Fluor™ 488 (1:1000; Cat. # ab150077, Abcam public limited Company, Cambridge, UK) and DAPI in sequence. For the detection of mitochondrial membrane potential (MMP) and apoptosis, mitochondrial superoxide (MitoSOX) fluorescence assays were performed according to the kit instructions (Cat. # C1071M, Beyotime Biotechnology Co., Ltd., Haimen, China; Cat. # S0061M, Beyotime). The images were examined through a fluorescence microscope (THUNDER imager, Leica Microsystems GmbH, Wetzlar, Germany), and finally, the immunofluorescence intensity of protein signals was analyzed semi-quantitatively by ImageJ software.
2.10. Quantitative Real-Time Polymerase Chain Reaction (qPCR) Analysis
Total RNA was extracted from the liver tissue samples using an RNA extraction reagent (Cat. # G3013; Servicebio, China). After tissue homogenization, the mixture was centrifuged, and the supernatant was processed with a chloroform substitute followed by isopropanol precipitation. The RNA pellet was washed with 75% ethanol, air-dried, and dissolved in an appropriate volume of RNase-free water. RNA concentration and purity were determined using a spectrophotometer. Subsequently, reverse transcription was carried out with a reverse transcription kit (Cat. # G3337; Servicebio, China) in a reaction mixture containing total RNA, gDNA remover, and a 5× reverse transcription supermix. The reverse-transcribed cDNA was then used as a template for quantitative PCR. The qPCR reaction system included 2× Universal Blue SYBR Green qPCR Master Mix (Cat. # G3326; Servicebio, China), gene-specific primers, cDNA, and nuclease-free water. The reaction was performed in triplicate in a 0.1 ml PCR reaction plate, which was sealed with a PCR sealing film and centrifuged. PCR amplification was conducted on a fluorescence-quantitative PCR instrument with pre-denaturation at 95 °C for 30 s, 40 cycles of denaturation at 95 °C for 15 s, and annealing/extension at 60 °C for 30 s, followed by melt/curve analysis from 65 °C to 95 °C with fluorescence signal collection at 0.5 °C intervals (CFX Series Real-Time PCR Detection Systems, Bio-Rad Laboratories, Inc., CA, USA). Finally, relative gene expression was calculated using the ΔΔCT method. The gene-specific primer sets were listed as follows: Hepcidin, 5’-GACAGAAGGCAAGATGGCACTA-3’; 5’-GTCTCGCTTCCTTCGCTTCA-3’; GAPDH, 5’-CTGGAGAAACCTGCCAAGTATG-3’; 5’-GGTGGAAGAATGGGAGTTGCT-3’.
2.11. Western Blot Analysis
Proteins were extracted from lung tissues through RIPA lysis buffers and quantified using a BCA kit (Cat. # A55864, Thermo Fisher Scientific, MA, USA). First, 20 µg protein samples of each group were run on SDS-PAGE (6%-10%) and subsequently transferred to a polyvinylidene fluoride membrane (PVDF, 0.22 μm, Merck Millipore GmbH, Darmstadt, Germany). After protein transfer, the PVDF membranes were blocked with 5% skimmed milk for 1 h at room temperature, followed by overnight incubation at 4 °C with a suitable primary antibody (total oxidative phosphorylation Rodent WB antibodies, 1:1000, Abcam, Cat. # ab110413, USA; HIF2α, 1:1000, Cat. # A7553, Abclonal; GLUT1, 1:1000,Cat. # HY-P80494, MCE; lactate dehydrogenase [LDH], 1:1000, Cat. # HY-P80494, Proteintech; iron/sulfur cluster assembly enzyme [ISCU], 1:500, Cat. # 14812-1-AP, Proteintech; β-actin, 1:5000, Cat. # HY-P80494, Proteintech; Glyceraldehyde-3-Phosphate Dehydrogenase [GAPDH], 1:5000, Cat. # 10494-1-AP, Proteintech). After incubation with secondary antibodies for 1 h at room temperature, chemiluminescence signals were detected using an ECL kit (Cat. # BMU102, Abbkine Scientific Co., Ltd., Wuhan, China). Finally, ImageJ software was employed to analyze the intensity of the bands.
2.12. Non-Targeted Metabolomics Analysis Based on Liquid Chromatography-Mass Spectrometry (LC-MS)
Analyzing metabolites in mouse lung tissue samples involved several steps to ensure accurate and comprehensive results. Initially, the tissue samples were weighed before being lyophilized and ground in a single tube with a tungsten bead using a grinding mill (65 Hz, 1 min). Metabolites were obtained by extraction with a mixture of acetonitrile, methanol, and water, followed by ultrasonic treatment for 1 hour and centrifugation (4 °C, 14,000× g, 20 min). The resulting supernatants were evaporated to dryness under vacuum. Metabolomic profiling was performed with a UPLC-ESI-Q-Orbitrap-MS system, consisting of a Shimadzu Nexera X2 LC-30AD UHPLC (Shimadzu Corporation, Kyoto, Japan) and a Thermo Scientific Q-Exactive Plus (Thermo Fisher Scientific Inc., MA, USA). Liquid chromatography segregation was implemented through an ACQUITY UPLC® HSS T3 column with a specific gradient of mobile phases A and B. The ESI source conditions were optimized for positive and negative ion mode MS data collection. The instrument was used for scanning a range of m/z values for full MS, with resolutions of 70,000 and 17,500 at different m/z values for MS and MS/MS scans, respectively. The raw MS was shown through the MS-DIAL software (version 5.0) for peak alignment, retention time rectification, and peak region extraction. Metabolites were identified based on precise mass and MS/MS information by comparing them with various public databases. Only metabolites with significant quantitative values were retained for analysis. Overall, this rigorous analytical approach allowed for the comprehensive profiling and identification of metabolites in mouse lung tissue samples. The use of advanced equipment and data processing methods ensured the accuracy and reliability of the results obtained in this study.
Utilizing R (v 4.0.3) and its associated packages, comprehensive multivariate analysis and modeling were conducted. Prior to modeling, the data underwent mean-centring with Pareto scaling. Three key modeling techniques were employed: principal component analysis (PCA), orthogonal partial least-squares discriminant analysis (OPLS-DA), and partial least-squares discriminant analysis (PLS-DA). The risk of overfitting was rigorously assessed using permutation tests for all evaluated models. The descriptive models were measured by cumulative R2X and R2Y values, with perfect scores of 1 indicating a complete explanation of variance. Prediction performance, on the other hand, was evaluated by cumulative Q2 values (perfect model: Q2 (cum) = 1) and permutation tests (
n = 200). In permuted models, the values of R2 and Q2 at the Y-axis intercept were required to be below those of non-permuted models, ensuring predictive validity (
Supplemental File: Table S1, Figure S1A,B). OPLS-DA specifically enabled the recognition of discriminatory metabolites through the variable significance on the projection (VIP) score. This mark quantifies each variable’s contribution to distinguishing between sample classes. VIP values are calculated as a weighted sum of squares of PLS weights. Values above 1.5 were typically considered remarkable, denoting a robust discriminatory ability. Consequently, these scores serve as a critical criterion for biomarker selection.
Discriminating metabolites were recognized through a significant VIP threshold from the OPLS-DA model and a two-tailed Student’s t-test on standardized initial data. ANOVA was conducted for multiple groups, and metabolites showing VIP values exceeding 1.0 and p-values below 0.05 were deemed statistical significance. Fold change was calculated by taking the logarithm of the average mass spectrometric response ratio between two arbitrary classes. Furthermore, the identified differential metabolites were clustered using R packages for further analysis.
The study analyzed differential metabolite data to identify disrupted biologic pathways with the KEGG database (
http://www.kegg.jp, accessed on 23 September 2023). KEGG enrichment analyses, including Fisher’s exact test and FDR correction, were conducted to determine statistically significant changes. Enriched KEGG pathways were discovered to be significant at a level of
p < 0.05. This approach helped to pinpoint pathways affected by perturbations in biological processes.
2.13. Targeted Metabolomics Analysis
Mouse lung tissue was weighed prior to the extraction of metabolites. These tissues were then dried and ground within a 2 mL Eppendorf tube using a grinding mill (1 min, 65 Hz). Metabolites were obtained through a 1 mL mixture of acetonitrile, methanol, and water (2:2:1) that had been pre-cooled and subsequently subjected to 1 hour of ultrasonic treatment in ice baths. After this, the mixture was cooled for another hour at −20 °C and then centrifuged (4 °C, 14,000× g, 20 min). Accordingly, the supernatants were collected, evaporated to dryness under vacuum, and dissolved in 50% acetonitrile. To guarantee the data quality obtained from metabolic profiling, quality control (QC) specimens were prepared by combining aliquots from all the specimens to make one representative sample pool. The QC specimens underwent identical analysis as the experimental specimens for data normalization. After preparation, the dried extracts were filtered through a 0.22 µm cellulose acetate filter, transferred to 2 mL HPLC vials, and stored at −80 °C until further analysis. This meticulous process was critical in ensuring accurate and reliable results in metabolic profiling studies.
The LC/MS analysis utilized a Shimadzu Nexera X2 LC-30AD system with an ACQUITY UPLC BEH Amide column as well as a triple quadrupole mass spectrometer (QTRAP 5500, AB SCIEX LLC, MA, USA). Metabolites were identified using electrospray ionization in both negative and positive modes. Samples of 2 μL were injected into the LC autosampler. The column at 45 °C had a flow rate of 300 μL/min. One gradient elution method was employed, consisting of 20 mM ammonium acetate and 5% acetonitrile with a pH of 9.45 (solvent A) and 100% acetonitrile (solvent B). The gradient started at 5% solvent A for 1 min, increased to 45% solvent A over 12 min, then to 60% solvent A over 1 min, with a 2-min hold followed by returning to the initial conditions within 0.1 min, followed by a 3-min re-equilibration. QC specimens were interspersed every six to eight specimens in the analysis process.
The mass spectrometer was operated under specific conditions. A dwell time of 200 ms was used for optimal performance. A metabolite MRM library was developed by analyzing each standard metabolite at 50 mg/mL concentration using LC-MS/MS to determine the best MRM transition parameters. The retention times for 40 energy-related metabolites were established by measuring their individual MRM transitions (Q1/Q3).
Supplemental File (Table S2 and Figure S1C) depict the precursor/product ion pairs for these targeted energy metabolites. A reference standard containing the 40 metabolites was then prepared in a serial dilution for analysis using LC-MS.
MultiQuant software (version 3.1) was utilized to process the raw MRM data to conduct peak discoveries, alignment, extraction, and filtration. Through a significant threshold of fold change (FC) and two-tailed Student’s
t-test (
p-value) on the standardized raw data, discriminating metabolites were identified. A one-way analysis of variance (ANOVA) was performed, with the intention of determining the
p-value for the analysis on multiple groups. Metabolites showing an FC over 1.0 and a
p-value below 0.05 were deemed statistically significant. The FC was determined as the logarithm of the mean mass response (area) ratio between two arbitrary classes. Subsequently, cluster analyses were implemented through the R package based on the identified differential metabolites. Various models, including principal component analysis (PCA), orthogonal partial least squares-discriminant analysis (PLS-DA), and partial least squares-discriminant analysis (OPLS-DA), were built in accordance with the non-targeted metabolomics approach. Detailed parameters can be discovered in
Supplemental File: Table S3 and Figure S1D,E.
2.14. Measurement of ATP, Lactic Acid, and NO Content
ATP and lactate levels in serum and lung tissue were assessed by an ATP Assay Kit (Cat. # G4309-48T, Servicebio, Wuhan, China) and a Lactate Assay Kit (Cat. # A019-2-1, Jiancheng Bioengineering Institute, Nanjing, China) following the producer’s guidelines. The NO content in animal serum and cell culture medium was measured using specific kits (Cat. # A012-1-2, Jiancheng Bioengineering Institute, Nanjing, China) according to the instructions.
2.15. Quantification of Iron Metabolism Parameters
Serum and tissue iron, as well as ferritin, were measured according to the instructions of the reagent kit. The kit for iron measurement was from Nanjing Jiancheng Bioengineering Institute, China (Cat. # A039-1-1; A039-2-1), and the kit for ferritin measurement was from Elabscience Biotechnology Co., Ltd. (Wuhan, China) (Cat. # E-EL-R3018).
2.16. Cell Culture
Rat pulmonary artery endothelial cells (RPAECs, CD31 fluorescence identification is reported in
Supplementary Figure S1F) and human pulmonary artery endothelial cells (HPAECs, the short tandem repeat (STR) assay report is shown in
Supplementary Figure S1G,H) were supplied by Wuhan Procell Life Technology Co., Ltd., (Wuhan, China) and Bena Biological Technology Co., Ltd. (Xinyang, China)., respectively, and cultured with endothelial cell medium (ECM, ScienCell Research Laboratories, CA, USA) containing vascular endothelial growth factor at 37 °C with 5% CO
2. The cells at passages 3–5 were used in this study. PAECs cultured under hypoxia were treated with 1% O
2 concentration for 24–48 h [
33,
34].
2.17. Cellular Pharmacological Interventions
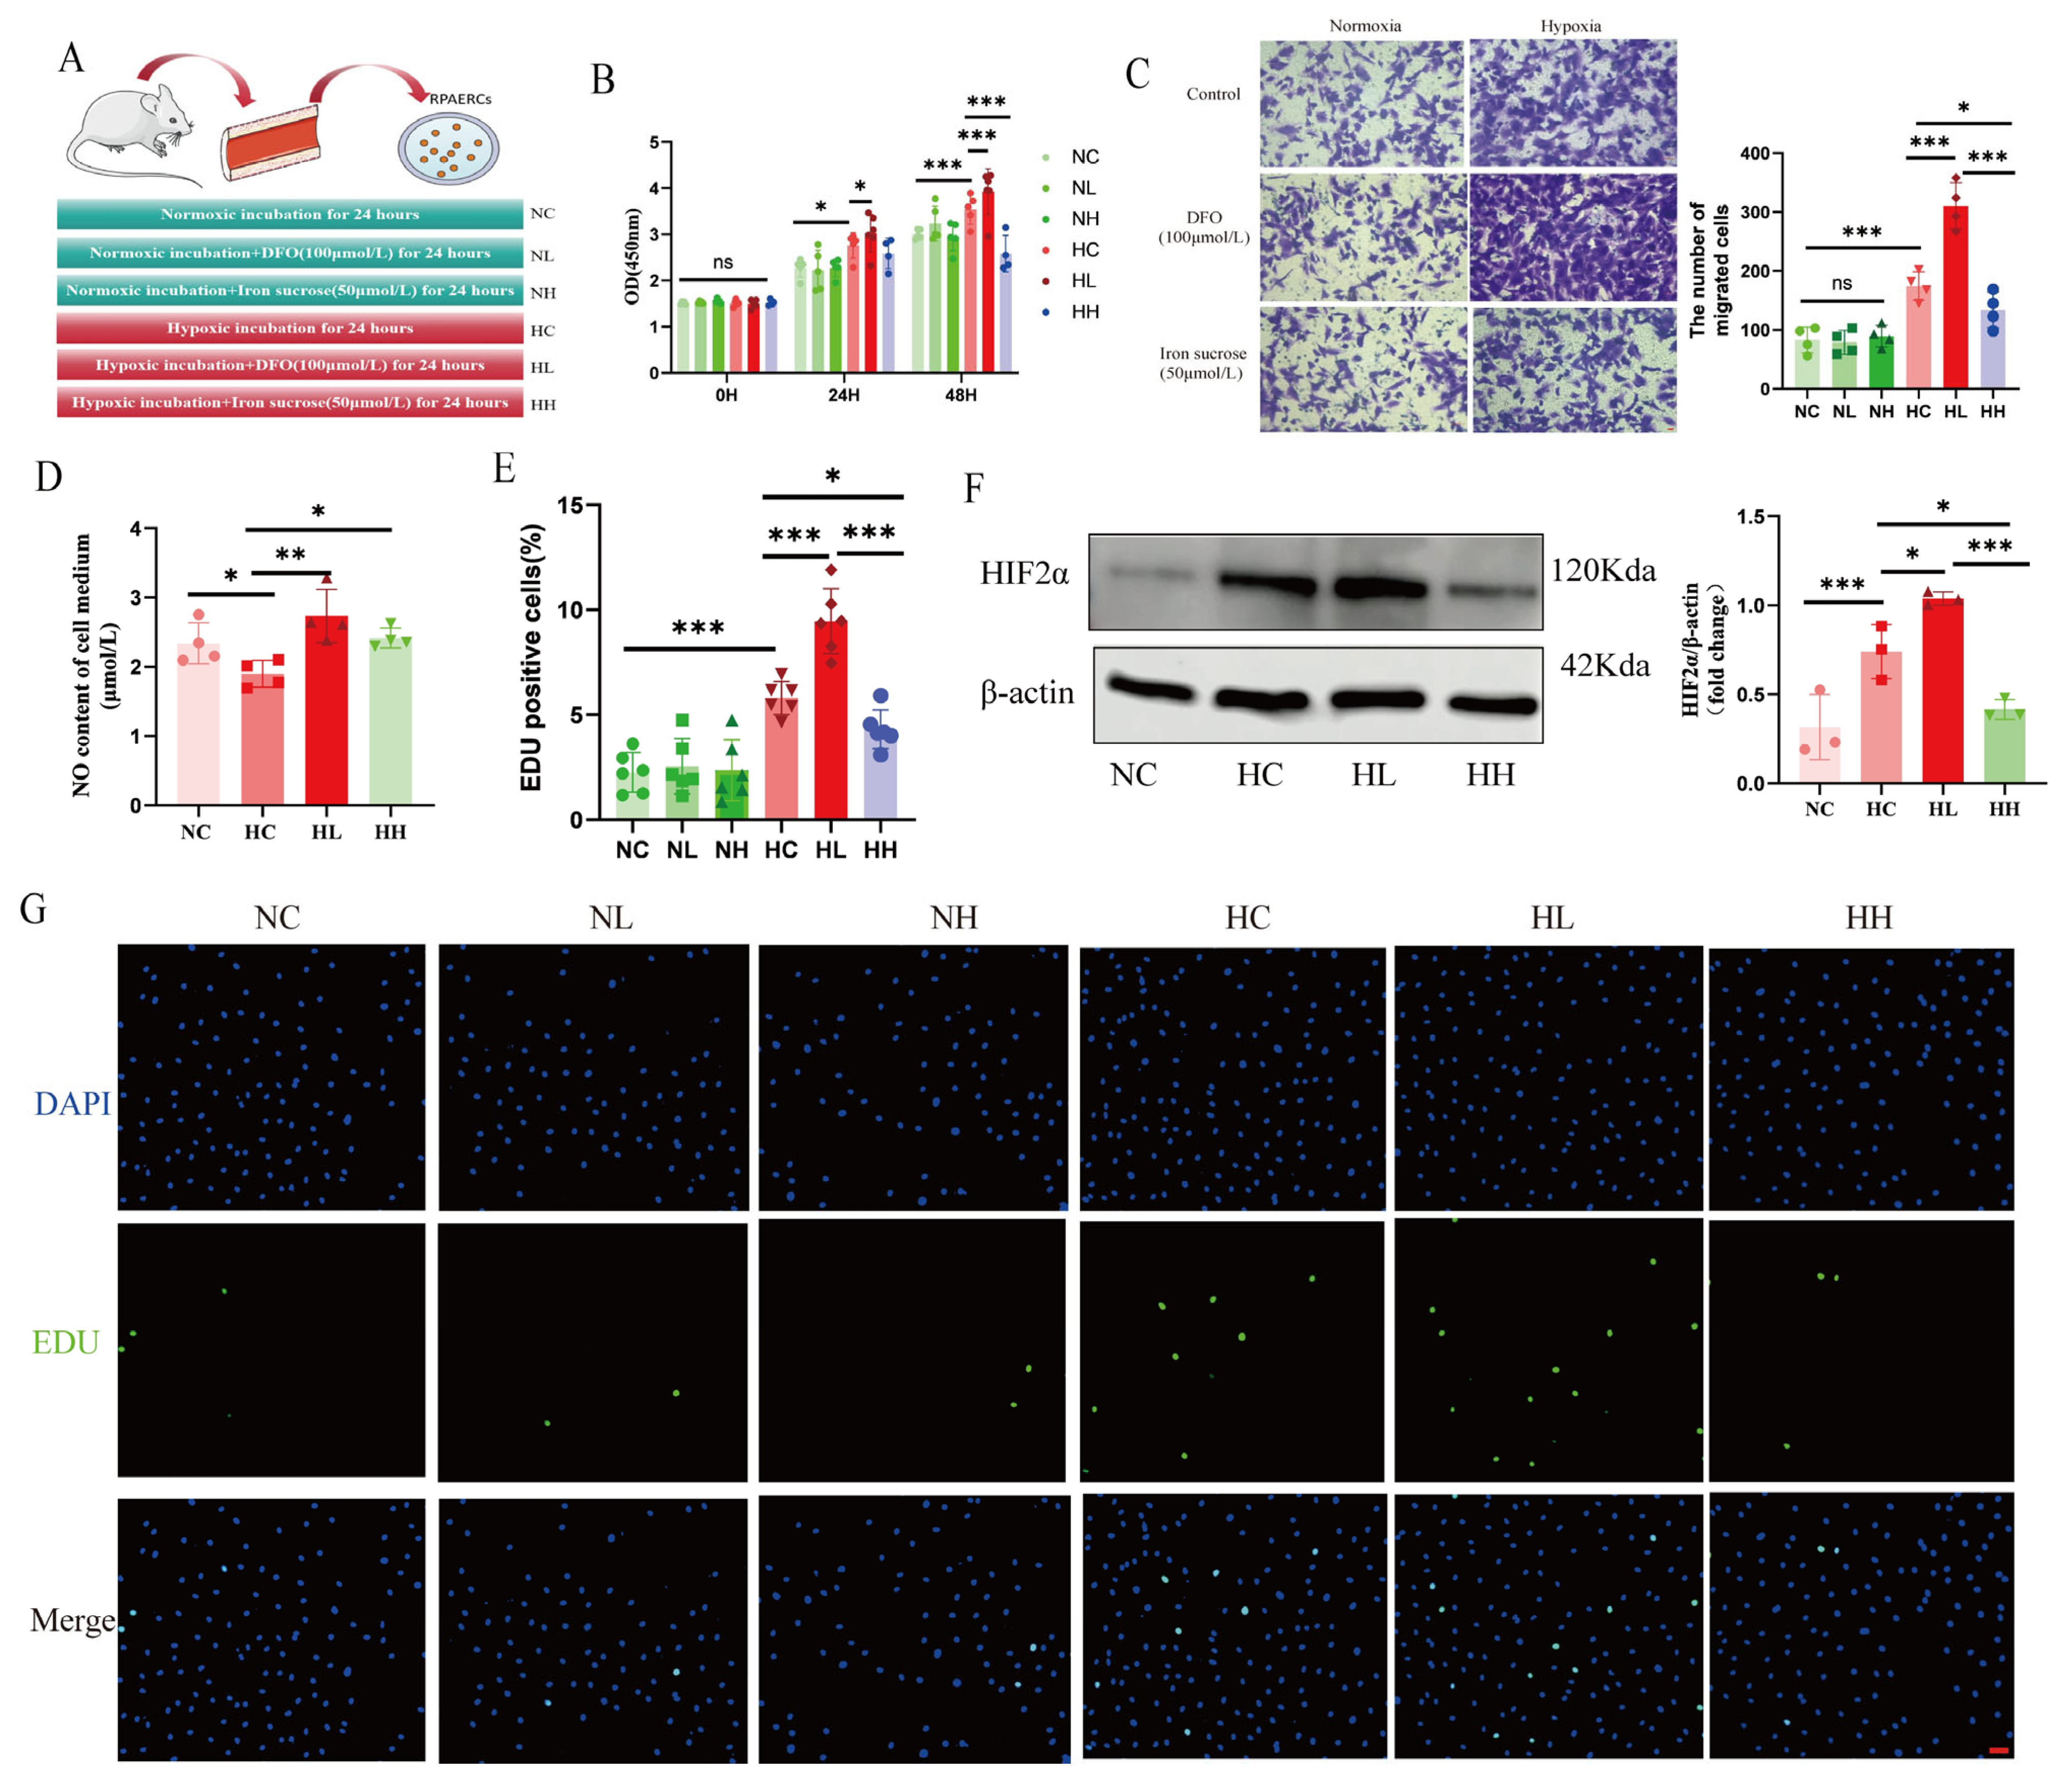
RPAECs were treated with DFO (100 µmol/L, Cat. # HY-B0988, MedChemExpress LLC, NJ, USA), iron sucrose (50 µmol/L, Cat. # HY-B2068, MCE), and PT2385 (20 µmol/L, Cat. # HY-12867, MCE) as previously described [
35,
36].
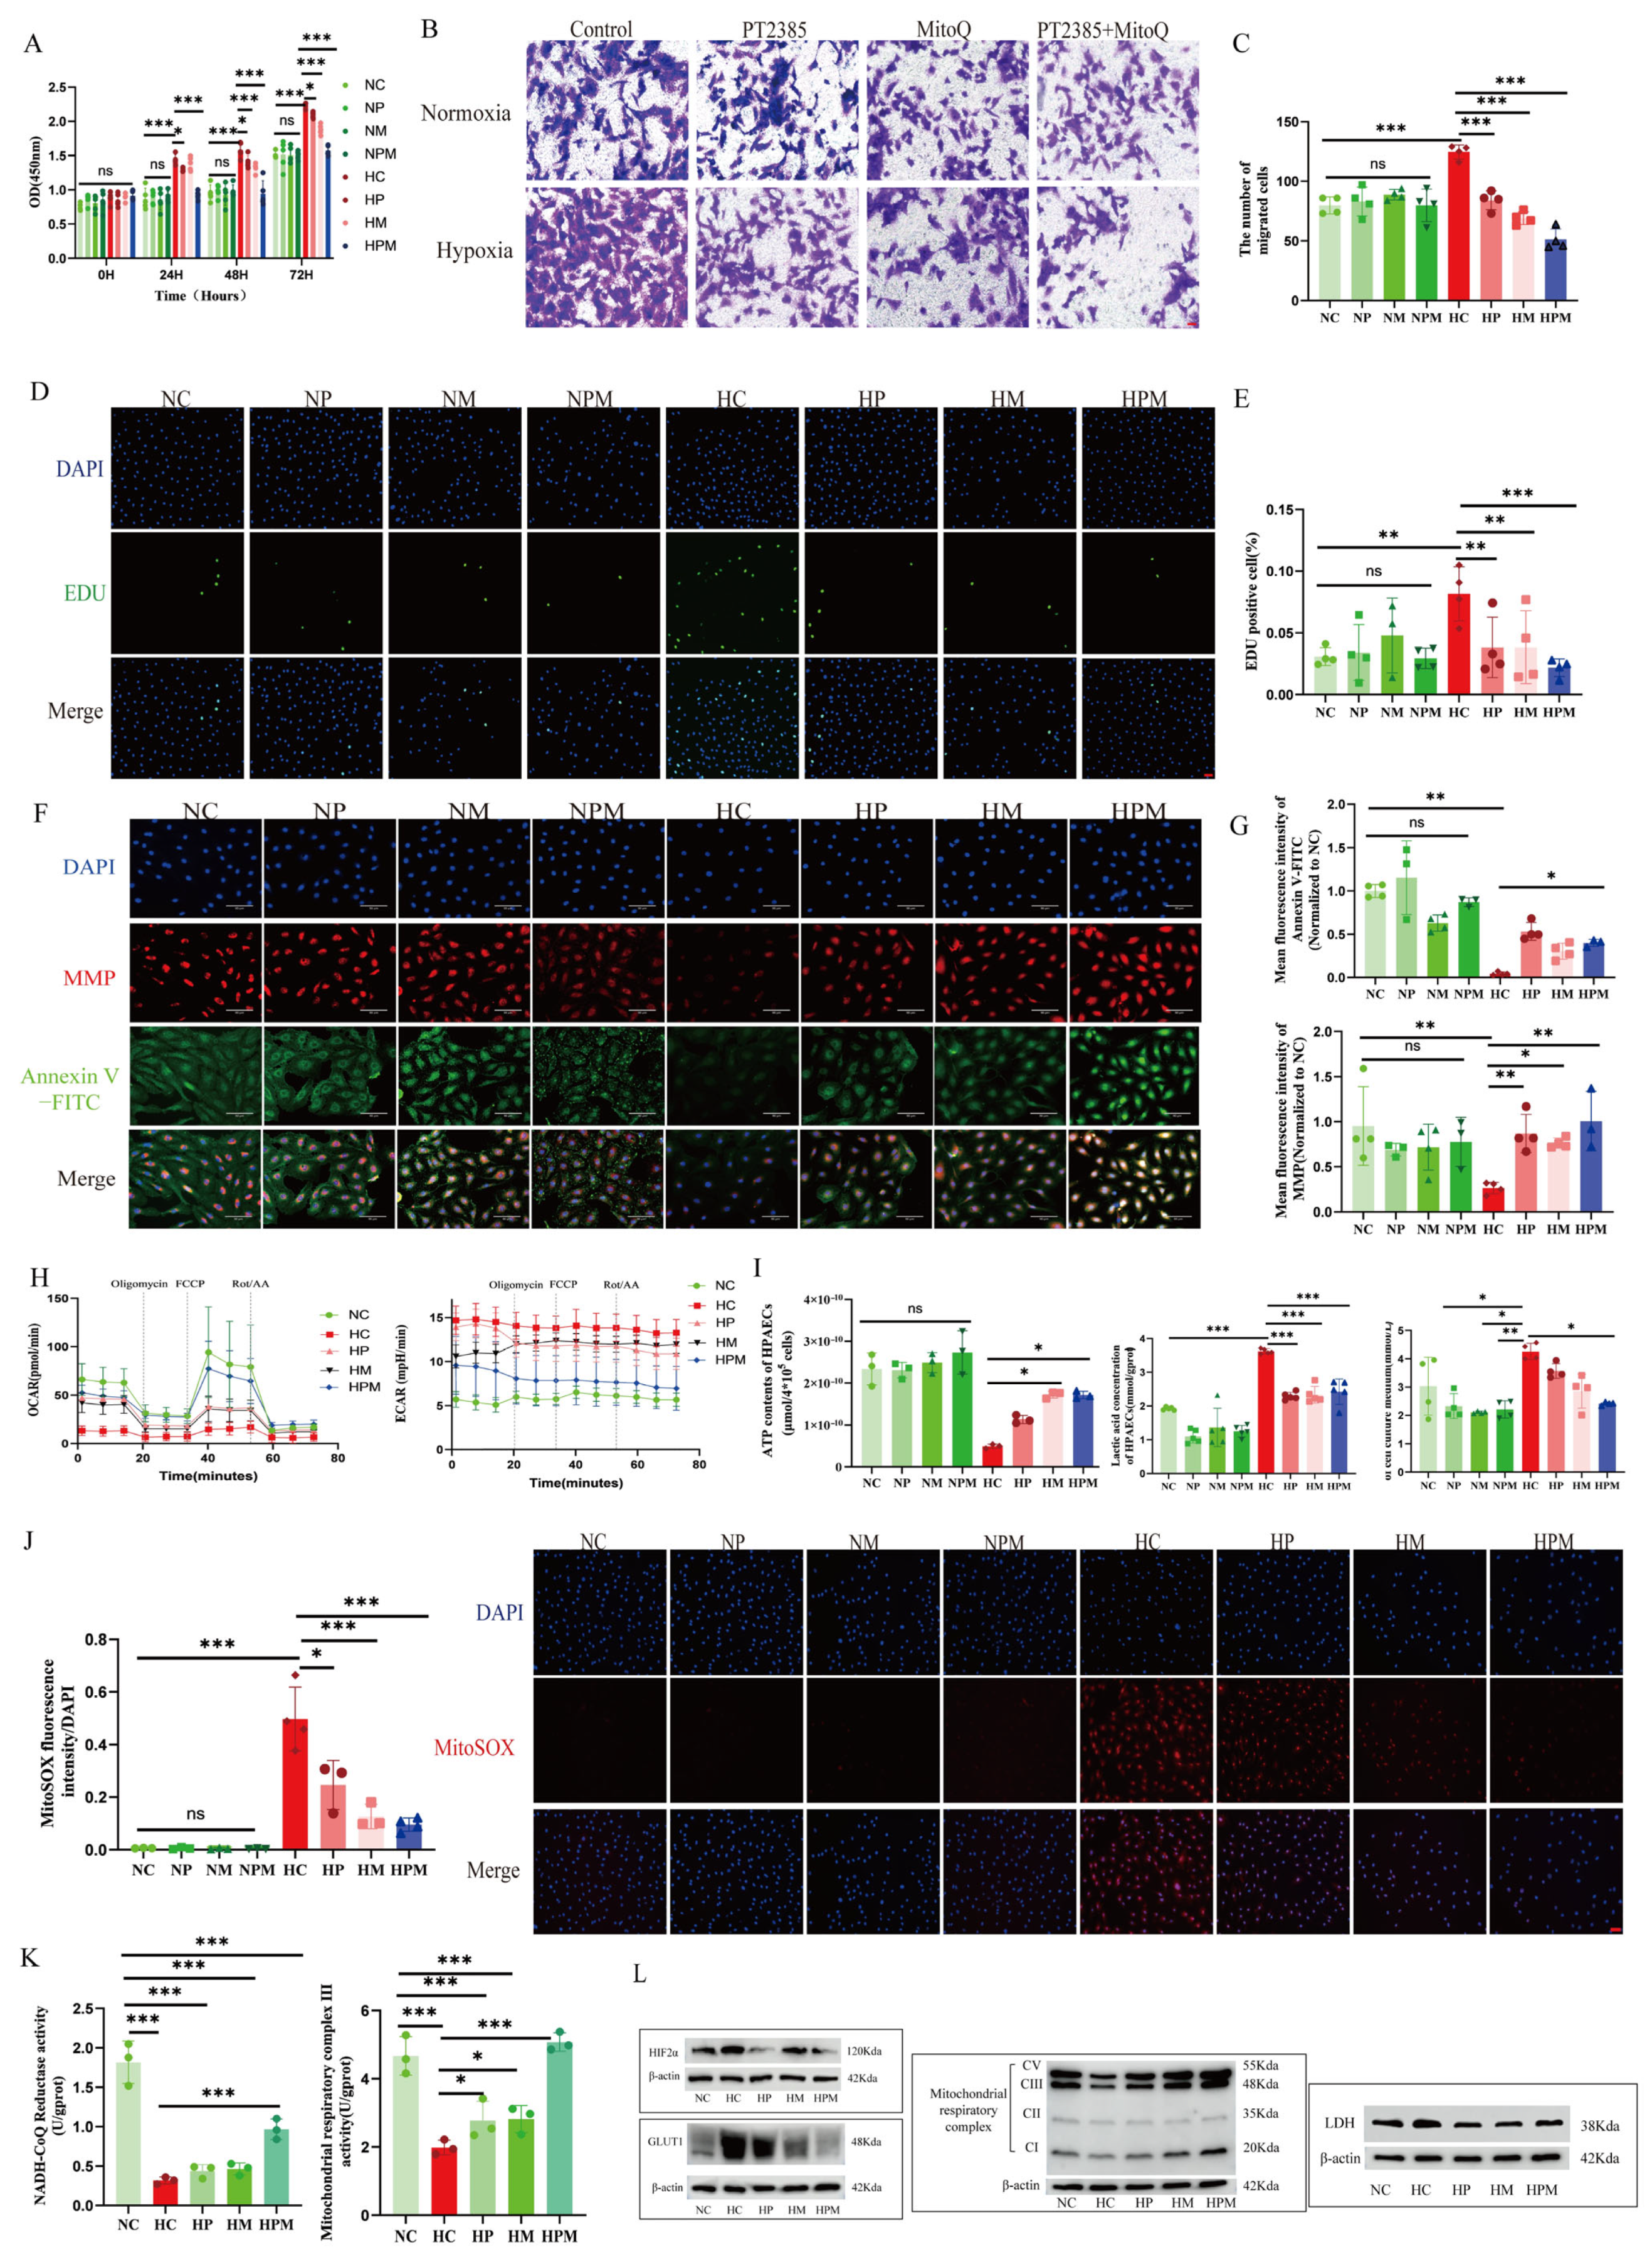
HPAECs were treated with PT2385 (20 µmol/L, Cat. # HY-12867, MCE) and Mitoquinone mesylate (MitoQ, 1 µmol/L, Cat. # HY-100116A, MedChemExpress LLC, NJ, USA) for 24–72 h (
Figure S2A) [
37].
2.18. Cell Proliferation and Migration Experiment
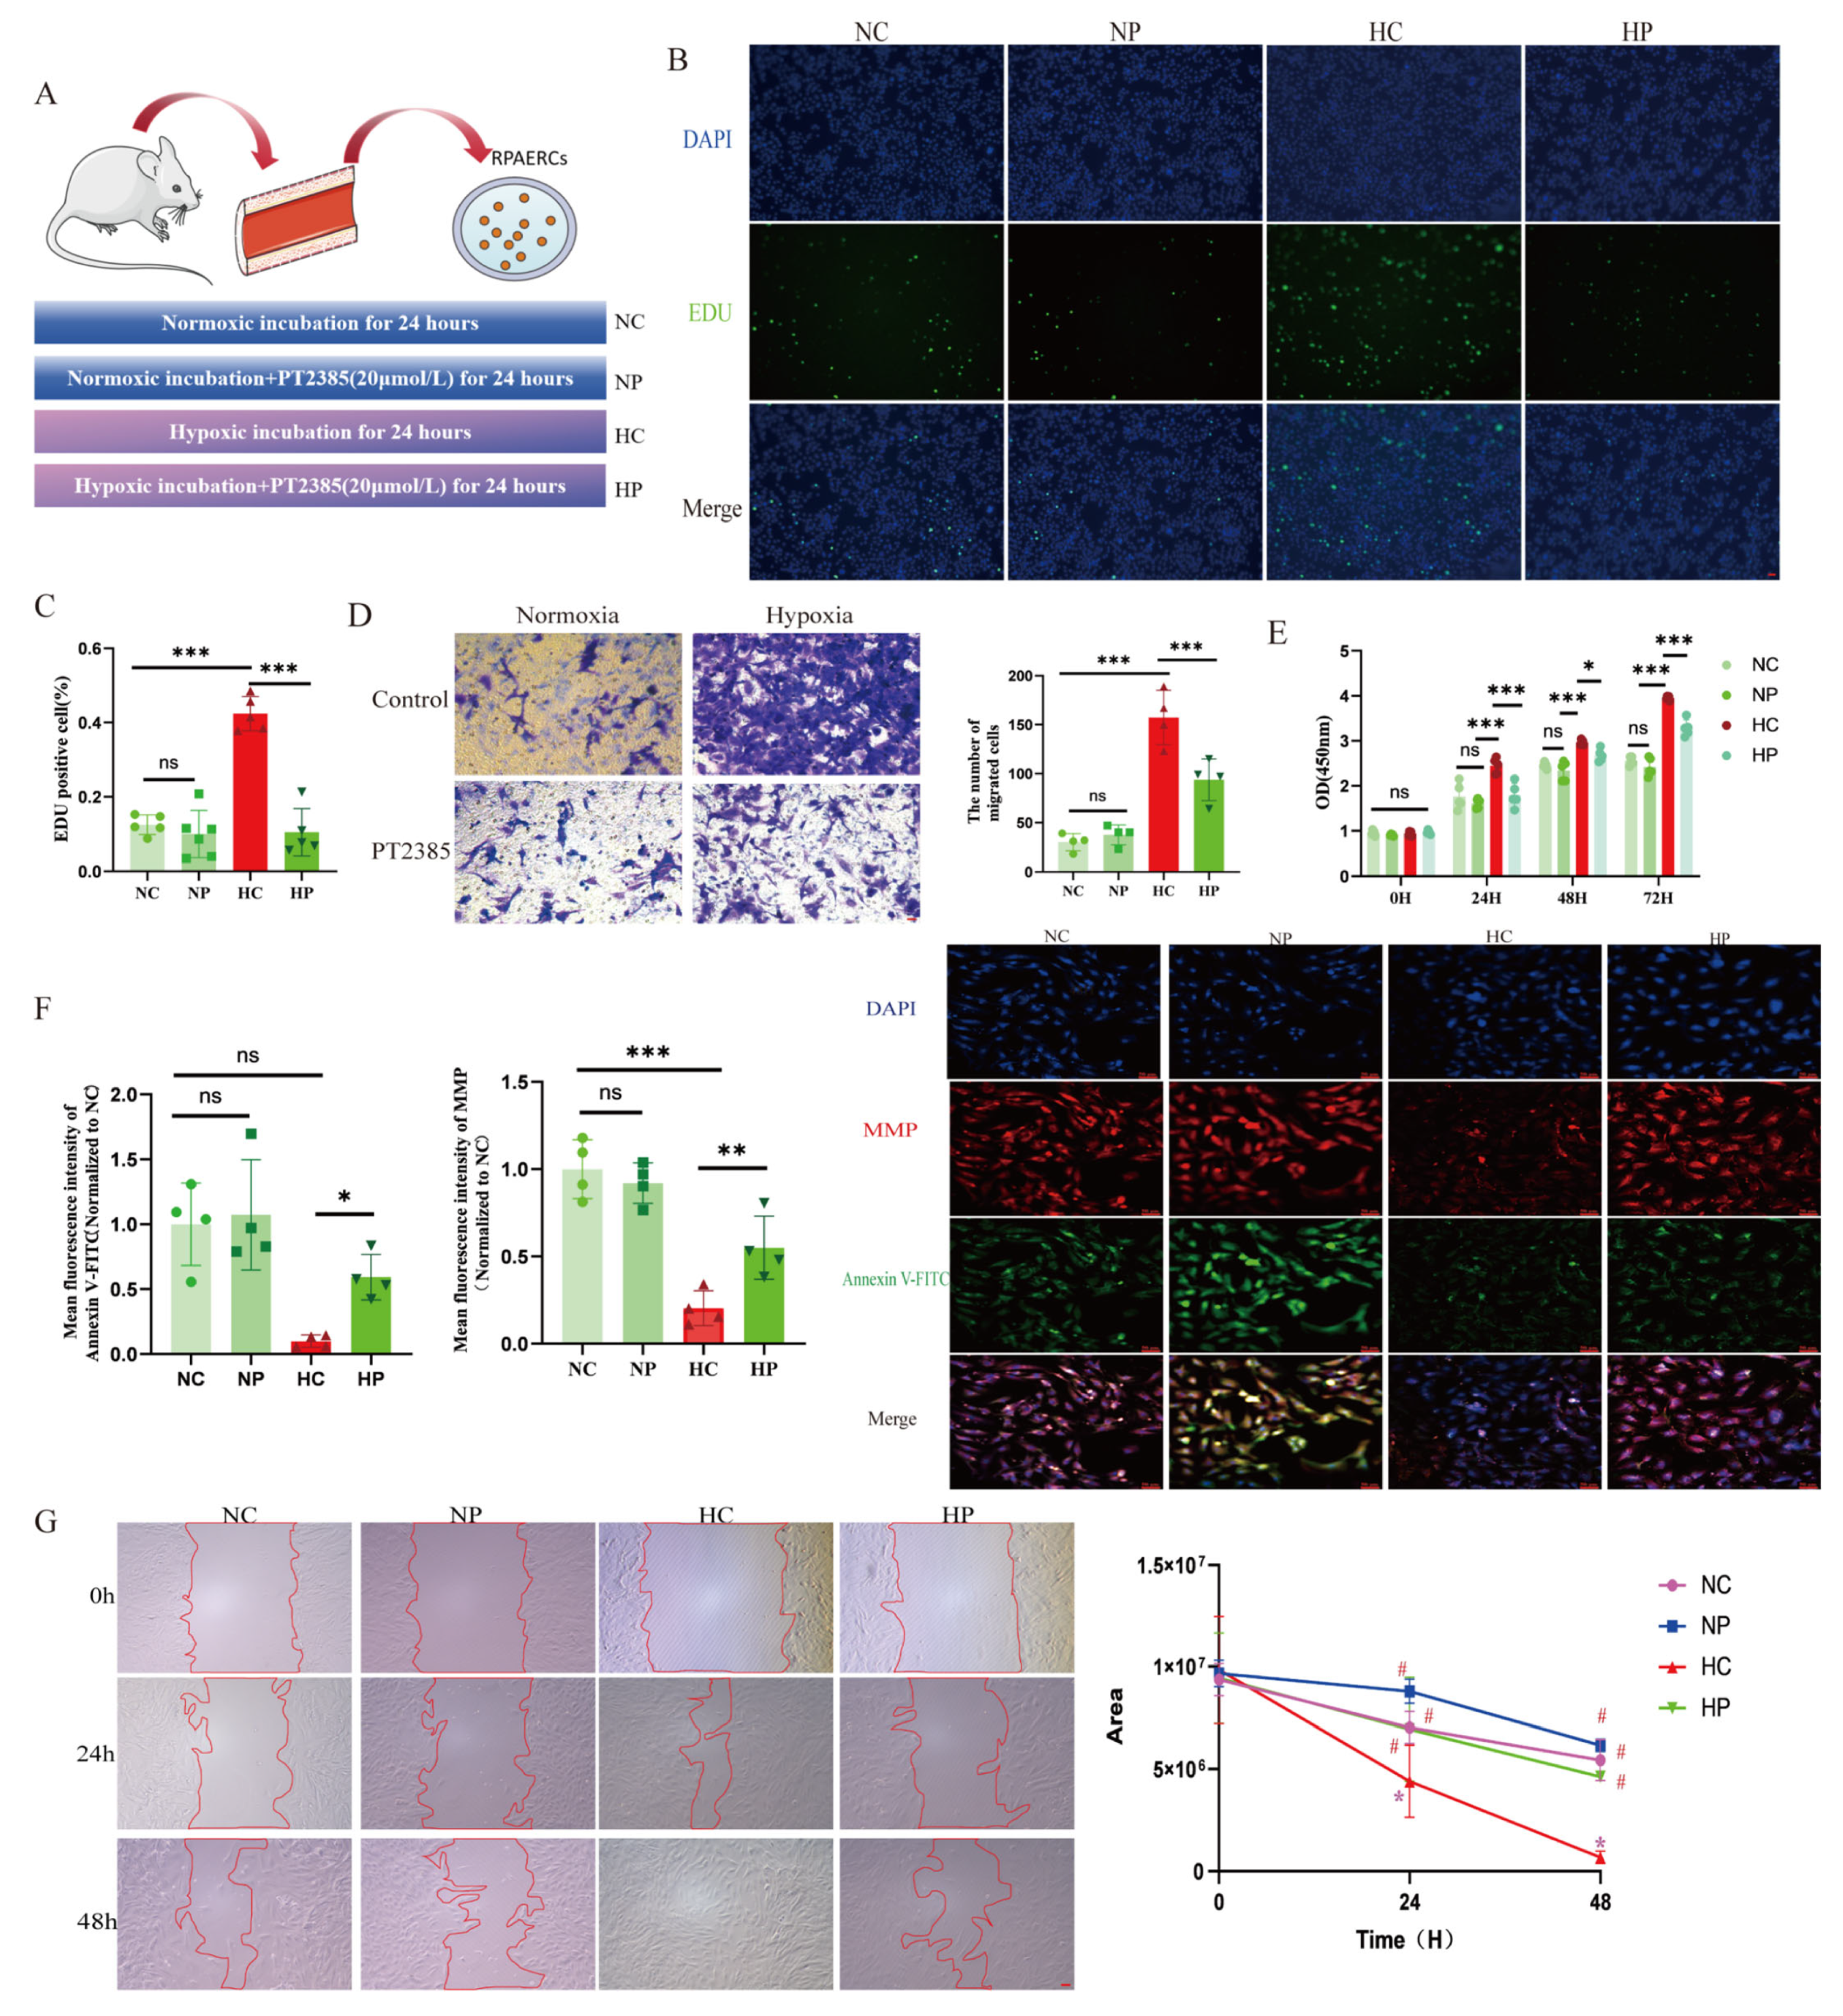
A CCK-8 kit (Cat. # E-CK-A362, Elabscience) was employed to investigate cell proliferation, as per the producer’s guidelines. A microplate reader (BioTek Instruments, Inc., Vermont, USA) was employed to measure the absorbance at 450 nm. Detection of cell proliferation was performed in light of the instructions of the EDU Cell Proliferation Kit (Cat. # C0071L, Beyotime), and image observation was performed using a fluorescence microscope (ECHO/RVL-100). Then, ImageJ software was employed to analyze the data. For transwell experiments, after starvation pretreatment, PAECs were inoculated in the upper compartment of 24-well transwell plates, with ECM containing 10% fetal bovine serum inoculated in the lower compartment. PAECs were continuously migrated for 24 h under normoxia or hypoxia, respectively, immobilized in 4% paraformaldehyde, and subsequently stained with 1% crystal violet (30 min at room temperature). A Zeiss Axio Vert A1 microscope (Carl Zeiss AG, Oberkochen, Germany) was used to record cell images in four random fields of view, and finally, the cells were counted by ImageJ software. For wound healing experiments, PAECs were first cultured until they reached confluence and then scratched with a 200 μL pipette tip. Afterward, the cells were incubated in the serum-free medium in a normoxic or hypoxic environment for another 72 h. A Zeiss Axio Vert microscope was used to take photographs at 0, 24, 48, and 72 h, and ImageJ software was used to assess the area of the wound and to calculate the percentage of wound healing.
2.19. Seahorse Experiment
Seahorse XFe 96 (Agilent Technologies, Inc., CA, USA) was utilized to detect the extracellular acidification rate (ECAR) and mitochondrial oxygen consumption rate (OCR) of PAECs. Sensor cartridges were hydrated by adding 200 μL calibration solution per well in utility plates 24 h prior to experiments and incubated overnight at 37 °C under CO2-free conditions. PAECs (1 × 10⁴ cells/well) were seeded in 96-well Seahorse XF plates and treated with drugs under specified oxygen concentrations for 24 h. Culture medium was replaced with Seahorse XF assay medium (5 mM glucose, 2 mM pyruvate), followed by a 40-min pre-incubation at 37 °C (CO2-free) for pH/temperature equilibration. The following compounds were loaded into cartridge ports: oligomycin (2 μM, Port A), FCCP (0.5 μM, Port B), rotenone/antimycin A (0.5 μM, Port C). Hydrated cartridges and cell plates were loaded into the analyzer for automated calibration. OCR/ECAR measurements were performed per manufacturer’s protocols, with cycle parameters (interval timing, mixing/measurement duration) defined in Seahorse XF software (version 2.6.1.53). Data were exported for statistical analysis.
2.20. Measurement of Mitochondrial Complex I and III Activities
Cells were seeded uniformly in T25 flasks. Following complete adherence, pharmacological interventions under defined oxygen tensions were applied for 24 h prior to cell collection. Mitochondrial complex I/III activities were subsequently quantified per manufacturer’s protocols (Cat. # E-BC-K834-M and E-BC-K836-M; Wuhan Elabscience Biotechnology Co., Ltd.).
2.21. Statistical Analysis
The whole data were processed by SPSS 28.0 and GraphPad 10.0 software. The data with normal distribution were denoted as the mean ± standard deviation, with the skewed distribution shown as the median (the first quartile and the third quartile). The two groups were compared through an independent-sample t-test for normal distribution data and a non-parametric Mann–Whitney test for skewed distribution data. One-way ANOVA and LSD post hoc tests were adopted to contrast multiple groups, with Spearman correlation utilized to explore the relationship between disparate variables. A p-value of less than 0.05 was considered statistically significant.
4. Discussion
Plateau HPH is a severe and fatal disease. To date, there are no effective drugs for the treatment of plateau HPH [
39]. Therefore, screening for new targets of intervention may be a potential approach to treat HPH. Notably, PVR is a crucial pathogenic alteration in HPH, and iron homeostatic imbalance is a key player in initiating and developing such a process. Recently, some clinical studies have indicated that iron deficiencies are widespread among patients suffering from group 1 PH and connected to a remarkable decrease in exercise capacity, a significant deterioration of clinical symptoms, and a decline in survival of patients with PH [
11,
12,
13,
14]. Here, we observed that chronic hypoxia leads to disorders of iron metabolism. Patients with HPH caused by chronic lung diseases at plateau typically exhibited decreased serum iron levels and TSAT saturation. Meanwhile, the animal model of HPH mainly showed reduced serum iron and ferritin levels. These observations are consistent with previous research findings [
15,
35]. Disturbed iron metabolism may be related to the expression of Hepcidin, a significant factor that regulates iron metabolism, and in our study, we found that hypoxia induced an elevation of hepatic Hepcidin, which binds to ferroportin, the only cellular iron export factor, and inhibits intracellular iron output. The dysregulation of hepatic Hepcidin expression may be related to the BMPR/SMD pathway, an essential regulator of Hepcidin expression [
35]. Similarly, PH due to iron deficiency has been studied, with results from animal experiments suggesting that chronic iron deficiency diets lead to PVR under normoxia and that iron replacement attenuates low iron-induced PVR [
15]. In patients with chronic high-altitude diseases, iron deficiency caused by phlebotomy can also exacerbate pulmonary hypertension [
17]. Intriguingly, it is unclear whether low iron exerts a dual pathogenic role under chronic hypoxia. Moreover, our results indicated that hypoxia combined with iron deficiency aggravated PH and PVR. In contrast, iron supplementation attenuated hypoxia-induced PH and PVR. This provides important references for the function of iron supplementation in HPH.
Furthermore, our discoveries demonstrate that iron deficiencies are associated with the activation of HIF2α and that, as proline hydroxylase requires iron as a cofactor, the underlying mechanism may involve hypoxic stabilization of HIF2α. HIF2α, a critical transcription factor for hypoxic adaptation, is abundantly expressed mainly in endothelial cells, a finding confirmed by our immunofluorescence results. In addition, previous studies have confirmed that HIF2α inhibitors or endothelium-specific deletion of HIF2α improve PVR and attenuate PH [
40,
41,
42,
43,
44,
45]. Different from these studies, the HIF2α inhibitor we chose was PT2385, which has been used in a phase II clinical trial for treating renal clear cell carcinoma and has been shown to be safer and more efficacious than other HIF2α inhibitors in humans [
46,
47]. Our findings further demonstrate that PT2385 significantly attenuates hypoxia-induced PH and PVR. These results provide compelling preclinical evidence supporting the therapeutic potential of HIF2α inhibitors in HPH.
Previous studies show that HIFs play a crucial role in regulating the metabolic shift in embryonic fibroblasts and nerve cells. The activation of HIF2α inhibits mitochondrial oxidative phosphorylation. The administration of HIF2α inhibitors can regulate mitochondrial morphology and quality and reverse the energy metabolic shift from glycolysis to oxidative phosphorylation [
24,
25,
48]. The precise mechanisms by which HIF2α impairs mitochondrial function remain incompletely characterized. Emerging evidence suggests that HIF2α activation downregulates iron/sulfur cluster assembly factors (e.g., ISCU and frataxin), which are essential for the biogenesis of mitochondrial complexes I–III. These cofactors mediate electron transport through iron/sulfur clusters, and their deficiency may directly contribute to respiratory chain dysfunction under hypoxic conditions [
20,
24,
49,
50]. Our research results show that HIF2α inhibitors can reverse the reduction in ISCU expression induced by chronic hypoxia, thereby restoring the activities and protein content of mitochondrial complexes I and III under hypoxia. Notably, mitochondrial iron/sulfur clusters are integral components of complexes I–III, which serve as primary sites for physiological ROS generation. Under hypoxic conditions, complexes I and III remain major ROS-producing sites [
20,
21,
51]. This functional interplay mechanistically links HIF-2α signaling, iron/sulfur cluster biogenesis, and ROS homeostasis, suggesting a hypoxia-adaptive pathway where HIF2α modulates mitochondrial redox balance via iron/sulfur-dependent electron transport regulation.
Accumulating evidence indicates that mitochondrial ROS play a crucial role in signaling the mismatch between energy production and demand. Given our finding that HIF2α inhibitors alleviate hypoxia-induced suppression of mitochondrial complexes I and III, we investigated mitochondrial ROS alterations under hypoxia. We discovered that mitochondrial ROS production was elevated in PAECs under hypoxia, and that PT2385 inhibited the hypoxia-induced augmentation of mitochondrial ROS production. MitoQ, a targeted mitochondrial ROS scavenger, has been used to treat pulmonary artery smooth muscle cells and cardiomyocytes exposed to chronic hypoxia. However, it was found to be ineffective in hypoxia-induced phenotypic alterations in the above-described smooth muscle cells, but effective in cardiomyocytes [
52]. We speculate that this may be determined by the cell type, and future validation of animal models of endothelial cell-specific clearance of mitochondrial ROS is needed.
This study has several limitations that are worth considering. Firstly, while genetic knockout models could provide deeper mechanistic insights, our experimental design prioritized pharmacological interventions with PT2385—a clinically validated HIF2α inhibitor currently in phase II trials for renal carcinoma. Given its established safety profile and translational potential for repurposing in HPH, we focused on therapeutic-relevant approaches rather than exploratory genetic manipulations. Secondly, human lung tissue analyses were precluded by limited access to pulmonary vascular specimens from HPH patients. Future studies should incorporate precision-cut lung slices or patient-derived organoid models to bridge this gap.


