Article

Factors Determining Kinesin Motors in a Predominant One-Head-Bound or Two-Heads-Bound State During Its Stepping Cycle

by
Xiao-Xuan Shi
1,2,
Yu-Ru Liu
2 and
Ping Xie
2,*
1
School of Pharmaceutical Engineering, Chongqing Chemical Industry Vocational College, Chongqing 401220, China
2
Laboratory of Soft Matter Physics, Institute of Physics, Chinese Academy of Sciences, Beijing 100190, China
*
Author to whom correspondence should be addressed.
Biomolecules 2025, 15(5), 717; https://doi.org/10.3390/biom15050717
Submission received: 3 April 2025 / Revised: 30 April 2025 / Accepted: 9 May 2025 / Published: 13 May 2025
(This article belongs to the Section Molecular Biophysics: Structure, Dynamics, and Function)

Abstract

:
At physiological or saturating ATP concentrations, some families of kinesin motors, such as kinesin-1 and kinesin-2, exhibit a predominant two-heads-bound (2HB) state during their stepping cycle on microtubules, while others, such as kinesin-3, exhibit a predominant one-head-bound (1HB) state. An interesting but unclear issue is what factors determine a kinesin motor in the predominant 1HB and 2HB states. Here, on the basis of the general chemomechanical pathway of the kinesin motors, a theory is given on fractions of 1HB and 2HB states. With the theory, the factors affecting a kinesin motor in the predominant 1HB and 2HB states are determined. The results about the effects of ATP concentration, ADP concentration and external load on the fractions of 1HB and 2HB states are presented. Furthermore, the theory is applied to kinesin-1, kinesin-2, kinesin-3, kinesin-5 and kinesin-13 motors, with the theoretical results agreeing well with published experimental data.

1. Introduction

The kinesin superfamily can be categorized into 14 subfamilies according to their structural similarity and function [1,2,3,4]. Most subfamilies of the kinesin motors are in a dimeric form, containing the two motor domains (also called heads) that are connected together by a common and long stalk via their flexible neck linkers (NLs) [5,6]. By making use of the chemical energy derived from the hydrolysis of ATP molecules, the dimeric motors can move processively on microtubules (MTs) toward the plus end, carrying out multiple cellular functions that include cargo transport [1,2,3,4]. It was well determined that the dimer can move along an MT filament in a hand-over-hand manner and alternate between a one-head-bound (1HB) state and a two-head-bound (2HB) state [7,8,9,10,11,12,13,14,15,16,17]. Interestingly, it was found that under saturating or physiological ATP concentrations, some families of kinesin motors, such as kinesin-1, kinesin-2 and kinesin-5, exhibit the predominant 2HB state [13,14,15,16], while others, such as kinesin-3, exhibit the predominant 1HB state [17]. It was generally believed that adopting the predominant 2HB state would ensure the kinesin-1 and kinesin-2 dimers have high processivity [14] and make the kinesin-5 motors able to generate large forces as teams in anaphase spindle elongation [18,19]. By contrast, adopting the predominant 1HB state could make the stepping dimer have a small effect on the removal of tubulin heterodimer from the MT lattice because in the 1HB state no internal force is present between the two heads, which arises from the NL stretching [20,21,22,23,24,25]. Additionally, studies indicated that on the MT lattice, instead of directional movement kinesin-13 MCAK dimer makes an unbiased one-dimensional diffusion in the predominant 1HB state [26,27]. For kinesin-1, the effect of ATP concentration on the duration of the 2HB state and that of the 1HB state in a stepping cycle were also studied both experimentally and theoretically [11,13,14,28,29,30], and, in particular, the controversial experimental data [11,13,28] were explained consistently [30].
What are the factors that determine the motor in the predominant 1HB or 2HB state? How does ATP concentration affect the kinesin-3 motor in the predominant 1HB or 2HB state? How does the external load affect a kinesin motor in the predominant 1HB or 2HB state? If free ADP molecules are present in the solution, how does ADP concentration affect a kinesin motor in the predominant 1HB or 2HB state? To address the unclear issues, on the basis of the general chemomechanical pathway of the kinesin motor, a theory is given on the fraction of the 1HB or 2HB state. With the theory, the factors that affect a kinesin dimer in the predominant 1HB or 2HB state are determined, and the effects of ATP concentration, external load and ADP concentration on the 1HB and 2HB states are studied. Furthermore, the theory is applied for kinesin-1, kinesin-2, kinesin-3, kinesin-5 and kinesin-13 motors, explaining well the available experimental data.

2. General Chemomechanical Pathway of Kinesin Dimer

The pathway for the chemomechanical coupling of the kinesin dimer is shown schematically in Figure 1, which is modified from that presented before [30]. Here, besides free ATP molecules, we also consider that free ADP molecules are present in solution. The main elements on which the pathway is constructed are presented in Section S1 (see Supplementary Information, SI). Since for most families of kinesin motors the rate of ATP transition to ADP in the leading head (LH) is much smaller than that in the trailing head (TH), for simplicity, we do not consider ATP transition to ADP in the LH. Since this work focuses on the mean durations and fractions of the 1HB and 2HB states in a mechanical step, the dissociation of the motor from MT is not considered.
Initially, one head of the dimer in the ADP state binds with weak affinity Ew2 (defined in SI) to tubulin II on an MT filament (Figure 1a), where the two heads have a high binding energy to each other, preventing the detached head from diffusing far away from the MT-bound head and from binding to the nearest unoccupied tubulin I or III. After ADP release from the MT-bound head (Figure 1b), either ATP or ADP can bind. After ATP binds (Figure 1c), a large conformational change in the ATP-head, together with the docking of its NL and the great decrease in its binding energy to the detached ADP-head, occurs (Figure 1d). Then, the detached ADP-head can, with a probability PE, diffuse rapidly forward and bind to tubulin III with affinity Ew2 (Figure 1e) and, with probability 1–PE, diffuse backward and bind to tubulin I (Figure 1f) (noting that the latter requires overcoming the energy barrier arising from the NL docking and the large conformational change in the ATP-head).
In Figure 1e, before ADP release from the LH, ATP transition to ADP in the TH can occur. Due to the large force on the TH, which arises from the NL stretching, and the weak affinity of Ew1 (with Ew1 << Ew2, see SI) of the TH to the local tubulin II, the TH detaches and diffuses to the intermediate (INT) position, where the detached ADP-head has the high binding energy to the MT-bound head (Figure 1g). In Figure 1e, before ATP transitions to ADP in the TH, ADP release from the LH can occur (Figure 1h). In Figure 1g, ADP release from the MT-bound head occurs (Figure 1i). In Figure 1h, before either ATP or ADP binds to the LH, ATP transition to ADP in the TH can occur. The TH detaches and diffuses to the INT position, where the two heads have the high binding energy to each other (Figure 1i). In Figure 1h, before ATP transitions to ADP in the TH, either ATP or ADP can bind to the LH (Figure 1j or Figure 1e). In Figure 1j, after ATP transitions to ADP in the TH, the TH detaches and diffuses to the INT position, where the two heads have the high binding energy to each other (Figure 1k). In Figure 1i, either ATP or ADP can bind to the nucleotide-free MT-bound head (Figure 1k or Figure 1g). The state in Figure 1k is the same as that in Figure 1c, except that in Figure 1k the motor takes a forward step.
In Figure 1f, after ADP release from the TH (Figure 1l), either ATP or ADP can bind to the TH (Figure 1m or Figure 1f). In Figure 1m, after ATP transitions to ADP in the TH, the TH detaches and diffuses to the INT position, with the system returning to Figure 1c.
As it is seen, a stepping cycle corresponds to the transitions from Figure 1c through Figure 1k (including the futile coupling transitions from Figure 1d to Figure 1m and returning to Figure 1c). The mechanical steps include the diffusion of the ADP-head from the local tubulin to the INT position (i.e., the transition from Figure 1e to Figure 1g, from Figure 1h to Figure 1i, from Figure 1j to Figure 1k, or from Figure 1m to Figure 1c), which occurs after ATP transition to ADP in the TH, and the diffusion of the detached ADP-head from the INT position to the nearest tubulin (i.e., the transition from Figure 1d to either Figure 1e or Figure 1f), which occurs after the decrease in the binding energy of the MT-bound ATP head to the detached ADP-head. The other transitions correspond to the ATPase activity and the large conformational change in the head. As shown before [31], in the optical trapping assay with the movable trap, the load on the stalk of the motor has little effect on the detached head diffusing from the rear position to the INT position and has a large effect on the detached head diffusing from the INT position to the front/rear tubulin.

3. Results and Discussion

3.1. General Theory on Fractions of 1HB and 2HB States

In this section, we provide the general theory on fractions of 1HB and 2HB states of the kinesin dimer on the basis of the pathway shown in Figure 1, where, besides free ATP molecules, we also consider the presence of free ADP molecules in solution. We also consider a backward load, F, on the stalk of the motor, as in the optical trapping experiments using the movable trap.
The probability PE, as defined in Figure 1, has the following form [31]:
P E = exp E 0 F δ k B T exp E 0 F δ k B T + 1 ,
where kB is the Boltzmann constant, T the absolute temperature, E0 the energy change in the large conformational change in the head and NL docking induced by ATP binding, and δ the load-sensitivity distance for the movement of the detached ADP-head from the INT position to the nearest unoccupied tubulin.
On the basis of Figure 1, in a stepping cycle the factions of the motor in the 1HB and 2HB states, which are denoted by F1HB and F2HB, respectively, can be derived as follows (see Section S2 in Supplementary Materials):
F 1 HB = A 1 + A 3 + A 5 1 + A 1 + A 2 + A 3 + A 4 + A 5 + A 6 + A 7 + A 8 ,
F 2 HB = 1 + A 2 + A 4 + A 6 + A 7 + A 8 1 + A 1 + A 2 + A 3 + A 4 + A 5 + A 6 + A 7 + A 8 ,
F 2 HB F 1 HB = 1 + A 2 + A 4 + A 6 + A 7 + A 8 A 1 + A 3 + A 5 ,
A 1 = α γ T [ ATP ] + γ D [ ADP ] + α + γ T [ ATP ] + α P E β γ T [ ATP ] + γ D [ ADP ] + α ,
A 2 = 1 P E P E γ T [ ATP ] + γ D [ ADP ] α + 1 γ T [ ATP ] 1 P E P E γ D [ ADP ] γ T [ ATP ] + γ D [ ADP ] γ T [ ATP ] γ T [ ATP ] + γ D [ ADP ] + α ,
A 3 = α + α γ D [ ADP ] γ T [ ATP ] + γ D [ ADP ] + α + 1 γ T [ ATP ] γ T [ ATP ] + γ D [ ADP ] + α ,
A 4 = 1 γ T [ ATP ] + γ D [ ADP ] + α ,
A 5 = α γ T [ ATP ] + γ D [ ADP ] + α + 1 γ T [ ATP ] γ T [ ATP ] + γ D [ ADP ] + α ,
A 6 = γ T [ ATP ] α γ T [ ATP ] + γ D [ ADP ] + α ,
A 7 = 1 P E P E α + 1 γ T [ ATP ] 1 P E P E γ D [ ADP ] γ T [ ATP ] γ T [ ATP ] + γ D [ ADP ] + α ,
A 8 = 1 P E P E α + 1 α 1 P E P E γ D [ ADP ] α γ T [ ATP ] + γ D [ ADP ] + α ,
where α = k ( + ) / k D and β = k NL / k D are dimensionless constants, γ T = k bT / k D and γ D = k bD / k D are constants in units of μM−1, k(+) is the rate of ATP transition to ADP in the head with the forward NL orientation, kD is the rate of ADP release from the MT-bound ADP-head, kNL is the rate of the large conformational change in the ATP-head in the 1HB state together with its NL docking and reduction in the binding energy between the two heads, k bT is the second-order ATP-binding rate to the nucleotide-free head, [ATP] is the ATP concentration, k bD is the second-order ADP-binding rate to the nucleotide-free head, and [ADP] is the ADP concentration. Rates k(+), kD, k bT and k bD are independent of the force on the NL, which is consistent with the available experimental data [32,33,34,35] (see Section S1). As noted before [31], under the backward load, rate kNL is also independent of the backward load. Thus, α , β , γ T and γ D are independent of the backward load. For clarity, the meanings of α , β , γ T and γ D are explained in Table 1.
On the basis of Figure 1, the duration of a stepping cycle (i.e., the transitions from Figure 1c through Figure 1k, including the futile coupling transitions from Figure 1d to Figure 1m and returning to Figure 1c) can be derived as follows (see Section S3 in SI):
τ = 1 + A 1 + A 2 + A 3 + A 4 + A 5 + A 6 + A 7 + A 8 γ T [ ATP ] A 5 + α A 6 1 k D .

3.2. Fractions of 1HB and 2HB States Under Saturating ATP Concentrations, No Free ADP and No Load

In this section, we consider saturating ATP concentrations, with 1 / γ T [ ATP ] approaching 0, no free ADP, with [ADP] = 0, and no load on the motor, with F = 0. As shown before for kinesin-1, kinesin-2 and kinesin-3 dimers [31,36], PE approaches one when F = 0. Thus, we take PE = 1 in this section. With 1 / γ T [ ATP ] = 0, [ADP] = 0 and PE = 1, from Equations (3)–(12) we have the following:
F 2 HB F 1 HB = β 1 + α α 1 + α + α β .
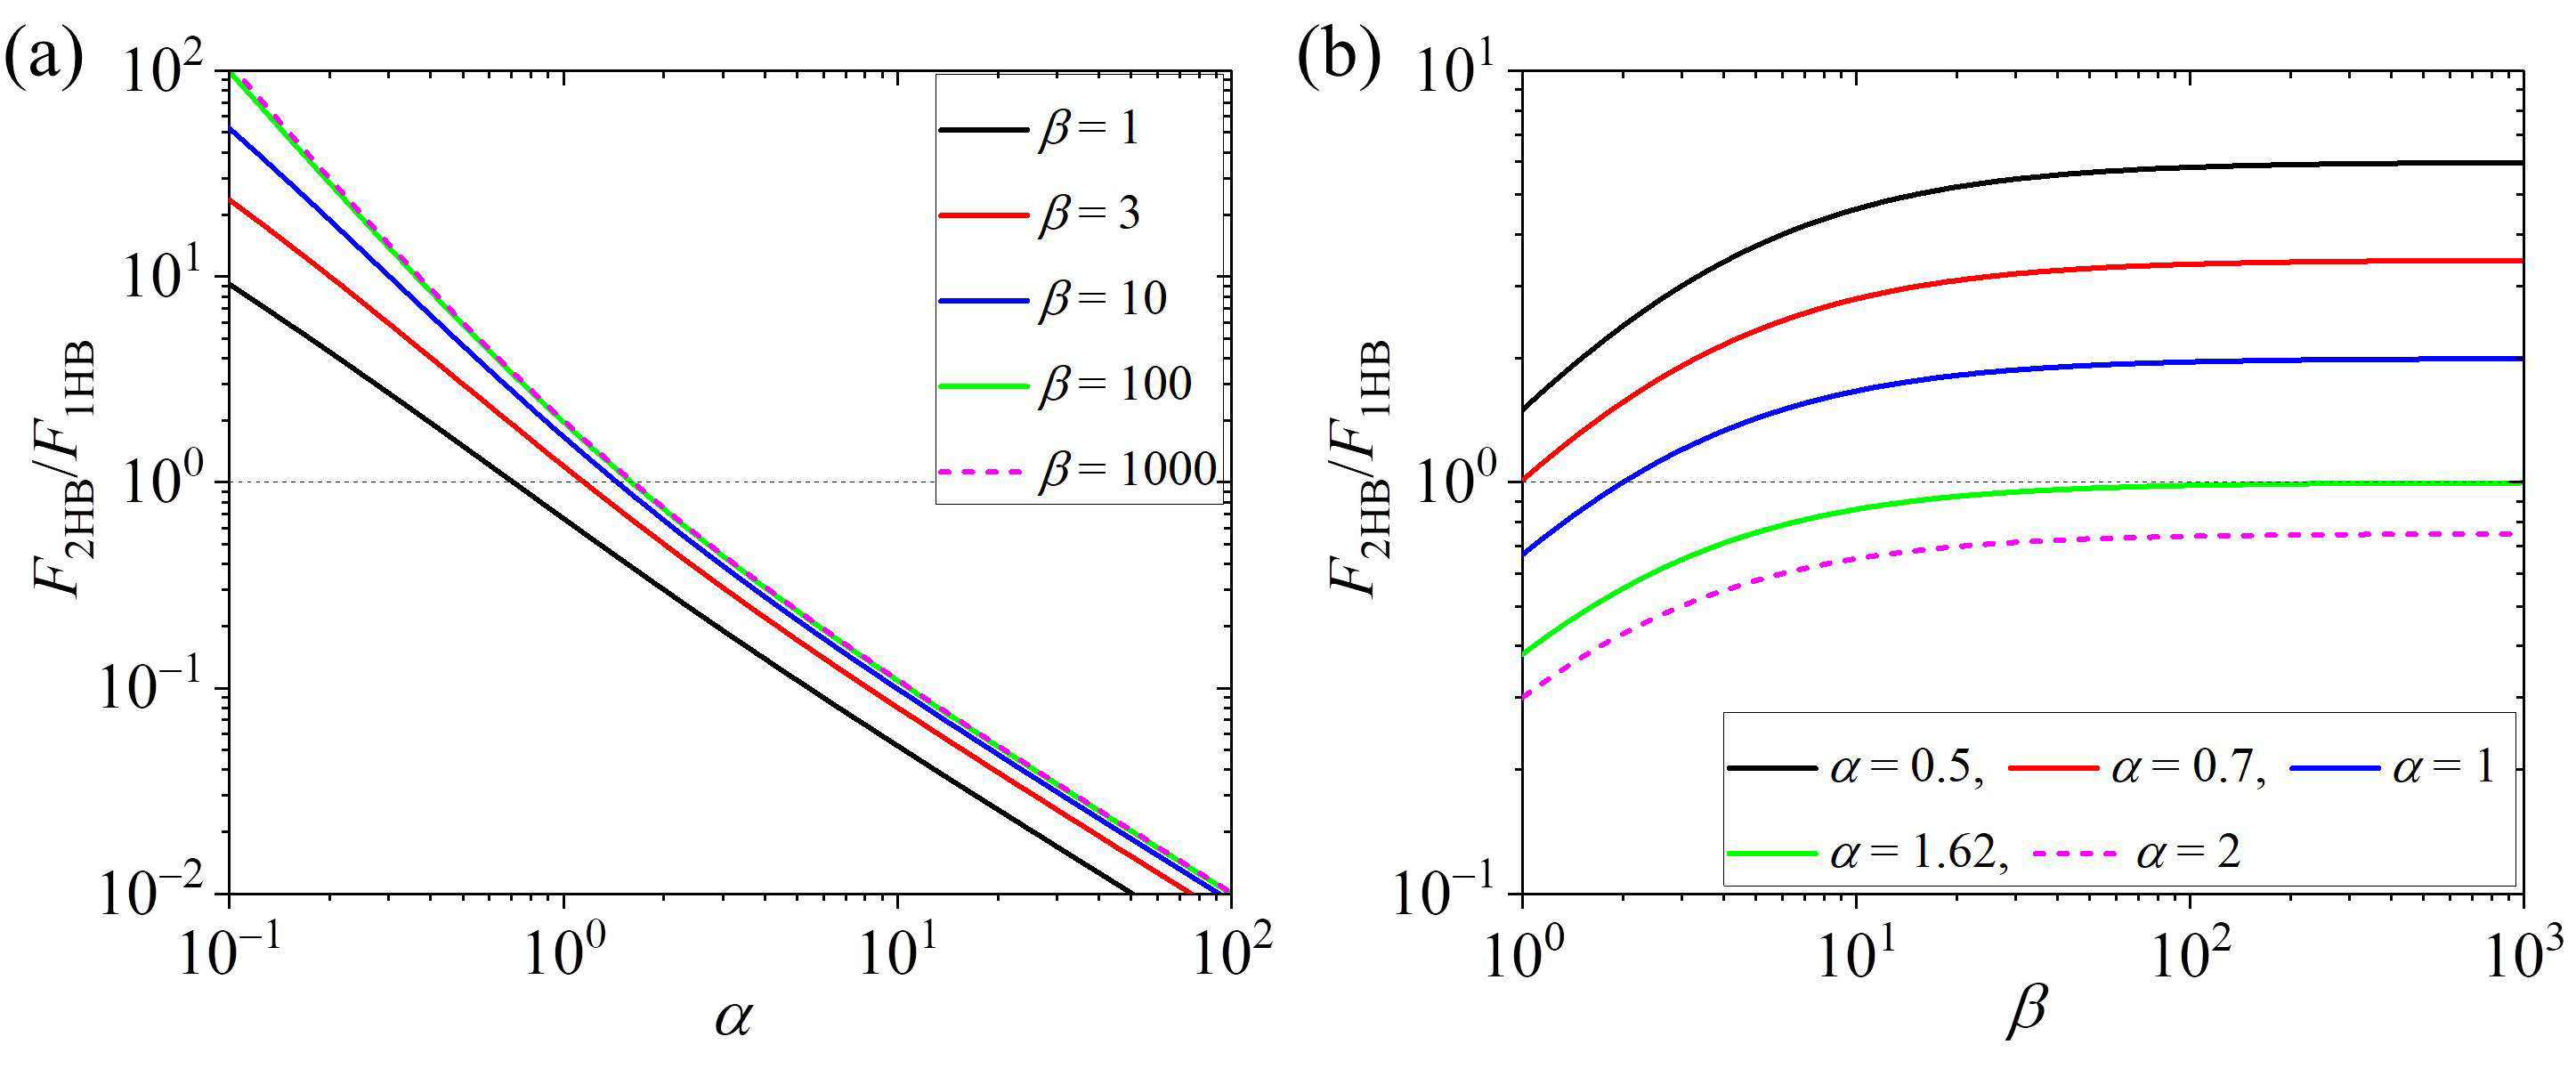
From Equation (14), it is noted that the motor in the predominant 2HB or 1HB state is determined by only two parameters. One is α = k ( + ) / k D , the ratio of the rate of ATP transition to ADP in the TH to the rate of ADP release from the MT-bound head. The other one is β = k NL / k D , the ratio of the rate of NL docking of the MT-bound ATP-head in the 1HB state to the rate of ADP release from the MT-bound head. Considering that the NL docking occurs fast [37], it is expected that kNL is greater than or equal to kD. Thus, in this work we take β = k NL / k D 1. Using Equation (14), the calculated results of F 2 HB / F 1 HB vs. α for various values of β are shown in Figure 2a, and those of F 2 HB / F 1 HB vs. β for various values of α are shown in Figure 2b.
From Figure 2a, it is seen that F 2 HB / F 1 HB changes sensitively with α . At large, β > 100, F 2 HB / F 1 HB is independent of β and is determined solely by α (with F 2 HB / F 1 HB = α + 1 / α 2 at β ). At β > 100, if α < 1.62, the motor is in the predominant 2HB state, with F 2 HB / F 1 HB > 1, and as α decreases, the fraction of the motor in the 2HB state increases significantly, while if α > 1.62, the motor is in the predominant 1HB state, with F 2 HB / F 1 HB < 1, and as α increases, the fraction of the motor in the 1HB state increases significantly. At small, β = 1, if α < 0.7, the motor is in the predominant 2HB state, and as α decreases, the fraction of the motor in the 2HB state increases significantly, while if α > 0.7, the motor is in the predominant 1HB state, and as α increases, the fraction of the motor in the 1HB state increases significantly. In the range of 1 < β < 100, the value of α , at which F 2 HB / F 1 HB = 1, increases with the increase of β . From Figure 2b, it is seen that if α < 0.7, for any β > 1 the motor is in the predominant 2HB state, whereas if α > 1.62, for any β the motor is in the predominant 1HB state. By comparing Figure 2a with Figure 2b, it is seen interestingly that F 2 HB / F 1 HB depends much more sensitively on α than on β .
The sensitive dependence of F 2 HB / F 1 HB on α can be noted intuitively from the pathway of Figure 1, with the transition from Figure 1d to Figure 1f not occurring due to PE = 1 and [ADP] = 0. It is seen that if k(+) is evidently smaller than kD, in Figure 1e it is most probable that ADP release from the LH can occur before ATP transition to ADP in the TH. Thus, in a stepping cycle, the transition from Figure 1c to Figure 1k via Figure 1d,e,h,j can occur with an evidently larger probability than that via Figure 1d,e,g,i. Hence, the motor has a long time in the 2HB state of Figure 1e and that of Figure 1j. By contrast, if k(+) is evidently larger than kD, in Figure 1e it is most probable that ATP transition to ADP in the TH can occur before ADP release in the LH. Thus, in a stepping cycle, the transition from Figure 1c to Figure 1k via Figure 1d,e,g,i can occur with an evidently larger probability than that via Figure 1d,e,h,j. Hence, the motor has a long time in the 1HB state of Figure 1g.
Taken together, in this section focusing on the case of saturating ATP concentrations, no free ADP, and no load, we show that in a stepping cycle the fraction of the 2HB state, F2HB, and that of the 1HB state, F1HB, are dependent only on two parameters α = k ( + ) / k D and β = k NL / k D . Moreover, F 2 HB / F 1 HB is determined mainly by α , while β has a minor effect on F 2 HB / F 1 HB . For the motor having a large kNL, if α < 1.62, the motor is in the predominant 2HB state, and as α decreases, the fraction of the 2HB state increases sensitively, while if α > 1.62, the motor is in the predominant 1HB state, and as α increases, the fraction of the 1HB state increases sensitively.

3.3. Effect of ATP Concentration on Fractions of 1HB and 2HB States Under No Load and No Free ADP

In this section, we study dependencies of fractions of 1HB and 2HB states on [ATP]. We consider the unloaded case, with F = 0 and no free ADP, with [ADP] = 0. As mentioned in the above section, we take PE = 1 in this section. With PE = 1 and [ADP] = 0, from Equations (3)–(12) we have the following:
F 2 HB F 1 HB = β 1 + α α 1 + α + α β + B ,
B = α β γ T [ ATP ] + α + 1 γ T [ ATP ] γ T [ ATP ] + α
where it is seen that the dependence of F 2 HB / F 1 HB on [ATP] is only via the dependence of term B on [ATP].
From Equations (15) and (16), it is seen that for a given [ATP], besides α = k ( + ) / k D and β = k NL / k D , F 2 HB / F 1 HB is also dependent on γ T = k bT / k D . Prior studies showed that the rate of ADP release from the MT-bound ADP-head is about 150 s−1~300 s−1 and the second-order binding rate of ATP is about 2 μM−1s−1~5 μM−1s−1 for Drosophila kinesin-1 [33,38,39]. Thus, it is estimated that γ T = k bT / k D is around 0.02 μM−1. Consequently, we take γ T = 0.02 μM−1 in this section.
Using Equations (15) and (16), the calculated results of F 2 HB / F 1 HB vs. [ATP] for various values of α at a small β and at a large β are shown in Figure 3a and Figure 3b, respectively. It is seen that F 2 HB / F 1 HB increases with the increase in [ATP] at low [ATP] and becomes leveled off at high [ATP]. Interestingly, it is seen that for a small α , the motor in the predominant 2HB at high [ATP] can become the predominant 1HB state at low [ATP]. For a large α , the motor is always in the predominant 1HB state, and the fraction of the 1HB state increases with the decrease in [ATP].

3.4. Effect of Load on Fractions of 1HB and 2HB States at Saturating ATP Concentrations and No Free ADP

In this section, we study dependencies of the fractions of 1HB and 2HB states on the backward load F. We focus on saturating ATP concentrations, with 1 / γ T [ ATP ] approaching 0, and no free ADP, with [ADP] = 0. With 1 / γ T [ ATP ] = 0 and [ADP] = 0, from Equations (3)–(12) we have the following:
F 2 HB F 1 HB = β 1 + α 2 P E + 1 P E α 2 α 1 + α + α β P E .
From Equations (1) and (17), it is seen that for a given F, besides α = k ( + ) / k D and β = k NL / k D , F 2 HB / F 1 HB is also dependent on E0 and δ . Here, we take E0 = 3.5 kBT and δ = 3.5 nm, as determined before for kinesin-1 [31].
Using Equations (1) and (17), the calculated results of F 2 HB / F 1 HB vs. F for various values of α at a small β and at a large β are shown in Figure 4a and Figure 4b, respectively. It is seen that F 2 HB / F 1 HB increases with the increase in F, especially at a large α . Interestingly, it is seen that for a large α , the motor in the predominant 1HB under no load can become the predominant 2HB state under a high load. For a small α , the motor is always in the predominant 2HB state, and the fraction of the 2HB state increases with the increase in F.

3.5. Effect of ADP Concentration on Velocity and Fractions of 1HB and 2HB States Under No Load

In this section, we study dependencies of fractions of 1HB and 2HB states on ADP concentration. We consider the unloaded case, with F = 0, and thus we take PE = 1 in this section.
With PE = 1, from Equations (5)–(13) we have the following:
τ = 1 + α + C 1 + C 2 + C 3 C 4 1 k D ,
C 1 = α γ T [ ATP ] + γ D [ ADP ] + α + γ T [ ATP ] + α β γ T [ ATP ] + γ D [ ADP ] + α ,
C 2 = α γ D [ ADP ] + 1 γ T [ ATP ] + γ D [ ADP ] + α + 1 γ T [ ATP ] γ T [ ATP ] + γ D [ ADP ] + α ,
C 3 = γ T [ ATP ] + α α γ T [ ATP ] + γ D [ ADP ] + α ,
C 4 = α γ T [ ATP ] + γ D [ ADP ] + α + 1 + γ T [ ATP ] γ T [ ATP ] + γ D [ ADP ] + α .
The velocity of the motor is as follows:
v = d τ ,
where d = 8.3 nm is the step size, equal to the period of tubulins on a MT filament.
With PE = 1, from Equations (3)–(12) we have the following:
F 2 HB F 1 HB = 1 + C 3 α + C 1 + C 2 .
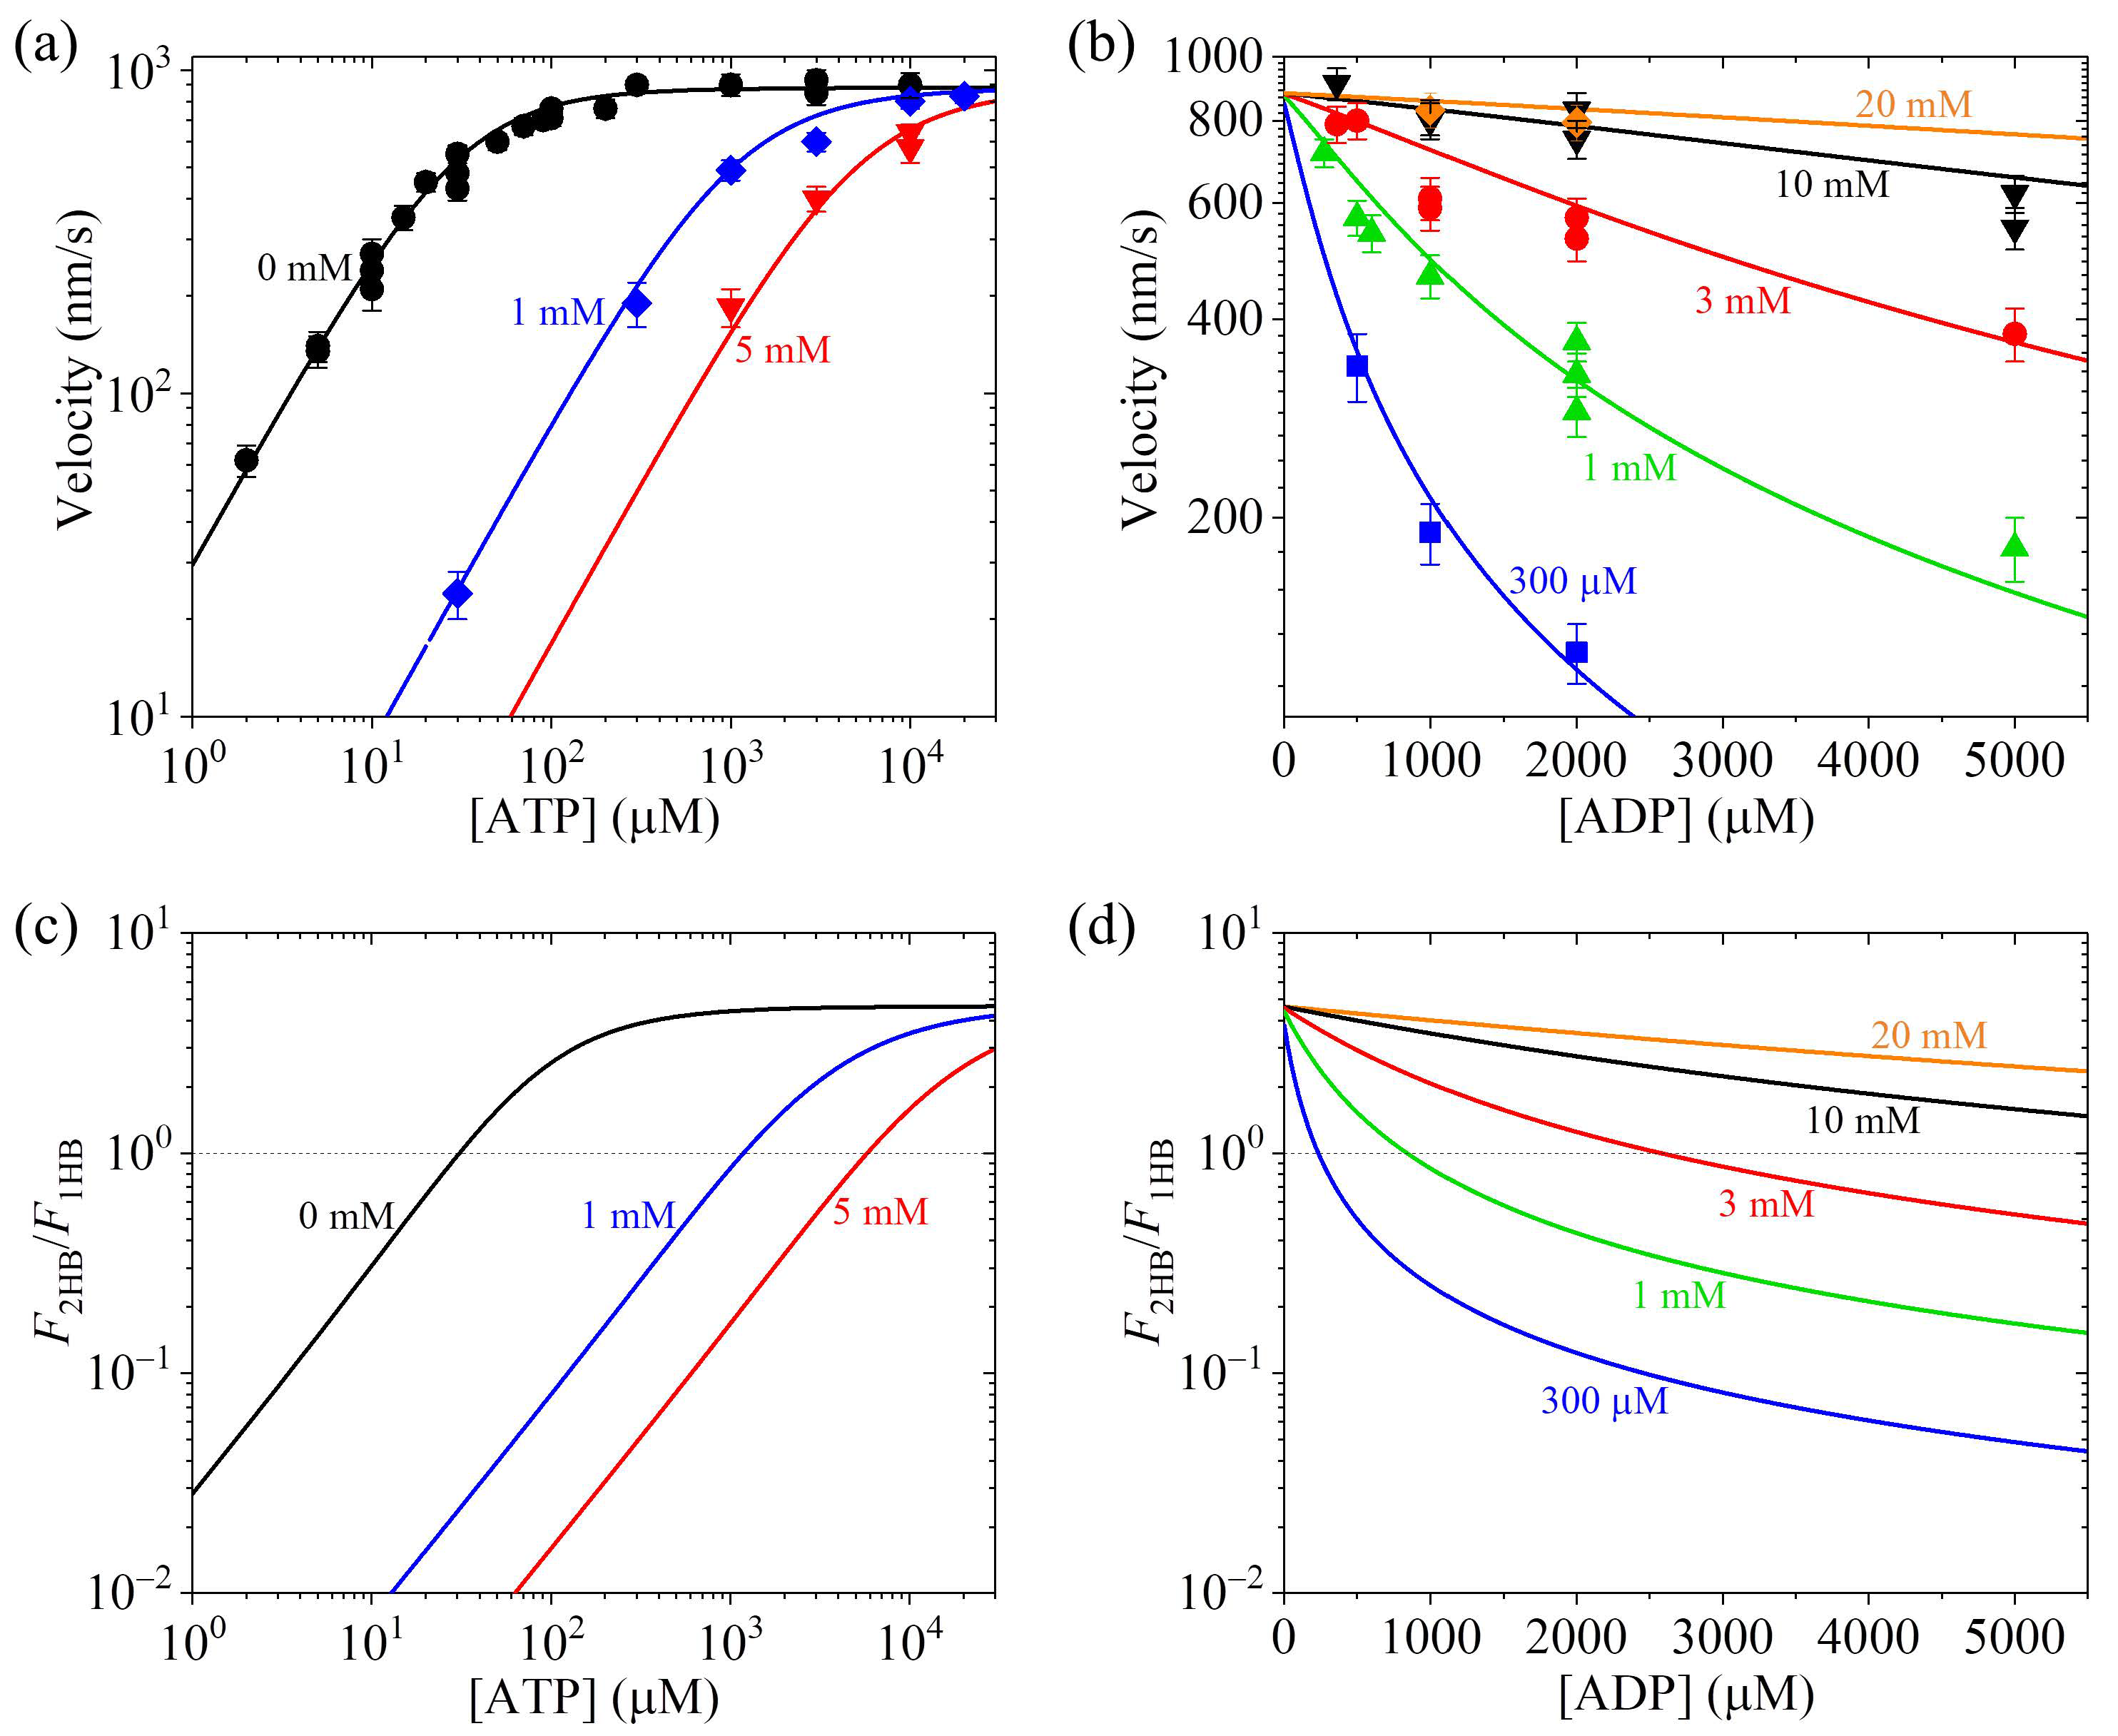
First, we use Equations (18)–(23) to calculate the dependencies of velocity on ATP and ADP concentrations. Since the experimental data about dependencies of velocity for kinesin-1 from bovine brain on ATP and ADP concentrations are available [40], here we compare the theoretical results with the available experimental data [40]. From Equations (18)–(23), it is noted that five parameters α , β , γ T , γ D and kD are required. To be consistent with prior biochemical data [33,37,38], we take kD = 300 s−1 and kNL = 1500 s−1 in this section, as achieved before for kinesin-1 [31], giving β = k NL / k D = 5. We take the remaining three parameters α , γ T and γ D to be adjustable. With α = 0.43, γ T = 0.012 μM−1 and γ D = 0.035 μM−1, the theoretical results reproduce quantitatively the experimental data [40] (Figure 5a,b).
Second, we use Equations (19)–(22) and (24) and parameter values presented just above to calculate the dependencies of F 2 HB / F 1 HB on ATP and ADP concentrations, with the results shown in Figure 5c,d. Interestingly, it is seen that for a given ATP concentration, and especially for the ATP concentration not very large, F 2 HB / F 1 HB decreases with the increase in [ADP]. For example, at [ATP] = 1 mM, F 2 HB / F 1 HB > 1 when [ADP] < 0.83 mM and F 2 HB / F 1 HB < 1 when [ADP] > 0.85 mM (Figure 5d). This implies that at [ATP] = 1 mM, when [ADP] < 0.83 mM the motor is in the predominant 2HB state, and when [ADP] > 0.85 mM, the motor becomes in the predominant 1HB state.

3.6. Applications of the Theory for Kinesin-1, Kinesin-2, Kinesin-3, Kinesin-5 and Kinesin-13 Motors

In this section, we compare the theoretical results on fractions of 1HB and 2HB states with the available experimental data for kinesin-1, kinesin-2, kinesin-3, kinesin-5 and kinesin-13 motors [13,14,15,16,17]. Since the experimental data were obtained under no load and no free ADP, we consider F = 0 and [ADP] = 0 here. As mentioned above, with F = 0, we have PE = 1.
The ratio F 2 HB / F 1 HB can be calculated by Equations (15) and (16). In a stepping cycle, the durations of the 1HB and 2HB states, which are denoted by τ 1 HB and τ 2 HB , respectively, can be calculated by the following:
τ 1 HB = τ F 1 HB ,
τ 2 HB = τ F 2 HB .
Substituting Equations (2), (3) and (13) into Equations (25) and (26) and with PE = 1 and [ADP] = 0 we obtain the following:
τ 1 HB = 1 + α + α β γ T [ ATP ] γ T [ ATP ] + α + α β γ T [ ATP ] + α + 1 γ T [ ATP ] α β γ T [ ATP ] + α + 1 + γ T [ ATP ] 1 k D ,
τ 2 HB = 1 α k D = 1 k ( + ) .
First, we consider the kinesin-3 KIF1A motor. Prior experimental data showed that for the KIF1A dimer, ATP hydrolysis and Pi release in the TH occur very fast, with the rate being above the experimental detection limit, and the rate of ADP release from the MT-bound head has a relatively small value of about 354 s−1 [17]. These data indicate that k(+) >> kD [17], giving α = k ( + ) / k D >> 1. Thus, from Figure 2 it is seen that F 2 HB / F 1 HB is smaller than 1, implying that at saturating ATP concentrations the KIF1A is in the predominant 1HB state. This is in accordance with the published experimental data [17].
Second, we consider kinesin-1 and kinesin-2 motors. Prior studies showed that for kinesin-1 and kinesin-2, kNL has a value evidently larger than kD, indicating β = k NL / k D evidently larger than 1, and ADP release from the MT-bound ADP-head is a non-rate-limiting step of the ATPase activity, and ATP transition to ADP is the rate-limiting step [33,37,38,39], indicating α = k ( + ) / k D < 1. Thus, from Figure 2a it is seen that F 2 HB / F 1 HB is larger than 1, implying that at saturating ATP concentrations the kinesin-1 and kinesin-2 motors are in the predominant 2HB state. This is in accordance with the published experimental data [13,14,15].
Third, we consider the kinesin-5 Eg5 motor. Prior biochemical data showed that for the Eg5 dimer, the ADP-release rate is about 76 s−1, the NL-docking rate is similar to the ADP-release rate, and the ATPase rate is about 8.9 s−1 [41], namely kD  76 s−1, kNL   kD and k(+)  8.9 s−1, giving β = k NL / k D 1 and α = k ( + ) / k D 0.12. Thus, from Figure 2a it is seen that F 2 HB / F 1 HB   7.5, implying that at saturating ATP concentrations the Eg5 dimer is in the predominant 2HB state. This is in accordance with the published experimental data [16].
Fourth, we consider the kinesin-13 motor. Prior studies showed that for the kinesin-13 MCAK motor on the MT lattice, ADP release is very slow [42], indicating α = k ( + ) / k D >> 1. Thus, from Figure 2 it is seen that F 2 HB / F 1 HB << 1, implying that at saturating ATP concentrations the MCAK motor is in the predominant 1HB state on the MT lattice. This is in accordance with the previous studies showing that on the MT lattice, the MCAK motor, with only one head in the ADP state interacting with MT, makes an unbiased one-dimensional diffusion [26,27]. The experimental data of Cooper et al. [43], showing that both the MCAK monomer and dimer diffuse on the MT lattice with a similar diffusion constant, indicate also that on the MT lattice the MCAK dimer is almost in the 1HB state. By contrast, the prior studies showed that near the MT end with curved tubulins, ADP release is accelerated significantly [42], giving α = k ( + ) / k D << 1. Thus, from Figure 2 it is seen that F 2 HB / F 1 HB >> 1, implying that near the MT end, the MCAK motor becomes in the predominant 2HB state, facilitating MT depolymerization [27].
Next, we consider non-saturating ATP concentrations for kinesin-1. Since for kinesin-1, kNL is evidently larger than kD [33,37,38,39] and thus β = k NL / k D is evidently larger than one. Hence, we fix β = k NL / k D = 5 here. We will adjust parameters α , γ T and kD to make the theoretical results be consistent with the available experimental data for human kinesin-1 [13]. Using Equations (15) and (16) and by taking α = 0.5 and γ T = 0.023 μM−1, the theoretical results of F 2 HB / F 1 HB vs. [ATP] are in good agreement with the experimental data of Isojima et al. [13], as shown in Figure 6a. Note that this value of γ T = 0.023 μM−1 is close to the value of about 0.02 μM−1 estimated above from the available biochemical data (see Section 3.2). From Figure 6a, it is evident that at high [ATP] the motor is in the predominant 2HB state and at low [ATP] the motor is in the predominant 1HB state, as noted in Section 3.2. Furthermore, using Equations (27) and (28) and additionally taking kD = 200 s−1, the theoretical results of τ 1 HB and τ 2 HB vs. [ATP] are also in good agreement with the experimental data of Isojima et al. [13], as shown in Figure 6b,c. It is noted that the value of kD = 200 s−1 is consistent with the available biochemical data of 150 s−1~300 s−1 [33,38,39]. The value of α = k ( + ) / k D = 0.5, which is determined in Figure 6a, gives k(+) = 100 s−1, which is also consistent with the available biochemical data [33,38,39].

4. Conclusions

A theory is presented for the fractions of the 1HB and 2HB states during its processive stepping. From the theoretical results, the following conclusions are obtained:
(i)
Under saturating ATP concentrations, no free ADP and no load—the fraction of the 2HB state, F2HB, and that of the 1HB state, F1HB, depend only on two parameters, α = k ( + ) / k D , the ratio of the rate of ATP transition to ADP in the TH to the rate of ADP release from the MT-bound head, and β = k NL / k D , the ratio of the rate of NL docking of the ATP-head to the rate of ADP release from the MT-bound head. F 2 HB / F 1 HB is determined mainly by α and mildly by β . For the motor having a large kNL, when α < 1.62, the motor is in the predominant 2HB state, and as α decreases, the fraction of the 2HB state increases sensitively, while when α > 1.62, the motor is in the predominant 1HB state, and as α increases, the fraction of the 1HB state increases sensitively.
(ii)
Under no free ADP and no load— F 2 HB / F 1 HB increases with the increase in the ATP concentration at low ATP concentrations and becomes leveled off at high ATP concentrations. The motor having a small α , such as kinesin-1 or kinesin-2, which is in the predominant 2HB at high ATP concentrations, can become in the predominant 1HB state at low ATP concentrations. The motor having a large α , such as kinesin-3 KIF1A, is always in the predominant 1HB state, and the fraction of the 1HB state increases with the decrease in the ATP concentration.
(iii)
At saturating ATP concentrations and no free ADP— F 2 HB / F 1 HB increases with the increase in the backward load, especially at a large α . The motor having a large α , such as kinesin-3 KIF1A, which is in the predominant 1HB under no load, can become in the predominant 2HB state under a high load. The motor having a small α , such as kinesin-1 or kinesin-2, is always in the predominant 2HB state, and the fraction of the 2HB state increases with the increase in the backward load.
(iv)
Under no load—for a given ATP concentration and, in particular, for the ATP concentration not very large, F 2 HB / F 1 HB decreases with the increase in the ADP concentration. For example, for kinesin-1 at 1 mM ATP molecules, the motor is in the predominant 2HB state under no free ADP and can become in the predominant 1HB state under high ADP concentrations.
Furthermore, the theory is applied for concrete kinesin dimers such as kinesin-1, kinesin-2, kinesin-3, kinesin-5 and kinesin-13, with the theoretical results agreeing well with the published experimental data under no load. The predicted results, e.g., Figure 3 for kinesin-3 KIF1A having a large α , Figure 4 for kinesin-3 KIF1A having a large α and Figure 5c,d for kinesin-1, are hoped to be tested by future experiments.

Supplementary Materials

The following supporting information can be downloaded at https://www.mdpi.com/article/10.3390/biom15050717/s1, Section S1: Main elements in the model for the general chemomechanical pathway of kinesin motor; Section S2: Derivation of Equations (2)–(12); Section S3: Derivation of Equation (13).

Author Contributions

P.X. designed the project and performed the analysis. X.-X.S. and Y.-R.L. assisted in the research and helped draw the figures. P.X. wrote the manuscript. All authors reviewed the manuscript. All authors have read and agreed to the published version of the manuscript.

Funding

This work was supported by the Youth Project of Science and Technology Research Program of Chongqing Education Commission of China (No. KJQN202404522).

Data Availability Statement

The original contributions presented in this study are included in the article.

Conflicts of Interest

The authors declare no competing interests.

References

  1. Lawrence, C.J.; Dawe, R.K.; Christie, K.R.; Cleveland, D.W.; Dawson, S.C.; Endow, S.A.; Goldstein, L.S.B.; Goodson, H.V.; Hirokawa, N.; Howard, J.; et al. A standardized kinesin nomenclature. J. Cell Biol. 2004, 167, 19–22. [Google Scholar] [CrossRef] [PubMed]
  2. Miki, H.; Okada, Y.; Hirokawa, N. Analysis of the kinesin superfamily: Insights into structure and function. Trends Cell Biol. 2005, 15, 467–476. [Google Scholar] [CrossRef] [PubMed]
  3. Hirokawa, N.; Noda, Y.; Tanaka, Y.; Niwa, S. Kinesin superfamily motor proteins and intracellular transport. Nat. Rev. Mol. Cell Biol. 2009, 10, 682. [Google Scholar] [CrossRef]
  4. Iino, R.; Kinbara, K.; Bryant, Z. Introduction: Molecular motors. Chem. Rev. 2020, 120, 1–4. [Google Scholar] [CrossRef]
  5. Kozielski, F.; Sack, S.; Marx, A.; Thormählen, M.; Schönbrunn, E.; Biou, V.; Thompson, A.; Mandelkow, E.M.; Mandelkow, E. The crystal structure of dimeric kinesin and implications for microtubule-dependent motility. Cell 1997, 91, 985–994. [Google Scholar] [CrossRef]
  6. Vale, R.D. The molecular motor toolbox for intracellular transport. Cell 2003, 112, 467–480. [Google Scholar] [CrossRef]
  7. Asbury, C.L.; Fehr, A.N.; Block, S.M. Kinesin moves by an asymmetric hand-over-hand mechanism. Science 2003, 302, 2130–2134. [Google Scholar] [CrossRef]
  8. Yildiz, A.; Tomishige, M.; Vale, R.D.; Selvin, P.R. Kinesin walks hand-over-hand. Science 2004, 303, 676–678. [Google Scholar] [CrossRef]
  9. Mori, T.; Vale, R.D.; Tomishige, M. How kinesin waits between steps. Nature 2007, 450, 750–754. [Google Scholar] [CrossRef]
  10. Alonso, M.C.; Drummond, D.R.; Kain, S.; Hoeng, J.; Amos, L.; Cross, R.A. An ATP gate controls tubulin binding by the tethered head of kinesin-1. Science 2007, 316, 120–123. [Google Scholar] [CrossRef]
  11. Wolff, J.O.; Scheiderer, L.; Engelhardt, T.; Engelhardt, J.; Matthias, J.; Hell, S.W. MINFLUX dissects the unimpeded walking of kinesin-1. Science 2023, 379, 1004–1010. [Google Scholar] [CrossRef] [PubMed]
  12. Deguchi, T.; Iwanski, M.K.; Schentarra, E.-M.; Heidebrecht, C.; Schmidt, L.; Heck, J.; Weihs, T.; Schnorrenberg, S.; Hoess, P.; Liu, S.; et al. Direct observation of motor protein stepping in living cells using MINFLUX. Science 2023, 379, 1010–1015. [Google Scholar] [CrossRef] [PubMed]
  13. Isojima, H.; Iino, R.; Niitani, Y.; Noji, H.; Tomishige, M. Direct observation of intermediate states during the stepping motion of kinesin-1. Nat. Chem. Biol. 2016, 12, 290–297. [Google Scholar] [CrossRef]
  14. Mickolajczyk, K.J.; Hancock, W.O. Kinesin processivity is determined by a kinetic race from a vulnerable one-head-bound state. Biophys. J. 2017, 112, 2615–2623. [Google Scholar] [CrossRef]
  15. Sudhakar, S.; Kazem, M.; Tobias, A.; Jachowski, J.; Bugiel, M.; Jannasch, A.; Schäffer, E. Germanium nanospheres for ultraresolution picotensiometry of kinesin motors. Science 2021, 71, eabd9944. [Google Scholar] [CrossRef]
  16. Chen, G.-Y.; Mickolajczyk, K.J.; Hancock, W.O. The kinesin-5 chemomechanical cycle is dominated by a two-heads-bound state. J. Biol. Chem. 2016, 291, 20283–20294. [Google Scholar] [CrossRef]
  17. Zaniewski, T.M.; Gicking, A.M.; Fricks, J.; Hancock, W.O. A kinetic dissection of the fast and superprocessive kinesin-3 KIF1A reveals a predominant one-head-bound state during its chemomechanical cycle. J. Biol. Chem. 2020, 295, 17889–17903. [Google Scholar] [CrossRef]
  18. Saunders, A.M.; Powers, J.; Strome, S.; Saxton, W.M. Kinesin-5 acts as a brake in anaphase spindle elongation. Curr. Biol. 2007, 17, 453–454. [Google Scholar] [CrossRef]
  19. Shimamoto, Y.; Forth, S.; Kapoor, T.M. Measuring pushing and braking forces generated by ensembles of kinesin-5 crosslinking two microtubules. Dev. Cell 2015, 34, 669–681. [Google Scholar] [CrossRef]
  20. Xie, P. A model of tubulin removal and exchange caused by kinesin motor walking on microtubule lattices. J. Theor. Biol. 2025, 605, 112088. [Google Scholar] [CrossRef]
  21. Verhey, K.J.; Ohi, R. Causes, costs and consequences of kinesin motors communicating through the microtubule lattice. J. Cell Sci. 2023, 136, jcs260735. [Google Scholar] [CrossRef] [PubMed]
  22. Dumont, E.L.P.; Do, C.; Hess, H. Molecular wear of microtubules propelled by surface-adhered kinesins. Nat. Nanotechnol. 2015, 10, 166–169. [Google Scholar] [CrossRef] [PubMed]
  23. VanDelinder, V.; Adams, P.G.; Bachand, G.D. Mechanical splitting of microtubules into protofilament bundles by surface-bound kinesin-1. Sci. Rep. 2016, 6, 39408. [Google Scholar] [CrossRef]
  24. Andreu-Carbo, M.; Fernandes, S.; Velluz, M.C.; Kruse, K.; Aumeier, C. Motor usage imprints microtubule stability along the shaft. Dev. Cell 2022, 57, 5–18. [Google Scholar] [CrossRef]
  25. Budaitis, B.G.; Badieyan, S.; Yue, Y.; Blasius, T.L.; Reinemann, D.N.; Lang, M.J.; Cianfrocco, M.A.; Verhey, K.J. A kinesin-1 variant reveals motor-induced microtubule damage in cells. Curr. Biol. 2022, 32, 2416–2429. [Google Scholar] [CrossRef]
  26. Helenius, J.; Brouhard, G.; Kalaidzidis, Y.; Diez, S.; Howard, J. The depolymerizing kinesin MCAK uses lattice diffusion to rapidly target microtubule ends. Nature 2006, 441, 115–119. [Google Scholar] [CrossRef]
  27. Xie, P. Modeling study of kinesin-13 MCAK microtubule depolymerase. Eur. Biophys. J. 2024, 53, 339–354. [Google Scholar] [CrossRef]
  28. Mickolajczyk, K.J.; Deffenbaugh, N.C.; Arroyo, J.O.; Andrecka, J.; Kukura, P.; Hancock, W.O. Kinetics of nucleotide-dependent structural transitions in the kinesin-1 hydrolysis cycle. Proc. Natl. Acad. Sci. USA 2015, 112, E7186–E7193. [Google Scholar] [CrossRef]
  29. Takaki, R.; Mugnai, M.L.; Goldtzvik, Y.; Thirumalai, D. How kinesin waits for ATP affects the nucleotide and load dependence of the stepping kinetics. Proc. Natl. Acad. Sci. USA 2019, 116, 23091–23099. [Google Scholar] [CrossRef]
  30. Xie, P. ATP-concentration-dependent fractions of one-head-bound and two-heads-bound states of kinesin motor during its chemomechanical coupling cycle. J. Phys. Chem. Lett. 2024, 15, 3893–3899. [Google Scholar] [CrossRef]
  31. Xie, P. Effects of stalk orientation and size of trapped bead on force–velocity relation of kinesin motor determined using single molecule optical trapping methods. J. Biol. Phys. 2025, 51, 7. [Google Scholar] [CrossRef]
  32. Yildiz, A.; Tomishige, M.; Gennerich, A.; Vale, R.D. Intramolecular strain coordinates kinesin stepping behavior along microtubules. Cell 2008, 134, 1030–1041. [Google Scholar] [CrossRef]
  33. Moyer, M.L.; Gilbert, S.P.; Johnson, K.A. Pathway of ATP hydrolysis by monomeric and dimeric kinesin. Biochemistry 1998, 37, 800–813. [Google Scholar] [CrossRef] [PubMed]
  34. Okada, Y.; Hirokawa, N. A processive single-headed motor: Kinesin superfamily protein KIF1A. Science 1999, 283, 1152–1157. [Google Scholar] [CrossRef] [PubMed]
  35. Rosenfeld, S.S.; Fordyce, P.M.; Jefferson, G.M.; King, P.H.; Block, S.M. Stepping and stretching: How kinesin uses internal strain to walk processively. J. Biol. Chem. 2003, 278, 18550–18556. [Google Scholar] [CrossRef]
  36. Xie, P. A model for chemomechanical coupling of kinesin-3 motor. Cell. Mol. Bioeng. 2024, 17, 137–151. [Google Scholar] [CrossRef]
  37. Rosenfeld, S.S.; Jefferson, G.M.; King, P.H. ATP reorients the neck linker of kinesin in two sequential steps. J. Biol. Chem. 2001, 276, 40167–40174. [Google Scholar] [CrossRef]
  38. Gilbert, S.P.; Moyer, M.L.; Johnson, K.A. Alternating Site Mechanism of the Kinesin ATPase. Biochemistry 1998, 37, 792–799. [Google Scholar] [CrossRef]
  39. Cross, R.A. The kinetic mechanism of kinesin. Trends Biochem. Sci. 2004, 29, 301–309. [Google Scholar] [CrossRef]
  40. Schief, W.R.; Clark, R.H.; Crevenna, A.H.; Howard, J. Inhibition of kinesin motility by ADP and phosphate supports a hand-over-hand mechanism. Proc. Natl. Acad. Sci. USA 2004, 101, 1183–1188. [Google Scholar] [CrossRef]
  41. Rosenfeld, S.S.; van Duffelen, M.; Behnke-Parks, W.M.; Beadle, C.; Corrreia, J.; Xing, J. The ATPase Cycle of the Mitotic Motor CENP-E. J. Biol. Chem. 2009, 284, 32858–32868. [Google Scholar] [CrossRef] [PubMed]
  42. Friel, C.T.; Howard, J. The kinesin-13 MCAK has an unconventional ATPase cycle adapted for microtubule depolymerization. EMBO J. 2011, 30, 3928–3939. [Google Scholar] [CrossRef] [PubMed]
  43. Cooper, J.R.; Wagenbach, M.; Asbury, C.L.; Wordeman, L. Catalysis of the microtubule on-rate is the major parameter regulating the depolymerase activity of MCAK. Nat. Struct. Mol. Biol. 2010, 17, 77. [Google Scholar] [CrossRef] [PubMed]
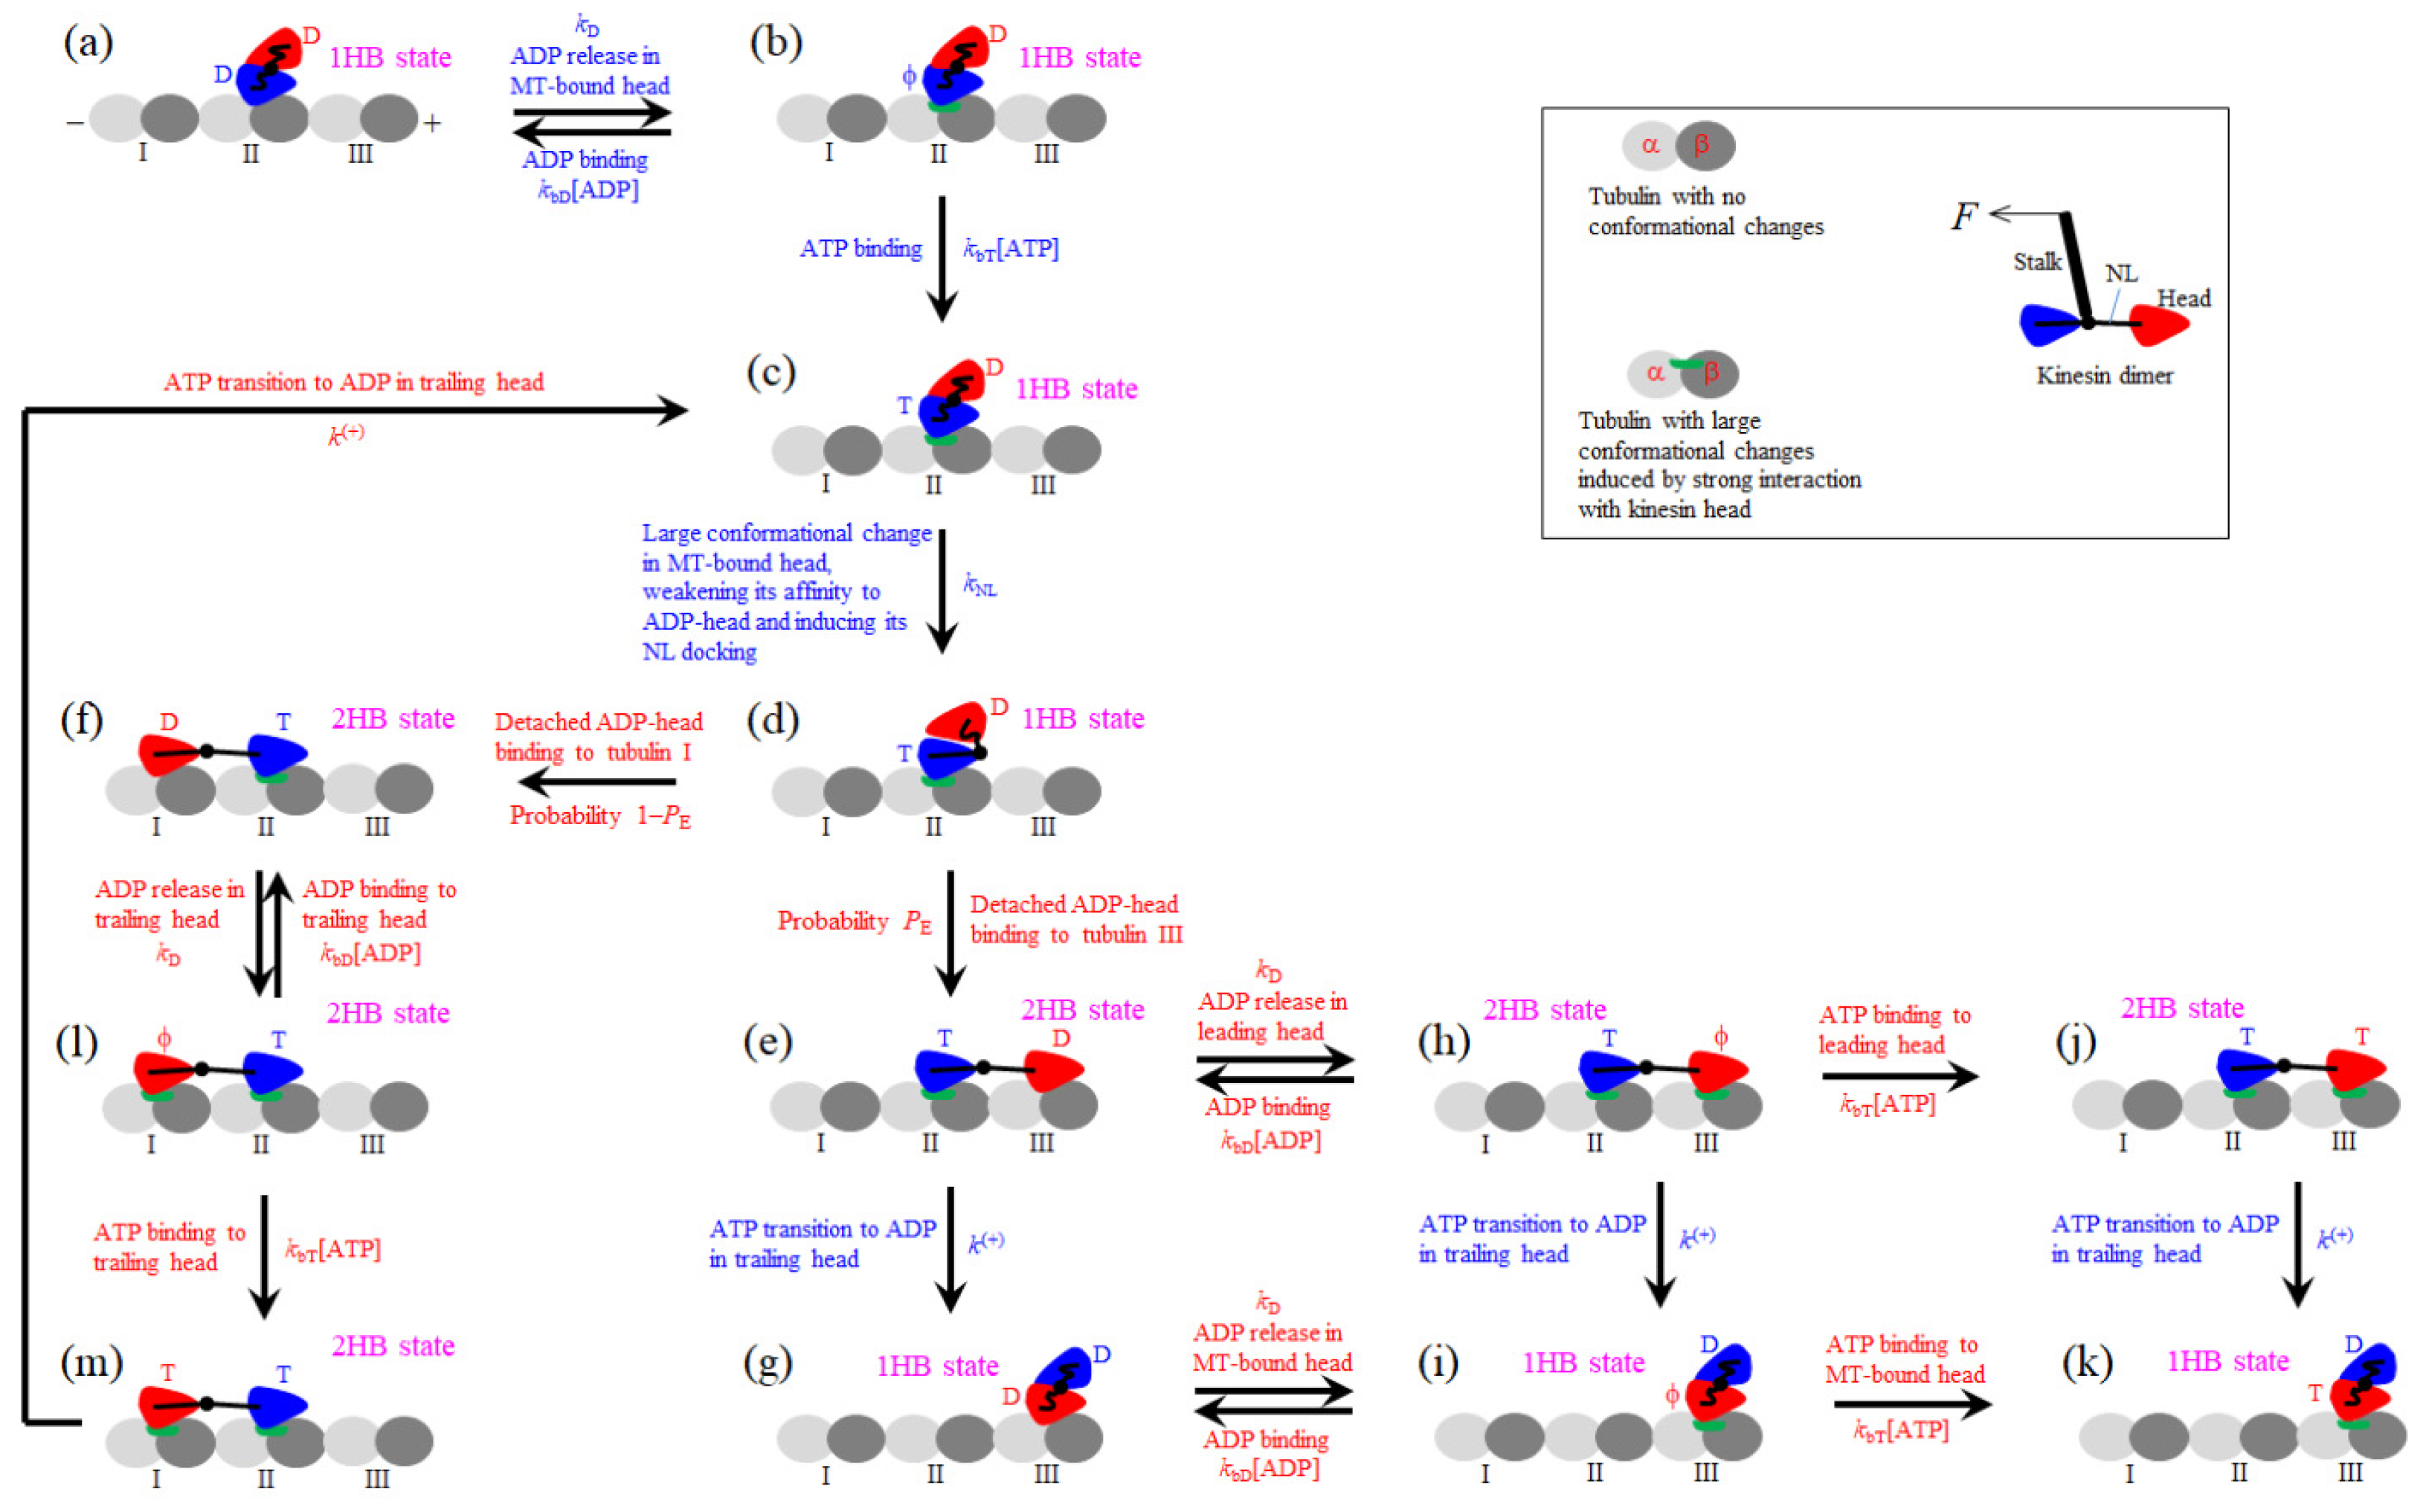
Figure 1. General chemomechanical pathway of the kinesin motor. T represents ATP and ADP. Pi, D represents ADP, and ϕ represents nucleotide-free. The inset shows schematically the normal tubulin with no large conformational changes, the tubulin with the large conformational changes induced by the strong binding of the kinesin head in the ϕ or T state to the tubulin, and the structural components of the kinesin dimer. For clarity, only in the inset is the motor’s stalk shown. Stages (am) state transitions (see Section 2 for detailed descriptions). After the dimer in the ADP state binds to MT (a), ADP is released from the MT-bound head (b), followed by ATP binding (c). Then, the transitions from stage (c) through stage (k), which include the futile coupling transitions from stage (d) to (m) and returning to stage (c), correspond to a stepping cycle of the motor. The mechanical steps include the diffusion of the ADP-head from the local tubulin to the intermediate (INT) position, i.e., the transition from stage (e) to (g), from stage (h) to (i), from stage (j) to (k), or from stage (m) to (c), which occurs after ATP transition to ADP in the TH, and the diffusion of the detached ADP-head from the INT position to the nearest tubulin, i.e., the transition from stage (d) to either stage (e) or (f), which occurs after the decrease in the binding energy of the MT-bound ATP-head to the detached ADP-head. The other transitions correspond to the ATPase activity and the large conformational change associated with the NL docking of the head. Since the rates of the mechanical steps (on the order of 1 μs−1) are much larger than the rate constants of the ATPase activity and the large conformational change in the ATP head (on the order of 1~10 ms−1), the rates of the mechanical steps are not indicated.
Biomolecules 15 00717 g001
Figure 2. Ratio of the fraction of 2HB state to that of 1HB state, F 2 HB / F 1 HB , under saturating ATP concentrations, no load and no free ADP. Under this condition, F 2 HB / F 1 HB is determined mainly by α = k ( + ) / k D and mildly by β = k NL / k D . Thin dotted lines correspond to F 2 HB / F 1 HB = 1, at which the 1HB and 2HB states have the same fraction. When F 2 HB / F 1 HB > 1, the motor is in the predominant 2HB state, and when F 2 HB / F 1 HB < 1, the motor is in the predominant 1HB state. (a) F 2 HB / F 1 HB vs. α for various values of β . (b) F 2 HB / F 1 HB vs. β for various values of α .
Biomolecules 15 00717 g002
Figure 3. Effect of ATP concentration, [ATP], on the ratio of the fraction of the 2HB state to that of the 1HB state, F 2 HB / F 1 HB , under no free ADP and no load. Thin dotted lines correspond to F 2 HB / F 1 HB = 1, at which the 1HB and 2HB states have the same fraction. When F 2 HB / F 1 HB > 1, the motor is in the predominant 2HB state, and when F 2 HB / F 1 HB < 1, the motor is in the predominant 1HB state. (a) F 2 HB / F 1 HB vs. [ATP] for various values of α at small β = 2. (b) F 2 HB / F 1 HB vs. [ATP] for various values of α at large β = 100.
Biomolecules 15 00717 g003
Figure 4. Effect of backward load, F, on the ratio of the fraction of 2HB state to that of 1HB state, F 2 HB / F 1 HB at saturating ATP concentrations and no free ADP. Thin dotted lines correspond to F 2 HB / F 1 HB = 1, at which the 1HB and 2HB states have the same fraction. When F 2 HB / F 1 HB > 1, the motor is in the predominant 2HB state, and when F 2 HB / F 1 HB < 1, the motor is in the predominant 1HB state. (a) F 2 HB / F 1 HB vs. F for various values of α at small β = 2. (b) F 2 HB / F 1 HB vs. F for various values of α at large β = 100.
Biomolecules 15 00717 g004
Figure 5. Effect of ADP concentration on velocity and ratio of the fraction of 2HB state to that of 1HB state, F 2 HB / F 1 HB , under no load for kinesin-1 from bovine brain. Lines are theoretical results, and symbols are experimental data from Schief et al. [40]. (a) Velocity vs. ATP concentration for [ADP] = 0 mM, 1 mM and 5 mM. (b) Velocity vs. ADP concentration for [ATP] = 300 μM, 1 mM, 3 mM, 10 mM and 20 mM. (c) F 2 HB / F 1 HB vs. ATP concentration for [ADP] = 0 mM, 1 mM and 5 mM. (d) F 2 HB / F 1 HB vs. ADP concentration for [ATP] = 300 μM, 1 mM, 3 mM, 10 mM and 20 mM. Thin dotted lines in (c,d) correspond to F 2 HB / F 1 HB = 1, at which the 1HB and 2HB states have the same fraction. When F 2 HB / F 1 HB > 1, the motor is in the predominant 2HB state, and when F 2 HB / F 1 HB < 1, the motor is in the predominant 1HB state.
Biomolecules 15 00717 g005
Figure 6. Effect of the ATP concentration, [ATP], on 1HB and 2HB states of human kinesin-1 under no load. (a) Ratio of the fraction of 2HB state to that of 1HB state, F 2 HB / F 1 HB , versus [ATP]. The thin dotted line corresponds to F 2 HB / F 1 HB = 1, at which the 1HB and 2HB states have the same fraction. When F 2 HB / F 1 HB > 1, the motor is in the predominant 2HB state, and when F 2 HB / F 1 HB < 1, the motor is in the predominant 1HB state. (b) Duration of 1HB state, τ 1 HB , versus [ATP]. (c) Duration of 2HB state, τ 2 HB , versus [ATP]. In (ac), lines are theoretical results calculated with the parameter values being indicated, and red dots are experimental data from Isojima et al. [13], with the experimental data for F 2 HB / F 1 HB being calculated from those for τ 1 HB and τ 2 HB .
Biomolecules 15 00717 g006
Table 1. Meanings of α , β , γ T and γ D .
α = k ( + ) / k D Ratio of rate of ATP transition to ADP in TH to that of ADP release from MT-bound head
β = k NL / k D Ratio of rate of NL docking in ATP-head to that of ADP release from MT-bound head
γ T = k bT / k D Ratio of the rate of the second-order ATP-binding rate to that of ADP release from the MT-bound head
γ D = k bD / k D Ratio of the rate of the second-order ADP-binding rate to that of ADP release from the MT-bound head
Disclaimer/Publisher’s Note: The statements, opinions and data contained in all publications are solely those of the individual author(s) and contributor(s) and not of MDPI and/or the editor(s). MDPI and/or the editor(s) disclaim responsibility for any injury to people or property resulting from any ideas, methods, instructions or products referred to in the content.