Article

Tannic Acid and Ethacridine Lactate Attenuate Markers of Stress-Induced Intestinal Barrier Dysfunctions in Murine Small Intestinal Organoids

1
Institute of Nutritional Medicine, University of Hohenheim, Fruwirthstr. 12, 70599 Stuttgart, Germany
2
MEDICE Arzneimittel Pütter GmbH & Co. KG, Kuhloweg 37, 58638 Iserlohn, Germany
*
Author to whom correspondence should be addressed.
Biomolecules 2025, 15(5), 650; https://doi.org/10.3390/biom15050650
Submission received: 5 March 2025 / Revised: 2 April 2025 / Accepted: 29 April 2025 / Published: 30 April 2025
(This article belongs to the Section Molecular Medicine)

Abstract

:
(1) Background: Tannacomp® is a drug consisting of tannin albuminate, a complex of tannic acid (TA) and ethacridine lactate (Eta) used for treating acute and traveler’s diarrhea. TA is thought to modulate gastrointestinal barrier function, but the underlying mechanisms and whether Eta has similar effects remains unclear. (2) Methods: to investigate the effects of TA and Eta on the intestinal barrier, stress responses were induced in murine intestinal organoids by lipopolysaccharide (LPS) exposure or withdrawal of growth factors from cell culture medium (GFRed). Further, organoids were exposed to either TA (0.01 mg/mL) or Eta (0.002 mg/mL) and markers of inflammatory response and gut barrier function were assessed. (3) Results: TA and Eta reduced several inflammatory markers such as interleukin 6, interleukin 1β, tumor necrosis factor α, and myeloid differentiation primary response 88 in stressed organoids. In addition, TA and Eta attenuated LPS- and GFRed-mediated gut barrier dysfunctions, with normalization of tight junction, adherent junction and mucin gene expression and reduction of Nod2- and matrix metalloproteinase 7-dependent activation of antimicrobial peptides. (4) Conclusions: our data show that TA and Eta modulate markers of inflammation and the intestinal barrier and suggest novel mechanisms of action of this drug that could broaden its treatment indications.

Graphical Abstract

1. Introduction

The combination of tannins and ethacridine lactate has been used for decades to prevent and treat acute, non-specific and traveler’s diarrhea [1,2,3]. Tannins are polyphenolic compounds which exert effects by precipitating proteins [4,5]. This so-called “astringent effect” leads to reduced absorption of toxic substances, thereby protecting the intestinal mucosa against further stress factors [1]. In addition, TA provides anti-inflammatory and antiproliferative activities [6]. Eta exhibits antiseptic–bacteriostatic effects against different pathogenic bacterial strains, such as Staphylococcus aureus, Escherichia coli, various Salmonella strains and Shigella [7]. Further, Eta improves symptoms such as abdominal cramps and increased intestinal passage through spasmolytic effects [1]. Recent evidence also points towards the fact that tannins and Eta exhibit therapeutic activity by modulating gastrointestinal (GI) barrier function [8]. Intestinal barrier dysfunctions, especially disturbances in tight junction (TJ) and adherent junction (AJ) protein formation, have become an important factor in the pathogenesis of several diseases such as GI infections and inflammatory bowel diseases (IBD) such as Crohn’s disease (CD), recurrent diarrhea [9] or intestinal metaplasia [10,11]. We and others have shown that decreased occludin (Ocln) and zonula occludens 1 (ZO-1) expression results in impaired intestinal permeability, promoting bacterial translocation and low-grade inflammation [12,13,14,15,16]. Further, reduced claudin (Cldn) 7 formation contributes to increased GI inflammatory processes and cell degeneration [17].
Another important defense strategy of the GI barrier is the formation and secretion of antimicrobial peptides (AMPs), which exhibit broad antibacterial, antiviral and antifungal effects, thereby protecting against pathogens and regulating the intestinal microbiota [18,19,20]. Mammalian AMPs can be classified into cathelicidins, regenerating gene 3 proteins and defensins [20,21]. Defensins can be divided into α-, β-, and δ-defensins [19]. While α-defensins are mainly produced by Paneth cells in the small intestine, β-defensins occur on epithelial surfaces, such as in colon or liver [22]. A compromised GI antimicrobial peptide defense has been found to increase the risk of several GI diseases such as IBD or enterocolitis [23,24]. For example, CD patients exhibited reduced ileal α-defensin expression [25,26], which was associated with defects of AMP regulators, such as NOD2 [27,28], or toll-like receptors (TLR) [29]. Further, reduced intestinal α-defensin expression led to disturbed intestinal microbiota composition and bacterial overgrowth, as well as decreased GI barrier integrity, promoting bacterial translocation [13,30]. However, the underlying mechanisms of impaired AMP defense in the context of GI diseases are still not fully understood. Besides a decrease in Paneth cell number and function, impaired signal-mediated induction and reduced proteolytic activation have been discussed [24,31,32].
There is evidence that TA exerts therapeutic effects by regulating GI barrier function. Oral gavage of TA in an oxidative stress mouse model resulted in an improved intestinal morphology and intestinal barrier by reducing Cldn and inducing ZO-1 expression [8]. Additionally, TA treatment improved lactose-induced diarrhea in rats by ameliorating GI barrier integrity, thereby reducing serum zonulin levels and inducing ileal ZO-1 protein expression [33]. Further, human studies revealed that enrichment of food with tannin extracts modulated the intestinal microbiota, specifically by increasing short chain fatty acid (SCFA)-producing bacteria, such as members of Lachnospiraceae and Ruminococcaceae families [34]. However, there is little knowledge available about how TA or Eta regulate GI barrier function, especially in the context of inflammatory processes. In the present study, we investigated the effects of Tannacomp®, especially of the components TA and Eta, on GI barrier function and inflammatory responses during stress exposure. For this purpose, an in vitro murine organoid model was used, offering the possibility to generate in vitro three-dimensional cell structures, resulting in in vivo-like organ complexity. Stress was induced by adding proinflammatory LPS or by the withdrawal of growth factors from the cell culture medium. Organoids are a well-established tool to study mucosal immune responses and intestinal barrier function related to chronic GI diseases.

2. Materials and Methods

2.1. Organoid Cell Culture

2.1.1. Isolation and Cultivation

In order to generate small intestinal organoids, C57BL6J mice were anesthetized using CO2 and crypts were isolated from the small intestine by using crypt isolation buffer (CIB, PBSO containing 0.5 M EDTA). A total of 500 isolated crypts were plated with 25 µL Matrigel (Corning B.v., Amsterdam, The Netherlands) and 300 µL crypt culture medium (CCM) was added, consisting of advanced DMEM/F12 (ThermoFisher Scientific, Karlsruhe, Germany) supplemented with 2 mM GlutaMaxTM (ThermoFisher Scientific, Waltham, MA, USA), 10 mM Hepes (Merck, Darmstadt, Germany), 100 ng/µL Noggin (PeproTech, East Windsor, NJ, USA), 1 µg/mL R-Spondin (PeproTech, East Windsor, NJ, USA), B-27™ supplement 1× (Invitrogen, Carlsbad, CA, USA), 1 mM N-Acetylcysteine (Sigma-Aldrich, Schnelldorf, Germany), 0.1 mg/mL Primocin (Invitrogen, Carlsbad, CA, USA) and 50 ng/mL EGF (Immunotools, Friesoythe, Germany). The resulting organoids were cultured for a minimum of seven days, as previously described [35].

2.1.2. Medium Change and Splitting

Organoid growth was monitored by light microscopy and cell culture medium was changed every third day. For cell splitting, CCM was replaced with 500 µL wash buffer (advanced DMEM/F12) containing Pen (100 U/mL)/Strep (100 µg/mL) (ThermoFisher Scientific, Karlsruhe, Germany) and 7.5% BSA (solved in PBSO; Carl Roth GmbH, Karlsruhe, Germany). Organoids were mechanically disrupted followed by centrifugation at 200× g for 5 min, then washed repeatedly with 2 mL wash buffer and centrifuged at 200× g for 5 min. Cell pellets were suspended with 25 µL Matrigel, plated in a 48-well plate and 300 µL CCM was added.

2.2. Determination of Tannic Acid (TA) and Ethacridine Lactate (Eta) Concentration

For dose determination, the effects of TA and Eta on cell number and cell viability were investigated by using an MTT reduction assay. In addition, markers of intestinal barrier inflammation were analyzed by RT-PCR. For MTT assay, organoids were exposed to 6 µL TA (solved in PBSO, stock solution 50 mg/mL for final concentration of 1 mg/mL), or 6 µL TA (solved in PBSO, stock solution 5 mg/mL for final concentration of 0.1 mg/mL), or 0.6 µL TA (solved in PBSO, stock solution 5 mg/mL for final concentration of 0.01 mg/mL), or 6 µL Eta (solved in PBSO, stock solution 50 mg/mL for final concentration of 1 mg/mL), or 6 µL Eta (solved in PBSO, stock solution 5 mg/mL for final concentration of 0.1 mg/mL), or 0.12 µL Eta (solved in PBSO, stock solution 5 mg/mL for final concentration of 0.002 mg/mL), or with an equivalent amount of PBSO as control for 30 h. Then, 7 µL MTT solution (500 mg/mL, solved in PBSO) was added and organoids were incubated for 1 h at 37 °C. Supernatant was discarded, and organoids were incubated for 1 h at 37 °C with 20 µL SDS. Subsequently, 100 µL DMSO was added (1 h at 37 °C) and optical density was measured at 562 nm. Further, based on MTT assay measurements, ED50 and ED100 were calculated by using the following equation:
y = O D m i n + ( O D m a x O D m i n ) 1 + ( x E D 50 ) h

2.3. Establishing Methods for Organoid Stress

Different stress conditions were tested in organoids by conducting the following experimental protocols: (i) reduction of growth factors R-Spondin and noggin in CCM, (ii) LPS exposure (100 µg/mL, 50 µg/mL, solved in PBS). For this purpose, R-Spondin and noggin, both activators of Wnt signaling pathway, were reduced (GFRed, Table 1) and organoids were stimulated with 300 µL GFRed, consisting of DMEM/F12 with 0.5 µg/mL R-Spondin, 50 ng/µL noggin, 1x B-27™ supplement, 1 mM N-Acetylcysteine, 0.1 mg/mL Primocin and 50 ng/mL mEGF. For the second protocol, organoids were stimulated with 15 µL LPS (solved in PBSO, stock solution 2 mg/mL for final concentration of 100 µg/mL), or 7.5 µL LPS (solved in PBSO, stock solution 2 mg/mL for final concentration of 50 µg/mL), or with a corresponding amount of PBS as control for 30 h. Total RNA was extracted, reverse-transcribed and relative gene expression of Cldn7, Ocln, interleukin (IL)-6 and IL-1β was calculated by comparison to housekeeping gene β-Actin by using the ΔΔ-Ct method (oligonucleotide primer sequences are listed in Table S1).

2.4. Exposure to Pharmacologic Molecules

To evaluate the effects of 0.01 mg/mL TA or 0.002 mg/mL Eta on GI barrier function and inflammatory processes, organoids were exposed to 0.6 µL TA (solved in PBSO, stock solution 5 mg/mL for final concentration of 0.01 mg/mL), or 0.12 µL Eta (solved in PBSO, stock solution 5 mg/mL for final concentration of 0.002 mg/mL, solved in PBSO), or GFRed ± 0.6 µL TA (solved in PBSO, stock solution 5 mg/mL for final concentration of 0.01 mg/mL), or GFRed ± 0.12 µL Eta (solved in PBSO, stock solution 5 mg/mL for final concentration of 0.002 mg/mL), or 7.5 µL LPS (solved in PBSO, stock solution 2 mg/mL for final concentration of 50 µg/mL) ± 0.6 µL TA (solved in PBSO, stock solution 5 mg/mL for final concentration of 0.01 mg/mL), or 7.5 µL LPS (solved in PBSO, stock solution 2 mg/mL for final concentration of 50 µg/mL) ± 0.12 µL ETA (solved in PBSO, stock solution 5 mg/mL for final concentration of 0.002 mg/mL), or with an equivalent amount of PBSO as control for 30 h.

2.5. RNA Isolation, Generation of Standard Plasmids and RT-PCR

Total RNA from organoids was extracted by EXTRACTME Total RNA Kit (blirt S.A., Hilden, Germany) and complementary cDNA was synthesized by Reverse Transcription System (Promega, Madison, WI, USA). Standard plasmids were generated using the TOPO TA Cloning®Kit For Sequencing (lifetechnologies™, Carlsbad, CA, USA) to analyze absolute gene expression. Amplification of target genes was performed, followed by a transfection into a plasmid vector and transformation into competent One Shot®TOP10 + DH5α™-T1® cells (Invitrogen, Carlsbad, CA, USA). Plasmid DNA was characterized by sequencing (GATC Biotech AG, Konstanz, Germany).
RT-PCR was performed as previously described [13]. The oligonucleotide primer sequences are listed in Table S1. To determine absolute gene expression of α-defensin (Defa) 1, Defa21, Defa5, murine β-defensin (mbD) 1, lysozyme (Lyz1), regenerating islet-derived protein 3 gamma (Reg3γ), Nod2, and matrix metalloproteinase 7 (Mmp7), quantitative standard curves were generated by serial dilution of plasmid standards and normalized to the copy numbers of mouse housekeeping gene β-Actin. Relative gene expression of ZO-1, junctional adhesion molecule (JAM) A, Cldn2, Cldn5, Cldn7, Ocln, mucin (Muc)1, Muc2, IL-6, IL-1β, myeloid differentiation primary response 88 (Myd88), and tumor necrosis factor α (Tnfα) was calculated by comparison to the housekeeping gene β-Actin using the ΔΔ-Ct method.

2.6. Statistical Analysis

Statistical analyses were performed using GraphPad Prism software 7.0 (GraphPad Software Inc., La Jolla, CA, USA). Analysis of normal distribution was performed using the Kolmogorov–Smirnov test, with outliers identified using the ROUT method (Q = 1 %). A one-way analysis of variance (ANOVA) with Dunnett’s multiple comparisons test or Kruskal–Wallis test with Dunn’s multiple comparisons test was performed for statistical comparison of more than two groups. Differences between two groups were tested by unpaired t-test or Mann–Whitney test. Data are presented as mean ± standard error of the mean (SEM). p-values of <0.05 were considered statistically significant. A statistical trend was defined as 0.05 > p-value < 0.1. Correlation analyses were performed by two-tailed Spearman rank correlation, with co-efficients in the range of 0.0 to 0.2 (0.0 to −0.2) defined as no correlation, in the range of 0.2 to 0.4 or −0.2 to −0.4 defined as weak positive or negative correlation, in the range of 0.4 to 0.6 or −0.4 to −0.6 defined as moderate positive or negative correlation, in the range of 0.6 to 0.8 or −0.6 to −0.8 defined as strong positive or negative correlation, in the range of 0.8 to 1.0 or −0.8 to −1.0 defined as very strong positive or negative correlation.

3. Results

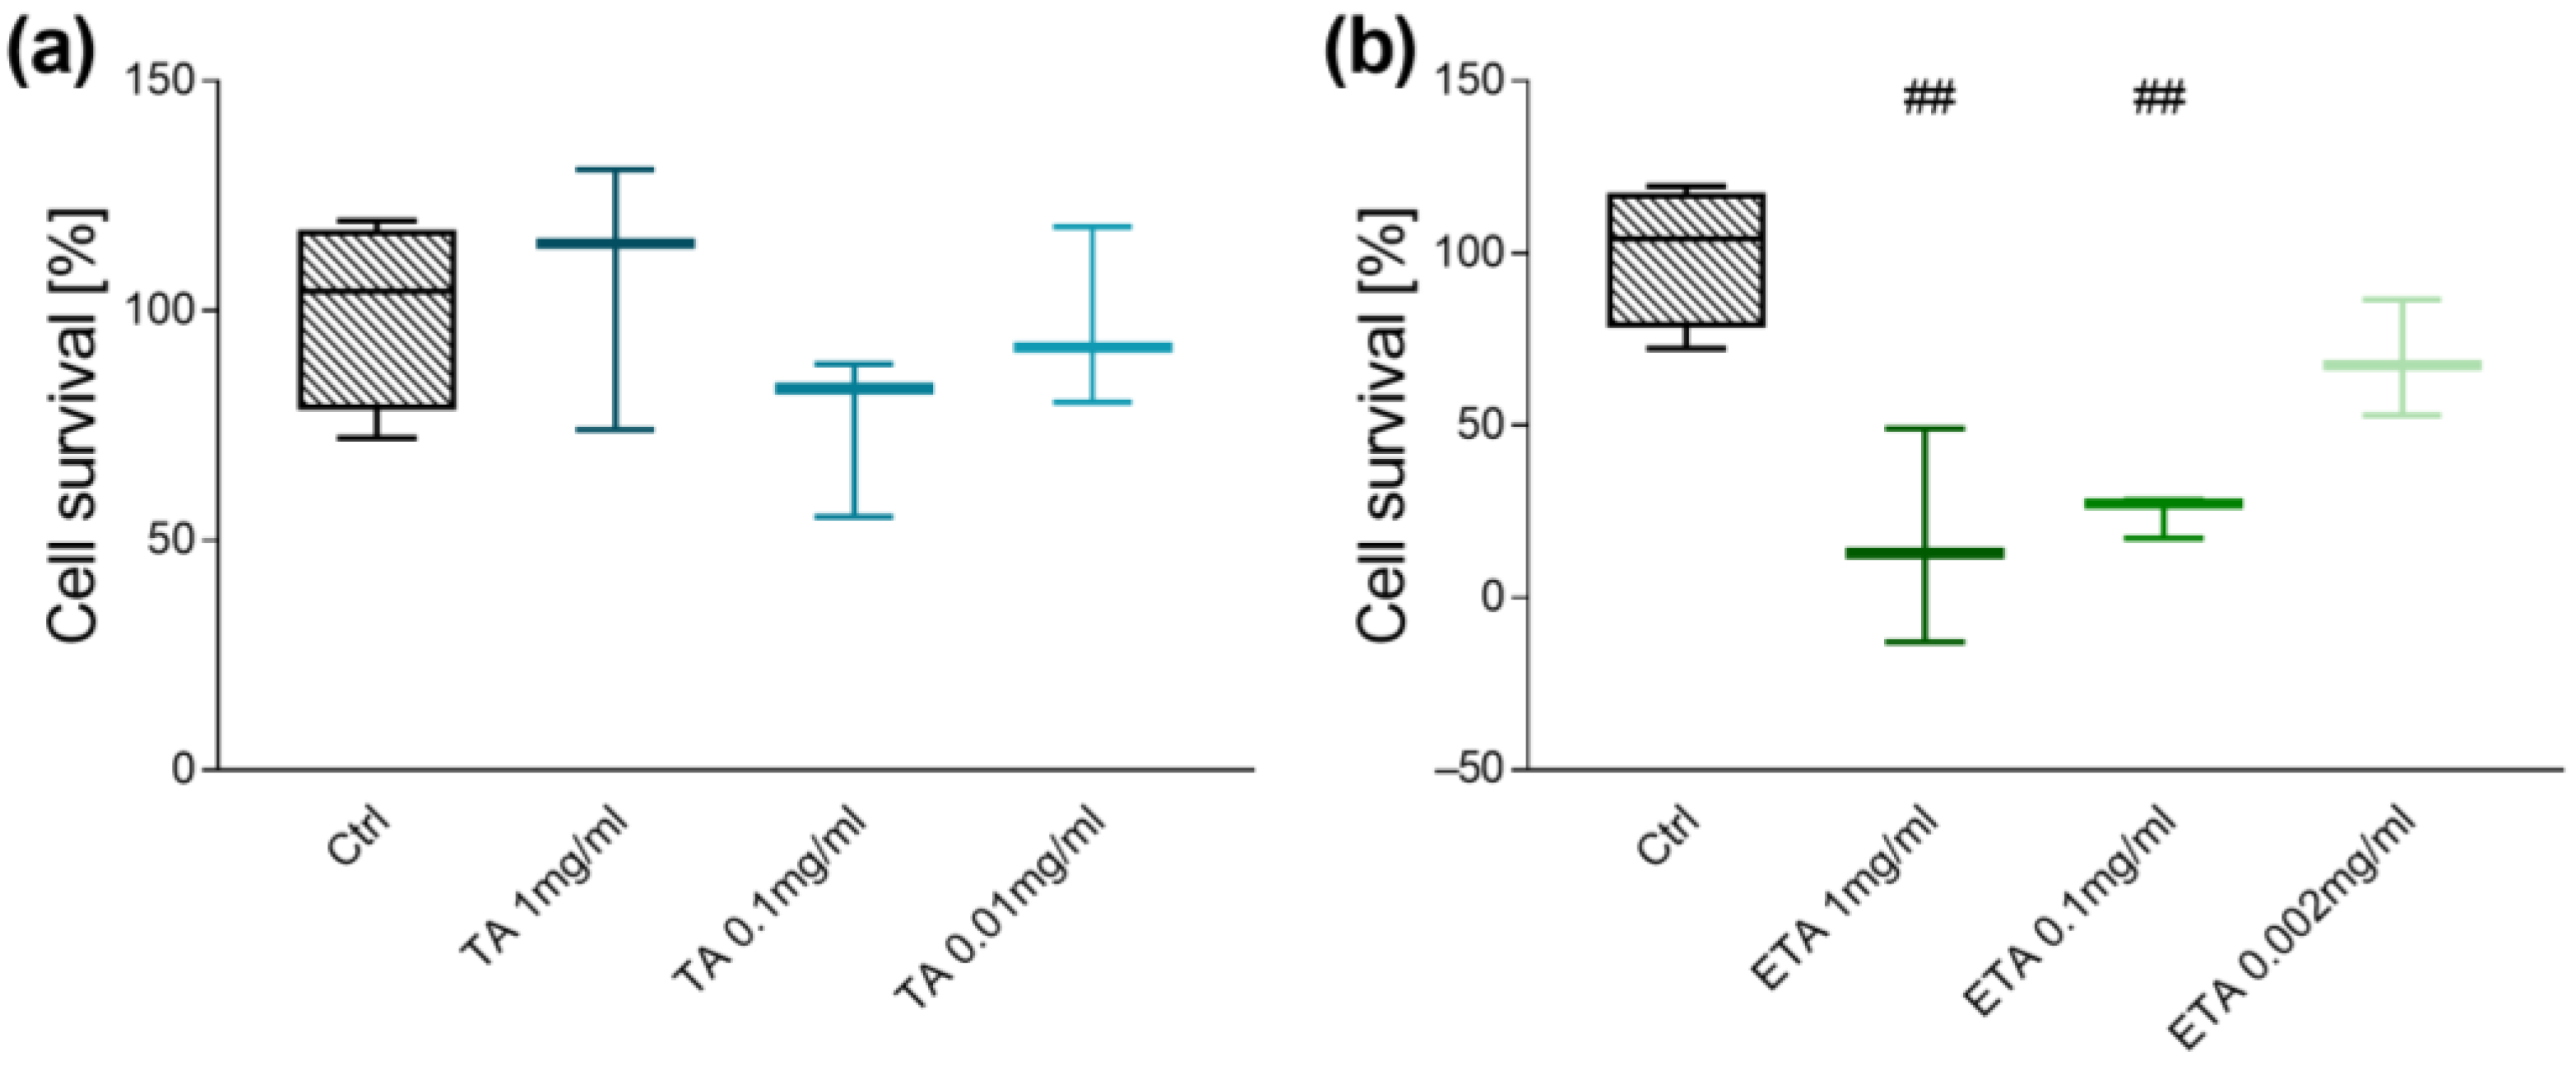
3.1. Dose-Finding Studies

We first conducted an MTT assay, to exclude cytotoxic effects of TA and Eta stimulation using three different concentrations (TA 1, 0.1, and 0.01 mg/mL, or Eta 1, 0.1, 0.002 mg/mL). TA up to 1 mg/mL and Eta up to 0.1 mg/mL did not affect viability of small intestinal organoids whereas exposure of organoids to Eta at higher concentrations resulted in a reduction of cell survival (p < 0.01, Figure 1a,b). Further, ED50 and ED100 calculations based on the MTT assay measurements determined an ED50 of 1.623 mg/mL and an ED100 of 1.787 mg/mL for TA as well as an ED50 of 0.081 mg/mL and an ED100 of 0.087 mg/mL for Eta (Table S2).
Consistently, examinations of inflammatory markers by RT-PCR demonstrated that TA up to 0.01 mg/mL and Eta up to 0.002 mg/mL did not induce IL-1β or IL-6 mRNA expression in small intestinal organoids. At higher concentrations, 1 mg/mL TA (p < 0.05), 1 mg/mL Eta (p < 0.01), and 0.1 mg/mL Eta (p < 0.05) induced IL-6 expression (Figure 2a). Further, organoid stimulation with 1 mg/mL Eta (p < 0.05) and 0.1 mg/mL Eta (p < 0.01) upregulated IL-1β mRNA expression (Figure 2b).
Likewise, PCR analyses showed that stimulation of organoids with TA up to 0.01 mg/mL and Eta up to 0.002 mg/mL did not impair markers of barrier function such as Ocln or Cldn7 mRNA expression, whereas higher concentration of TA or Eta resulted in decreased expressions of TJ genes (Figure 2c,d). In conclusion, these examinations demonstrated that TA at concentrations of 0.01 mg/mL and Eta at concentrations of 0.002 mg/mL are appropriate for use in organoid cell culture. Thus, TA and Eta have been administered in a 5:1 ratio, as in the Tannacomp® formulation for human use that contains TA (250 mg) and Eta (50 mg).

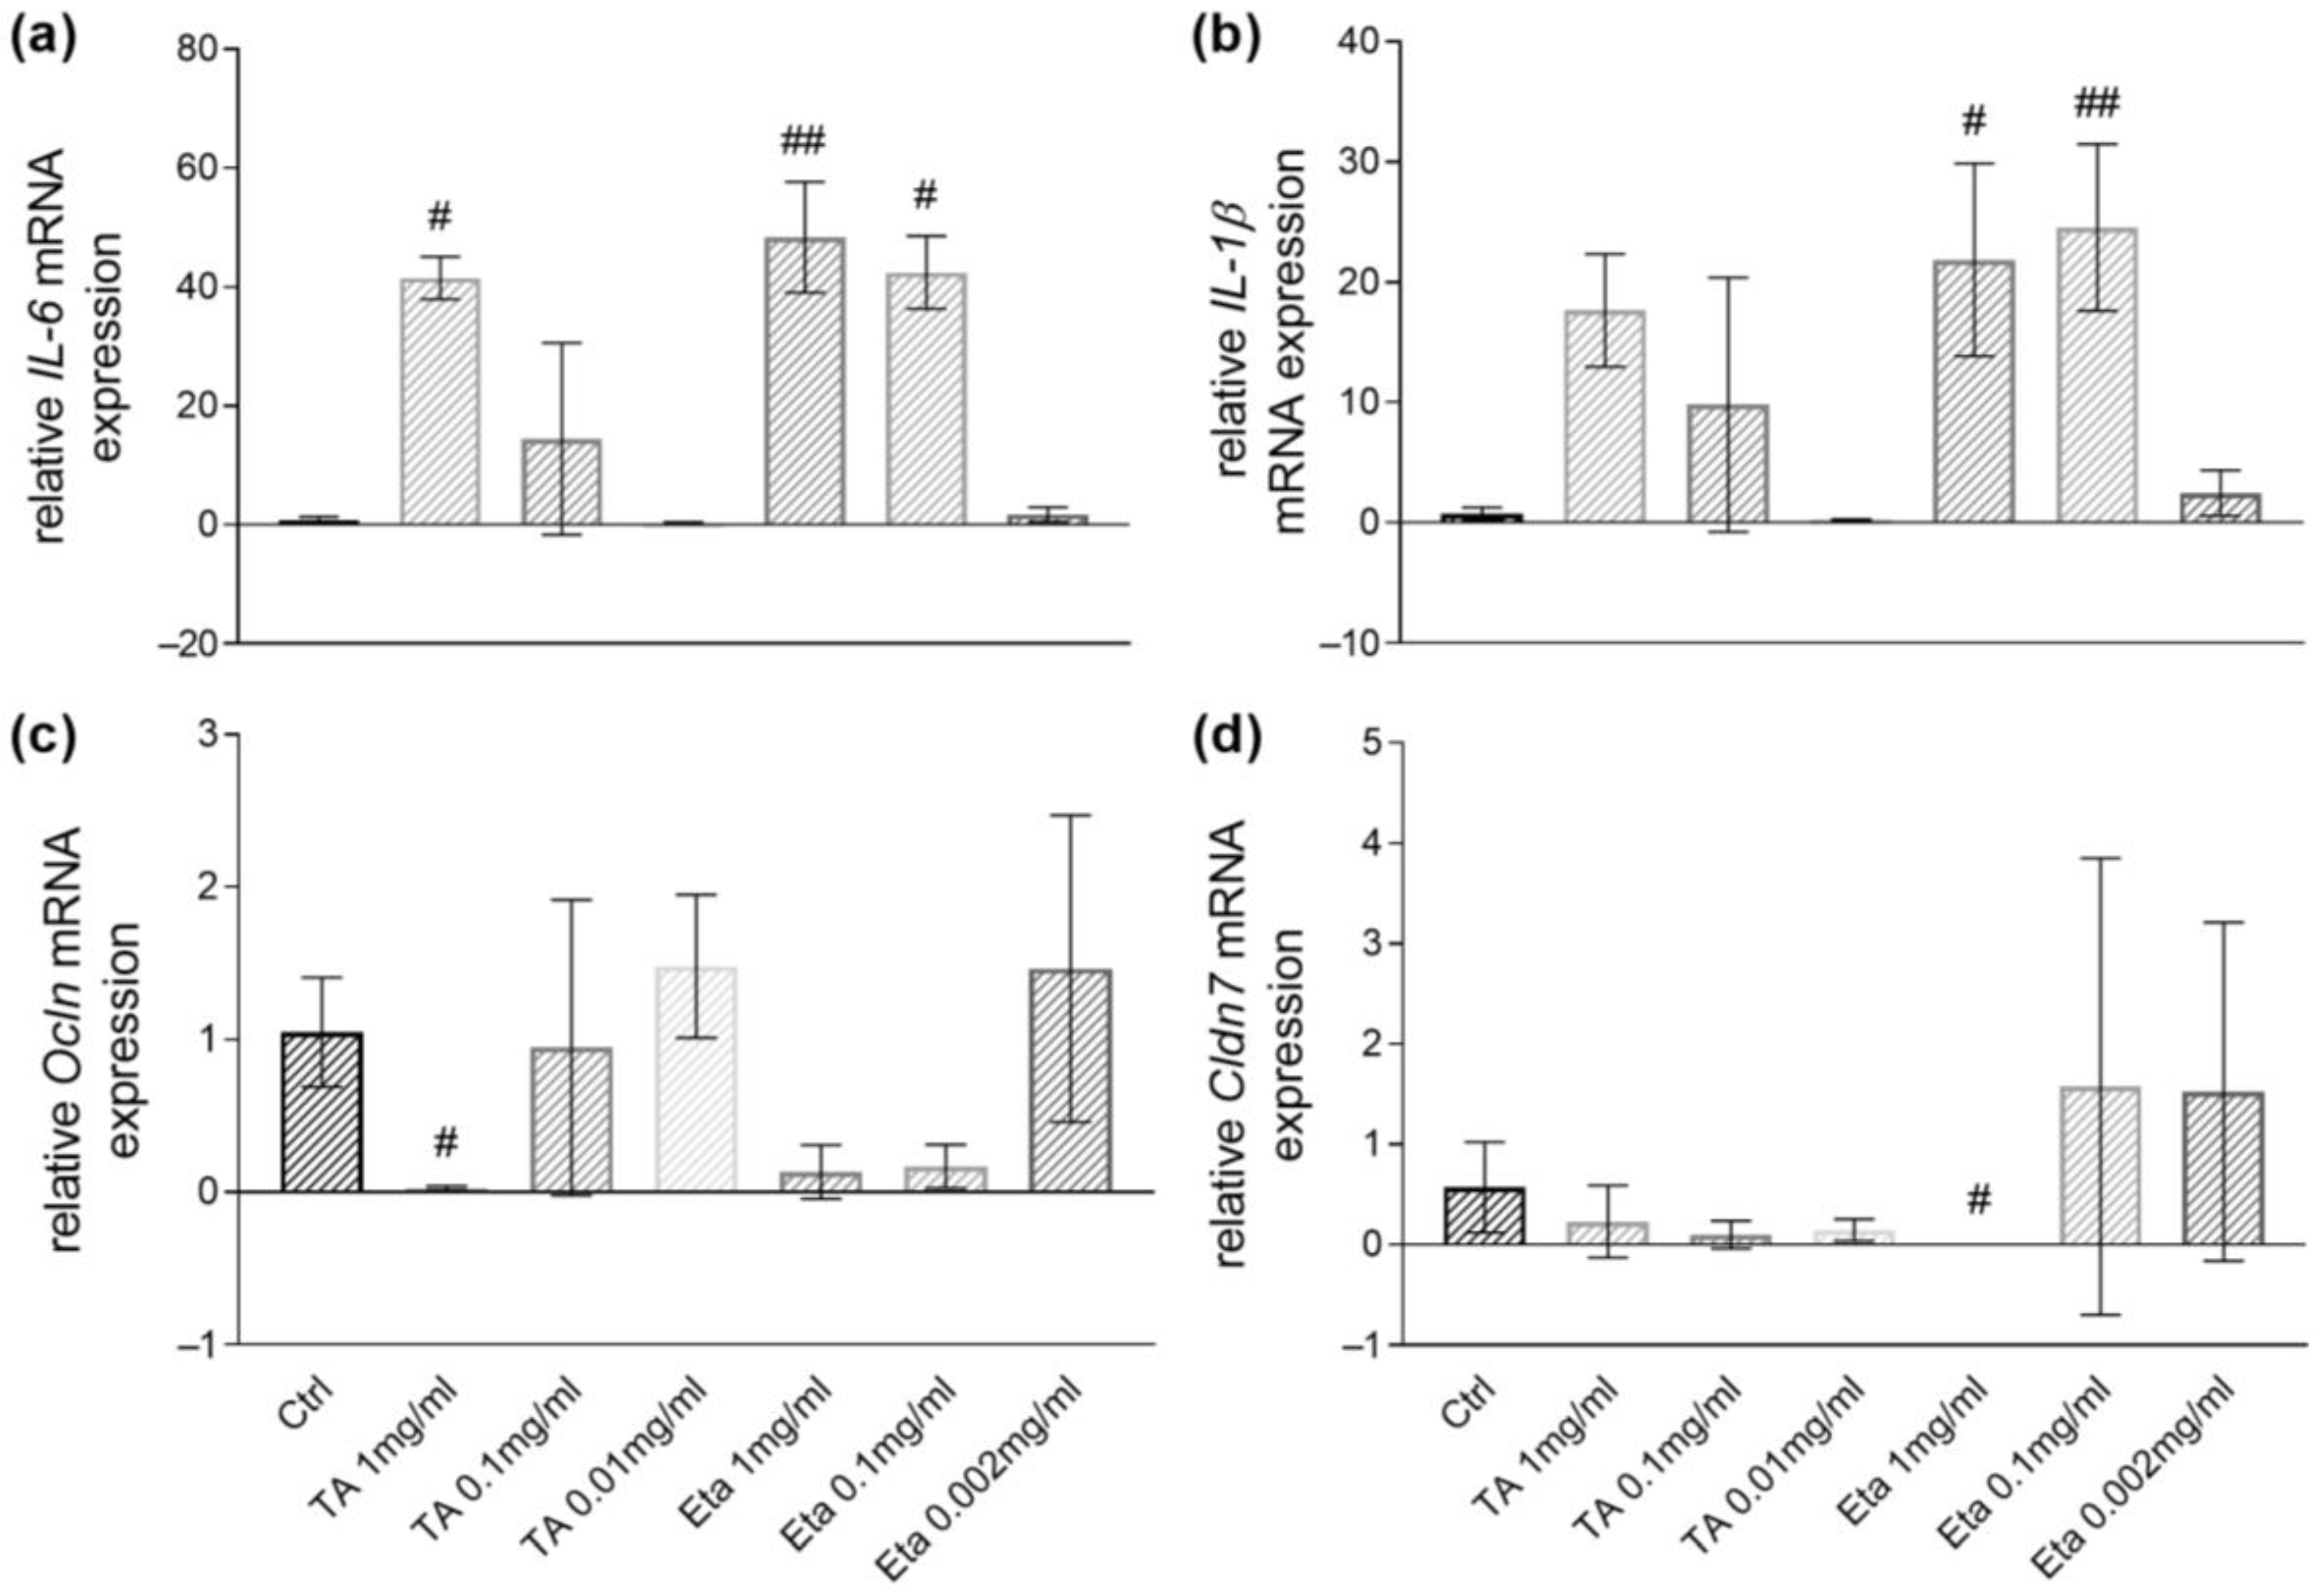
3.2. GFRed and LPS Exposure Induce Proinflammatory Cytokine Transcripts Expression in Small Intestinal Organoids

Exposure of organoids to modified CCM formulation (½ R-Spondin, ½ noggin; GFRed) for 30 h induced Myd88 (p < 0.01), Tnfα (p < 0.01), IL-6 (p < 0.05), and IL-1β gene expression (p < 0.01), indicating inflammatory effects (Table 2). In addition, exposure to LPS also resulted in an increase of several inflammatory markers. Exposure to LPS at 100 µg/mL and 50 µg/mL induced Myd88 gene expression (p < 0.05), whereas Tnfα was found to be induced only by exposure with 50 µg/mL LPS (p < 0.05). Nevertheless, both 100 µg/mL (p < 0.0001) and 50 µg/mL of LPS (p < 0.05) increased IL-6 and IL-1β gene expression (p < 0.05, Table 2). Comparatively, both GFRed (p < 0.05) as well as with 100 µg/mL (p < 0.05) or 50 µg/mL LPS (p < 0.01) reduced Ocln gene expression. Further, organoid treatment with GFRed resulted in a decrease of Cldn7 expression (p < 0.05, Table 2).

3.3. TA and Eta Stimulation Improve Stress-Induced Myd88 and Cytokine Transcript Expression

While exposure of organoids to 0.01 mg/mL TA or 0.002 mg/mL Eta had no effects on proinflammatory cytokine transcripts expression (Figure S1), assessment revealed that reduction of growth factors led to an induction of Myd88 mRNA expression (p < 0.001, Table 3). However, this GFRed-mediated effect was absent when organoids were co-exposed to 0.01 mg/mL TA (p < 0.01) or 0.002 mg/mL Eta (p < 0.001), suggesting that both substrates might display anti-inflammatory effects (Table 3). In accordance therewith, reduction of growth factors resulted in an increase of Tnfα mRNA expression (p < 0.01), whereas co-stimulation with TA (p < 0.01) or Eta (p < 0.01) at the concentrations indicated above prevented this effect (Table 3). Moreover, GFRed-induced stress increased IL-6 (p < 0.01) and IL-1β (p < 0.01), whereas exposure with LPS had no effects (Table 3). Further, stimulation of GFRed-treated organoids with TA or Eta was found to decrease IL-6 (p < 0.05) and IL-1β gene expression (p < 0.01, Table 3).

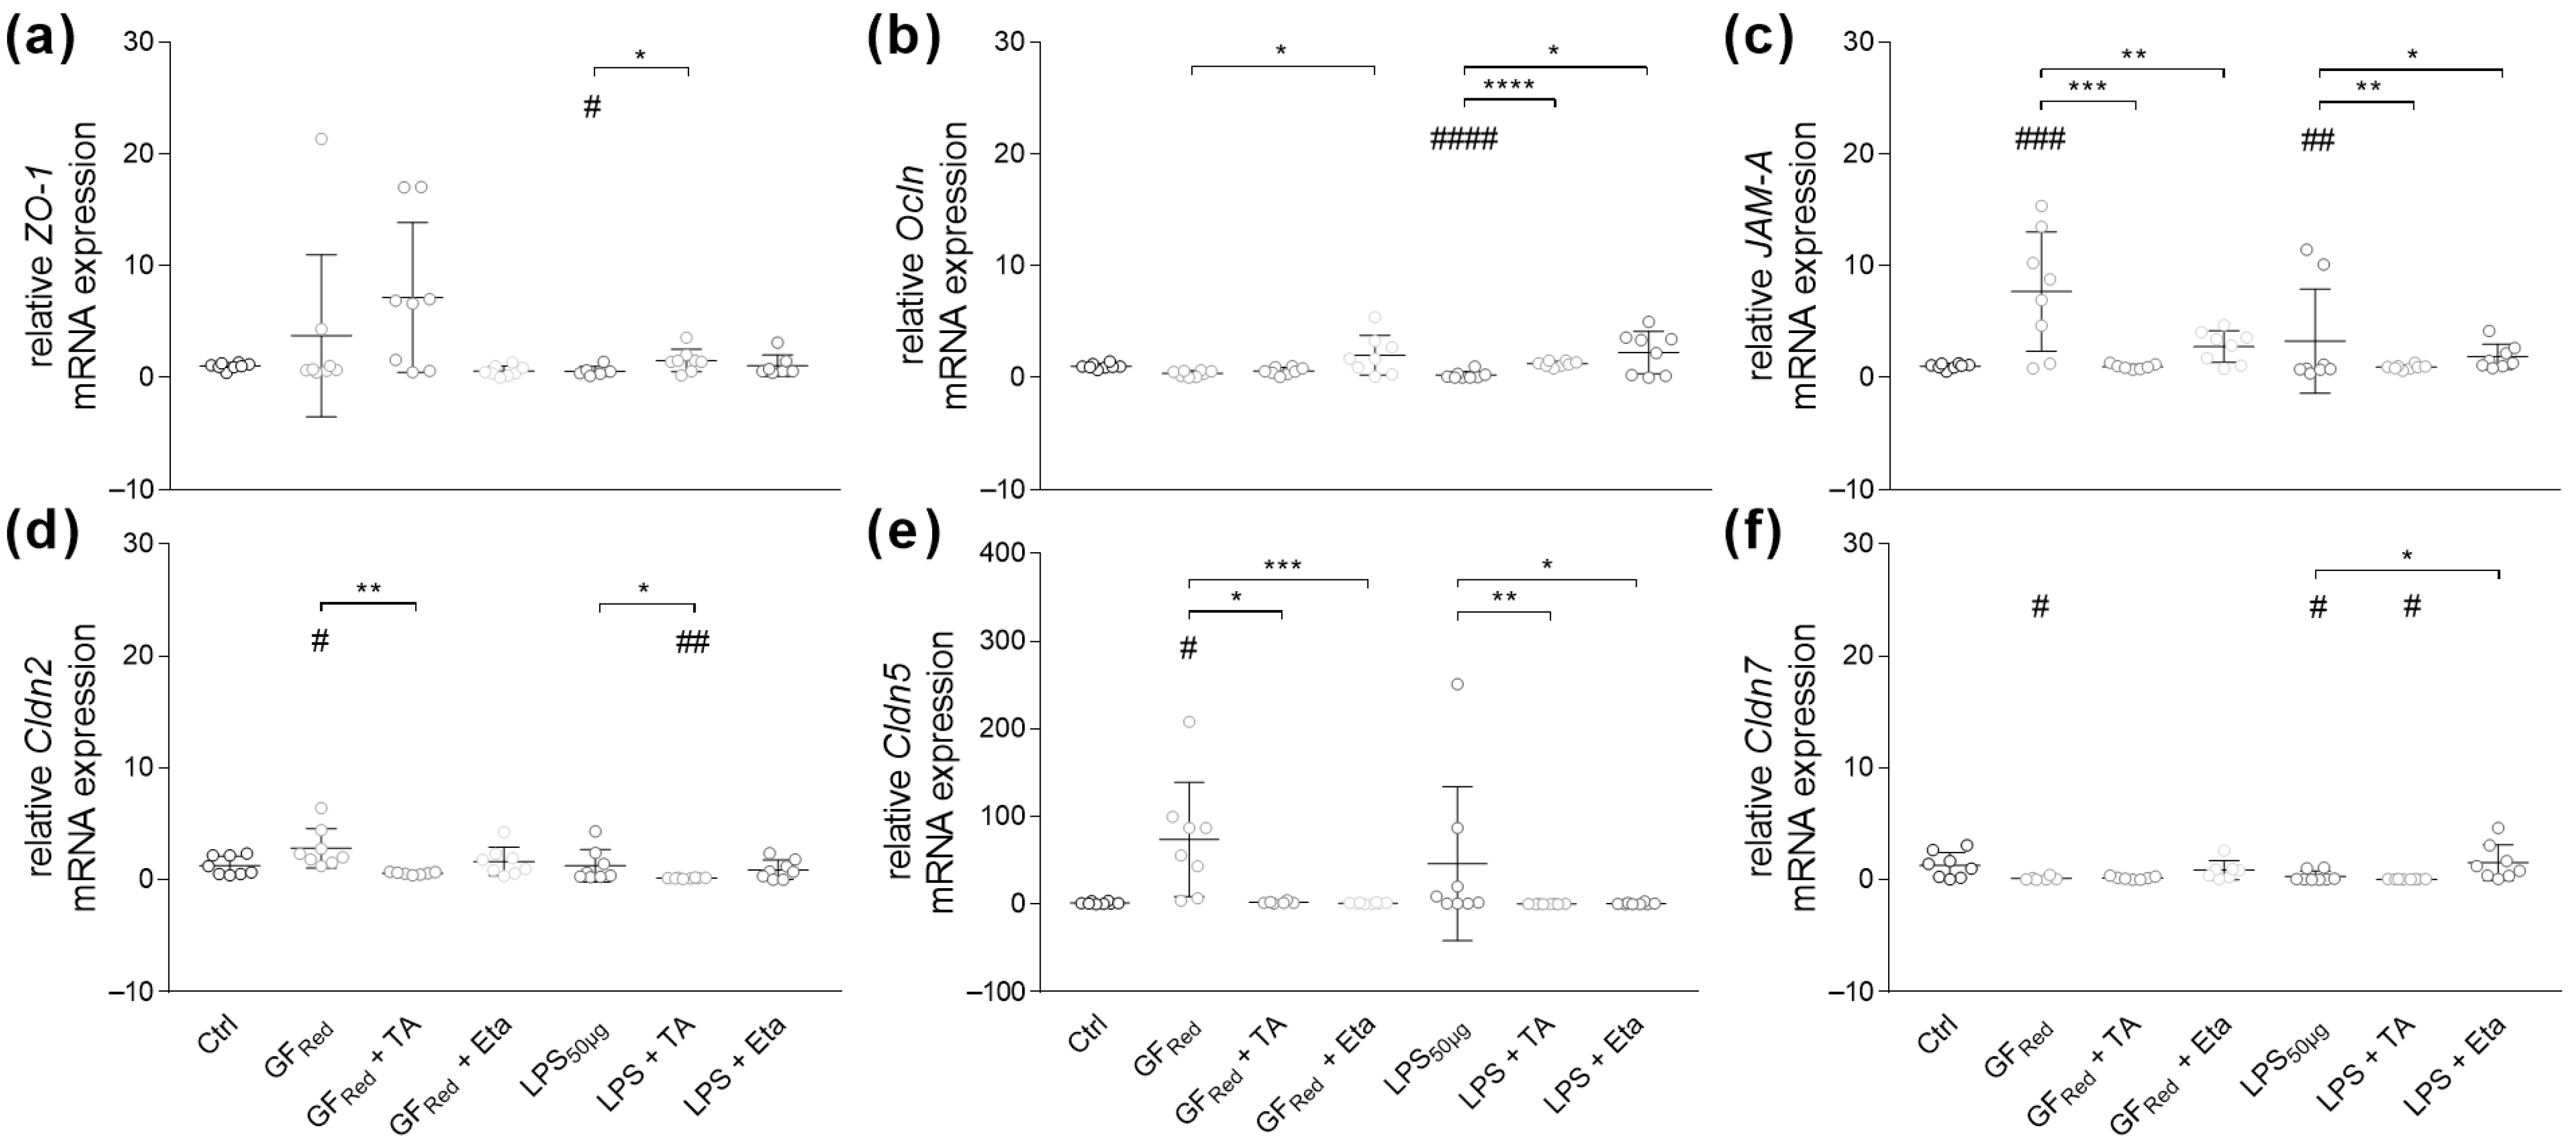
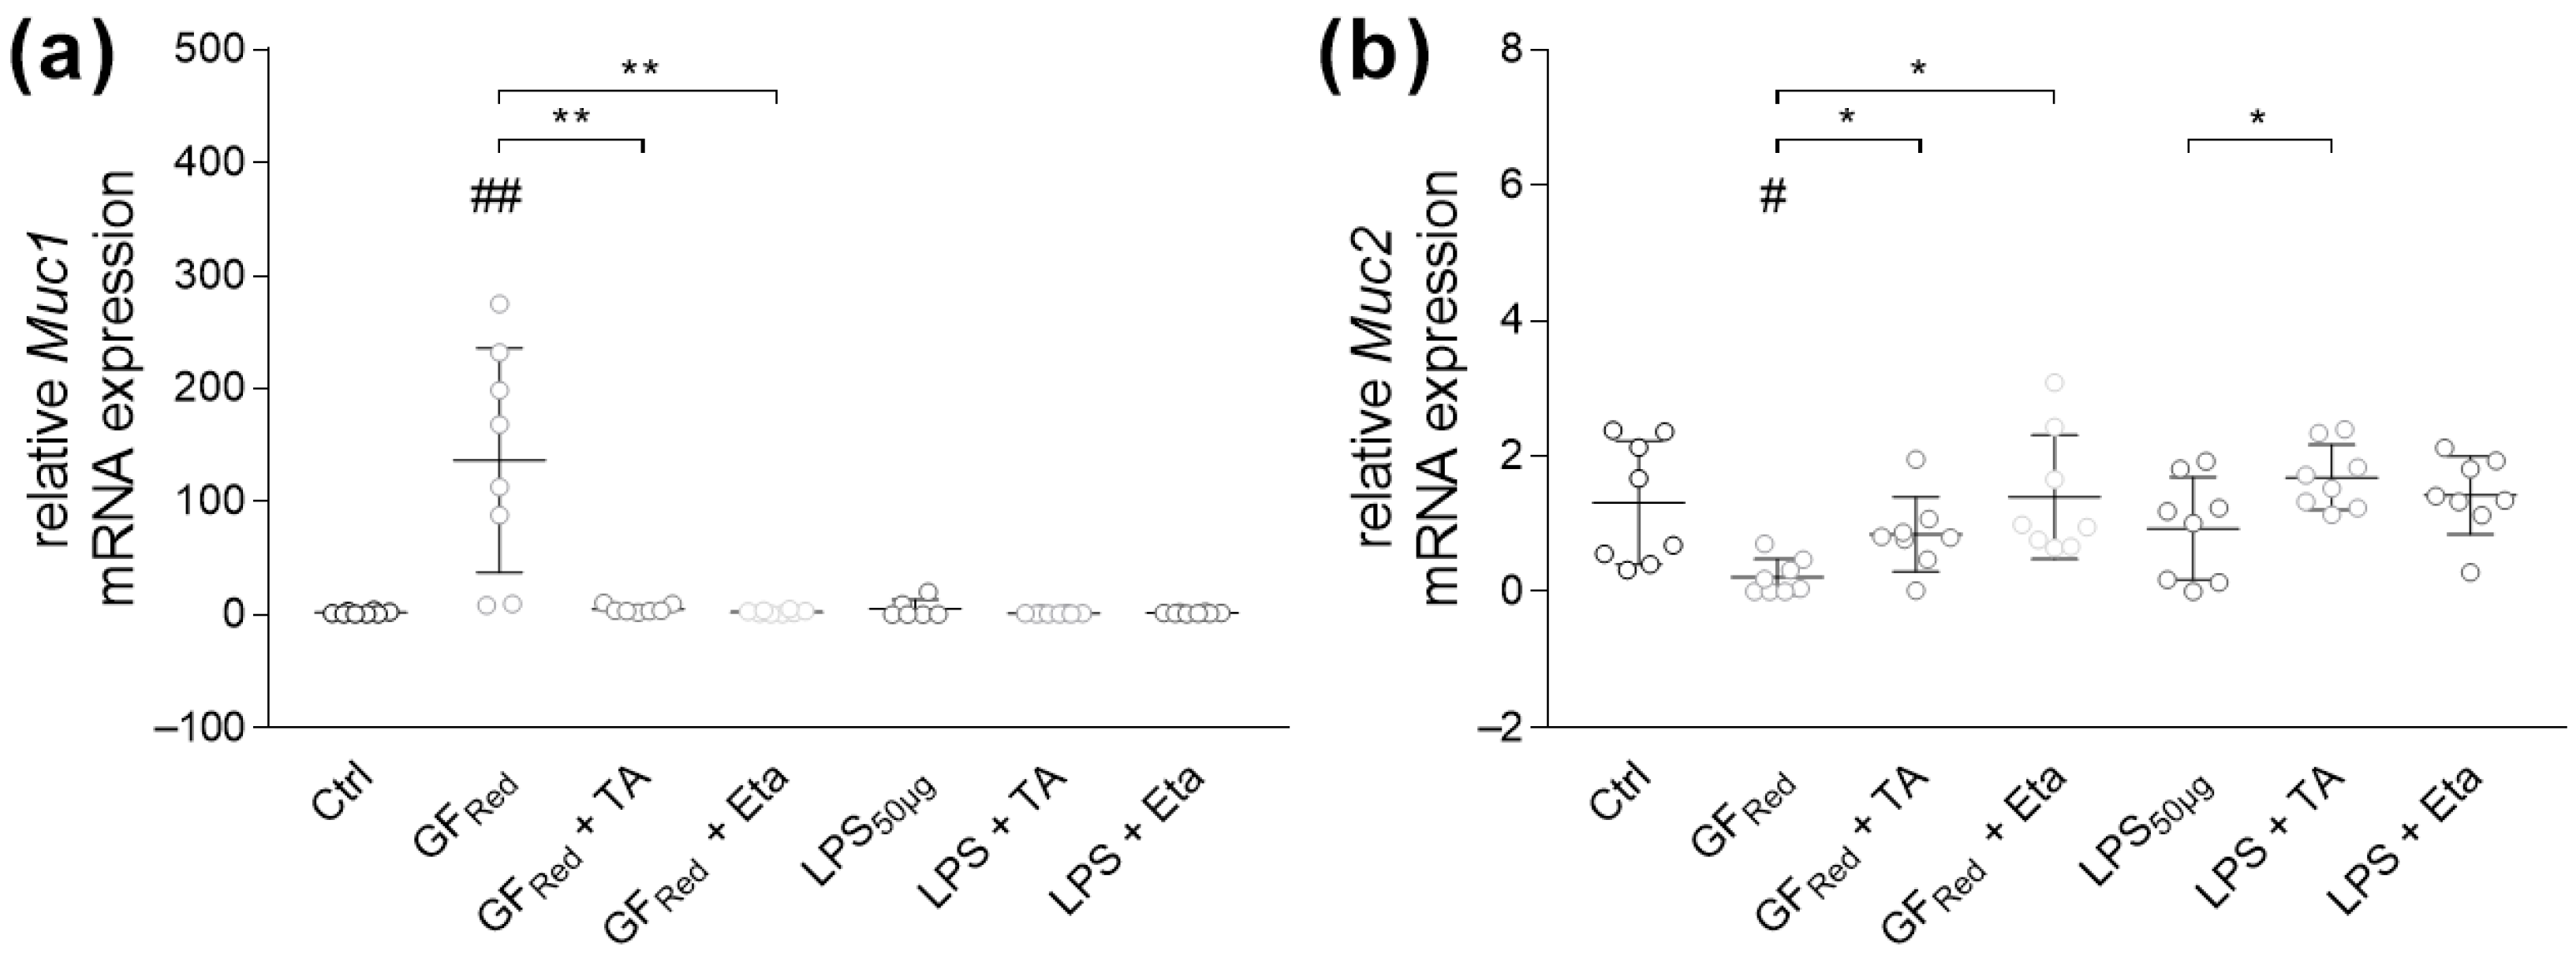
3.4. TA and Eta Attenuate GFRed- and LPS-Induced Gut Barrier Dysfunctions

3.4.1. Stimulation with TA and Eta Improve TJ and Muc Gene Expression in Stressed Organoids

Treating organoids with TA or Eta revealed no effects on TJ or AJ gene expression (Figure S2). However, LPS stimulation reduced ZO-1 mRNA expression (p < 0.05, Figure 3a). This effect was absent when organoids were exposed to TA (p < 0.05, Figure 3a). Consistently, stress induction by GFRed showed no effects on Ocln gene expression, whereas LPS decreased Ocln mRNA expression (p < 0.0001, Figure 3b). Additionally, these effects were no longer present when organoids were exposed to TA (p < 0.0001) or Eta (p < 0.05, Figure 3b). Stress induction by GFRed (p < 0.001) as well as by LPS (p < 0.01) resulted in an induction of JAM-A gene expression (Figure 3c), whereby concomitant stimulation with TA (p < 0.001) or Eta (p < 0.01) prevented GFRed-mediated effects (Figure 3c). Similarly, both TA (p < 0.01) and Eta (p < 0.05) were found to attenuate LPS-dependent changes in JAM-A gene expression (Figure 3c).
Our data revealed that stress induction by GFRed increased Cldn2, Cldn5 and decreased Cldn7 (p < 0.05) gene expression, whereas LPS exposure affected Cldn7 mRNA expression (p < 0.05, Figure 3d–f). Moreover, Cldn2 (p < 0.01) and Cldn5 (p < 0.05) gene expression was normalized when GFRed-treated organoids were additionally exposed to TA. Similarly, TA reduced gene expression of Cldn2 (p < 0.01) and Cldn5 (p < 0.01) in LPS-treated cells (Figure 3d,e). Moreover, stimulation with Eta improved Cldn5 expression (p < 0.001) in GFRed-treated organoids, as well as Cldn5 and Cldn7 expression (p < 0.05) in LPS-stimulated cells (Figure 3d–f).
Further examinations revealed that GFRed-induced stress was associated with an increase in Muc1 (p < 0.01) and a decrease in Muc2 mRNA expression (p < 0.05), whereas LPS had no effects (Figure 4a,b). Although organoids treated with TA exhibited increased Muc1 gene expression (p < 0.05, Figure S3), stimulation of GFRed-treated organoids with TA or Eta resulted in a reduction of stress-induced effects, which was characterized by a decrease in Muc1 (p < 0.01) and an increase in Muc2 (p < 0.05) gene expression (Figure 4a,b).

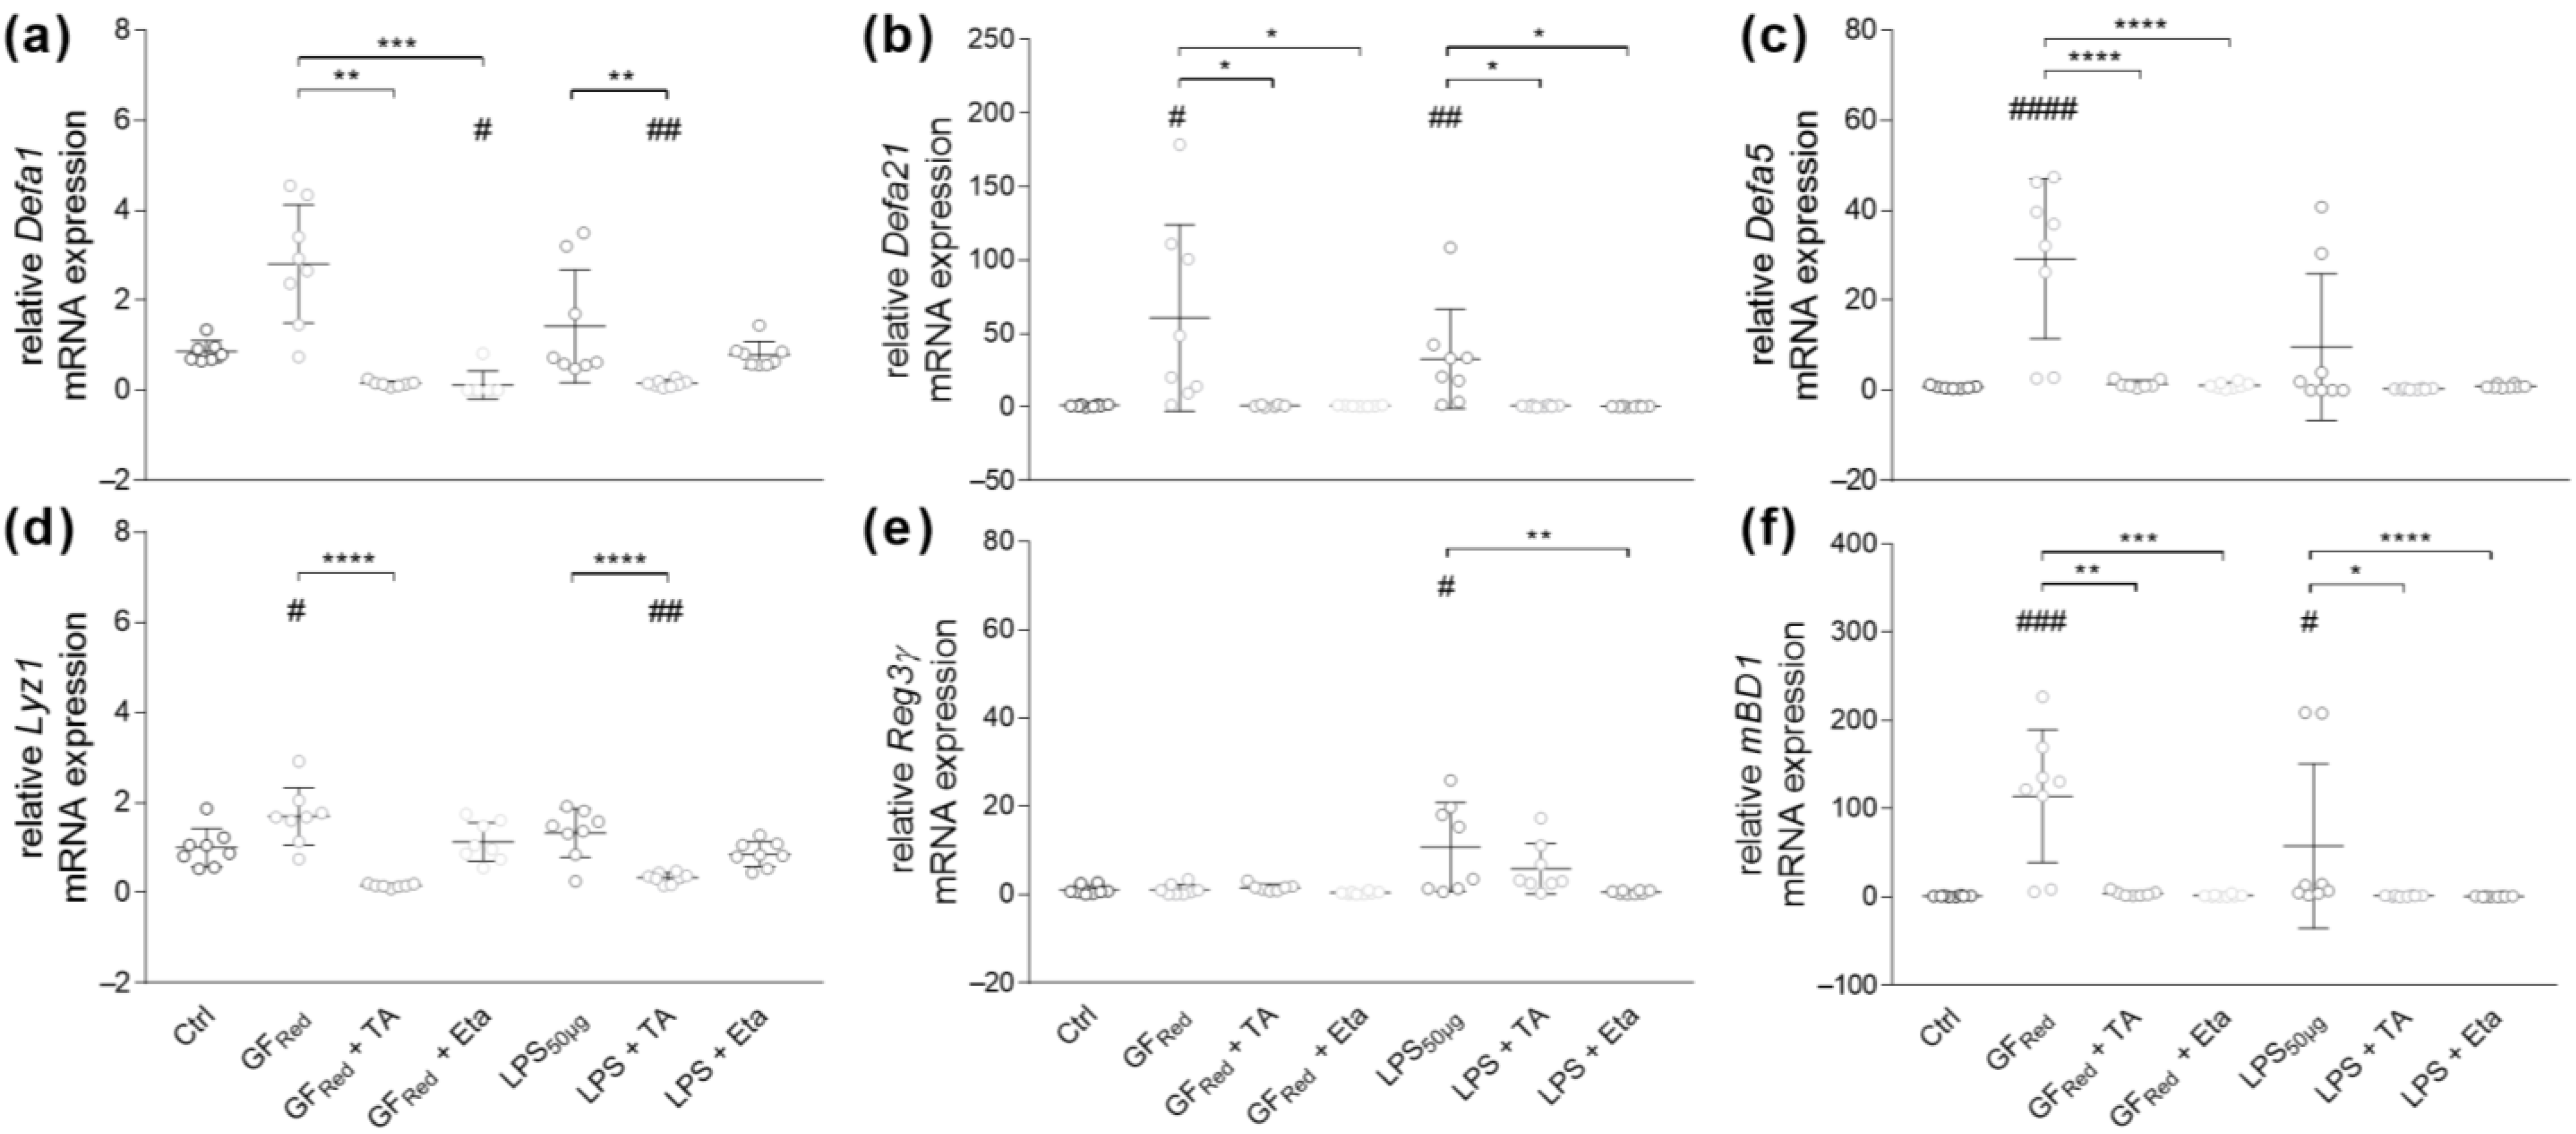
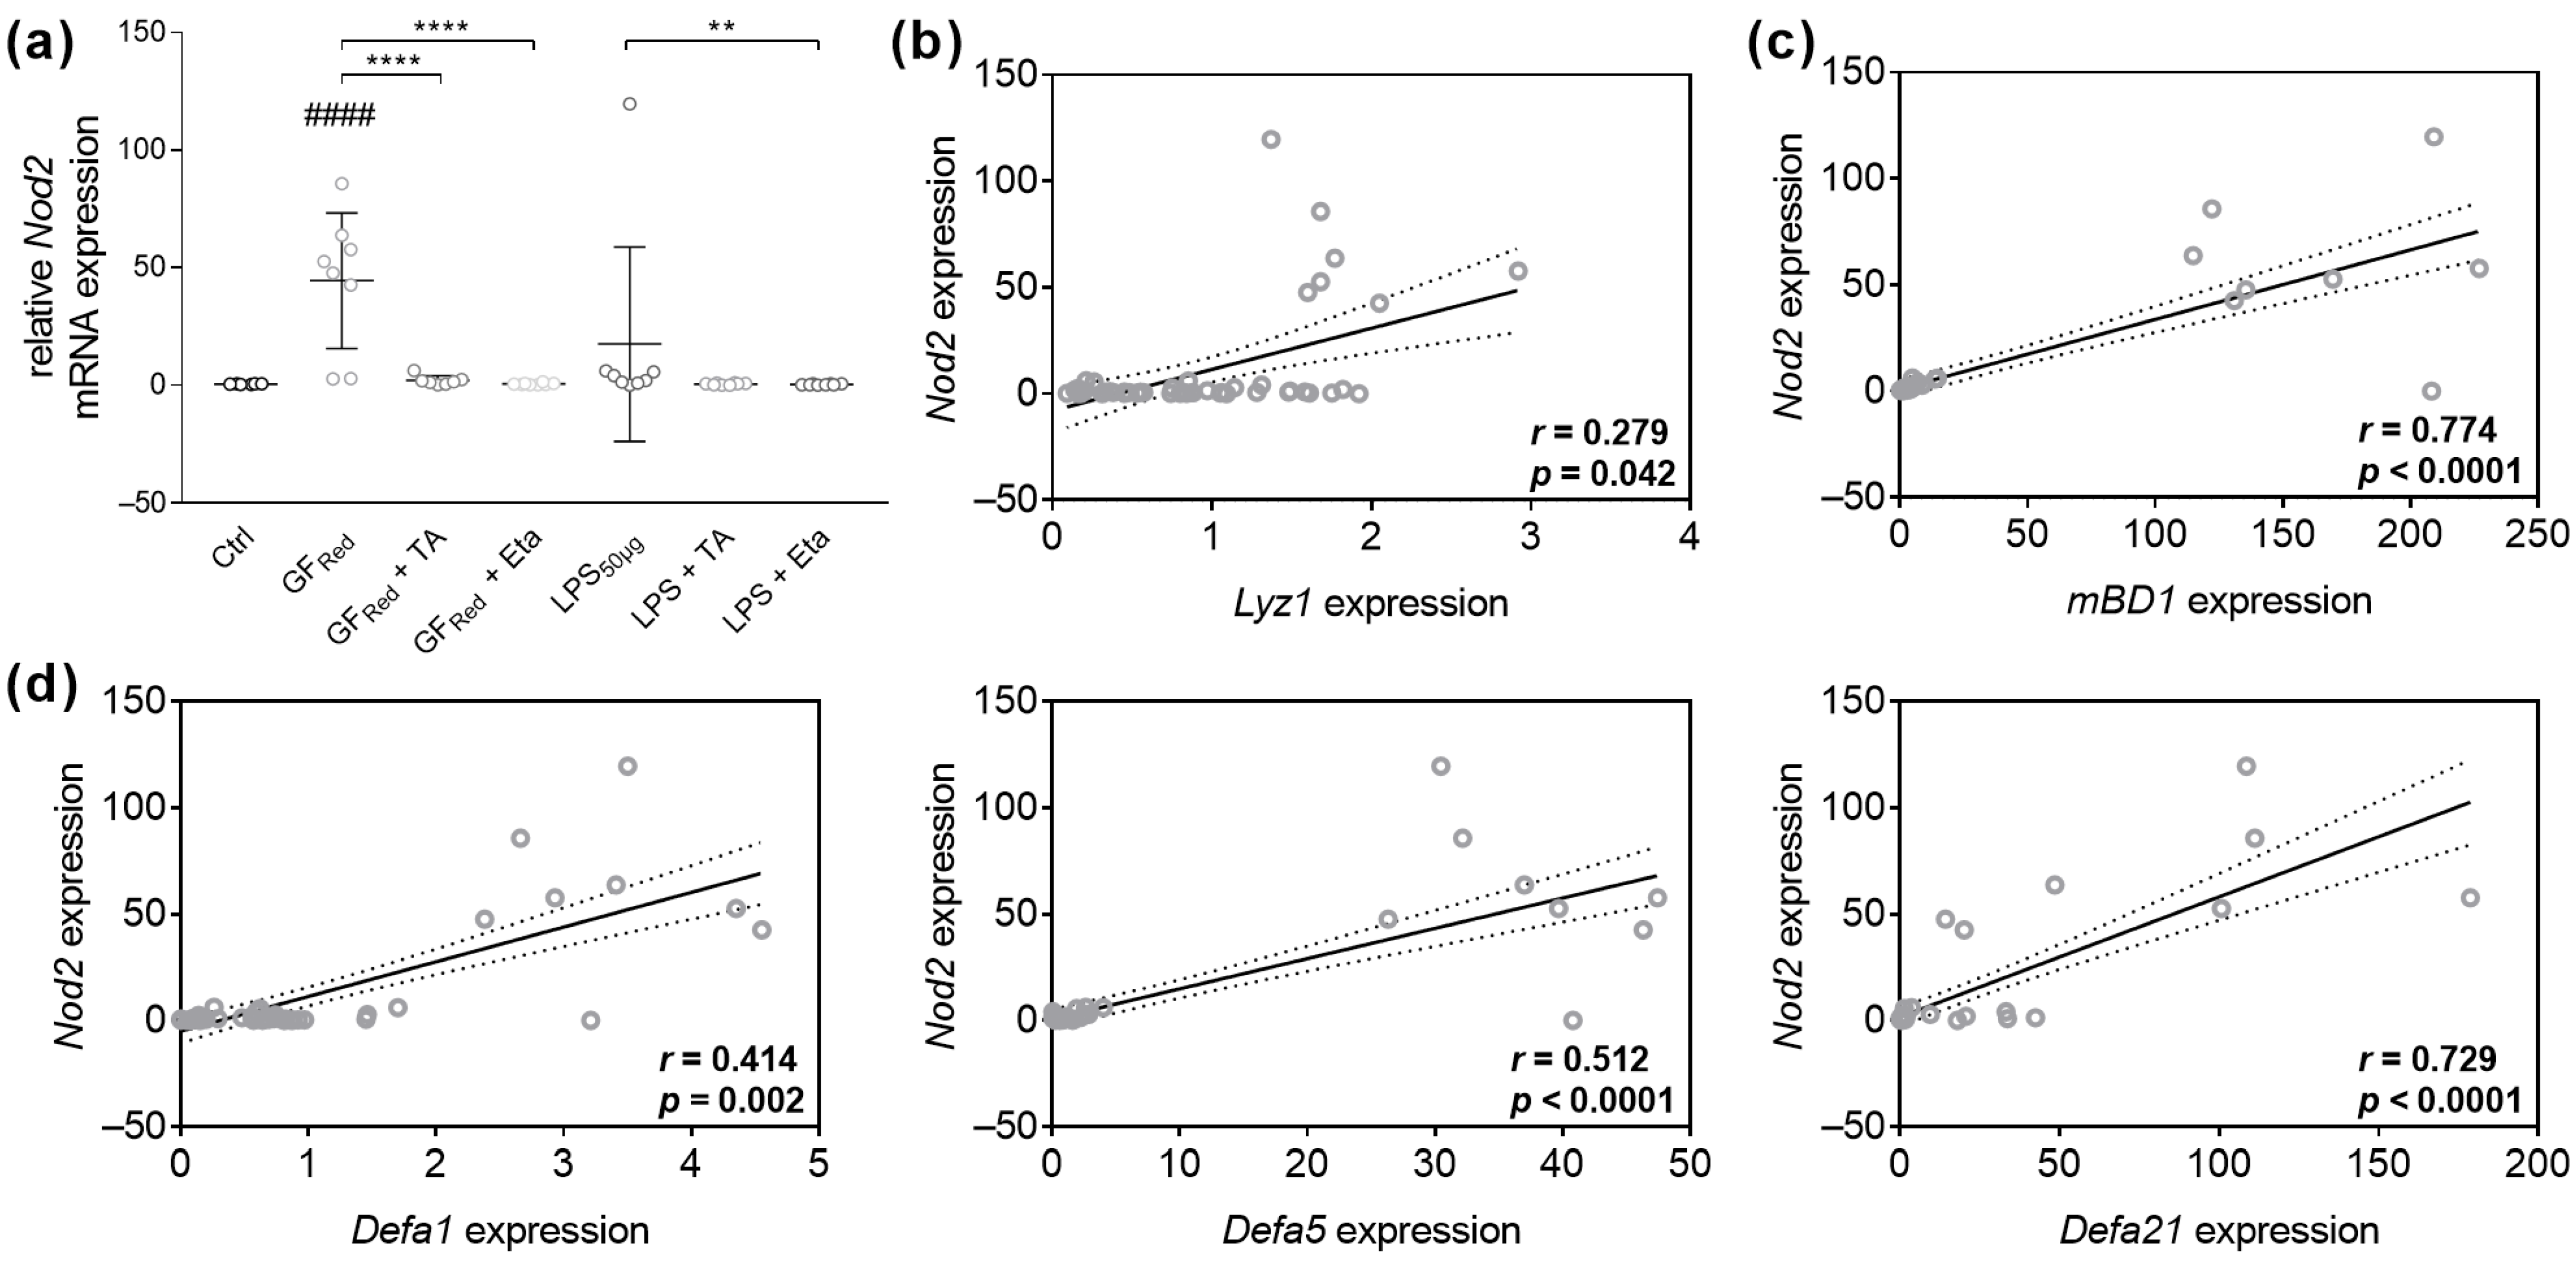
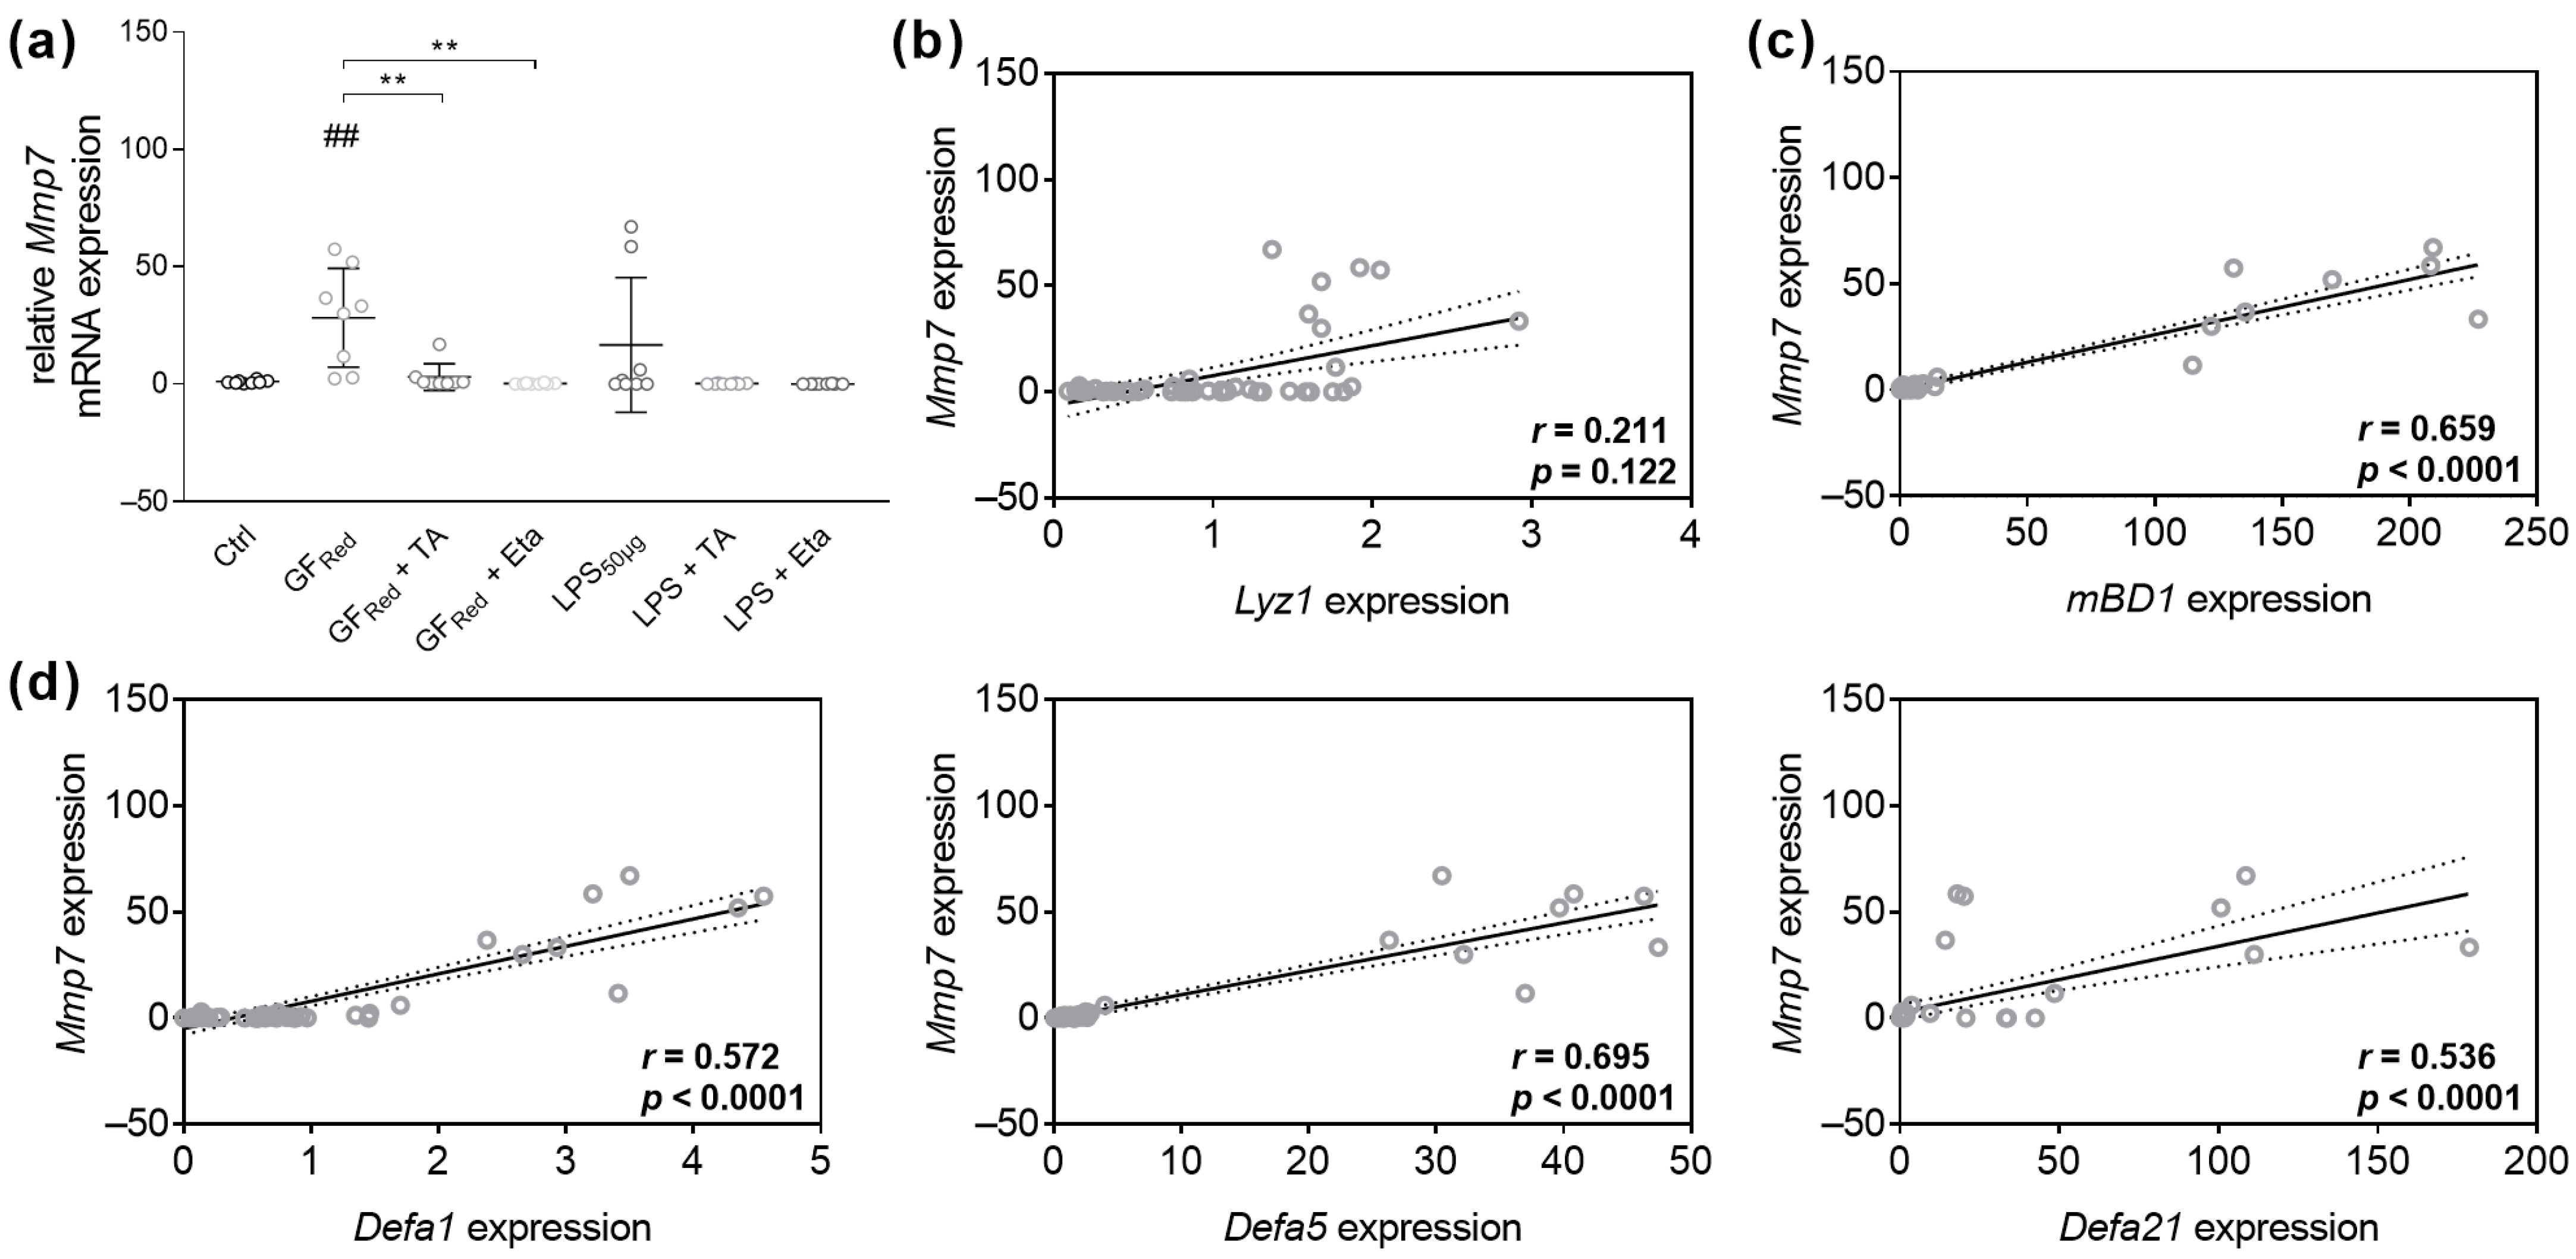
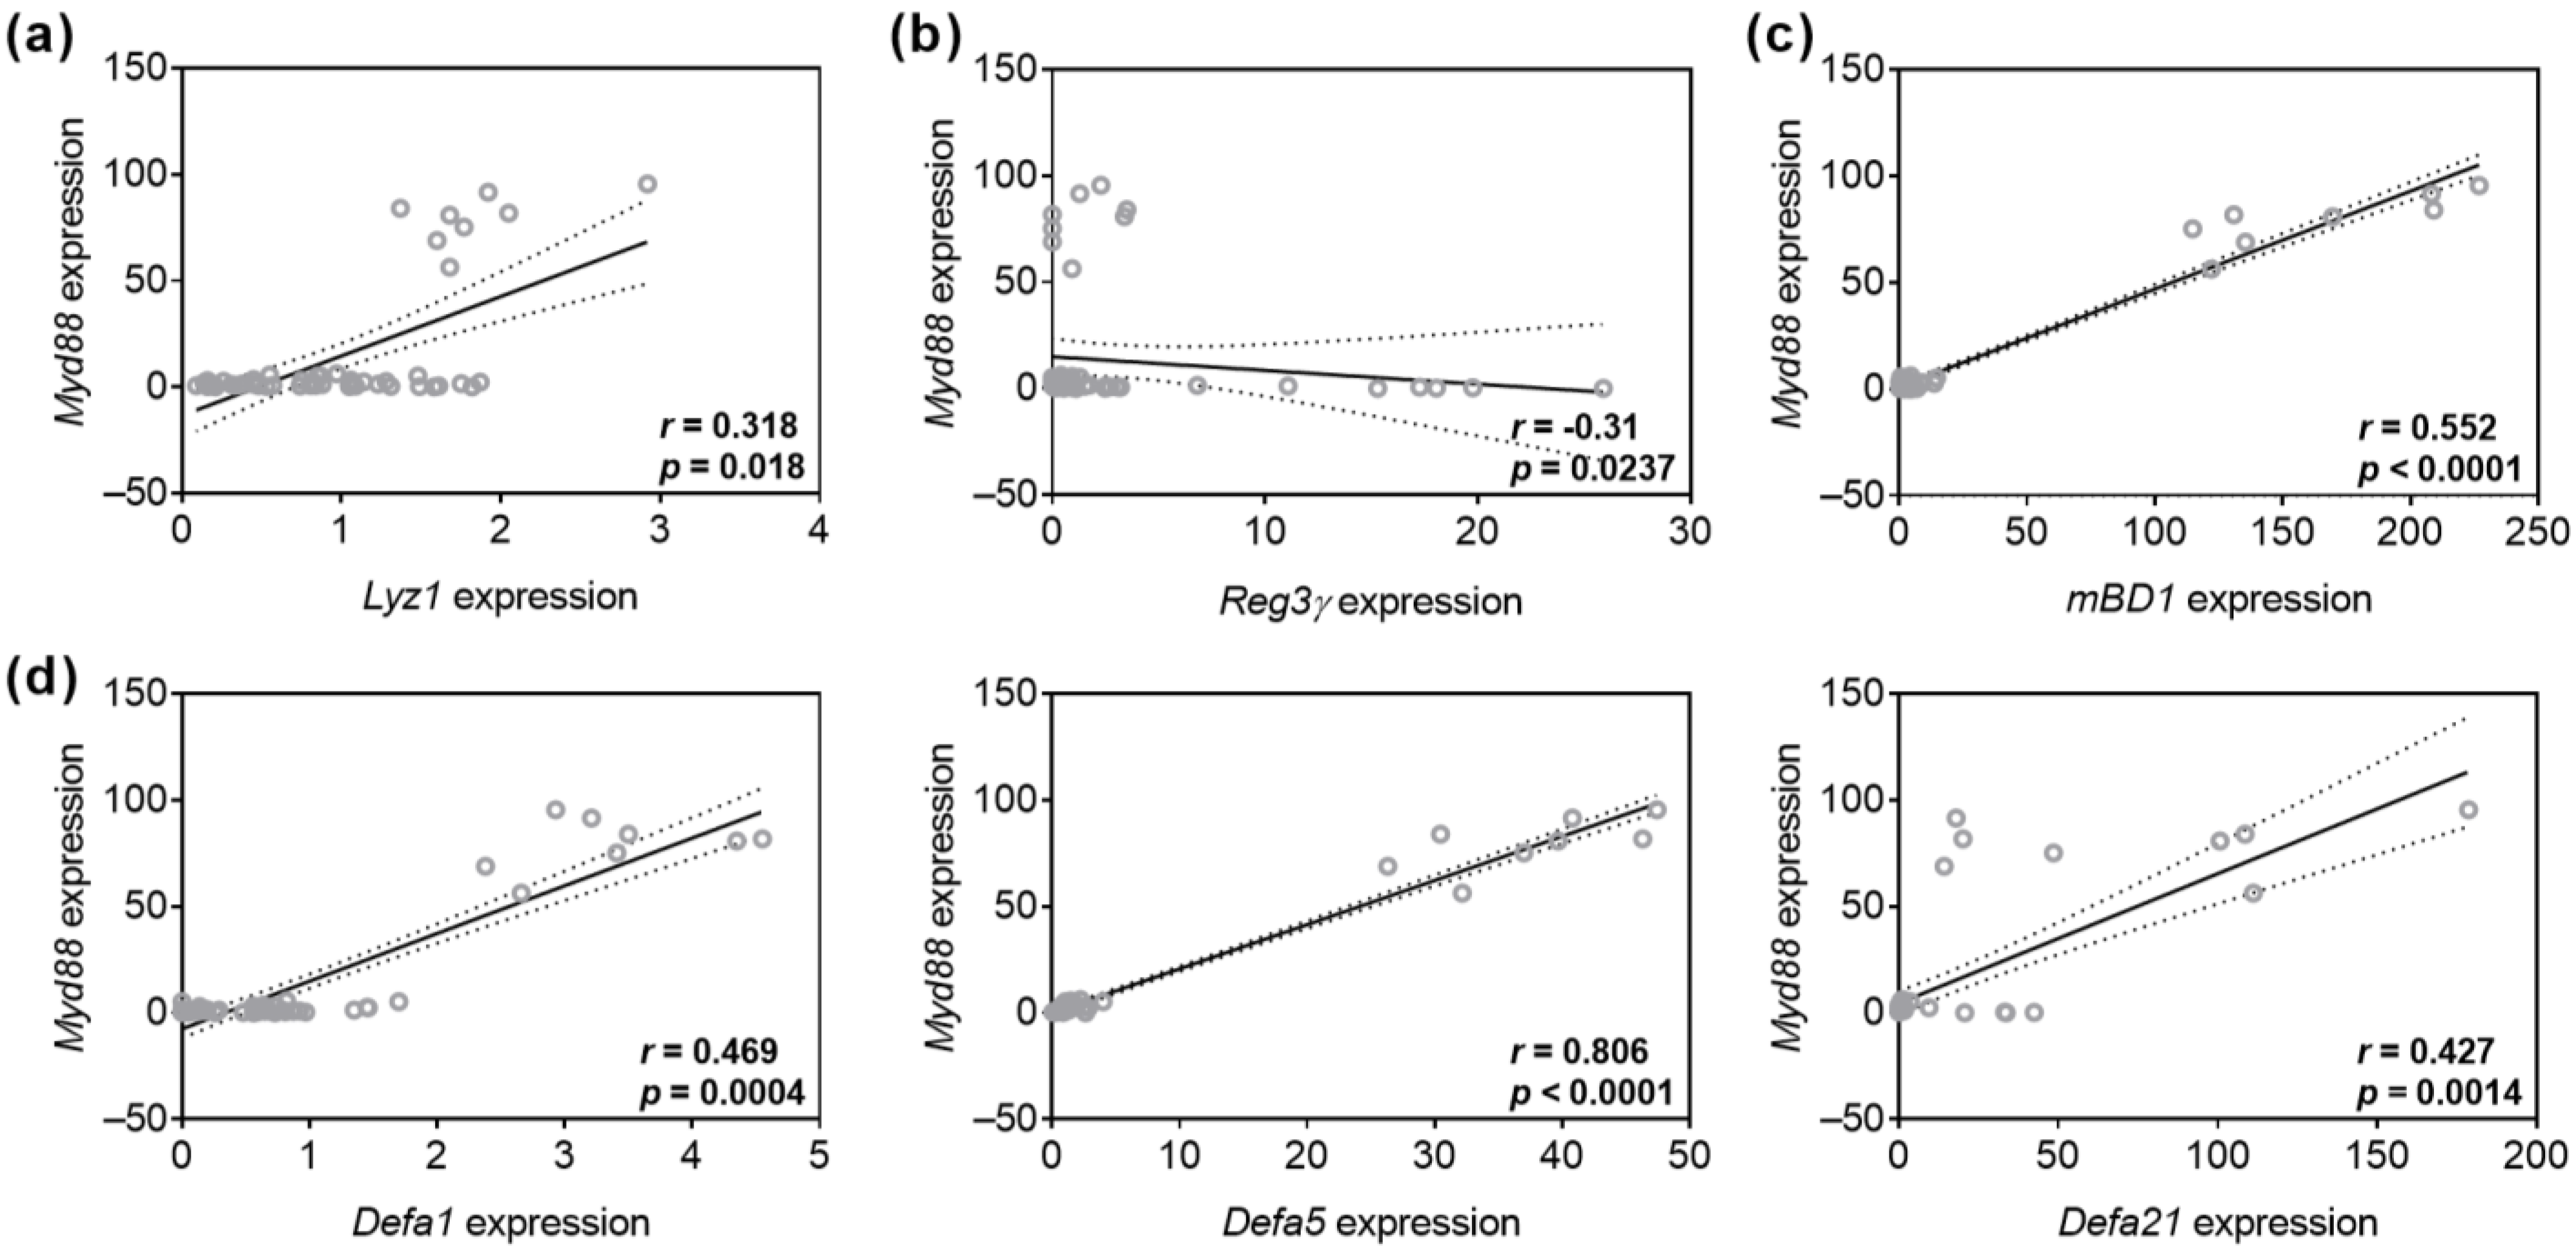
3.4.2. TA and Eta Regulate Antimicrobial Peptide Gene Expression in GFRed- and LPS-Treated Organoids

Since AMPs have been identified as an important intestinal defense strategy, we next evaluated AMP gene expression. Examinations revealed no effects of TA or Eta exposure in organoids on Defa1, Defa21, Defa5, Lyz1 or Reg3γ transcripts expression (Figure S4). Although GFRed-mediated stress did not affect Defa1 gene expression, GFRed-treated organoids exhibited increased Defa21 (p < 0.01) and Defa5 (p < 0.0001) gene expression (Figure 5a–c). Both Defa21 (p < 0.05) and Defa5 (p < 0.0001) expression were normalized when organoids were concomitantly exposed to TA or Eta (Figure 5b,c). Furthermore, LPS exposure resulted in an induction of Defa21 expression (p < 0.05, Figure 5b), whereas these effects were absent when organoids were co-exposed to TA (p < 0.05) or Eta (p < 0.05, Figure 5b). Analysis of other AMPs revealed that treatment of organoids with GFRed induced the expression of Lyz1 (p < 0.05) and mBD1 (p < 0.001). Similarly, LPS exposure was associated with an increase in Reg3γ and mBD1 gene expression (p < 0.05, Figure 5d–f). Although TA exposure increased mBD1 gene expression in organoids, co-stimulation of GFRed-treated organoids with TA reduced Lyz1 (p < 0.0001) and mBD1 gene expression (p < 0.01, Figure 5d,f). Further, treatment of LPS-stimulated organoids with both TA (p < 0.05) and Eta (p < 0.0001) decreased mRNA expression of mBD1. Furthermore, Reg3γ expression was normalized when organoids were co-exposed to Eta (p < 0.01, Figure 5e,f).
GFRed-mediated stress in organoids increased Nod2 mRNA expression (p < 0.0001), whereas LPS exposure had no effects (Figure 6a). Interestingly, co-stimulation of GFRed-treated organoids with TA or Eta was found to reduce Nod2 gene expression (p < 0.0001, Figure 6a), while exposure of organoids to TA or Eta revealed no effects on Nod2 gene expression (Figure S5). While Spearman rank correlation analysis revealed no correlation between Nod2 and Reg3γ (Figure S6), there was a weak positive correlation between Nod2 mRNA levels and Lyz1 gene expression (r = 0.279, p = 0.042, Figure 6b). Further, there was a moderate positive correlation between Nod2 and the expression of Defa1 (r = 0.414; p = 0.002), and Defa5 (r = 0.512; p < 0.0001, Figure 6d) and a strong positive correlation between the expression of Nod2 and mBD1 (r = 0.774; p < 0.0001) as well as Defa21 expression (r = 0.729; p < 0.0001, Figure 6c,d).
Additionally, measurements demonstrated that stress conditions caused by GFRed resulted in an increase of Mmp7 expression (p < 0.01), whereas this effect was absent when organoids were co-incubated with TA or Eta (p < 0.01). Further, organoids treated with Eta showed a reduction of Mmp7 transcript expression (p < 0.05, Figure S5). In contrast, no effects on Mmp7 expression were observed under LPS exposure (Figure 7a). We next performed Spearman rank correlation analysis. Examinations demonstrated a weak positive correlation between Mmp7 and Lyz1 gene expression (r = 0.211, p = 0.122, Figure 7b), as well as moderate positive correlation between Mmp7 and Defa1 (r = 0.572; p < 0.0001), and Defa21 (r = 0.536; p < 0.0001, Figure 7d). Moreover, we found a strong positive correlation between Mmp7 and mBD1 (r = 0.659; p < 0.0001) and Defa5 gene expression (r = 0.659; p < 0.0001, Figure 7c,d). However, no correlation was found between Mmp7 and Reg3γ (Figure S6).
As antimicrobial peptide defense has been linked with the TLR/Myd88 signaling pathway, we next analyzed potential associations between Myd88 and AMP mRNA expression. Examinations demonstrated a weak positive correlation between Myd88 and Lyz1 gene expression in small intestinal organoids (r = 0.318, p = 0.018, Figure 8a). Interestingly, there was a weak negative correlation between the expression of Myd88 and Reg3γ mRNA levels (r = −0.31, p = 0.0237, Figure 8b). We also identified a moderate positive correlation between Myd88 and mBD1 (r = 0.552; p < 0.0001, Figure 8c), Defa1 (r = 0.469; p = 0.0004), and Defa21 gene expression (r = 0.427, p = 0.0014, Figure 8d). Moreover, analysis revealed a very strong positive correlation between Myd88 and Defa5 expression (r = 0.806; p < 0.0001, Figure 8d).

4. Discussion

The present study provides evidence that both TA and Eta improve stress-induced GI barrier dysfunctions, especially by reducing inflammatory cytokine transcripts expression in organoids. These effects were accompanied by an improved TJ, AJ and Muc expression and by a normalized Nod2-, Myd88-, and Mmp7-dependent activation of antimicrobial peptide gene expression. Further, our data also show that exposure to LPS, as well as reducing CCM growth factors R-Spondin and noggin, both regulating the Wnt signaling pathway, is appropriate to induce stress reactions in murine small intestinal organoids.
We were able to show that TA and Eta at selected doses reduced GFRed-mediated induction of inflammatory cytokine transcripts expression, indicating anti-inflammatory activity of both substrates. Tannacomp® is a pharmaceutical drug that is commonly used for treating and preventing diarrhea. While its primary effects are derived from antimicrobial and astringent properties [7,36,37], there is evidence that Tannacomp®, especially its component TA, might also have anti-inflammatory effects [6]. Our data revealed that stimulation of murine small intestinal organoids with TA inhibited stress-mediated induction of Myd88, Tnfα, IL-6 and IL-1β gene expression. This is in accordance with the results of further studies. Consistently, stimulation of LPS-treated Caco-2 cells with gelatin tannate, a combination of TA and gelatin, resulted in a dose-dependent inhibition of IL-8 and TNF-α release, as well as a decrease of intercellular adhesion molecule-1 gene expression [38]. In addition, TA treatment of LPS-stimulated BV2 microglial cells resulted in a reduction of IL-6, IL-1β and TNF-α protein levels by suppressing the nuclear factor kappa-light-chain-enhancer of activated B-cells (NF-κB) signaling pathway, indicating anti-neuroinflammatory effects [39]. Similarly, TA was found to specifically inhibit CXC motif chemokine 12 (CXCL12)-induced migration of human monocytes as well as CXCL12 binding to THP-1 cells and CXCL12-induced migration of MDA-231 breast tumor cells in vitro, providing a possible underlying mechanism for its reported anti-inflammatory activity [40]. Accordingly, oral TA treatment of mice with ethanol-induced and ethanol/HCl-induced gastric ulcers exhibited gastroprotective effects, which were associated with a decrease in TNF-α, IL-1β and IL-6 protein levels and an increase in IL-10 protein levels in gastric tissue. Further potassium channels and production of sulfhydryl compounds, nitric oxide (NO), and prostaglandin E2 (PGE2) were involved in these effects [41]. TA has been found to exhibit a potential role in IL-1β-related diseases, such as osteoarthritis (OA), by preventing IL-1β–IL-1R1 interactions and inhibiting IL-1β-induced expression of IL-6, Tnfα, and PGE2, as well as IL-1β-induced mitogen-activated protein kinases (MAPK) and NF-κB activation in human OA chondrocytes. In addition, TA reduced pain, cartilage degradation, and IL-1β-mediated inflammation in a monosodium iodoacetamide-induced OA model in rats [42].
We demonstrated for the first time that Eta downregulates mRNA expression of proinflammatory markers such as Myd88, Tnfα, IL-6 and IL-1β in small intestinal organoids. There is evidence that Eta indirectly reduced inflammatory reactions caused by bacterial toxins through its antibacterial and antiseptic effects. While studies of antibiotic susceptibility and bactericidal time revealed only moderate activity of Eta against Pseudomonas aeruginosa [43], antibacterial efficacy of two-dimensional graphene-based nanocarriers loaded with sulfamethoxazole and Eta against several Gram-negative and -positive bacterial isolates has been reported [7]. Thus, Eta nanoformulation exhibited bactericidal activities against Escherichia coli K1, Serratia marcescens, Pseudomonas aeruginosa and Salmonella enterica and showed less toxic effects against human cells [7]. Furthermore, a recent study indicated that Eta provided antiviral activity and could be a potential inhibitor of SARS-CoV-2, as Eta inactivated virus particles in human primary nasal epithelial cells [44].
Our results revealed that TA and Eta attenuated TJ and AJ expression and normalized mucus transcripts expression in murine small intestinal organoids exposed to stress conditions. In accordance with our results, oral TA administration in an oxidative stress mouse model improved jejunal villus height and crypt depth. In addition, TA modulated the GI barrier by inhibiting jejunal claudin and inducing ZO-1 mRNA expression [8]. Comparable effects were observed in a rat diarrhea model with 10 days of oral TA treatment, resulting in a preservation of intestinal mucosal structure and ZO-1 protein formation, as well as in a selective decrease of interferon-γ (INF-γ) and transforming growth factor-beta [33]. TA further improves mucosal resistance. Thus, rats infected with Salmonella enteritidis showed reduced infection-related diarrhea and improved intestinal permeability, measured by permeability marker chromium-EDTA, when given additional TA through diet [45]. Furthermore, feeding weaned piglets with TA induced jejunal protein expression of ZO-1, while in vitro experiments additionally revealed that TA attenuated oxidative stress in IPEC-J2 cells by upregulating ZO-1, Ocln, and Cldn1 mRNA and protein expression, thereby enhancing transepithelial electrical resistance [46].
While modulatory effects of TA on GI barrier function have already been described, our data further indicate that Eta also exhibited regulatory effects on the GI barrier through modulating TJ, AJ and Muc gene expression. This might be a result of its anti-inflammatory effects. There is evidence that increased inflammatory responses affected intestinal integrity. Thus, a mouse study revealed that claudin-5 expression was JAM-A-dependent regulated via CCAAT/enhancer-binding protein-α, thereby disturbing endothelial permeability [47]. Further, immune signals, including IL-13 and IL-22, led to increased transcription and expression of pore-forming Cldn2, thereby increasing pore pathway permeability and water influx into the intestinal lumen [48]. Similarly, Citrobacter rodentium-infected mice exhibited increased permeability, which was associated with IL-22-dependent upregulation of claudin-2 protein expression in the colon [49]. It has been demonstrated that Muc1 gene expression was also induced by proinflammatory cytokines such as TNF-α, IL-6, IL-1β and IL-22 during inflammatory processes [50], indicating a key role for host pathogen defenses during infections [51].
Further, we demonstrated that organoid cell stress caused by GFRed led to Nod2-, Myd88-, and Mmp7-mediated induction of AMP gene expression, whereas both TA and Eta stimulation were found to normalize antimicrobial peptide expression. TA and Eta have been described as having antimicrobial activity against bacteria and viruses. In vitro, TA inhibited sporulation, toxin production and biofilm formation of Clostridium difficile (C. difficile) and improved survival and IL-10 serum levels in C. difficile-infected C57BL/6N mice [52]. TA was also found to inhibit the growth of intestinal bacteria, including Clostridium spp., Salmonella, Bacteroides, Enterobacter, Lactobacillus [53], and to be antibacterial against Staphylococcus aureus in vitro [54,55,56]. Similarly, an Eta nanoformulation exhibited antibacterial activity against Escherichia coli K1, Serratia marcescens, Pseudomonas aeruginosa and Salmonella enterica, as well as against Gram-positive bacteria including Bacillus cereus, Streptococcus pyogenes and Streptococcus pneumoniae in vitro [7]. There is evidence that TA could be a potential candidate for treating norovirus infections and for SARS-CoV-2 viruses, as TA inhibited the entry of SARS-CoV-2 pseudovirus into human hACE2 and Vero E6 cells [57,58]. Several mechanisms have been discussed as potentially involved in TA- and Eta-dependent antimicrobial effects. In addition, there is evidence that TA exhibited the ability to bind through bacterial cell wall peptidoglycan, thus resulting in impaired integrity, but also possibly inhibited efflux pumps, thereby blocking efflux of tetracycline in Staphylococcus aureus IS-58 and erythromycin in Staphylococcus aureus RN4220 [56,59].

5. Conclusions

In conclusion, our data demonstrated that both TA (0.01 mg/mL) and Eta (0.002 mg/mL) were appropriate for use in murine small intestinal organoids. We were also able to implement a novel method to induce organoid stress responses by reducing CCM growth factors R-Spondin and noggin (GFRed). Both TA and Eta stimulation exerted anti-inflammatory effects by reducing gene expression of several inflammatory markers. Moreover, stimulation with TA and Eta improved stress-induced disturbances of TJ, AJ and Muc gene expression and normalized Nod2-, Myd88-, and Mmp7-mediated induction of antimicrobial peptide transcripts expression. Overall, our results provide new evidence that both TA and Eta modulate inflammatory processes and GI barrier function, suggesting that these components might be useful for therapeutic strategies to improve gut barrier function and host defense against GI-infectious diseases.

Supplementary Materials

The following supporting information can be downloaded at: https://www.mdpi.com/article/10.3390/biom15050650/s1, Figure S1: Exposure of organoids to TA or Eta has no effects on proinflammatory cytokine transcripts expression; Figure S2: Exposure of organoids to TA increased Cldn5 gene expression; Figure S3. Exposure of organoids to TA increased Muc1 gene expression; Figure S4: TA exposure is associated with increased mBD1 gene expression; Figure S5: Eta exposure is associated with decreased Mmp7 gene expression; Figure S6: Correlation analysis for Nod2 (a) or Mmp7 (b) and Reg3γ mRNA expression; Table S1: Primers used for RT-PCR; Table S2: Optical density measured by MTT assay for calculating ED50 and ED100 for TA and Eta.

Author Contributions

Conceptualization, S.C.B., L.F.R., N.R. and S.G.; methodology, L.F.R.; investigation, L.F.R.; data curation, L.F.R., S.G. and S.C.B.; writing—original draft preparation, L.F.R.; writing—review and editing, L.F.R., S.G. and S.C.B.; funding acquisition, S.C.B. All authors have read and agreed to the published version of the manuscript.

Funding

This research was funded by MEDICE Arzneimittel Pütter GmbH & Co KG.

Institutional Review Board Statement

The animal study protocol was approved by the animal welfare officer of the University of Hohenheim, permit number: T202/21, approval date 5 April 2021.

Informed Consent Statement

Not applicable.

Data Availability Statement

The data presented in this study are available upon justified request to the corresponding author.

Conflicts of Interest

The present study was funded by MEDICE Arzneimittel Pütter GmbH & Co. KG, who supported the design of the study, writing of the manuscript and decided to publish the results. S.G. and N.R. are employed at MEDICE Arzneimittel Pütter GmbH & Co. KG.

Abbreviations

The following abbreviations are used in this manuscript:
EtaEthacridine lactate
TATannic acid
LPSLipopolysaccharide
GFRedCCM with reduced growth factors
GIGastrointestinal
TJTight junction
AJAdherent junction
IBDInflammatory bowel disease
CDCrohn’s disease
OclnOccludin
ZO-1Zonula occludens 1
CldnClaudin
AMPAntimicrobial Peptide
TLRToll-like receptor
SCFAShort-chain fatty acid
CIBCrypt isolation buffer
CCMCell culture medium
ILInterleukin
Defaα-defensin
mBD1Murine β-defensin 1
Lyz1Lysozyme
Reg3γRegenerating islet-derived protein 3 gamma
Mmp7Matrix metalloproteinase-7
JAM-AJunctional adhesion molecule A
MucMucin
Myd88Myeloid differentiation primary response 88
TnfαTumor necrosis factor α
ANOVAOne-way analysis of variance
SEMStandard error of the mean
CtrlPBSO control
NF-κBNuclear factor kappa-light-chain-enhancer of activated B-cells ()
CXCL12CXC motif chemokine 12
NONitric oxide
PGE2Prostaglandin 2
OAOsteoarthritis
MAPKMitogen-activated protein kinases
INF-γInterferon-γ
HCNHepatitis C virus

References

  1. Salama-Müller, A.; Roese, N. Antidiarrheal Properties of the Combination of Tannin Albuminate and Ethacridine Lactate—A Narrative Review. Nat. Prod. Commun. 2023, 18, 1934578X2311709. [Google Scholar] [CrossRef]
  2. Ziegenhagen, D.J.; Raedsch, R.; Kruis, W. Reisediarrhö in der Türkei. Prospektiv randomisierter Therapievergleich Kohle versus Tanninalbuminat/Ethacridinlactat. Med. Klin. 1992, 87, 637–639. [Google Scholar] [PubMed]
  3. Raedsch, R.; Walter-Sack, I.; Galle, P.R.; Kommerell, B. Prophylaxis of traveler’s diarrhea in Egypt: Results of a double blind controlled study. Klin. Wochenschr. 1991, 69, 863–866. [Google Scholar] [CrossRef] [PubMed]
  4. Elham, A.; Arken, M.; Kalimanjan, G.; Arkin, A.; Iminjan, M. A review of the phytochemical, pharmacological, pharmacokinetic, and toxicological evaluation of Quercus Infectoria galls. J. Ethnopharmacol. 2021, 273, 113592. [Google Scholar] [CrossRef]
  5. Adamczyk, B.; Simon, J.; Kitunen, V.; Adamczyk, S.; Smolander, A. Tannins and Their Complex Interaction with Different Organic Nitrogen Compounds and Enzymes: Old Paradigms versus Recent Advances. ChemistryOpen 2017, 6, 610–614. [Google Scholar] [CrossRef]
  6. Hamiza, O.O.; Rehman, M.U.; Tahir, M.; Khan, R.; Khan, A.Q.; Lateef, A.; Ali, F.; Sultana, S. Amelioration of 1,2 Dimethylhydrazine (DMH) induced colon oxidative stress, inflammation and tumor promotion response by tannic acid in Wistar rats. Asian Pac. J. Cancer Prev. 2012, 13, 4393–4402. [Google Scholar] [CrossRef]
  7. Jabri, T.; Khan, N.A.; Makhlouf, Z.; Akbar, N.; Gul, J.; Shah, M.R.; Siddiqui, R. Antibacterial Properties of Ethacridine Lactate and Sulfmethoxazole Loaded Functionalized Graphene Oxide Nanocomposites. Antibiotics 2023, 12, 755. [Google Scholar] [CrossRef]
  8. Wang, M.; Huang, H.; Liu, S.; Zhuang, Y.; Yang, H.; Li, Y.; Chen, S.; Wang, L.; Yin, L.; Yao, Y.; et al. Tannic acid modulates intestinal barrier functions associated with intestinal morphology, antioxidative activity, and intestinal tight junction in a diquat-induced mouse model. RSC Adv. 2019, 9, 31988–31998. [Google Scholar] [CrossRef]
  9. Wang, K.; Ding, Y.; Xu, C.; Hao, M.; Li, H.; Ding, L. Cldn-7 deficiency promotes experimental colitis and associated carcinogenesis by regulating intestinal epithelial integrity. Oncoimmunology 2021, 10, 1923910. [Google Scholar] [CrossRef]
  10. Yin, W.; Liu, M.; Jin, Z.; Hao, Z.; Liu, C.; Liu, J.; Liu, H.; Zheng, M.; Cai, D. Ameliorative effects of insoluble dietary fiber and its bound polyphenols from adzuki bean seed coat on acute murine colitis induced by DSS: The inflammatory response, intestinal barrier and gut microbiota. Int. J. Biol. Macromol. 2025, 286, 138343. [Google Scholar] [CrossRef]
  11. Park, J.Y.; Park, K.H.; Oh, T.Y.; Hong, S.P.; Jeon, T.J.; Kim, C.H.; Park, S.W.; Chung, J.B.; Song, S.Y.; Bang, S. Up-regulated claudin 7 expression in intestinal-type gastric carcinoma. Oncol. Rep. 2007, 18, 377–382. [Google Scholar] [CrossRef] [PubMed]
  12. Chen, L.; Tang, J.; Xia, Y.; Wang, J.; Xia, L.-N. Mechanistic study of the effect of a high-salt diet on the intestinal barrier. Sci. Rep. 2025, 15, 3826. [Google Scholar] [CrossRef] [PubMed]
  13. Beisner, J.; Filipe Rosa, L.; Kaden-Volynets, V.; Stolzer, I.; Günther, C.; Bischoff, S.C. Prebiotic Inulin and Sodium Butyrate Attenuate Obesity-Induced Intestinal Barrier Dysfunction by Induction of Antimicrobial Peptides. Front. Immunol. 2021, 12, 678360. [Google Scholar] [CrossRef] [PubMed]
  14. Reichold, A.; Brenner, S.A.; Förster-Fromme, K.; Bergheim, I.; Mollenhauer, J.; Bischoff, S.C. Dmbt1 does not affect a Western style diet-induced liver damage in mice. J. Clin. Biochem. Nutr. 2013, 53, 145–149. [Google Scholar] [CrossRef]
  15. Thuy, S.; Ladurner, R.; Volynets, V.; Wagner, S.; Strahl, S.; Königsrainer, A.; Maier, K.-P.; Bischoff, S.C.; Bergheim, I. Nonalcoholic fatty liver disease in humans is associated with increased plasma endotoxin and plasminogen activator inhibitor 1 concentrations and with fructose intake. J. Nutr. 2008, 138, 1452–1455. [Google Scholar] [CrossRef]
  16. Spruss, A.; Kanuri, G.; Wagnerberger, S.; Haub, S.; Bischoff, S.C.; Bergheim, I. Toll-like receptor 4 is involved in the development of fructose-induced hepatic steatosis in mice. Hepatology 2009, 50, 1094–1104. [Google Scholar] [CrossRef]
  17. Xing, T.; Benderman, L.J.; Sabu, S.; Parker, J.; Yang, J.; Lu, Q.; Ding, L.; Chen, Y.-H. Tight Junction Protein Claudin-7 Is Essential for Intestinal Epithelial Stem Cell Self-Renewal and Differentiation. Cell. Mol. Gastroenterol. Hepatol. 2020, 9, 641–659. [Google Scholar] [CrossRef]
  18. Lueschow-Guijosa, S.R.; Stanford, A.H.; Amy, H.; Berger, J.N.; Gong, H.; Boly, T.J.; Jensen, B.A.H.; Nordkild, P.; Leegwater, A.J.; Wehkamp, J.; et al. Host defense peptides human β defensin 2 and LL-37 ameliorate murine necrotizing enterocolitis. iScience 2024, 27, 109993. [Google Scholar] [CrossRef]
  19. Ouellette, A.J. Defensin-mediated innate immunity in the small intestine. Best Pract. Res. Clin. Gastroenterol. 2004, 18, 405–419. [Google Scholar] [CrossRef]
  20. George, M.D.; Wehkamp, J.; Kays, R.J.; Leutenegger, C.M.; Sabir, S.; Grishina, I.; Dandekar, S.; Bevins, C.L. In vivo gene expression profiling of human intestinal epithelial cells: Analysis by laser microdissection of formalin fixed tissues. BMC Genom. 2008, 9, 209. [Google Scholar] [CrossRef]
  21. Hooper, L.V.; Littman, D.R.; Macpherson, A.J. Interactions between the microbiota and the immune system. Science 2012, 336, 1268–1273. [Google Scholar] [CrossRef] [PubMed]
  22. Camilleri, M. Leaky gut: Mechanisms, measurement and clinical implications in humans. Gut 2019, 68, 1516–1526. [Google Scholar] [CrossRef] [PubMed]
  23. Koeninger, L.; Armbruster, N.S.; Brinch, K.S.; Kjaerulf, S.; Andersen, B.; Langnau, C.; Autenrieth, S.E.; Schneidawind, D.; Stange, E.F.; Malek, N.P.; et al. Human β-Defensin 2 Mediated Immune Modulation as Treatment for Experimental Colitis. Front. Immunol. 2020, 11, 93. [Google Scholar] [CrossRef] [PubMed]
  24. Beisner, J.; Teltschik, Z.; Ostaff, M.J.; Tiemessen, M.M.; Staal, F.J.T.; Wang, G.; Gersemann, M.; Perminow, G.; Vatn, M.H.; Schwab, M.; et al. TCF-1-mediated Wnt signaling regulates Paneth cell innate immune defense effectors HD-5 and -6: Implications for Crohn’s disease. Am. J. Physiol. Gastrointest. Liver Physiol. 2014, 307, G487–G498. [Google Scholar] [CrossRef]
  25. Wehkamp, J.; Salzman, N.H.; Porter, E.; Nuding, S.; Weichenthal, M.; Petras, R.E.; Shen, B.; Schaeffeler, E.; Schwab, M.; Linzmeier, R.; et al. Reduced Paneth cell alpha-defensins in ileal Crohn’s disease. Proc. Natl. Acad. Sci. USA 2005, 102, 18129–18134. [Google Scholar] [CrossRef]
  26. Palrasu, M.; Kakar, K.; Marudamuthu, A.; Hamida, H.; Thada, S.; Zhong, Y.; Staley, S.; Busbee, P.B.; Li, J.; Garcia-Buitrago, M.; et al. AhR Activation Transcriptionally Induces Anti-Microbial Peptide Alpha-Defensin 1 Leading to Reversal of Gut Microbiota Dysbiosis and Colitis. Gut Microbes 2025, 17, 2460538. [Google Scholar] [CrossRef]
  27. Hrdý, J.; Couturier-Maillard, A.; Boutillier, D.; Lapadatescu, C.; Blanc, P.; Procházka, J.; Pot, B.; Ryffel, B.; Grangette, C.; Chamaillard, M. Oral supplementation with selected Lactobacillus acidophilus triggers IL-17-dependent innate defense response, activation of innate lymphoid cells type 3 and improves colitis. Sci. Rep. 2022, 12, 17591. [Google Scholar] [CrossRef]
  28. Hugot, J.P.; Chamaillard, M.; Zouali, H.; Lesage, S.; Cézard, J.P.; Belaiche, J.; Almer, S.; Tysk, C.; O’Morain, C.A.; Gassull, M.; et al. Association of NOD2 leucine-rich repeat variants with susceptibility to Crohn’s disease. Nature 2001, 411, 599–603. [Google Scholar] [CrossRef]
  29. Sameer, A.S.; Nissar, S. Toll-Like Receptors (TLRs): Structure, Functions, Signaling, and Role of Their Polymorphisms in Colorectal Cancer Susceptibility. BioMed Res. Int. 2021, 2021, 1157023. [Google Scholar] [CrossRef]
  30. Volynets, V.; Louis, S.; Pretz, D.; Lang, L.; Ostaff, M.J.; Wehkamp, J.; Bischoff, S.C. Intestinal Barrier Function and the Gut Microbiome Are Differentially Affected in Mice Fed a Western-Style Diet or Drinking Water Supplemented with Fructose. J. Nutr. 2017, 147, 770–780. [Google Scholar] [CrossRef]
  31. Courth, L.F.; Ostaff, M.J.; Mailänder-Sánchez, D.; Malek, N.P.; Stange, E.F.; Wehkamp, J. Crohn’s disease-derived monocytes fail to induce Paneth cell defensins. Proc. Natl. Acad. Sci. USA 2015, 112, 14000–14005. [Google Scholar] [CrossRef] [PubMed]
  32. Ou, J.; Liang, S.; Guo, X.-K.; Hu, X. α-Defensins Promote Bacteroides Colonization on Mucosal Reservoir to Prevent Antibiotic-Induced Dysbiosis. Front. Immunol. 2020, 11, 2065. [Google Scholar] [CrossRef] [PubMed]
  33. Shawky, L.M.; Abo El Wafa, S.M.; Behery, M.; Bahr, M.H.; Abu Alnasr, M.T.; Morsi, A.A. Lactobacillus rhamnosus GG and Tannic Acid Synergistically Promote the Gut Barrier Integrity in a Rat Model of Experimental Diarrhea via Selective Immunomodulatory Cytokine Targeting. Mol. Nutr. Food Res. 2024, 68, e2400295. [Google Scholar] [CrossRef] [PubMed]
  34. Molino, S.; Lerma-Aguilera, A.; Jiménez-Hernández, N.; Gosalbes, M.J.; Rufián-Henares, J.Á.; Francino, M.P. Enrichment of Food With Tannin Extracts Promotes Healthy Changes in the Human Gut Microbiota. Front. Microbiol. 2021, 12, 625782. [Google Scholar] [CrossRef]
  35. Sato, T.; Vries, R.G.; Snippert, H.J.; van de Wetering, M.; Barker, N.; Stange, D.E.; van Es, J.H.; Abo, A.; Kujala, P.; Peters, P.J.; et al. Single Lgr5 stem cells build crypt-villus structures in vitro without a mesenchymal niche. Nature 2009, 459, 262–265. [Google Scholar] [CrossRef]
  36. Constabel, C.P.; Yoshida, K.; Walker, V. Diverse Ecological Roles of Plant Tannins: Plant Defense and Beyond. In Recent Advances in Polyphenol Research; John Wiley & Sons, Ltd.: Hoboken, NJ, USA, 2014; pp. 115–142. ISBN 9781118329672. [Google Scholar]
  37. Ashok, P.K.; Upadhyaya, K. Tannins are Astringent. J. Pharmacogn. Phytochem. 2012, 1, 45–50. [Google Scholar]
  38. Frasca, G.; Cardile, V.; Puglia, C.; Bonina, C.; Bonina, F. Gelatin tannate reduces the proinflammatory effects of lipopolysaccharide in human intestinal epithelial cells. Clin. Exp. Gastroenterol. 2012, 5, 61–67. [Google Scholar]
  39. Wu, Y.; Zhong, L.; Yu, Z.; Qi, J. Anti-neuroinflammatory effects of tannic acid against lipopolysaccharide-induced BV2 microglial cells via inhibition of NF-κB activation. Drug Dev. Res. 2019, 80, 262–268. [Google Scholar] [CrossRef]
  40. Chen, X.; Beutler, J.A.; McCloud, T.G.; Loehfelm, A.; Yang, L.; Dong, H.-F.; Chertov, O.Y.; Salcedo, R.; Oppenheim, J.J.; Howard, O.M.Z. Tannic Acid Is an Inhibitor of CXCL12 (SDF-1α)/CXCR4 with Antiangiogenic Activity1. Clin. Cancer Res. 2003, 9, 3115–3123. [Google Scholar]
  41. de Veras, B.O.; da Silva, M.V.; Ribeiro, P.P.C. Tannic acid is a gastroprotective that regulates inflammation and oxidative stress. Food Chem. Toxicol. 2021, 156, 112482. [Google Scholar] [CrossRef]
  42. Lee, H.-R.; Jeong, Y.-J.; Lee, J.-W.; Jhun, J.; Na, H.S.; Cho, K.-H.; Kim, S.J.; Cho, M.-L.; Heo, T.-H. Tannic acid, an IL-1β-direct binding compound, ameliorates IL-1β-induced inflammation and cartilage degradation by hindering IL-1β-IL-1R1 interaction. PLoS ONE 2023, 18, e0281834. [Google Scholar] [CrossRef] [PubMed]
  43. Karpiński, T.M.; Korbecka-Paczkowska, M.; Stasiewicz, M.; Mrozikiewicz, A.E.; Włodkowic, D.; Cielecka-Piontek, J. Activity of Antiseptics Against Pseudomonas aeruginosa and Its Adaptation Potential. Antibiotics 2025, 14, 30. [Google Scholar] [CrossRef] [PubMed]
  44. Li, X.; Lidsky, P.V.; Xiao, Y.; Wu, C.-T.; Garcia-Knight, M.; Yang, J.; Nakayama, T.; Nayak, J.V.; Jackson, P.K.; Andino, R.; et al. Ethacridine inhibits SARS-CoV-2 by inactivating viral particles. PLoS Pathog. 2021, 17, e1009898. [Google Scholar] [CrossRef] [PubMed]
  45. van Ampting, M.T.J.; Schonewille, A.J.; Vink, C.; Brummer, R.J.M.; van der Meer, R.; Bovee-Oudenhoven, I.M.J. Damage to the intestinal epithelial barrier by antibiotic pretreatment of salmonella-infected rats is lessened by dietary calcium or tannic acid. J. Nutr. 2010, 140, 2167–2172. [Google Scholar] [CrossRef]
  46. Wang, M.; Huang, H.; Wang, L.; Yin, L.; Yang, H.; Chen, C.; Zheng, Q.; He, S. Tannic acid attenuates intestinal oxidative damage by improving antioxidant capacity and intestinal barrier in weaned piglets and IPEC-J2 cells. Front. Nutr. 2022, 9, 1012207. [Google Scholar] [CrossRef]
  47. Kakogiannos, N.; Ferrari, L.; Giampietro, C.; Scalise, A.A.; Maderna, C.; Ravà, M.; Taddei, A.; Lampugnani, M.G.; Pisati, F.; Malinverno, M.; et al. JAM-A Acts via C/EBP-α to Promote Claudin-5 Expression and Enhance Endothelial Barrier Function. Circ. Res. 2020, 127, 1056–1073. [Google Scholar] [CrossRef]
  48. Horowitz, A.; Chanez-Paredes, S.D.; Haest, X.; Turner, J.R. Paracellular permeability and tight junction regulation in gut health and disease. Nat. Rev. Gastroenterol. Hepatol. 2023, 20, 417–432. [Google Scholar] [CrossRef]
  49. Tsai, P.-Y.; Zhang, B.; He, W.-Q.; Zha, J.-M.; Odenwald, M.A.; Singh, G.; Tamura, A.; Shen, L.; Sailer, A.; Yeruva, S.; et al. IL-22 Upregulates Epithelial Claudin-2 to Drive Diarrhea and Enteric Pathogen Clearance. Cell Host Microbe 2017, 21, 671–681.e4. [Google Scholar] [CrossRef]
  50. Aujla, S.J.; Chan, Y.R.; Zheng, M.; Fei, M.; Askew, D.J.; Pociask, D.A.; Reinhart, T.A.; McAllister, F.; Edeal, J.; Gaus, K.; et al. IL-22 mediates mucosal host defense against Gram-negative bacterial pneumonia. Nat. Med. 2008, 14, 275–281. [Google Scholar] [CrossRef]
  51. Li, X.; Wang, L.; Nunes, D.P.; Troxler, R.F.; Offner, G.D. Pro-inflammatory cytokines up-regulate MUC1 gene expression in oral epithelial cells. J. Dent. Res. 2003, 82, 883–887. [Google Scholar] [CrossRef]
  52. Wang, W.; Cao, J.; Yang, J.; Niu, X.; Liu, X.; Zhai, Y.; Qiang, C.; Niu, Y.; Li, Z.; Dong, N.; et al. Antimicrobial Activity of Tannic Acid In Vitro and Its Protective Effect on Mice against Clostridioides difficile. Microbiol. Spectr. 2023, 11, e0261822. [Google Scholar] [CrossRef] [PubMed]
  53. Chung, K.-T.; Lu, Z.; Chou, M.W. Mechanism of inhibition of tannic acid and related compounds on the growth of intestinal bacteria. Food Chem. Toxicol. 1998, 36, 1053–1060. [Google Scholar] [CrossRef] [PubMed]
  54. Akiyama, H.; Fujii, K.; Yamasaki, O.; Oono, T.; Iwatsuki, K. Antibacterial action of several tannins against Staphylococcus aureus. J. Antimicrob. Chemother. 2001, 48, 487–491. [Google Scholar] [CrossRef] [PubMed]
  55. Taguri, T.; Tanaka, T.; Kouno, I. Antimicrobial activity of 10 different plant polyphenols against bacteria causing food-borne disease. Biol. Pharm. Bull. 2004, 27, 1965–1969. [Google Scholar] [CrossRef]
  56. Dong, G.; Liu, H.; Yu, X.; Zhang, X.; Lu, H.; Zhou, T.; Cao, J. Antimicrobial and anti-biofilm activity of tannic acid against Staphylococcus aureus. Nat. Prod. Res. 2018, 32, 2225–2228. [Google Scholar] [CrossRef]
  57. Zhang, X.-F.; Dai, Y.-C.; Zhong, W.; Tan, M.; Lv, Z.-P.; Zhou, Y.-C.; Jiang, X. Tannic acid inhibited norovirus binding to HBGA receptors, a study of 50 Chinese medicinal herbs. Bioorg. Med. Chem. 2012, 20, 1616–1623. [Google Scholar] [CrossRef]
  58. Wang, S.-C.; Chen, Y.; Wang, Y.-C.; Wang, W.-J.; Yang, C.-S.; Tsai, C.-L.; Hou, M.-H.; Chen, H.-F.; Shen, Y.-C.; Hung, M.-C. Tannic acid suppresses SARS-CoV-2 as a dual inhibitor of the viral main protease and the cellular TMPRSS2 protease. Am. J. Cancer Res. 2020, 10, 4538–4546. [Google Scholar]
  59. Tintino, S.R.; Morais-Tintino, C.D.; Campina, F.F.; Costa, M.d.S.; Menezes, I.R.A.; de Matos, Y.M.L.S.; Calixto-Júnior, J.T.; Pereira, P.S.; Siqueira-Junior, J.P.; Leal-Balbino, T.C.; et al. Tannic acid affects the phenotype of Staphylococcus aureus resistant to tetracycline and erythromycin by inhibition of efflux pumps. Bioorg. Chem. 2017, 74, 197–200. [Google Scholar] [CrossRef]
Figure 1. Cell survival of organoids treated with TA (1 mg/mL, 0.1 mg/mL, 0.01 mg/mL) (a), or Eta (1 mg/mL, 0.1 mg/mL, 0.002 mg/mL) (b), or with PBSO as control for 30 h (n = 3). Data are presented as means ± SEM and were analyzed by one-way ANOVA with Dunnett’s multiple comparisons test or Kruskal–Wallis test with Dunn’s multiple comparisons test. Differences between two groups were analyzed by using unpaired t-test or Mann–Whitney test. Significant differences to PBSO control are indicated as ## p-value < 0.01.
Biomolecules 15 00650 g001
Figure 2. Relative mRNA expression levels of IL-6 (a), IL-1β (b), Ocln (c), and Cldn7 (d) determined by quantitative RT-PCR are shown upon stimulation of organoids with TA (1 mg/mL, 0.1 mg/mL, 0.01 mg/mL), or Eta (1 mg/mL, 0.1 mg/mL, 0.002 mg/mL), or with PBSO as control for 30 h. Data are presented as means ± SEM (n = 4). Statistical analysis was performed by one-way ANOVA with Dunnett’s multiple comparisons test or Kruskal–Wallis test with Dunn’s multiple comparisons test. Differences between two groups were analyzed by using unpaired t-test or Mann–Whitney test. Significant differences to PBSO control are indicated as # p-value < 0.05; ## p-value < 0.01.
Biomolecules 15 00650 g002
Figure 3. GFRed- and LPS-induced stress causes multiple disturbances in TJ and AJ gene expression, whereas TA at 0.01 mg/mL and Eta at 0.002 mg/mL partially reverse these effects. Organoids were treated as previously described in Table 3. Relative mRNA expression levels of ZO-1 (a), Ocln (b), JAM-A (c), Cldn2 (d), Cldn5 (e), and Cldn7 (f) were determined by quantitative RT-PCR. Data are presented as means ± SEM (n = 8). Statistical analysis was performed by one-way ANOVA with Dunnett’s multiple comparisons test or Kruskal–Wallis test with Dunn’s multiple comparisons test. Differences between two groups were analyzed by using unpaired t-test or Mann–Whitney test. Significant differences to PBSO control are indicated as # p-value < 0.05; ## p-value < 0.01; ### p-value < 0.001; #### p-value < 0.0001. Significant differences between two groups are indicated as * p-value < 0.05; ** p-value < 0.01; *** p-value < 0.001; **** p-value < 0.0001.
Biomolecules 15 00650 g003
Figure 4. GFRed impairs mucus transcripts expression, with both TA at 0.01 mg/mL and Eta at 0.002 mg/mL normalizing these effects. Organoids were treated as previously described in Table 3. Relative mRNA expression levels of Muc1 (a) and Muc2 (b) were determined by quantitative RT-PCR. Data are presented as means ± SEM (n = 8). Statistical analysis was performed by one-way ANOVA with Dunnett’s multiple comparisons test or Kruskal–Wallis test with Dunn’s multiple comparisons test. Differences between two groups were analyzed by using unpaired t-test or Mann–Whitney test. Significant differences to PBSO control are indicated as # p-value < 0.05; ## p-value < 0.01. Significant differences between two groups are indicated as * p-value < 0.05; ** p-value < 0.01.
Biomolecules 15 00650 g004
Figure 5. GFRed- and LPS-induced stress is associated with increased antimicrobial peptide transcripts expression, which is normalized by co-stimulation with TA at 0.01 mg/mL or Eta at 0.002 mg/mL. Organoids were treated as previously described in Table 3. Relative mRNA expression levels of Defa1 (a), Defa21 (b), Defa5 (c), Lyz1 (d), Reg3γ (e), and mBD1 (f) were determined by quantitative RT-PCR. Data are presented as means ± SEM (n = 8). Statistical analysis was performed by one-way ANOVA with Dunnett’s multiple comparisons test or Kruskal–Wallis test with Dunn’s multiple comparisons test. Differences between two groups were analyzed by using unpaired t-test or Mann–Whitney test. Significant differences to PBSO control are indicated as # p-value < 0.05; ## p-value < 0.01; ### p-value < 0.001; #### p-value < 0.0001. Significant differences between two groups are indicated as * p-value < 0.05; ** p-value < 0.01; *** p-value < 0.001; **** p-value < 0.0001.
Biomolecules 15 00650 g005
Figure 6. TA and Eta reduce Nod2-dependent activation of antimicrobial peptide gene expression in GFRed-treated cells. Organoids were treated with TA at 0.01 mg/mL and Eta at 0.002 mg/mL as previously described in Table 3. Relative mRNA expression levels of Nod2 (a) were determined by quantitative RT-PCR. Data are presented as means ± SEM (n = 8). Statistical analysis was performed by one-way ANOVA with Dunnett’s multiple comparisons test or Kruskal–Wallis test with Dunn’s multiple comparisons test. Differences between two groups were analyzed by using unpaired t-test or Mann–Whitney test. Significant differences to PBSO control are indicated as #### p-value < 0.0001. Significant differences between two groups are indicated as ** p-value < 0.01; **** p-value < 0.0001. Correlation analysis for Nod2 gene expression and Lyz1 (b), mBD1 (c), Defa1, Defa5, and Defa21 (d) expression was performed by two-tailed Spearman rank correlation analysis. Correlations were defined as follows: 0.2 to 0.4, weak positive correlations; 0.4 to 0.6, moderate positive correlations; 0.6 to 0.8, strong positive correlations.
Biomolecules 15 00650 g006
Figure 7. Increased Mmp7 expression in GFRed-treated cells correlates with elevated AMP formation. Organoids were treated as previously described in Table 3. Relative mRNA expression levels of Mmp7 (a) were determined by quantitative RT-PCR. Data are presented as means ± SEM (n = 8). Statistical analysis was performed by one-way ANOVA with Dunnett’s multiple comparisons test or Kruskal–Wallis test with Dunn’s multiple comparisons test. Differences between two groups were analyzed by using unpaired t-test or Mann–Whitney test. Significant differences to PBSO control are indicated as ## p-value < 0.01. Significant differences between two groups are indicated as ** p-value < 0.01. Correlation analysis for Mmp7 gene expression and Lyz1 (b), mBD1 (c), Defa1, Defa5, and Defa21 (d) expression was performed by two-tailed Spearman rank correlation analysis. Correlations were defined as follows: 0.2 to 0.4, weak positive correlations; 0.4 to 0.6, moderate positive correlations; 0.6 to 0.8, strong positive correlations.
Biomolecules 15 00650 g007
Figure 8. GFRed-mediated activation of Myd88 transcripts expression is associated with increased AMP gene expression. Organoids were treated with TA at 0.01 mg/mL and Eta at 0.002 mg/mL as previously described in Table 3. Correlation analysis for Myd88 gene expression and Lyz1 (a), Reg3γ (b), mBD1 (c), Defa1, Defa5, and Defa21 (d) expression. Statistical analysis was performed by two-tailed Spearman rank correlation analysis. Correlations were defined as follows: −0.2 to −0.4, weak negative correlations; 0.2 to 0.4, weak positive correlations; 0.4 to 0.6, moderate positive correlations; 0.8 to 1.0, very strong positive correlations.
Biomolecules 15 00650 g008
Table 1. Modifications of cell culture medium.
CCMGFRed
GlutaMaxTM2 mM2 mM
Hepes10 mM10 mM
R-Spondin1 µg/mL0.5 µg/mL
Noggin100 ng/µL50 ng/µL
B-27™ supplement20 µL/mL20 µL/mL
N-Acetylcysteine1.63 mg/mL1.63 mg/mL
Primocin0.1 mg/mL0.1 mg/mL
mEGF50 ng/mL50 ng/mL
Table 2. Inflammatory and gut barrier transcripts measured in GFRed- and LPS-treated organoids.
CtrlGFRedLPS100µgLPS50µg
Myd880.49 ± 0.1810.25 ± 2.54 ##10.13 ± 3.76 #13.15 ± 7.73 #
Tnfα0.53 ± 0.1125.27 ± 6.52 ##13.39 ± 9.3922.45 ± 11.3 #
IL-60.85 ± 0.2942.8 ± 11.77 #8.34 ± 0.46 ####26.79 ± 14.15 #
IL-1β0.49 ± 0.1810.25 ± 2.54 ##10.13 ± 3.76 #13.15 ± 7.73 #
Ocln1.14 ± 0.170.57 ± 0.14 #0.28 ± 0.1 #0.17 ± 0.09 ##
Cldn71.11 ± 0.330.16 ± 0.08 #0.18 ± 0.090.68 ± 0.34
Both GFRed and LPS exposure induce stress reactions in small intestinal organoids. Organoids were treated with GFRed, or LPS (50 µg, 100 µg), or PBSO as control for 30 h. Gene expression of Myd88, Tnfα, IL6, IL1β, Ocln and Cldn7 in small intestinal organoids was determined by quantitative RT-PCR. Data are shown as means ± SEM (n = 4–8). Statistical analysis was performed by one-way ANOVA with Dunnett’s multiple comparisons test or Kruskal–Wallis test with Dunn’s multiple comparisons test. Differences between two groups were analyzed by using unpaired t-test or Mann–Whitney test: # p-value < 0.05; ## p-value < 0.01; #### p-value < 0.0001.
Table 3. Gene expression of inflammatory markers measured in small intestinal organoids.
Myd88TnfαIL-6IL-1β
Ctrl1.11 ± 0.191.07 ± 0.14 0.99 ± 0.281.64 ± 0.72
GFRed58.05 ± 12.69 ###46.58 ± 12.02 ##134.4 ± 36.97 ##66.39 ± 16.45 ##
GFRed ± TA1.42 ± 0.37 **1.8 ± 0.51 **3.5 ± 0.94 *3.93 ± 1.41 **
GFRed ± Eta3.17 ± 0.94 ***2.21 ± 0.75 **1.67 ± 0.48 *4.7 ± 1.39 **
LPS23.05 ± 14.1820.87 ± 12.3742.24 ± 25.9742.8 ± 28.17
LPS ± TA0.89 ± 0.151.03 ± 0.260.33 ± 0.08 $0.93 ± 0.15
LPS ± Eta1.82 ± 0.491.35 ± 0.42.24 ± 0.514.73 ± 1.67
GFRed-treatment of organoids induces Myd88 as well as proinflammatory cytokines transcripts expression, with both TA and Eta reversing these effects. Organoids were treated with TA (0.01 mg/mL), or Eta (0.002 mg/mL), or GFRed ± 0.01 mg/mL TA, or GFRed ± 0.002 mg/mL Eta, or 50 µg/mL LPS ± 0.01 mg/mL TA, or 50 µg/mL LPS ± 0.002 mg/mL ETA, or PBSO as control for 30 h. mRNA expression of Myd88, Tnfα, IL-6, and IL-1β in small intestinal organoids was determined by quantitative RT-PCR. Data are shown as means ± SEM (n = 8). Statistical analysis was performed by one-way ANOVA with Dunnett’s multiple comparisons test or Kruskal–Wallis test with Dunn’s multiple comparisons test. Differences between two groups were analyzed by using unpaired t-test or Mann–Whitney test: Significant differences to PBSO control are indicated as ## p-value < 0.01; ### p-value < 0.001. Significant differences to GFRed are indicated as * p-value < 0.05; ** p-value < 0.01; *** p-value < 0.001. Significant differences to LPS are indicated as $ p-value < 0.05.
Disclaimer/Publisher’s Note: The statements, opinions and data contained in all publications are solely those of the individual author(s) and contributor(s) and not of MDPI and/or the editor(s). MDPI and/or the editor(s) disclaim responsibility for any injury to people or property resulting from any ideas, methods, instructions or products referred to in the content.

