Article

Cold-Active Starch-Degrading Enzymes from a Cold and Alkaline Greenland Environment: Role of Ca2+ Ions and Conformational Dynamics in Psychrophilicity

by
Malthe Kjær Bendtsen
1,
Jan Stanislaw Nowak
1,
Pedro Paiva
2,
Marcos López Hernández
1,3,
Pedro Ferreira
2,
Jan Skov Pedersen
1,3,
Nicolai Sundgaard Bekker
4,
Elia Viezzi
1,
Francesco Bisiak
5,
Ditlev E. Brodersen
5,
Lars Haastrup Pedersen
4,
Athanasios Zervas
6,
Pedro A. Fernandes
2,
Maria Joao Ramos
2,
Peter Stougaard
6,
Mariane Schmidt Thøgersen
6,† and
Daniel E. Otzen
1,5,*
1
Interdisciplinary Nanoscience Center, Gustav Wieds Vej 14, 8000 Aarhus, Denmark
2
LAQV, REQUIMTE, Departamento de Química e Bioquímica, Faculdade de Ciências Universidade do Porto, Rua do Campo Alegre, s/n, 4169-007 Porto, Portugal
3
Department of Chemistry, Aarhus University, Gustav Wieds Vej 14, 8000 Aarhus, Denmark
4
Department of Chemistry and Bioscience, Aalborg University, Fredrik Bajers Vej 7H, 9220 Aalborg, Denmark
5
Department of Molecular Biology and Genetics, Aarhus University, Universitetsbyen 81, 8000 Aarhus, Denmark
6
Department of Environmental Science, Aarhus University, 4000 Roskilde, Denmark
*
Author to whom correspondence should be addressed.
Current address: Zealand Academy of Technologies and Business, Maglegårdsvej 2, 4000 Roskilde, Denmark.
Biomolecules 2025, 15(3), 415; https://doi.org/10.3390/biom15030415
Submission received: 15 February 2025 / Revised: 6 March 2025 / Accepted: 10 March 2025 / Published: 14 March 2025
(This article belongs to the Section Enzymology)

Abstract

:
Cold-active enzymes hold promise for energy-efficient processes. Amylases are widely used in household and industrial applications, but only a few are cold-active. Here we describe three novel secreted amylases, Rho13, Ika2 and I3C6, all from bacteria growing in the cold and alkaline ikaite columns in Greenland. They all hydrolyzed starch to smaller malto-oligomers, but only Rho13 and Ika2 hydrolyzed cyclodextrins, and only Ika2 displayed transglycosylation activity. Ika2 forms a stable dimer, while both Rho13 and I3C6 are mainly monomeric. They all have optimal active temperatures around 30–35 °C and significant enzymatic activity below 20 °C, but Rho13 and I3C6 had an alkaline optimal pH, while Ika2 was markedly acidophilic. They showed complex dependence on Ca2+ concentration, with the activity of Rho13 and I3C6 following a bell-shaped curve and Ika2 being unaffected; however, removal of Ca2+ reduced the stability of all three enzymes. Loss of structure occurred well above the temperature of optimal activity, showing the characteristic psychrophilic divorce between activity and stability. MD simulations showed that Ika2 did not have a well-defined Ca2+ binding site, while Rho13 and I3C6 both maintained one stably bound Ca2+ ion. We identified psychrophilic features as higher levels of backbone fluctuations compared to mesophilic counterparts, based on a lower number of internal hydrogen bonds and salt bridges. This increased fluctuation was also found in regions outside the active site and may provide easier substrate access and accommodation, as well as faster barrier transitions. Our work sheds further light on the many ways in which psychrophilic enzymes adapt to increased catalysis at lower temperatures.

1. Introduction

Exploring cold environments for new cold-active enzymes can lead to the discovery of novel enzyme variants with unique properties and functionalities. These enzymes may exhibit distinct substrate specificities, thermal stabilities, or catalytic efficiencies, offering opportunities for tailored enzyme engineering and customization to specific industrial applications. The ability of cold-active enzymes to function effectively at low temperatures provides flexibility in process design. Industrial processes can be carried out at ambient temperatures or under refrigeration, eliminating the need for energy-intensive heating systems. This minimizes the risk of thermal degradation of sensitive substrates or products and reduces operational costs. Novel energy-efficient processes are required in industry as well as in private households to contribute to a more sustainable society. One contribution to this reduction in emissions is to apply truly cold-active enzymes to detergents to make washing at low temperatures even more efficient.
Cold-active enzymes for detergents are already industrially applied today. However, most of these enzymes display optimal activity at temperatures between 20 and 45 °C [1], with marginal activity at 5–20 °C. This is usually compensated for by over-dosing the amount of enzyme used. To move beyond these simplistic solutions, we need to discover novel, truly cold-active enzymes from natural environments that provide in-depth knowledge of cold activity [2]. This knowledge can then be mobilized to either exploit these new enzymes directly or modify currently used industrial enzymes to increase their activity at low temperatures and to reduce the amount of enzyme required.
α-amylases (EC 3.2.1.1) are a major class of enzymes used in laundry detergents, as well as in the production of textiles, biofuel, feed, food, and beverages. They catalyze hydrolysis of α-1,4 glycosidic bonds in starch and starch-related polysaccharides, including amylopectin, amylose, cyclodextrins, glycogen, and pullulan [3,4,5]. Amylases are also relevant for bioremediation. Cold-active amylases are particularly interesting because of their ability to degrade organic matter, for example in waste treatment in cold and temperate regions [6]. Some cold-active amylases even possess higher specific activity than their meso- or thermophilic counterparts [6].
α-amylases are structurally grouped in four different glycoside hydrolase (GH) families: GH13, GH57, GH119, and GH126 mentioned in the CAZy database of carbohydrate acting enzymes [3]. The largest family is GH13, whose members form a (β/α)8 barrel structure and a conserved catalytic triad consisting of two Asp and one Glu, or in a few cases one Asp, one Glu, and one His [7]. In addition α-amylases, the GH13 family also contains endo- as well as exo-acting amylase-family enzymes with a wide range of different substrate specificities, including pullulanases (catalyzing hydrolysis of (1→6)-α-D-glucosidic linkages in pullulan, amylopectin and glycogen), neopullulanases (α-amylases specifically catalyzing the hydrolysis of α-1,4-glucosidic bonds in pullulan), and cyclomaltodextrinases (catalyzing the linearization of cyclomaltodextrin into maltodextrin) [8,9,10,11,12,13].
An attractive feature of cold-active amylases is that they are active at moderate as well as low temperatures. Most known amylases are either meso- or thermophilic, and only a limited number of cold-active amylases are known. These include an α-amylase from the soil bacterium Bacillus subtilis [14], an α-amylase from the Himalayan soil bacterium Bacillus cereus [15], a salt-tolerant α-amylase from the marine bacterium Zunongwangia profunda [16], and the well-characterized α-amylase from the Antarctic marine bacterium Alteromonas haloplanktis A23, which shows optimal amylolytic activity at 30 °C and maintains 18% activity at 3 °C [17,18,19,20].
Since most amylases are exported, they will be exposed to conditions which may differ from the cytosolic environment in terms of ionic strength or pH. Amylases with significant residual activity at low temperature have so far been found in aquatic environments, and all show relatively broad pH profiles, with optimal pH values around 10 (Bacillus subtilis N8 and Bacillus cereus GA6) and 7 (Zunongwangia profunda and Alteromonas haloplanktis A23). Alkaliphilic profiles are particularly useful for detergent enzymes, since detergent-based washing usually takes place at around pH 9–10 [21].
To discover novel cold-active, alkali-stable amylases, we investigated the only environment on Earth known to be both cold and alkaline, namely the ikaite columns in the Ikka Fjord, SW Greenland. These tufa columns, consisting of the meta-stable mineral ikaite (a hydrated form of calcium carbonate), are formed due to precipitation of calcium carbonate from highly alkaline spring water (pH 10.4) mixing with the cold seawater in the Ikka Fjord [22]. They are inhabited by diverse microbial communities [23]. Most of the isolated bacterial strains and recombinantly expressed enzyme genes obtained from environmental DNA from the columns show significant extracellular enzymatic activity at high pH levels [24,25,26].
Here we identify and provide a detailed characterization of two novel starch-degrading enzymes from these ikaite columns, namely Ika2 and Rho13. In parallel, we extend the characterization of I3C6, another amylase isolated from the ikaite columns [27], to allow direct comparison of their enzymatic and biophysical properties, with a particular focus on their psychrophilicity. I3C6 was identified in a metagenomic analysis rather than from functional screening of a single bacterial isolate [27] and had a reported pH optimum around 7–9 and a temperature optimum around 10–15 °C, losing activity within 20 min at 45 °C while retaining > 70% of activity at as low as 1 °C, and with a pH optimum at pH 8–9. I3C6 activity was stimulated by Ca2+ but inhibited by Zn2+ and Cu2+. We analyzed product formation by pulsed amperometric detection and observed endo-active release of maltose (G2) and larger oligosaccharides from amylopectin, amylose, and hydrolyzed starch, as well as hydrolysis of smaller maltooligosaccharides. The three enzymes also vary in their quaternary organization, pH profiles, and dependence on Ca2+ ions, but they all show loss of activity at temperatures well below the loss of structure. This characteristic psychrophilic trait may be linked to their higher levels of backbone fluctuations compared with mesophilic homologues. We propose that this provides easier substrate access and binding, as well as facilitating efficient conformational transitions across local minima during catalysis.

2. Materials and Methods

2.1. Identification of Samples

All samples originated from the ikaite columns in the Ikka Fjord but were sampled at different times between 2006 and 2019, and the enzymes were detected and isolated by different approaches, as described below.
Amylase Ika2: Samples of ikaite columns were collected by divers in the Ikka Fjord in the summer of 2019, with permission from the Government of Greenland (License no. G19-032), and stored at −20 °C. To isolate bacteria from the ikaite columns, samples of 0.2–0.5 g of ikaite were drilled by hand from the interior of the column samples. The drilled samples were suspended in 1/10 strength R2 broth [per liter: 0.05 g yeast extract, 0.05 g Bacto peptone, 0.05 g Bacto casamino acids, 0.03 g sodium pyruvate, 0.03 g KH2PO4, 0.005 g MgSO4 * 7 H2O, 1 g NaCl] adjusted to pH 10 with 50 mM Na2CO3/NaHCO3, and aliquots were used for culturing experiments. Bacterial strains from the sampled ikaite material displaying amylase activity were picked from agar plates and passaged to 1/10 strength R2 agar [1/10 strength R2 broth supplemented with 15 g/L agar, no glucose] adjusted to pH 10 and supplemented with 0.5 g/L AZCL-amylose (Megazyme, Wicklow, Ireland). The plates were incubated at 5 °C for 3 months, and colonies producing a halo of solubilized chromogenic amylose were re-streaked on the same substrate as above until strain purity was achieved.
Amylase RhoGH13_36 (denoted below): The gene sequence was identified by screening the genome sequence of the ikaite bacterium Rhodonellum psychrophilum [28,29] (NCBI accession number AWXR00000000) for putative amylase-encoding genes (see details below).
Amylase AmyI3C6 (denoted below): This enzyme was previously identified and described by Vester et al. [27] (acc. no. KJ790257).

2.2. Identification of Amylase-Coding Genes and Homology Alignment

To identify amylase-coding genes in the cultured isolate (Ika2), the strain was subjected to whole-genome sequencing. DNA was prepared for sequencing using a Nextera XT DNA Library Preparation Kit (Illumina, Inc., San Diego, CA, USA) and sequenced on an Illumina MiSeq. The assembled reads, along with the published genome of R. psychrophilum, were annotated using PROKKA [30] and analyzed using Geneious Prime (v. 2022.2.2) [31]. To identify potential amylolytic enzyme–encoding genes in the genomes of Ika2 and Rho13, a local sequence list containing the amino acid sequences of characterized amylases representing all relevant GH groups (GH13, 14, 15, 57, 97, 119, and 126) in the CAZy database was created and blasted against the genome sequence (tblastn) with a max E-value of 10 to also include low-scoring sequence hits. All potential hits were analyzed for sequence-based and in silico structural similarities to known enzymes and enzyme-encoding genes using the Blast module (blastn, blastp, and tblastn) of Geneious Prime against the nucleotide collection (nr/nt) database, Protein Data Bank (PDB), Swiss-Prot, Uni-Prot [32,33], and HHPred (MPI Bioinformatics Tools) [34].
The selected “best candidates” were analyzed in InterPro [35] to confirm their classification, and signal peptides were further confirmed using SignalP 6.0 [36].

2.3. Cloning, Expression, and Purification

Ika2: A gene predicted to encode an enzyme with sequence similarities to the α-amylases neopullulanase and cyclomaltodextrinase was selected for expression. The gene was amplified using gene-specific primers with overhangs designed for In-Fusion® cloning (Takara Bio Inc., Kusatsu, Japan) into plasmid pET28a(+), including a C-terminal 6x His-tag: Ika-amy2-F (5′-AGGAGATATACCATGTTATTAGAAGCAATTTACCATCGGC-3′) and Ika-amy2-R (5′-GTGGTGGTGGTGGTGGGCACCGCTTTTGATGATGAC-3′). The primers used to amplify the vector were pET28a-F (5′-CACCACCACCACCACCACT-3′) and pET28a-R (5′-CATGGTATATCTCCTTCTTAAAGTT-3′) (vector-specific overhangs are underlined).
The DNA fragments were amplified using 2X Phusion High-Fidelity PCR Master Mix with HF Buffer (Thermo Scientific) and the following PCR protocol: 1 cycle at 98 °C for 30 s, 25 cycles at (98 °C for 10 s, 55 °C for 1 min, 72 °C for 30 s/kb), and 1 cycle at 72 °C for 5 min (amylase gene)/10 min (vector). The PCR products were visualized on a 1% agarose gel and purified using a Monarch® DNA Gel Extraction Kit (New England Biolabs, Ipswich, MA, USA). In-Fusion® cloning was carried out according to the protocol supplied by Takara Bio using 5X In-Fusion Snap Assembly Master Mix (Takara Bio Inc.). In brief, 2 µL 5X Master Mix was mixed with 50–100 ng purified vector DNA and 50–100 ng purified insert DNA and incubated at 50 °C for 15 min, followed by incubation on ice for 15 min. The reaction directly transformed into E. coli BL21(DE3). The transformed cells were grown on LB agar with 50 µg/mL kanamycin (Km50) at 37 °C overnight.
Rho13 and I3C6: Genes encoding the two putative amylases were codon-optimized for E. coli and directly cloned into plasmid pET28a(+) including a C-terminal 6x His-tag by GenScript (Rijswijk, The Netherlands). Signal sequences were excluded. The plasmids were transformed into E. coli BL21(DE3) for expression. A single colony from each of the three clones was inoculated into 10 mL LB Km50 and incubated overnight at 37 °C with 200 rpm shaking. Each overnight culture was used to inoculate 1 L of LB Km50, which was incubated at 37 °C with 200 rpm shaking for 4 h. The cultures were subsequently incubated at RT with 200 rpm shaking for 20 min before adding 1 mM isopropyl ß-d-1-thiogalactopyranoside for induction. The induced cultures were incubated at 18 °C with 200 rpm shaking overnight. Cells from the induced overnight cultures were harvested by centrifugation (10 min, 4500 rpm, 4 °C). The supernatant was discarded, and the pellet was resuspended in 12.5 mL Buffer A (50 mM Tris, 50 mM NaCl, pH 8). The cells were lysed by sonication (5 min, 20% amplitude, pulses of 20 s with 20 s on ice in between). The lysates were centrifuged for 30 min at 15,000× g (4 °C), and the supernatant was filtered through a 0.45 µm Millipore filter. The filtrate was added to a 15 mL purification column consisting of 4 mL Ni-NTA beads (Thermo Fisher Scientific, Waltham, MA, USA) previously charged with 4 mL 1M NiSO4 and equilibrated with washing buffer (buffer A + 20 mM imidazole). After addition of the filtrate, the column was incubated for 15 min and washed with 15 mL wash buffer, and the amylase was eluted with 7 mL elution buffer (Buffer A + 400 mM imidazole).
The eluates were desalted on PD-10 columns (Cytiva, Marlborough, MA, USA) before further purification using an Äkta Pure Protein Purification System (Cytiva) on a Superdex-200 Increase column with a flow rate of 0.5 mL/min. Purifications were carried out in either (1) 100 mM HEPES with 150 mM NaCl and 2 mM CaCl2 at pH 6.5 or (2) 50 mM MOPS with 50 mM NaCl and 2 mM CaCl2 at pH 7.5. Fractions giving rise to absorption at 280 nm were examined for activity using an MBTH assay (see below) and run on SDS-PAGE gels to assess their purity with Mark12™ Unstained Standard (Thermo Fisher Scientific) (Ika2) or PageRuler™ Unstained Protein Ladder (Thermo Fisher Scientific) (Rho13 and I3C6) as standards. The purified enzymes were further concentrated using an Amicon ultra 30 K spin filter. Mw, pI, and extinction coefficients were calculated using the ProtParam tool (https://web.expasy.org/protparam/ (accessed on 24 February 2023)). Protein concentrations were measured using a Nanodrop ND-1000 (Thermo Fisher Scientific, Waltham, MA, USA).

2.4. Determination of Carbohydrate Breakdown Products

As amylase substrates we used potato starch, beta- and gamma-cyclodextrins (β-CD and γ-CD) (Wacher), maltose (reagent grade, VWR, Søborg, Denmark), maltooligosaccharide preparations of dp3 (maltotriose > 90%), dp6 (maltohexaose > 65%), and dp7 (maltoheptaose > 60%) (Merck, Søborg, Denmark). For hydrolysis reactions, each enzyme was incubated with 5 g/L starch or CD in 50 mM MOPS buffer pH 7.5 and 2 mM CaCl2, along with either Ika2 (135 nM) and I3C6 (300 nM) at 30 °C or Rho (135 nM) at 35 °C. Total volume: 1 mL, sampling 90 mL at 0, 2, and 4 h. Due to the low activity of I3C6, it was also sampled at 24 and 48 h. For potential transglycosylation assays, I3C6 was incubated with 11.6 mM glucose/fucose in combination with maltoheptaose and Rho13 with 11.6 mM glucose/fucose in combination with maltohexaose. Ika2 was incubated in 11.6 mM glucose only, 11.6 mM glucose in combination with maltose, maltotriose, maltoheptaose, and γ-CD, and 11.6 mM fucose in combination with glucose and γ-CD. All reactions were stopped by adding 0.5 M NaOH to the sample 1:1 (v/v). For all assays, controls with only enzyme and no substrate or substrate without enzyme were included in the experiments. All samples were analyzed by High Performance Anion Exchange Chromatography with Pulsed Amperometric Detection on an ICS-6000 system (Dionex™, Thermo Fisher Scientific, Waltham, MA, USA). The system was fitted with a CarboPac PA1 column at 25 °C, flow rate 0.4 mL/min, and injection volume 25 µL. The eluents were (A) 1 M sodium hydroxide, (B) 1 M sodium acetate, and (C) milliQ-water. The eluent contained constantly 10% (A) and from 0–5 min 1% (B) and 89% C); from 5–30 min a linear gradient of (B) increasing to 30% at the expense of (C), from 30–35 min 90% (B) at the expense of (C), and from 35–45 min original conditions, equilibrating the system for the next analysis. We used a detector gold working electrode pH-Ag-AgCl reference and a Dionex standard waveform potential cycle for carbohydrates. Standards included glucose, maltose, maltooligosaccharides of dp3-7, β-CD, and γ-CD.

2.5. Activity Assays

MBTH amylase activity assay: Enzymatic activity was determined by measuring the amount of reducing carbohydrate ends in a 3-methyl-2-benzothiazolinone hydrazone hydrochloride (MBTH) assay [37]. For each experiment, 10 mg/mL soluble potato starch (Sigma Aldrich, St. Louis, MO, USA) was dissolved in an assay-specific buffer (see below), followed by acid-catalyzed hydrolysis (adjustment of pH to 1.8 using 6 M HCl followed by 45 min at 95 °C). The pH was then adjusted to the desired assay pH with 6 M NaOH, and the concentration was reduced to 5 mg/mL. The activity assays were performed at 21 °C in a reaction mix consisting of 135–200 nM amylase and 4.5 mg/mL hydrolyzed starch in the appropriate assay buffer. Every 30 s, 25 µL of the reaction mix was removed, and the reaction was stopped with 25 µL 0.5 M NaOH. Subsequently, 25 µL MBTH reagent (1.5 mg/mL MBTH and 0.5 mg/mL DTT) was added, and the mixture was incubated at 80 °C for 15 min. Immediately after removal from the heater, 50 µL developing agent was added (0.5% (FeNH4(SO4)2)·12H2O, 0.5% sulfamic acid, 0.25 M HCl, or 0.5 M HCl for the pH assay), and the samples were left to develop and cool for at least 15 min. After cooling, 20 µL sample was diluted in 180 µL Milli-Q H2O in a 96 well plate, and absorbance was measured at 620 nm. If the absorbance was measured to be higher than the standard curve, the samples were further diluted 20-fold in Milli-Q H2O. Absorbance was converted to reducing ends using a standard curve made from a dilution series of 0.122–62.5 nmol maltose. Activity/initial velocity was determined from linear regression of the increasing number of reducing ends over 330 s.
pH optimum: The assay buffer was 100 mM bis-tris propane, 50 mM NaCl, and 2 mM CaCl2. The starch solution was prepared in assay buffer, and the pH was adjusted to 6–9.5 (6, 6.5, 7, 7.5, 8, 8.5, 9, 9.5) with NaOH and HCl. The enzyme was mixed with assay buffer of the relevant pH and allowed to incubate for 15 min at RT before starch was added. Initial velocity was measured over 5.5 min. Enzyme concentrations: Rho13: 200 nM, I3C6: 135 nM, Ika2: 136 nM.
NaCl optimum: Assay buffer: 50 mM MOPS, 2 mM CaCl2, pH 7.5, NaCl: 0–1000 mM (0, 10, 20, 50, 100, 250, 500, 1000 mM). The substrate and assay buffer were prepared without NaCl, but the pH was adjusted with NaOH (given MOPS’ pKa of 7.2, the buffer contributes ca. 34 mM to ionic strength). The desired NaCl concentration was achieved using a 2 M NaCl stock in assay buffer. Initial velocity was measured over 5.5 min. Enzyme concentrations: Rho13: 200 nM, I3C6: 140 nM, Ika2: 136 nM.
Ca2+ optimum: Assay buffer: 50 mM MOPS, 50 mM NaCl, pH 7.5, CaCl2: 0–20 mM (0, 0.01, 0.05, 0.2, 0.5, 2, 5, 20 mM). The substrate and assay buffer were prepared without CaCl2, and the desired CaCl2 concentration was achieved using a 100 mM CaCl2 stock in assay buffer. Enzymes were buffer-exchanged by size exclusion chromatography (SEC) purification on an Äkta pure system on a Superdex-200 Increase column in assay buffer without CaCl2. Enzyme concentrations: Rho13: 200 nM, I3C6: 135 nM, Ika2: 136 nM. The activity as a function of Ca(II) concentration showed a bell-shaped curve and was fitted to Equation (1) [38]:
V m a x a p o = V m a x a p o · K L 1 [ C a I I ] + V m a x L 1 + V m a x L 2 · [ C a ( I I ) ] K L 2 K L 1 [ C a I I ] + 1 + [ C a I I ] K L 2
Here, V m a x a p o , V m a x L 1 , and V m a x L 2 are the maximum velocities of the enzyme with zero, one, and two ligand molecules bound, respectively. K L 1 and K L 2 are dissociation constants for binding of the first and second ligand molecule, respectively. This model is simplified, as the proteins might have several binding sites.
Temperature optimum: Assay buffer: The enzyme was mixed with buffer and placed on ice until assay start. The enzyme and the substrate were individually heated to assay temperature (5, 10, 15, 20, 25, 30, 35, 40, 45, 55 °C) for 15 min before the substrate was added to the enzyme solution, and the temperature was kept co81nstant during the experiment. Every 30 s, 25 µL of the reaction was stopped in 0.5 M NaOH, and the activity was measured by MBTH assay. Activity was determined as a linear fit of the initial 5.5 min of the reaction. The enzyme was prepared in 50 mM MOPS buffer pH 7.5 without CaCl2 but was then diluted 1:4 in assay buffer containing CaCl2 for 15 min before assay start. Enzyme concentrations: Rho13: 115 nM, I3C6: 50 nM, Ika2: 580 nM.

2.6. Biophysical Analysis

Circular Dichroism (CiD): The secondary structure of each enzyme (200 µL, 0.2 mg/mL) in 10 mM MOPS, 50 mM NaCl, 2 mM CaCl2 with or without 3 mM EDTA was measured on a Chirascan-plus qCD spectrometer (Applied Photophysics, Surrey, UK). The sample was exposed to a temperature ramp of 1 °C/min from 8–90 °C while recording spectra at 200–260 nm in 1 nm steps. The bandwidth was set to 1 nm and the measurement time to 0.5 s/nm. The recorded temperature was measured directly in the cuvette. Wavelength spectra are shown with buffer background subtracted. Thermal scans were fitted in OriginPro 2024 following a two-transition model (Equation (2)) to determine the global melting temperature tm (indicated in °C).
C D a p p t = b s N + a s N t e H 1 1 t + 273.15 t m 1 + 273.15 R t + 273.15 + b s I + a s I t + b s D + a s D t e H 2 1 t + 273.15 t m 2 + 273.15 R t + 273.15 e H 1 1 t + 273.15 t m 1 + 273.15 R t + 273.15 + 1 + e H 2 1 t + 273.15 t m 2 + 273.15 R t + 273.15
With the CiDapp signal as a function of temperature and tm1 and tm2 representing the two melting points and ΔH1 and ΔH2 representing the melting enthalpies respectively, R is the gas constant, and bsN + asN*t, bsI + asI*t, and bsD + asD*t the CiD signal for the native, intermediate, and denatured species, respectively.
Differential scanning fluorimetry: Loss of tertiary structure during heating was monitored with differential scanning fluorimetry on a NanoTemper Prometheus Panta with 7 µL enzyme (0.1 mg/mL) in 50 mM MOPS, 50 mM NaCl, 2 mM CaCl2. Excitation was at 280 nm, and fluorescence emission at 350 nm and 330 nm was measured in parallel at a scan rate of 1 °C/min from 15 to 95 °C. Reversibility of unfolding was measured in the same run by decreasing the temperature to 15 °C at the same scan rate. The 350 nm/330 nm fluorescence ratio was plotted against temperature and fitted to a two-state unfolding equation (Equation (3)) in GraphPad Prism 10.0.2.
I a p p = I F + I F B t + I U + I U B t e H u n f 1 t t m R t 1 + e H u n f 1 t t m R t
Here, t is the temperature, tm is the melting temperature, ΔH is the unfolding enthalpy, and R is the gas constant. Fluorescence intensity as a function of temperature is described by IF + IFB*t and IU + IUB*t, for the folded and unfolded species, respectively.
Size exclusion chromatography (SEC): Chromatograms from the SEC purifications were plotted and compared to the elution profiles of three standard globular proteins (lysozyme (14.31 kDa), carbonic anhydrase (28.98 kDa and 57.96 kDa), and BSA (66.46 and 132.93 kDa)). The elution volume with the highest absorbance was defined as the elution volume for each peak. The data were plotted as log10 of the MW as a function of elution volume. Estimated MW was calculated from the linear regression on the plot of five peaks from the standard proteins. The MW of the α-amylases was calculated from their sequence, excluding the signal peptide from Rho13 but including the C-terminal His-tag extension LEHHHHHH (Rho13 and I3C6) or HHHHHH (Ika2).
Structure prediction: AlphaFold2 was used to predict the structure of I3C6 and a dimer structure of Ika2 using the multimer setting used for SAXS [39]. The top result was relaxed with AMBER. Rho13 monomer and dimer structures were predicted using CoLabFold [40,41] The predicted models had high local and global confidence prediction scores.
Small-angle X-ray scattering (SAXS) data collection: All SAXS data were obtained at Aarhus University using an in-house flux-optimized Bruker (Karlsruhe, Germany) SAXS NanoStar instrument with a Ga liquid metal jet source from Excillum (Kista, Sweden) and home-built scatterless slits [42]. All measurements were performed for 1800 s at 25 °C. Buffer and noise contributions were measured and subtracted. The resulting data were normalized to absolute scale using scattering from water and logarithmically rebinned. Scattering intensity is described as a function of the modulus of the scattering vector q, q = (4π sin(θ))/λ, where 2θ is the scattering angle, and λ = 1.34 Å is the radiation wavelength for the Ga radiation. SAXS data were acquired using different concentrations for each protein to check for possible concentration effects. All SAXS data treatment and analysis procedures described in the text were carried out using the SUPERSAXS software package (J.S. Pedersen and C.L.P. Oliveira, unpublished). Model-independent analysis was performed using an indirect Fourier transformation routine [43,44] to acquire the pair distance distribution function, ρ(r), from which the maximum distance (Dmax), forward scattering (I(0)), and radius of gyration (Rg) were obtained. The value I(0) was used to estimate the molecular weight, M, of the scatterer particle using the equation M = I 0 c ρ m 2 , where c is the mass concentration per milliliter and Δρm is the excess scattering length density per mass, which can be approximated as 2.0 × 10 10 c m g for proteins. From this calculated value and the theoretical molecular weight of each monomer, an oligomerization state can be determined.
SAXS data analysis: Model-dependent analysis was performed using structures predicted by AlphaFold in combination with the in-house programs wlsq_symxv6XL [45] and wlsq_lin. The program wlsq_symxv6XL calculates theoretical scattering curves of PDB structures with contribution from a hydration layer by applying the Debye equation using a Gaussian form factor for all non-H atoms. Since the data are normalized to absolute scale, the concentration can be used as a scale parameter and therefore compared with the value obtained from absorbance measurements. Additionally, possible oligomerization states can be optimized from the starting structure using different symmetries, which is more thoroughly described in [46]. This feature was applied to Rho using P2 symmetry, which corresponds to a simple two-fold symmetry. The program wlsq_lin is used to fit a linear combination of different oligomer scattering profiles in cases where SAXS model–independent analysis and SEC suggested the coexistence of multiple species.

2.7. Molecular Dynamics Simulations

To assess the overall stability and flexibility of I3C6, Ika2, and Rho13, we conducted Molecular Dynamics (MD) simulations of these enzymes and some close homologs. Prior to the simulations, the predicted structures of the psychrophilic enzymes were aligned with the structures of their mesophilic/thermophilic counterparts. I3C6 (monomer) was aligned with the α-amylase from Bacillus stearothermophilus (PDB: 1HVX [47]; backbone RMSd ≈ 1.03 Å), Ika2 (dimer) was aligned with the neopullulanase from Geobacillus stearothermophilus (PDB: 1J0H [48]; backbone RMSd ≈ 2.14 Å), and Rho13 (monomer) was aligned with the α-amylase from Halothermothrix orenii (PDB: 1WZA [49]; backbone RMSd ≈ 2.65 Å). After careful analysis of the aligned structures, we copied the coordinates of the Ca2+/Na+ ions from the homologs’ crystallographic structures to the respective psychrophilic structures (Figure 1). The protonation state of all residues at the optimum pH for each enzyme (see Results) was initially based on the results of the pKa predictor software PROPKA 3.5.0 [50]. Additionally, the chosen protonation states were carefully analyzed and validated through visual inspection of the residues and their surrounding environment.
The ANTECHAMBER module of AMBER 18 [51] was employed to neutralize (with Na+ counterions) each amylase and to place it in the center of a rectangular box of TIP3P water molecules [52], whose faces were located at least 15 Å from the surface of each enzyme. All simulations were conducted using GROMACS 2021.5 software [53] and the AMBER ff14SB force field [54]. Prior to the MD simulation runs, each system was submitted to a multi-step minimization protocol using the steepest descent algorithm [55]. In the first step, both the enzyme and the modeled Ca2+/Na+ ions were restrained, allowing minimization of all water molecules; in the second minimization step, the side chains of all residues were relaxed; in the third and last step, the entire system, except the modeled Ca2+/Na+ ions, was minimized. After minimization, the obtained systems were used as the starting points of MD simulations, in which the LINCS algorithm [56] was applied to constrain all bonds involving hydrogen atoms. This made it possible to apply an integration time step of 2 fs. In all simulations, the Verlet cut-off scheme was used in combination with a non-bonded cut-off value of 10 Å. Furthermore, periodic boundary conditions were considered, and the Coulomb interactions were treated using the Particle Mesh–Ewald scheme [57]. The minimized systems were first heated for 100 ps to the target temperature (30–35 °C, according to the optimal temperature of each psychrophilic enzyme, see Section 3 Results) using the V-rescale thermostat [58] in the NVT ensemble. During this heating phase, all protein atoms and all modeled Ca2+/Na+ ions were restrained by a harmonic potential with a force constant of 1000 kJ/mol/nm2. Subsequently, a 2 ns equilibration phase was performed in the NPT ensemble to relax the system’s density to 1.0 bar, which was accomplished using the Berendsen barostat [59]. The enzymes’ backbones and the modeled Ca2+/Na+ ions were restrained throughout the entire equilibration phase. Finally, a 400 ns production phase was performed for each system at constant temperature and pressure (NPT ensemble) using the V-rescale thermostat and a Parrinello–Rahman barostat [60]. During this stage, no positional restraints were applied to the system. This three-phase MD protocol was carried out in three replicates, for a total production time of 1.2 µs per amylase system.
To analyze the structural motions of the enzymes, the MD trajectories of the production phase obtained for the three replicates were concatenated to a continuous trajectory of 1.2 μs using the gmx trjcat tool. For each system, the root-mean-square deviation (RMSD) of the backbone atoms relative to the initial minimized structure was calculated with the gmx rms tool to evaluate the enzyme’s stability. The conformational flexibility of the enzymes was evaluated with per-residue root-mean-square-fluctuation (RMSF) analysis, performed on the backbone atoms using the gmx rmsf tool. The resulting values provide a comparative measure of psychrophilic versus mesophilic enzyme local and global flexibility. To minimize the strong dependence of the calculated RMSF values on the average structure used as a reference, this particular metric was calculated individually for each replicate and subsequently combined to an average ± standard deviation value. The compactness of the enzyme structures was assessed by calculating the Rg using the gmx gyrate tool. Typically, a higher Rg is suggestive of a less compact and more flexible structure [61]. The solvent-accessible surface area (SASA), calculated with the gmx sasa tool, served as another descriptor of structural compactness, with higher SASA values indicating increasing solvent exposure, which strongly influences residue flexibility [62]. Principal component analysis (PCA) was employed to reduce the dimensionality of the molecular motions observed in the simulations. For this, the covariance matrices of the atomic fluctuations of the backbone atoms were constructed and diagonalized using the gmx covar tool. Subsequent projection of the trajectory onto the first two eigenvectors was performed using the gmx anaeig tool. These eigenvectors represented roughly 50% of the total conformational freedom, as evidenced by the cumulative contribution of all eigenvectors. Visualization and image generation of the structural conformations and dynamic trajectories were carried out using VMD 1.9.4 [63] and PyMOL 2.3.0 [64].

3. Results & Discussion

3.1. Isolation, Identification, and Recombinant Expression of Amylases
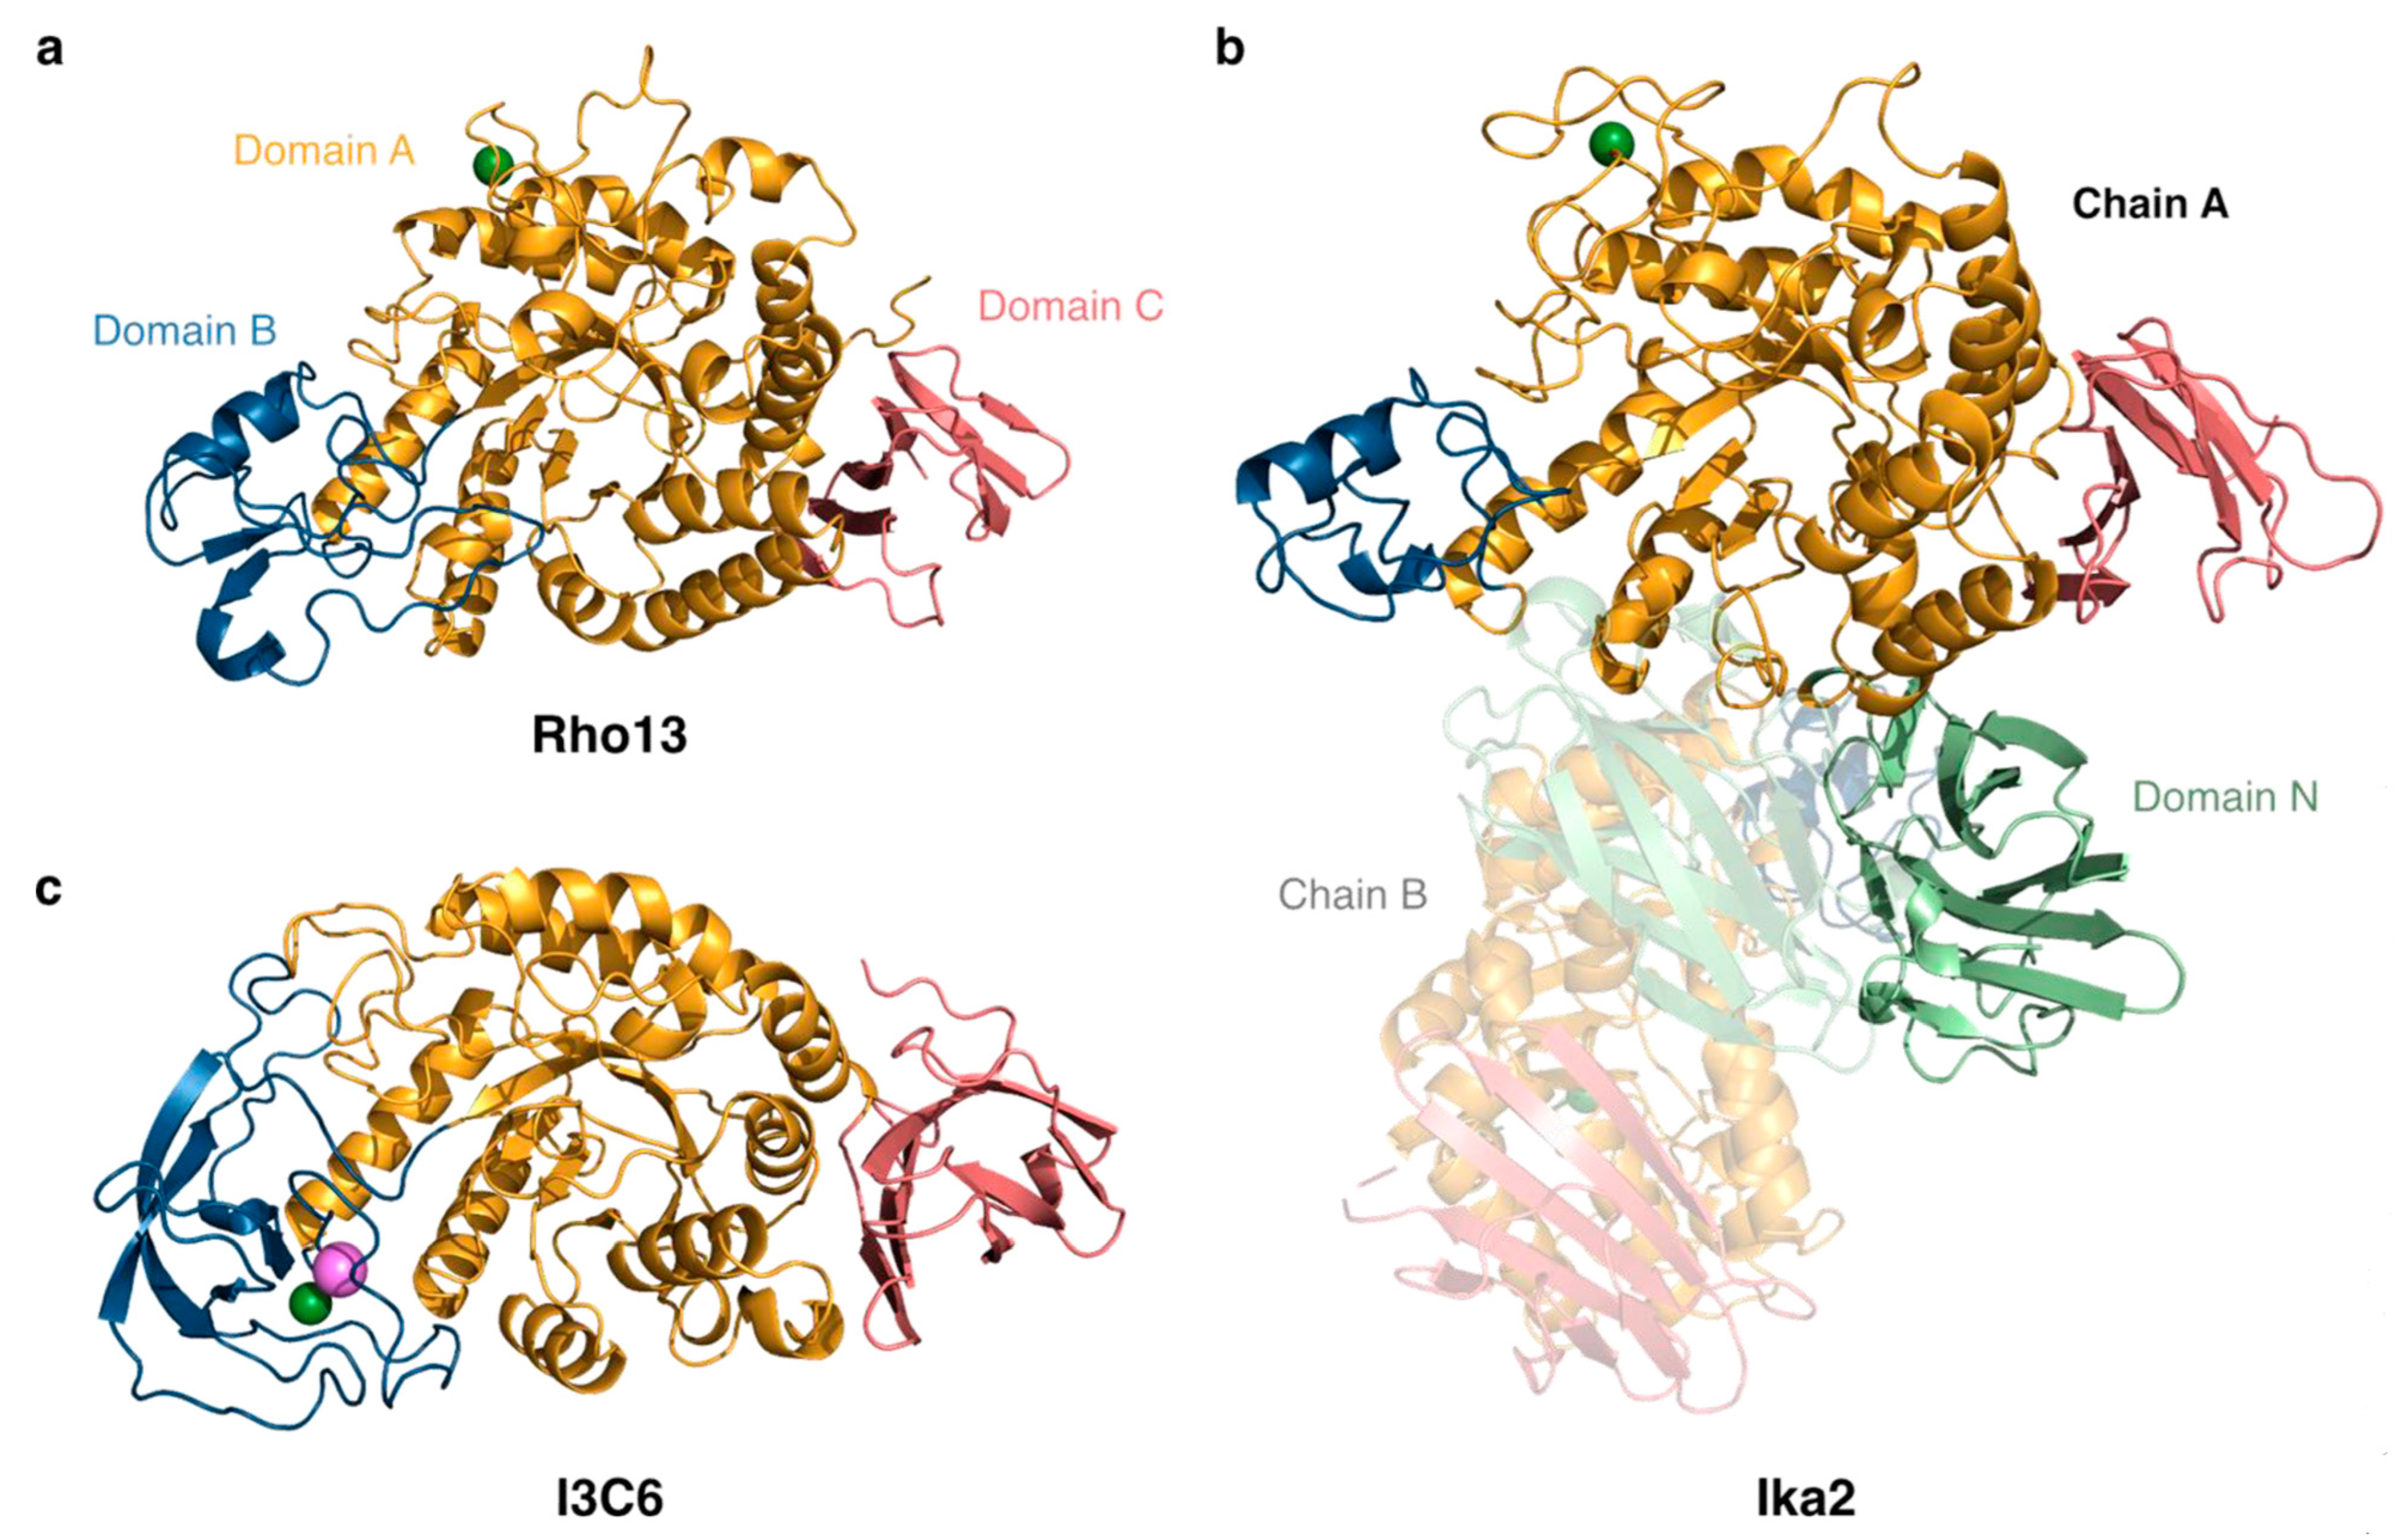
Here we report on the enzymatic and biophysical properties of two new psychrophilic amylases, Rho13 and Ika2, and compare them to our previously reported psychrophilic amylase I3C6 [27]. The predicted structures of all three enzymes are shown in Figure 1. We start by describing how we identified the two enzymes.

3.1.1. Rho13

A putative GH13-family amylase-coding gene (referred to as Rho13) was identified in the published, PROKKA-annotated genome sequence of the cold-active bacterium R. psychrophilum [28,29] identified in ikaite column samples. The gene consisted of 1545 bp, including a 5′-region encoding a 16 amino acid predicted signal sequence. A BlastP search against PDB showed highest similarity to CAZY GH13 subfamily 36, with the highest similarity to an α-amylase from Halothermothrix orenii (pdb: 1WZA) (42.80%) and an amylase from Eubacterium rectale (pdb: 7JJN) (33.53%). The fragment encoding the mature sequence excluding the signal sequence (1497 bp, i.e., 499 residues) was cloned into a pET28 vector encoding a C-terminal His-tag and recombinantly expressed in E. coli BL21(DE3). This allowed us to purify Rho13 on Ni-NTA columns followed by size exclusion chromatography (SEC), leading to single-band purity (Figure 2a).

3.1.2. Ika2

Bacteria-containing material was extracted from ikaite columns in the Ikka Fjord, Greenland, and incubated for 3 months at 5 °C on diluted R2-based substrate containing AZCL-amylose. An amylase-positive bacterial strain was isolated in this way. To identify the gene encoding the active amylase, the bacterial isolate was subjected to full genome sequencing [31], which allowed us to assign the strain to a novel taxon within the Bacillaceae related to Anaerobacillus, Paenibacillus, and Alkalihalobacillus. The PROKKA-annotated genome was mined for putative amylase-encoding genes, and an open reading frame consisting of 1737 bp was identified as a gene potentially encoding a cyclomaltodextrinase, α-amylase, α-glucosidase, or neopullulanase. In a BlastP search against PDB, the translated gene sequence shared highest similarity with four starch-degrading enzymes belonging to the GH13 subfamily 20 (GH13_20), namely a cyclomaltodextrinase (which linearizes cyclodextrins) from Bacillus sp. (pdb: 1EA9) (56.61%) [13], a maltogenic amylase (which releases maltose from starch) from Thermus sp. (pdb: 1GVI) (55.2%) [65], a neopullulanase (which hydrolyzes α-1,4 linkages in pullulan through transglycosylation) from Geobacillus stearothermophilus (pdb: 1J0H, 1J0J) (53.9%) [48], and α-amylase II (which cleaves starch into smaller oligosaccharides) from Thermoactinomyces vulgaris (pdb: 1WZM) (46.5%) [66,67,68]. The sequence similarity was rather low, but starch-degrading enzymes are known to be a highly diverse group [69], and several of them exhibit multiple catalytic activities. For example, maltogenic amylases hydrolyze both α-d-(1,4)- and α-d-(1,6)-glycosidic bonds and exhibit transglycosylation activation on a range of mono- and disaccharide acceptors [65,70]. In silico folding of the putative protein sequence using HHpred showed that it was indeed able to fold into an amylase 3D structure. To verify the amylolytic activity of the identified putative GH13 enzyme (denoted Ika2), the predicted gene was recombinantly expressed with a C-terminal His-tag and purified from E. coli in a manner similar to Rho13 (Figure 2b).

3.2. Structural and Biophysical Analysis of the Amylases

In the following text, we report on the enzymatic activity of the two amylases as a function of temperature, pH, CaCl2, and NaCl, as well as presenting a structural and biophysical analysis in vitro and in silico. We compare them to the psychrophilic amylase I3C6, which was isolated from a metagenomic analysis of ikaite columns and was expressed and purified recombinantly (Figure 2c). This allowed a direct and simple comparison between the psychrophilic properties of the three enzymes. Detailed mechanistic studies providing KM and kcat values will be reported elsewhere in a separate study.

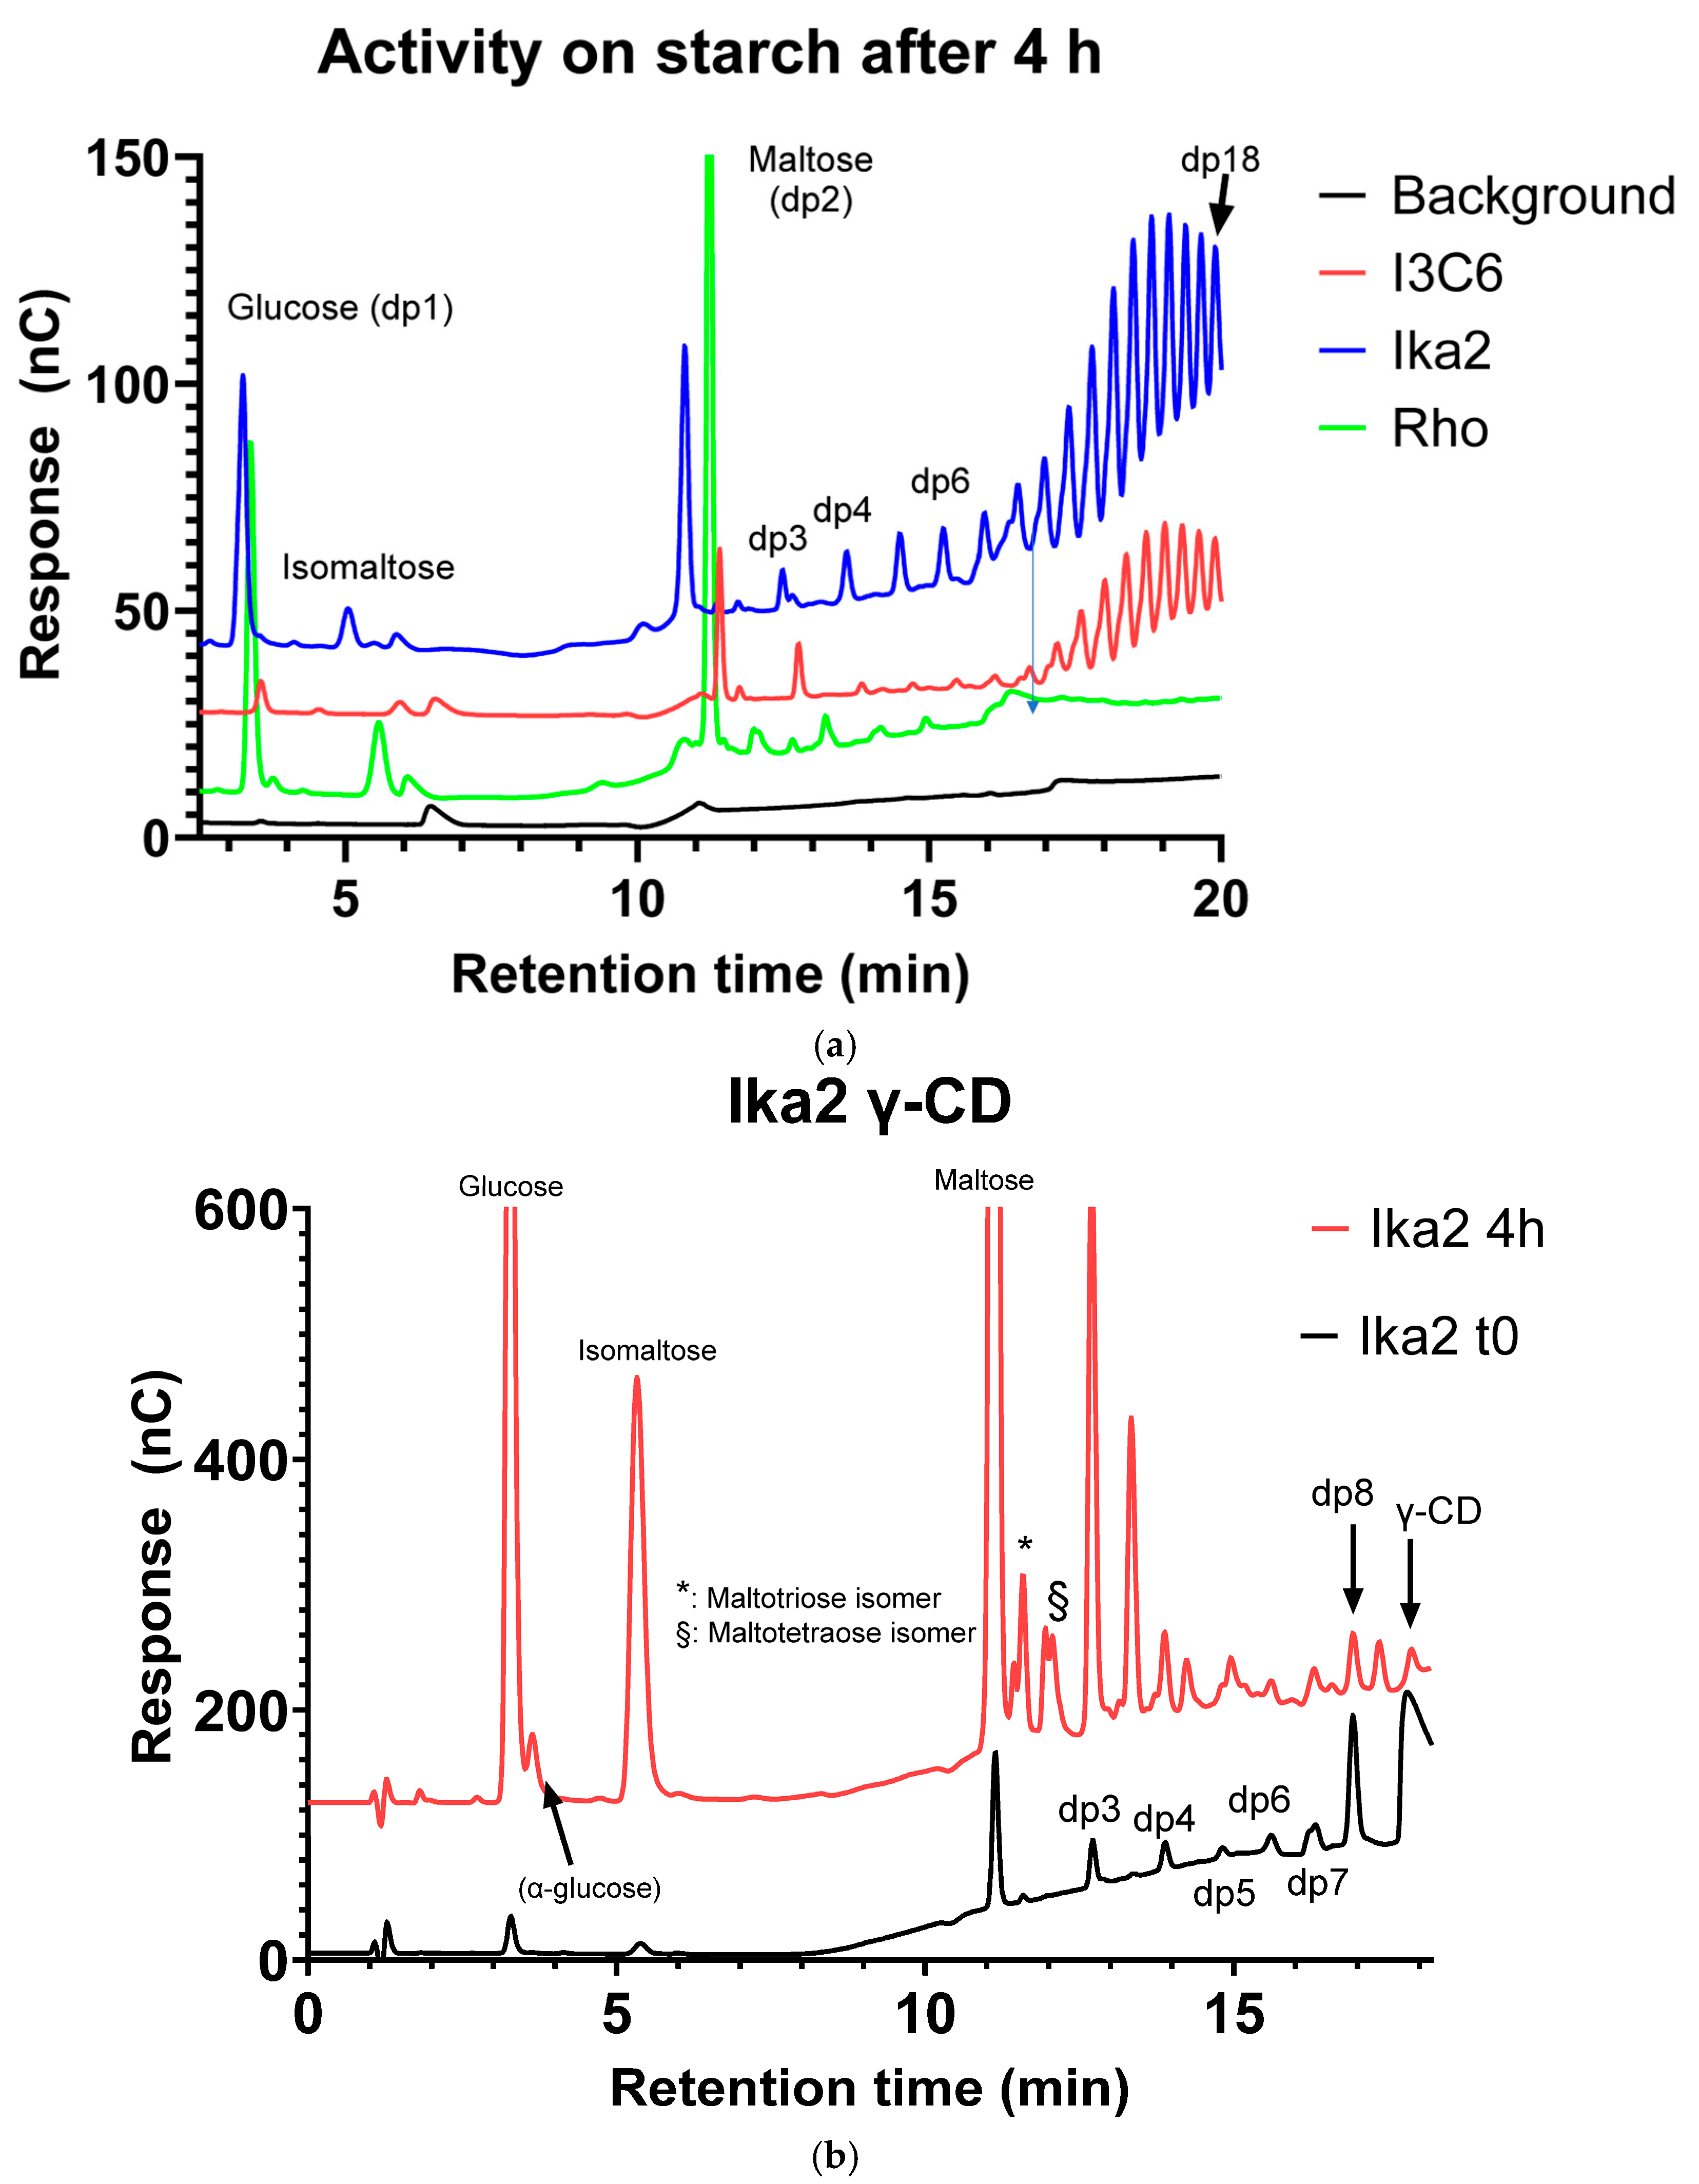
3.2.1. Substrate Specificity and Cleavage Products

We first investigated which carbohydrate substrates were processed and what products were formed by the three enzymes, guided by the activities of the enzymes they had been found to be related to (see previous section). To measure hydrolytic activity, the amylases were incubated with starch or cyclodextrins (β-CD and γ-CD), the products were analyzed by pulsed amperometric detection (PAD), and peaks were assigned as described [71]. In addition, we checked for potential transglycosylation activity by incubating the enzymes with either glucose or fucose (a deoxy sugar in the L conformation) in the presence of a maltooligosaccharide preparation containing maltoheptaose (dp7, where dp is degree of polymerization) or maltohexaose (dp6). For a better overview, representative profiles are shown in Figure 3a–c, while additional PAD elution profiles are shown in Figure S1a–h.

Ika2

After 4 h of incubation, Ika2 hydrolyzed starch to glucose, maltose, and a series of maltodextrins with increasing dp (Figure 3a). In the same period, β-CD was hydrolyzed to glucose, maltose, and maltotriose, as well as smaller amounts of maltodextrins up to dp7 and a product tentatively assigned to isomaltose [72,73] (Figure S1a). A similar pattern was observed with γ-CD (Figure 3b), which was degraded to glucose, maltose, and maltodextrins up to dp8; maltooctaose (corresponding to linearized γ-CD) was degraded further after 4 h incubation. Incubation with fucose and the maltooligosaccharide preparation containing maltoheptaose showed that fucose remained unconverted, while glucose and maltose were formed at the expense of maltooligomers (maltohexaose and -heptaose in particular) (Figure 3c). In addition, products appeared tentatively assigned to isomaltose. Products eluting with retention times between maltose and dp5 are presumably positional isomers of dp3–dp5 and remained after 48 h of incubation, suggesting transglycosylation activity (see arrows in Figure 3c). The degradation of cyclodextrins points to endo activity, and the degradation of starch and malto-oligomers resulted in the formation of glucose as one of the products.

Rho13

Starch was hydrolyzed, and formation of glucose, maltose, and maltotriose was observed, with further degradation of the latter resulting in glucose and maltose as the main products after 4 h of incubation. Unlike Ika2 (and I3C6, see below), maltodextrins with dp> 6 seemed absent. β-CD was degraded to glucose, maltose, and maltotriose, as well as small amounts of maltotetraose (Figure S1b). γ-CD was degraded to glucose, maltose, and maltooligosaccharides of dp3–7 after 4 h of incubation (Figure S1c), as well as positional isomers of maltose (isomaltose), maltotriose, and maltotetraose, though the distribution of dp3–4 isomers differed subtly from that of Ika2. Overall, γ-CD seemed a better substrate than β-CD, given the larger concentrations of products. Incubation with glucose and a maltooligosaccharide preparation primarily containing dp4–6 showed only a small increase in glucose concentration but a significant production of maltose with degradation of maltooligomers already after 4 h, with maltotriose being produced after 4 h but degraded after 48 h (Figure S1d). Rho13’s degradation of cyclodextrins also indicates endo activity, like Ika2, though the ability to degrade maltotriose and maltotetraose illustrates a degree of exo activity as well.

I3C6

No activity of the enzyme was observed on cyclodextrins compared with the zero-time sample (Figure S1e,f). There was a lower level of starch degradation than with Ika2, consistent with the low general activity of I3C6. When glucose was co-incubated with maltoheptaose, a dramatic reduction in glucose was observed with a simultaneous increase in maltose, but there was no detectable change in maltoheptaose (Figure S1g). While combined incubation with fucose and maltoheptaose showed no significant change in fucose (eluting around 2 min), maltoheptaose was degraded to smaller maltooligomers, including maltose but not glucose (Figure S1h). Given I3C6’s modest activity on starch and the lack of degradation of the cyclodextrins, our investigation suggests that this enzyme has little endo activity but a preference for degradation of maltoheptaose in the absence of glucose.
In summary, the three enzymes showed distinct profiles towards different carbohydrate substrates, with variable levels of hydrolytic activity towards starch, cyclodextrins, and maltooligosaccharides, and only Ika2 showing evidence for transglycosylation activity.

3.3. Ika2 Forms a Stable Dimer, While Rho13 and I3C6 Are Mainly Monomeric

The three enzymes showed different elution behaviors on a size exclusion column (Figure 2). Rho13 eluted with two major peaks, both of which corresponded to the pure protein according to SDS-PAGE. Both peaks could be fitted to single Gaussian curves (Figure 2a). Based on calibration of the column with proteins of known size, the first peak had a retention volume corresponding to a dimer, and the second that of a monomer (Figure S2). The dimer and monomer peaks corresponded to 26% and 74% of the combined peak area respectively, and both peaks showed significant enzymatic activity (based on measuring the formation of reducing ends in an MBTH assay [74]). Ika2 eluted as a single peak, though this was slightly skewed (Figure 2b). The observed peak top around 13 mL predicted a molecular weight of 92 kDa, lying between the monomeric and dimeric values of 69 and 138 kDa, respectively. This suggests a dynamic equilibrium between monomer and dimer, which exchange too rapidly to elute as separate peaks. I3C6 also showed a major peak preceded by a broad but low plateau (Figure 2c). Only the major peak (which corresponded to 84% of the total elution area) showed significant activity. The peaks eluting prior to the main I3C6 peak were smaller, but bands corresponding to monomeric I3C6 were reproducibly observed by SDS-PAGE in the corresponding lanes (Figure 2c), and we therefore attributed them to nonspecific aggregates or oligomers of I3C6 that dissociated during SDS-PAGE.
To elucidate the oligomerization states of the proteins more directly, we recorded the SAXS curves of the three enzymes (Figure 4a, Table 1). For I3C6, the radius of gyration (Rg) increased with protein concentration (Figure 4b). We attribute this to nonspecific aggregation, since the SAXS data could not be fitted to a mix of monomers and dimers. In contrast, the Rho13 data were best fit by a combination of the AlphaFold-predicted structure for the monomer and the symmetry-built dimer. Furthermore, all concentrations could be described using the linear combinations of the models with some deviation at higher concentrations, suggesting a dimerization equilibrium of Rho13 (Figure 4b), as expected from the SEC data. The SAXS curves for Ika2 were fitted using an AlphaFold-predicted Ika2 dimer. This led to a value of Rg independent of concentration and consistent with the Rg calculated for a dimer. Dimerization is a common feature for many of Ika2’s closest homologs (54–57% identity): amylase from Thermus sp. (PDB: 1SMA) is a dimer [65], cyclomaltodextrinase from Bacillus sp. (PDB: 1EA9) is a dodecameric hexamer of dimers [13], and neopullulanase from Geobacillus stearothermophilus (PDB: 1J0H) is also a dimer [48]. In addition, 8 of the 10 published structures in GH13_20 form dimers.

3.4. Activity Profiles as a Function of Temperature, pH, and Ca2+

Enzymatic activity (hydrolysis of starch) under a range of different conditions was determined using the MBTH assay, which measures formation of reducing carbohydrate ends. The organisms from which the three enzymes were obtained all live in a cold environment, that is a mixture of seawater and alkaline spring water, making it reasonable to expect that they would prefer an alkaline and modestly saline environment with a low optimal temperature. We therefore examined the impact of temperature, pH, and salt.

3.4.1. Temperature

All three enzymes were preincubated at a given temperature for 15 min, after which product formation was measured from a linear increase in product signal over a 5.5 min period (see typical examples in Figure S3a). Measured in terms of specific activity (moles reducing ends formed per minute per mole enzyme) at pH 7.5, Rho13 is an order of magnitude more active than the two other enzymes (Figure 5a): on average 30- and 15-fold more active than Ika2 and I3C6, respectively. However, when normalized to each enzyme’s maximal activity, the thermal profiles of the three amylases were similar, with optima of 30–35 °C (Figure 5b) and significant activity below 20 °C. Ika2 showed particularly pronounced psychrophilic properties, with 50% maximal activity at 5 °C, as well as being the most thermostable, with 40% activity remaining at 55 °C. However, all three enzymes can be classified as psychrophiles, with significant activity below 20 °C.

3.4.2. pH Profile

Rho13 and I3C6 showed a clear preference for higher pH, with optimal activity around pH 8–9. However, they differed in their alkaline sensitivity: I3C6 was completely inactive at pH 9.5, while Rho13 still showed 78% activity at this pH. In contrast, Ika2 was markedly acidophilic (despite its origin in ikaite columns), with a marked decline in activity from pH 6 up to pH 8 (Figure 5c). At pH 6, Ika2 activity was increased ca. 3.3-fold compared to at pH 7.5, while that of Rho13 decreased ca. 7.5-fold, making Ika2 ~1.5-fold more active than Rho13 at pH 6, while the absolute activity of Rho13 at its optimal pH of 8.0 was still at least 7-fold higher than that of Ika2 at pH 6. Thus, Rho13 is overall significantly more active than the two other enzymes.

3.4.3. Salt Profile

All three enzymes are reasonably halotolerant, though Ika2 and I3C6 showed some decline in activity at >150 mM NaCl (Figure 5d).
In summary, the three enzymes all showed significant activity at low temperatures, peaking slightly above ambient temperatures, but showed individual variations in terms of sensitivity to pH and ionic strength. Ika2 had the broadest temperature profile and only moderate dependence on salt, but its preference for low pH makes it less appealing as a detergent enzyme, given the preference for alkaline conditions in, for example, laundry washing [21]. Here Rho13 has the advantage of a strongly alkaliphilic profile, as well as a robust indifference to ionic strength, though its activity declines more steeply with lowered temperature than does that of Ika2. I3C6 has the weakest attributes, with low specific activity, complete abolition of activity at > pH 9.0, and a slow decline in activity with ionic strength. As a final differentiator of activity, we turned to the impact of Ca2+ on enzyme activity.

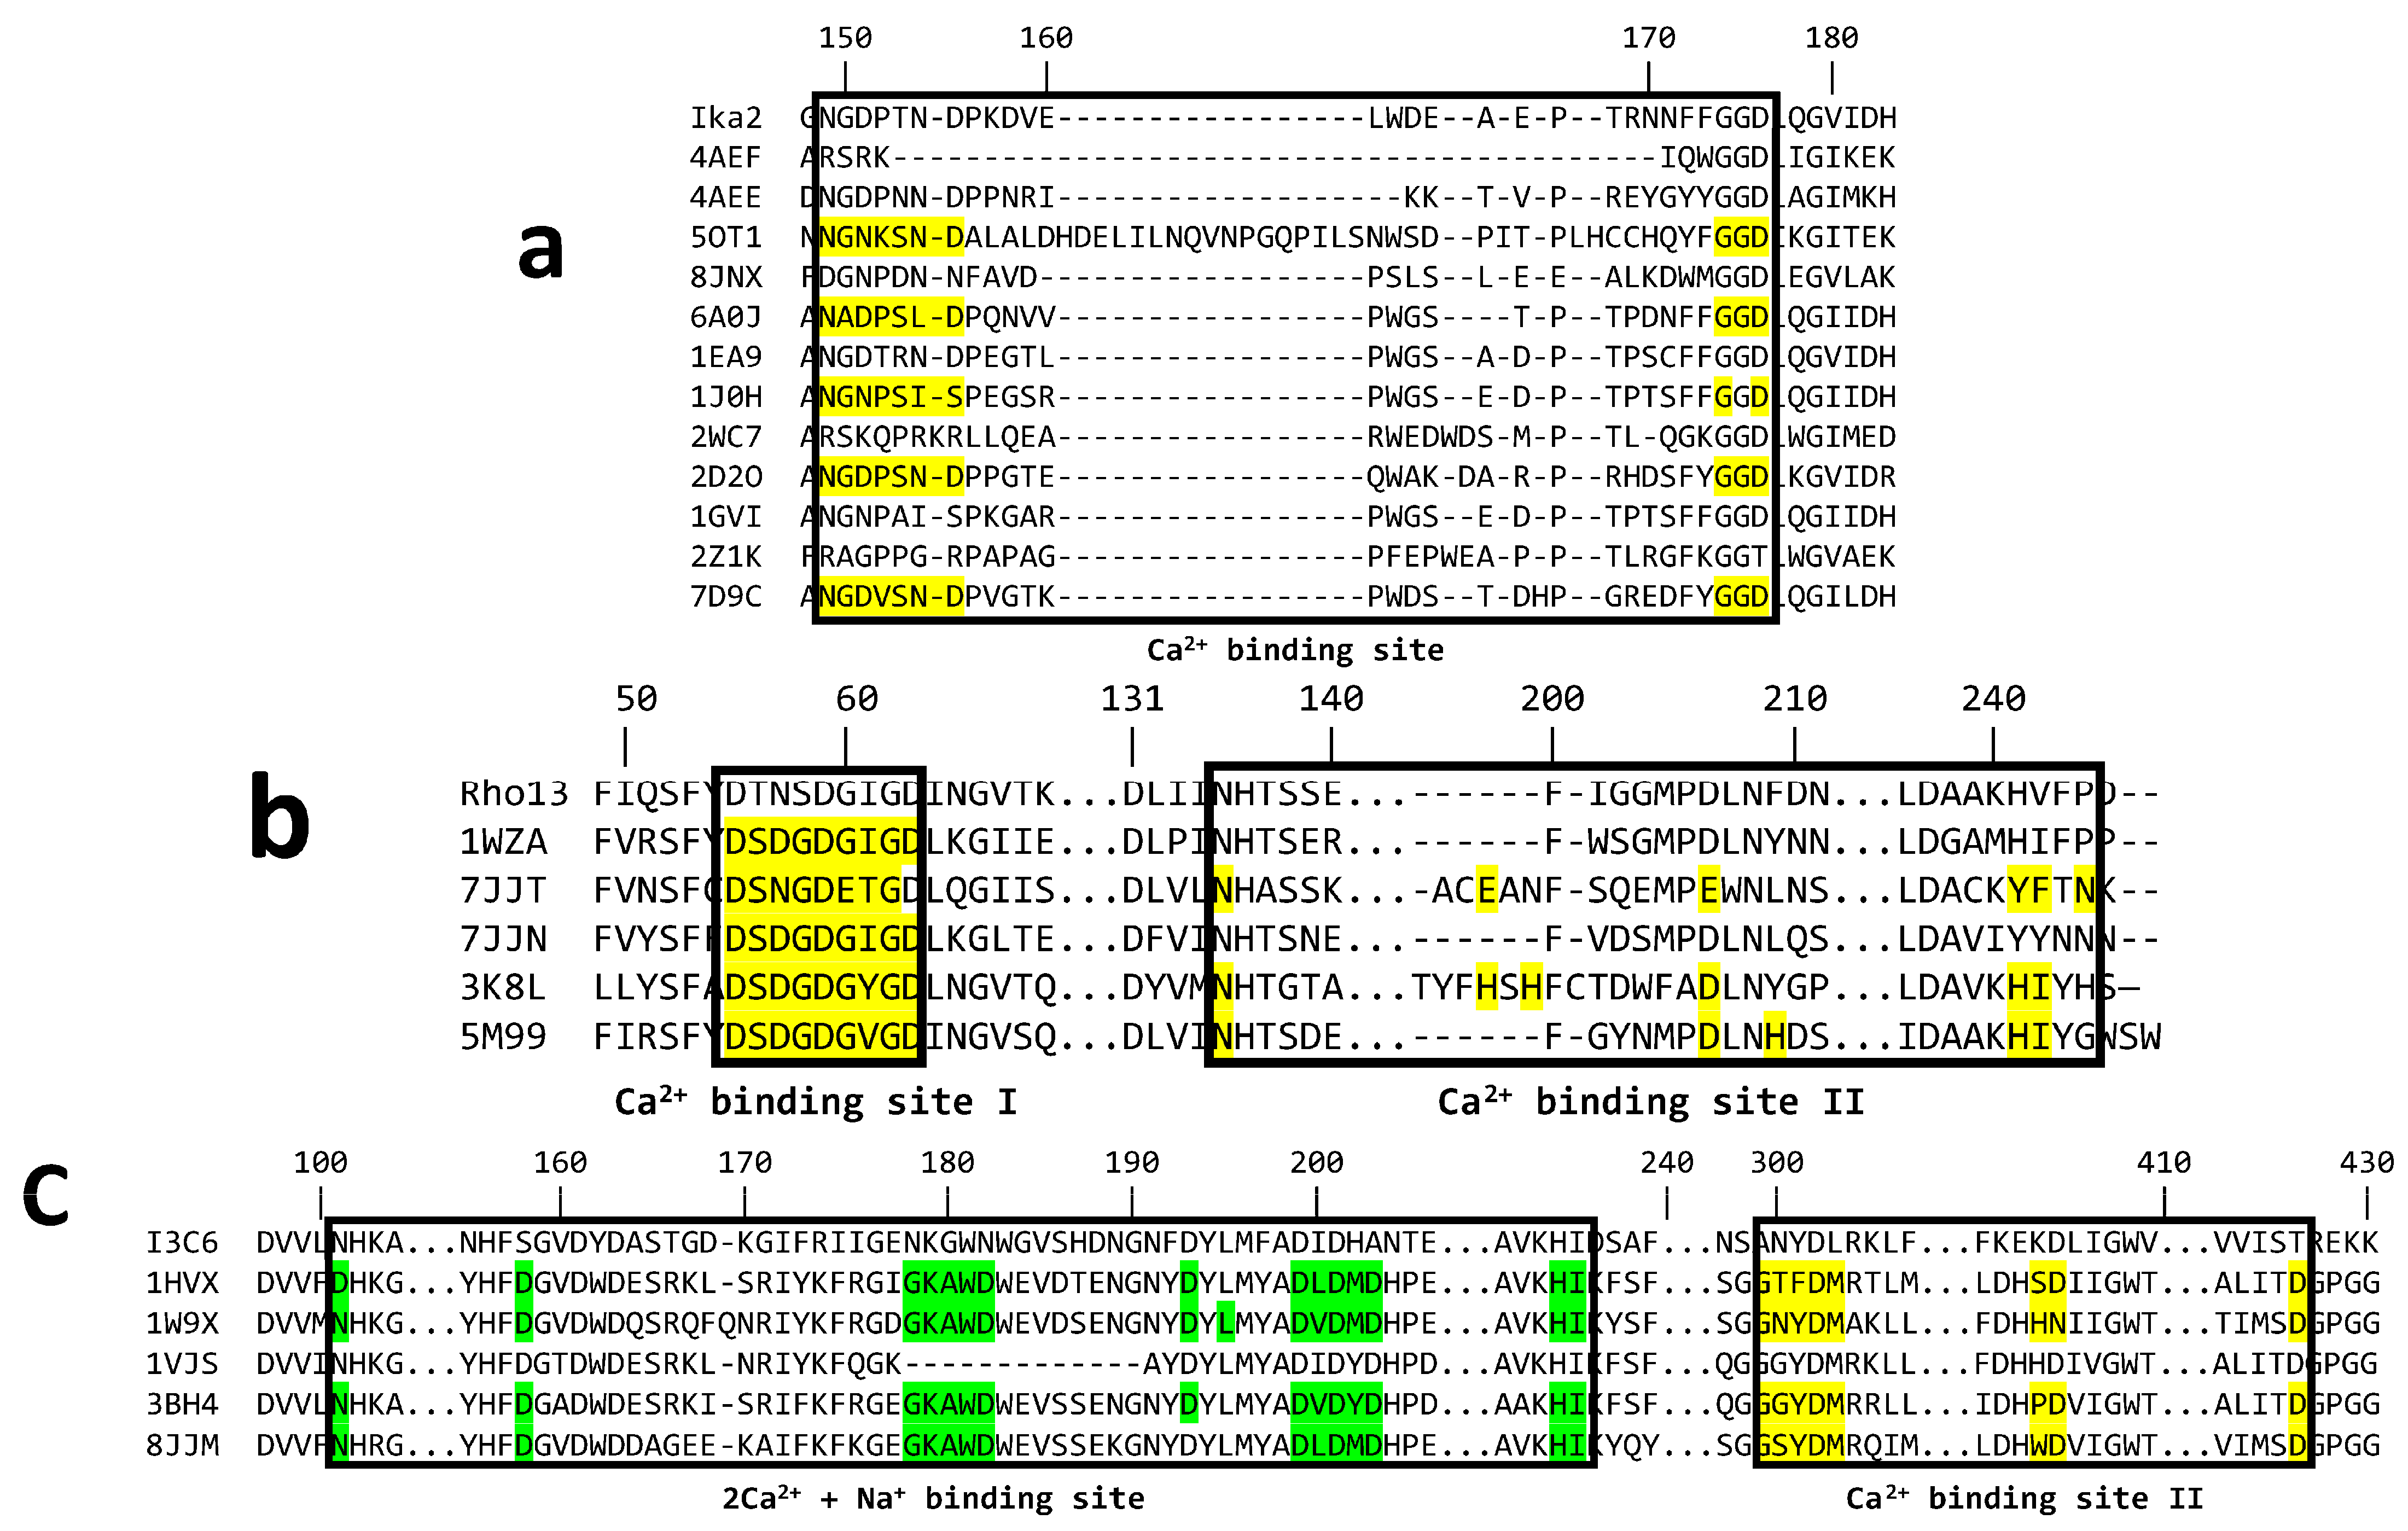
3.4.4. Analysis of Ca2+ Binding of Ika2, Rho13, and I3C6

As we will describe in detail below, there is good reason to expect Ca2+ to bind to all three enzymes and affect their activity and stability. Accordingly, in the following section we describe the experimental effect of Ca2+ ions on the activity, structure, and stability of the three enzymes and then examine the structural basis for the role of Ca2+ based on computational analysis. Activity was measured by MBTH assay (Figure 5e), structure by far-UV circular dichroism (CiD, Figure 6a), and thermal stability either through changes in the proteins’ secondary structure by CiD (Figure 6b) or tertiary structure by differential scanning fluorometry (DSF) (Figure 6c). CiD data could in all cases be fitted with a three-state model, involving the native state N, a partially denatured intermediate state I, and a denatured state D. Where possible, data from 21 different wavelengths (210–230 nm in steps of 1 nm) or 9 different wavelengths (Ika2 with no EDTA) were fitted globally to obtain the melting temperatures for the two transitions (N-to-I and I-to-D). The results are summarized in Table 2 and described in detail below.

Ca2+ Has Little Effect on Ika2 Activity, but Rho13 and I3C6 Follow a Bell-Shaped Dependence

Ika2 showed no increase in activity upon the addition of Ca2+ up to 20 mM, but rather a slight decline (Figure 5e). For this reason, activity was determined in the presence of EDTA, which had no significant influence on activity, suggesting that Ca2+ has no positive effect on activity (Figure S3b, time profiles in Figure S3c). In contrast to Ika2, the addition of Ca2+ to both Rho13 and I3C6 shows a bell-shaped curve with an activity optimum around 2.5 mM CaCl2 (Figure 5e). The positive effect of Ca2+ on activity can be seen directly in the time profiles when adding either EDTA or CaCl2 at different time points (Figure S3c). The activity data can formally be fitted to a model in which the first, somewhat weak, binding step (inflection point ca. 0.5 mM) increases activity and the second, even weaker, binding step (inflection point ca. 8–20 mM) decreases it. The decline in activity at higher Ca2+ concentrations is indicative of nonspecific inhibition, seen for numerous other enzymes. In the case of Rho13, we speculate that this second binding event might involve consensus sequence 2 (CS2, see below), since Ca2+ binding here would increase rigidity and lower activity.

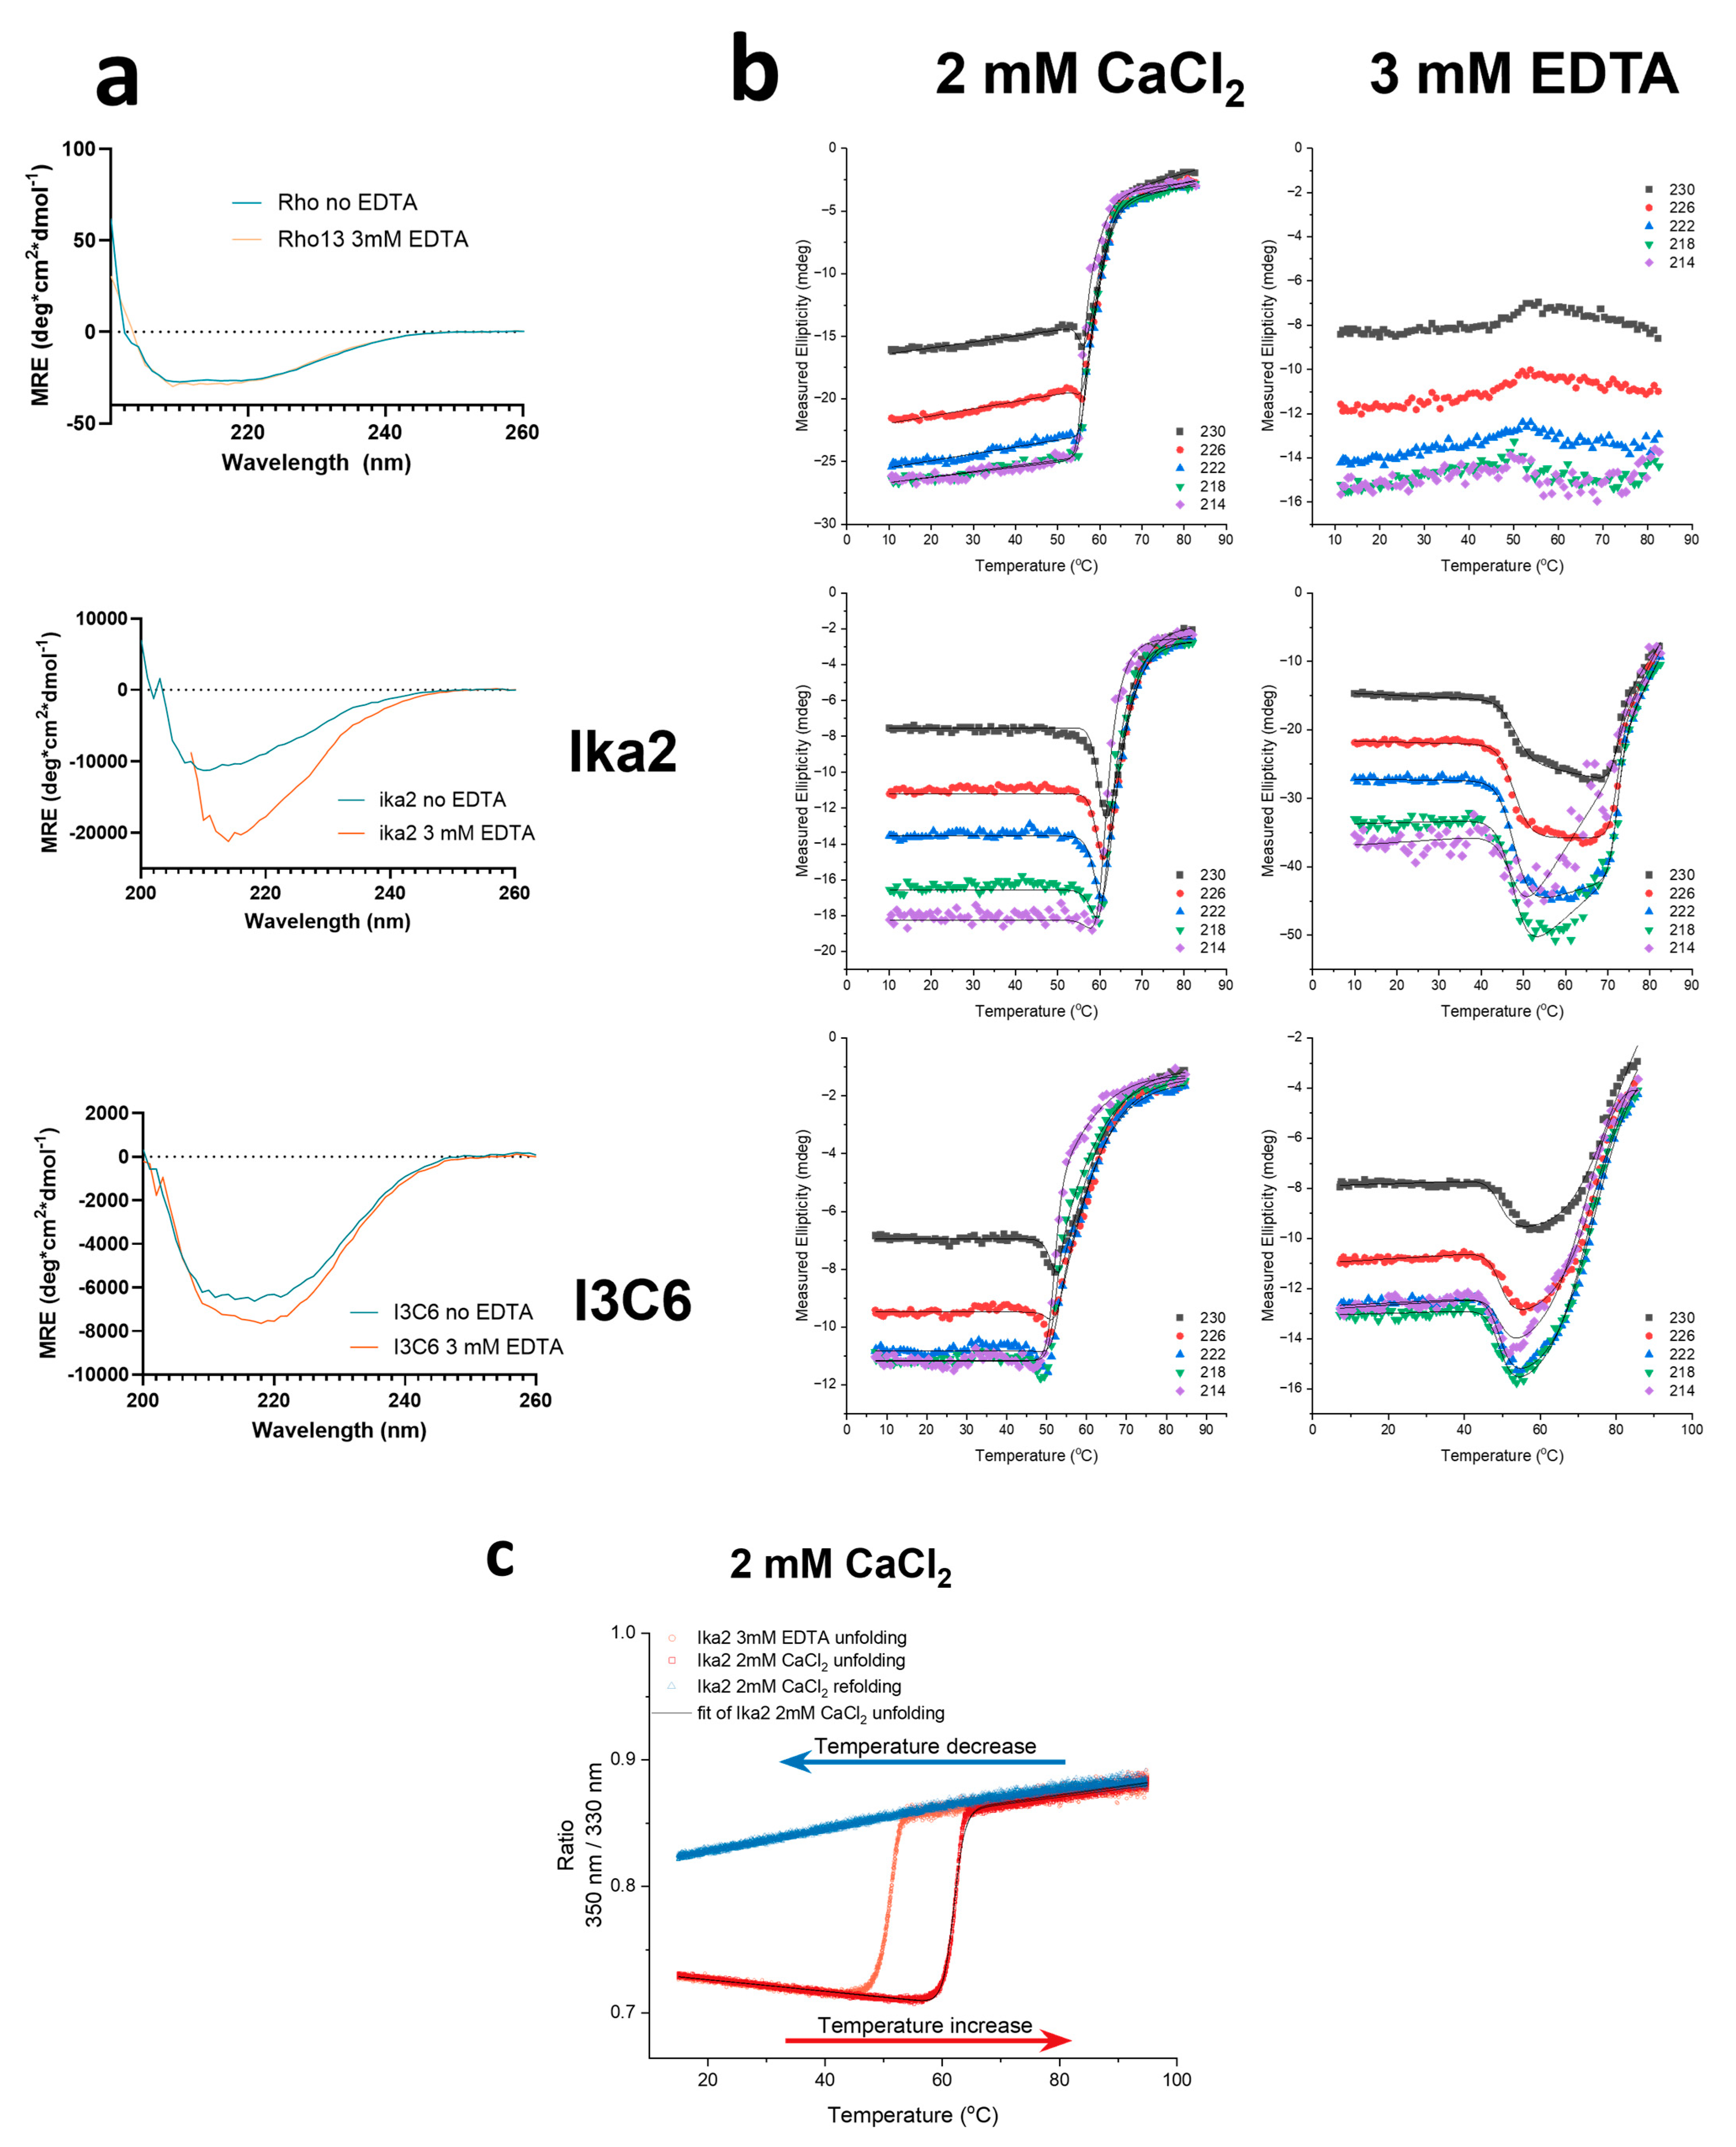
Removal of Ca2+ Affects Enzyme Structure and Reduces Stability

  • Rho13
Thermal denaturation by far-UV CiD in the absence of EDTA showed a gradual redshift from a 222 nm peak to a flatter curve from around 53 °C onwards (Figure 6b). The shift was fitted in OriginPro2024 to a three-state unfolding model, with the first transition corresponding to a global denaturation and the second interpreted to nonspecific aggregation. This first unfolding step showed a tm of 55.98 ± 0.04 °C, and the second 58.32 ± 0.14 °C. Consistent with this, DSF showed a transition of 55.215 ± 0.007 °C, with no reversibility of unfolding (Figure S4). The tm was significantly above the temperature optimum of 35 °C (Figure 5b). Activity declined steeply above 45 °C. This suggests local unfolding of the enzyme that presumably involves the active site, thus leading to the thermal inactivation of Rho13 observed in the MBTH assays. There was no significant change in the far-UV CiD structure of Rho13 with or without EDTA (Figure 6a), but the enzyme showed a significantly changed CiD unfolding curve (Figure 6b), suggesting the existence of a structurally important Ca2+ binding site. Consistent with this, DSF showed that EDTA lowered the tm by 2 °C.
  • Ika2
While EDTA did not affect Ika2’s activity (Figure 5e and Figure S3b,c), it significantly altered the enzyme’s secondary structure according to far-UV CiD (Figure 6a). The major minimum around 208 nm was redshifted, and the intensity was amplified. This suggests a Ca2+ binding site, which is structurally important, as seen in the effect on stability, but with a deleterious effect on activity above 1 mM CaCl2 (Figure 5e). The thermal denaturation data could not be fitted with great confidence due to visible aggregation at these high temperatures. Nevertheless, an acceptable fit was made, predicting two consecutive tm values of 57.2 °C and 62.1 °C in 2 mM CaCl2 (Table 2), which change to 47.8 °C and 72.2 °C in EDTA; the second transition is likely aggregation. DSF, which monitors changes in Trp fluorescence and thus reports on the global structure, showed a single melting transition with a midpoint of 62.0 °C, which fell dramatically to 50.8 °C in EDTA (Figure 6b and Table 2). Thus, in CaCl2, the secondary and tertiary structure are both lost around 57–62 °C, well above the optimal activity temperature of 30 °C.
  • I3C6
Thermal unfolding of I3C6 as measured by CiD and DSF showed tm values of 52.47 °C (first transition) and 55.40 °C, respectively (Figure 6b,c). EDTA had a small effect on the far-UV CiD spectrum, which is likely due to concentration differences and does not show any spectral shifts (Figure 6a). Surprisingly, the CiD-measured tm increased by 3 °C to 55.7 ± 0.25 °C upon the addition of EDTA. This is likely not significant, as the DSF-based tm values with and without EDTA were reversed compared to those seen with CiD (Table 2).
In summary, the three enzymes differ significantly in their dependence on Ca2+ for stability and activity, and the two phenomena are not correlated. Ika2’s activity is unaffected by Ca2+, but its removal markedly destabilizes the enzyme; conversely, I3C6 and Rho13 both show optimal activity around 2.5 mM Ca2+, but are destabilized to very different extents. Clearly, they must differ considerably in their interactions with Ca2+.

3.5. Computational Analysis of Ca2+ Binding to the Three Enzymes

Having shown that Ca2+ has a profound but complex effect on the three amylases, we now turn to computational analysis of the potential interactions involved.

3.5.1. Ika2 Shows No Evidence of Stable Ca2+ Binding

GH13_20 enzymes such as Ika2 often have a metal binding site. Five PDB crystal structures from this family show a bound Ca2+ and share high sequence preservation in this region (Figure 7a), which involves the amino acid motif NGDPSND---GGD (with metal ion coordination by the Asp residues). The two closest homologs of Ika2 (1GVI and 1EA9) have no assigned Ca2+ in their crystal structure (possibly due to loss during purification and crystallization), though they retain this Ca2+ binding motif. We note that the Ca2+ binding site is not completely conserved in the GH13_20 family. Thus, 2Z1K, 2WC7, and 4AEF have mutations among the coordinating residues; in addition, in 4AEF the sequence Q224-Y233 is not modelled, indicating a lack of metal coordination. Given Ika2’s almost complete conservation of the Ca2+ binding motif (Figure 7a), it would be expected to bind Ca2+; nevertheless, Ca2+ had hardly any effect on Ika2 activity (Figure 5e). MD simulations corroborated these observations. They showed only an increase in the average RMSD and RMSF values of 0.2 Å and 0.1 Å, respectively, in 1.2 μs trajectories conducted with and without Ca2+. This suggests that the absence of Ca2+ at best slightly increases the flexibility of Ika2. As summarized in Figure S5, a comparative analysis of the per-residue RMSF values revealed that only 24 residues, representing 2% of the dimer, exhibited increased fluctuations above the threshold of 0.5 Å in the trajectory without Ca2+. Moreover, half of those residues are located at or near the Ca2+-binding sites, and only five are located near the active site cleft, indicating that the absence of Ca2+ should not have a major impact on residues involved in substrate interactions. This further supports our experimental finding that the absence of Ca2+ does not have a negative impact on catalytic activity (Figure 5e). Similar observations were noted in the Ika2 homolog neopullulanase (PDB code 1J0H), where Ca2+ is proposed to be non-essential for catalysis [48].

3.5.2. Rho13 Likely Has One Ca2+ Binding Site

Solved structures of homologs of Rho13 in the GH family 13_36 have varying numbers of preserved Ca2+ binding sites. To the best of our knowledge, Rho13 has two consensus sequences (CSs): CS1 (DSDGDGTGD) (Figure 7b) and CS2 (VINH---PDL---(HI)/(YF)), identified in 3K8K, 7JJT, and 5M99, at the interface of three loops close to the active site. The α-amylase from Halothermothrix orenii (PDB: 1WZA), Rho13’s closest homolog, shares these two consensus sequences, but only CS1 is occupied by Ca2+. A second Ca2+ in 1WZA is lodged in a second Ca2+ binding loop (residues 65–77), a structural element that is also observed in 7JJT, but that binding loop does not exist in Rho13’s structure. Therefore, our computational structure of Rho13, used in subsequent MD simulations, contains a single Ca2+ ion (Figure 1a), which was transferred from the 1WZA homolog to the first conserved Ca2+ binding site of Rho13 after a structural alignment of both structures.

3.5.3. I3C6 Only Maintains One Stably Bound Ca2+ Ion

I3C6 was previously reported to have increased activity when CaCl2 is added [27], and several I3C6 homologs in the GH family 13_5 have been shown to contain multiple binding sites. The amylase from Bacillus stearothermophilus (PDB: 1HVX) has a generally preserved Ca2+(I)-Na+-Ca2+(II) binding site with three ions in a line, and a third Ca2+(III) binding site is located at the interface of two structural domains. Accordingly, we computationally transferred the Ca2+(I)-Na+-Ca2+(II) triad and the Ca2+(III) ion from the 1HVX homolog to the I3C6 structure predicted by AlphaFold (Figure S6a) and conducted MD simulations to better understand the Ca2+ binding of this psychrophilic enzyme. Interestingly, our simulations revealed that only Ca2+(I) and Na+ ions remained in their binding sites, whereas Ca2+(II) and Ca2+(III) abandoned their original positions throughout the simulations (Figure S6b). This may have resulted from existing differences in the amino acid composition of the Ca2+ binding sites between the psychrophilic enzyme and its homolog. While the Ca2+(I)-Na+-Ca2+(II) binding site of 1HVX exhibits seven Asp residues (D105, D162, D186, D197, D203, D205, and D207), the same region of I3C6 only presents three (D195, D201, and D203) (Figure S7a). Consequently, the number of ionic interactions established between the ions and the residues of the binding site is much smaller in I3C6, resulting in looser binding of the Ca2+(I)-Na+-Ca2+(II) triad. Among the three cations, Ca2+(II) established fewest interactions with I3C6 and was most exposed to the solvent, thus explaining its rapid release from the binding site in all simulation attempts. This may also explain the escape of Ca2+(III) from its initial position in the MD simulations conducted with I3C6. The region surrounding the transferred Ca2+(III) ion contains fewer Asp residues (one in I3C6 vs. two in 1HVX) and includes two positive amino acids, K405 and R429, that correspond to S406 and G431 in the 1HVX homolog, respectively (Figure S7b). The increase in the positive character of this region makes it less likely to accommodate the Ca2+(III) which, without good binding contacts, easily leaves the binding site. In sum, the simulations suggest that only a single Ca2+ ion can persistently bind the I3C6 structure, and this was used for all subsequent MD runs performed with this psychrophilic enzyme.

3.6. Psychrophilic Features of the Three Amylases Analyzed by MD Simulations

Psychrophilic enzymes exhibit distinct structural and dynamic features that allow them to operate effectively in cold environments [2]. Compared to their mesophilic homologs, psychrophilic enzymes are characterized by increased structural flexibility, which is often linked to a lower number of Pro residues, fewer ionic and polar interactions, an increased presence of Gly residues, and enhanced solvent accessibility [75]. Collectively, these factors reduce the energy barriers for molecular movement at lower temperatures and influence activation free energy by respectively decreasing and increasing enthalpic and entropic contributions. According to transition state theory, this adjustment is advantageous, as enthalpy-driven reactions decrease exponentially with temperature reduction, while entropic contributions remain unaffected by temperature changes [76,77]. Nonetheless, excessive flexibility in regions unrelated to catalysis will not alter the enthalpy term, but will elevate the entropic barrier. This can be mitigated either by increasing local rigidity in noncritical regions that do not affect catalytic movements or by concentrating enhanced flexibility in areas relevant to catalysis (albeit not necessarily at the active site) [76,77].
To better understand the conformational dynamics of the Rho13, Ika2, and I3C6 psychrophilic amylases, we conducted MD simulations with these three enzymes and with their respective thermophilic homologs (1WZA, 1HVX, and 1J0H). We evaluated the RMSD of backbone atoms along the concatenated 1.2 μs trajectory for the six amylases, using the minimized structure of each enzyme as a reference. The average RMSD values for the psychrophilic enzymes consistently exceeded those observed for the respective mesophilic counterparts (Table 3), indicating that the cold-active enzymes are less stable than their corresponding homologs. This aligns with what is hypothesized in the literature [75,78]. Specifically, the I3C6 vs. 1HVX pair showed the largest variance (0.6 Å), while Rho13 vs. 1WZA displayed the smallest difference (0.2 Å). Additionally, the standard deviation of the presented RMSD values was consistently higher in the psychrophilic enzymes, suggesting more pronounced structural fluctuations.
We performed a structural comparison of the psychrophilic enzymes and their mesophilic homologs by evaluating the Rg, SASA, and intra-protein hydrogen bond count throughout the concatenated 1.2 μs simulations. Our findings revealed a lower average number of intra-protein hydrogen bonds and an increased average Rg value for Rho13 and I3C6 (Table 3), suggesting a weakening of stabilizing interactions and overall less compact structures compared to their mesophilic counterparts. In contrast, Ika2 showed similar values for hydrogen bonds and Rg relative to its homolog, potentially attributable to its dimeric nature, which may influence these metrics. Nonetheless, Ika2 exhibited a 10% decrease in the average number of salt bridges compared to its mesophilic counterpart, which also points to a disruption of stabilizing interactions. All three psychrophilic enzymes demonstrated higher average SASA values (Table 3), underscoring a trend toward decreased compactness and improved interactions with the solvent.
RMSF values (i.e., levels of structural changes during MD simulations) for the three psychrophilic enzymes and their mesophilic counterparts reinforced our findings on psychrophilic conformational dynamics (Figure S8). The RMSF values of the backbone consistently indicated an overall increase in the structural flexibility of psychrophilic enzymes compared to the mesophilic variants (Table 3). However, drawing significant conclusions from average RMSF values can be challenging. To gain deeper insights, we delved into residue-specific flexibility by comparing the RSMF values of corresponding residues between each psychrophilic enzyme and its mesophilic counterpart, using a ±0.5 Å threshold to identify notable changes in the flexibility of each residue. The cold-adapted amylases exhibited a larger number of residues exceeding this threshold (Figure 8a–c, represented by magenta sticks), indicating that larger portions of the psychrophilic enzymes have increased flexibility relative to their mesophilic homologs.
Ika2 displayed 111 residues with at least a 0.5 Å increase in RMSF values compared to their corresponding residues in the 1J0H homolog (Figure 8b), constituting approximately 10% of the enzyme, which indicates enhanced global flexibility. Conversely, 16 residues exhibited a >0.5 Å decrease in flexibility, indicating targeted increases in rigidity. Interestingly, the flexibility distribution varied between the two chains of the enzyme. Among the residues with increased flexibility, 76 were located on chain A and 35 on chain B, whereas increased rigidity was more pronounced in chain B with 13 residues, compared to only 3 in chain A. A domain-specific analysis revealed that 40% of the residues with increased flexibility are located within domain N (Figure 8b), which is crucial for defining the active site cleft and is known to undergo substantial structural rearrangements upon substrate binding in the homolog neopullulanase [48]. This suggests a potential role for this domain in enhancing substrate interaction at low temperatures. Domain A, which contains the common (β/α)8-barrel motif found in amylase family enzymes, and together with domain N forms the active site cleft, accounted for 32% of the residues with increased flexibility (Figure 8b). Conversely, domain B had the lowest percentage of residues with increased flexibility (2%) and the highest percentage (56%) of residues with increased rigidity (i.e., residues whose RMSF is >0.5 Å below the RMSF of the equivalent residues of the mesophilic homolog enzyme—Figure 8b, represented by yellow sticks), underscoring its potential role in maintaining structural integrity near the catalytic site. Domain C, which is the farthest from the active site and features solvent-exposed mobile loops, exhibited 27% of residues with increased flexibility. Of note, 17 of the 111 residues that showed increased flexibility are in important positions for substrate recognition and interaction, as identified in substrate–enzyme complex structures of the homolog (PDB codes 1J0I, 1J0J, and 1J0K). Notably, none of the catalytic residues in Ika2, i.e., the critical D330/E359/D426 triad and others promoting relevant ionic and polar interactions for catalysis (Y209, H249, R328, H425, D470, and R474), showed increased flexibility, in accord with the literature [75,77].
Rho13 and I3C6 have 21 and 30 residues, respectively, with increased flexibility compared to the matching 1WZA and 1HVX homologs (Figure 8a,c, represented by magenta sticks). Most of these residues are in domain A (nearly 57% of all residues with increased flexibility), specifically in the region that forms the active site cleft, as also observed for the Ika2 amylase. We believe that the enhanced dynamics of this area may give the psychrophilic enzymes easier access to the substrate and/or facilitate product release, and possibly enable them to accommodate substrates with alternative dimensions and/or orientations (i.e., broader substrate specificity), which are all features commonly associated with cold-adapted enzymes [61,75,78]. Interestingly, while in Rho13 the remaining 43% of the highly flexible residues are found in domain B (Figure 8a), I3C6 displays the same percentage of highly flexible residues in domain C (Figure 8c). This clearly indicates that, although common trends can be observed among the three psychrophilic amylases studied, each enzyme seems to have developed its own strategy to improve its global/local flexibility and preserve its catalytic activity in cold environments.
The RMSF analysis highlights increased global and local flexibilities on the three cold-adapted amylases vs. their mesophilic homologs. These enhanced local flexibilities are mostly concentrated in regions that should play pivotal roles in directing the substrate pathway toward the active site. In addition, other regions with increased flexibility were also found in peripheral areas of the psychrophilic enzymes, which is consistent with a previous study that hypothesized that enhanced flexibility in non-catalytic regions is a common adaptation of psychrophilic enzymes [79]. Interestingly, both Rho13 and Ika2 exhibited some residues with reduced flexibility compared to their mesophilic counterparts (Figure 8a,b, represented by yellow sticks). This increased rigidity in specific regions likely aids in reducing the entropy barrier for catalysis, highlighting a delicate equilibrium between flexibility and rigidity that may enhance enzyme efficiency in cold climates, as discussed in the literature [76,80,81].
To elucidate the largest-amplitude collective motions and reduce dimensionality, we performed PCA by diagonalizing the backbone covariance matrices of the concatenated trajectories. Analysis of the first 50 eigenvectors, which together account for over 90% of the total molecular motions, revealed that the eigenvalues are consistently higher in psychrophilic enzymes than in their mesophilic counterparts. This observation suggests that more significant conformational changes occur in the psychrophilic enzymes. By projecting the trajectory onto the two principal eigenvectors, which represent approximately 50% of the overall motions and delineate a critical subspace for observing the most significant collective motions, we observed that psychrophilic enzymes explore a broader area of conformational space than their mesophilic homologs (Figure 8d–f). This increased exploration implies a higher degree of conformational flexibility, likely facilitated by the easier transition over energy barriers among multiple local minima. Such behavior in psychrophilic enzymes could be attributed to reduced structural stabilizing interactions and compactness, as discussed above.

4. Conclusions

We have isolated and characterized three novel secreted amylases, which, despite their common origin in an alkaline and Ca2+-rich environment in Greenland’s ikaite columns, show significant differences in terms of optimal pH and Ca2+-binding conditions, as well as in their ability to hydrolyze starch and other carbohydrates. Nevertheless, they share the psychrophilic property of losing activity at temperatures well below those where there is detectable loss in structural integrity. We attribute this to the high levels of conformational flexibility, which facilitate easy binding and accommodation of substrate molecules and exploration of the catalytic energy landscape, but at the expense of structural stability. This is reflected in the reduction of internal polar interactions such as hydrogen bonds and salt bridges, consistent with the general psychrophilic strategy of providing cold activity through conformational flexibility.

Supplementary Materials

The following supporting information can be downloaded at: https://www.mdpi.com/article/10.3390/biom15030415/s1, Original images of SDS-PAGE gels shown in Figure 2 can be found in these Supplementary Materials. Figure S1a–h. Degradation and modification of carbohydrates by the three amylases analyzed by Pulsed Amperometric Detection. Enzymes and carbohydrate substrates indicated in the title. Transglycosylation was carried out with maltoheptaose and either glucose or fucose. Figure S2. Calibration of the Superdex-200 Increase column used for size analysis of the amylases. Figure S3. Examples of activity raw data. (a) example of raw data of MBTH assay from the pH assay of Rho13 at pH 6.5 (red square) and 8.5 (blue circle) respectively are measured absorbance, line is fit (used for other figures) dotted line is standard error of fit. (b) relative activity of enzymes in 2 mM CaCl2 buffer ± 3 mM EDTA. (c) MBTH assay in 50 mM MOPS buffer pH7.5, 50 mM NaCl, 2 mM CaCl2 with EDTA added after 10 min (left) and in 50 mM MOPS buffer pH7.5, 50 mM NaCl, 2 mM CaCl2, 3 mM EDTA with additional 3 mM CaCl2 added after 10 min (right). Figure S4. Thermal denaturation of the three enzymes measured by Differential Scanning Fluorometry. All datasets are overlaid replicate data (n = 3) of technical repeats in 50mM MOPS buffer pH7.5, 50 mM NaCl, 2 mM CaCl2 ± 3 mM EDTA. Black circles represent the heating/unfolding regime, and grey circles represent the cooling/refolding regime, though no refolding was observed. Red lines represent a fit to a two state unfolding model, with a global fit to unfolding enthalpy and tm between replicates. Figure S5. Analysis of the role of Ca2+ on structural fluctuations and conformational flexibility in Ika2 (a) Three-dimensional representation of the Ika2 without Ca2+ system that highlights the residues that, throughout the 1.2 μs MD simulations, exhibited increased flexibility (represented in magenta sticks) compared to the same enzyme in the presence of calcium. The domains A, B, C, and N are shown in bright orange, iridium blue, salmon, and light green, respectively. The catalytic D330/E359/D426 triad is represented in light blue sticks. (b) Projection of the concatenated 1.2 μs MD trajectories onto the two principal eigenvectors (eigenvectors 1 and 2) for Ika2 with Ca2+ (black dots) and Ika2 without Ca2+ (red dots). Figure S6. Three-dimensional cartoon representation of the I3C6 enzyme before (a) and after (b) a 200 ns MD simulation. The domains A, B, and C are shown in different colors, and the calcium and sodium ions are depicted as green and violet spheres, respectively. (a) Minimized structure of the I3C6 psychrophilic enzyme, which shows that the Ca2+(I)-Na+-Ca2+(II) linear triad and Ca2+(III) remain lodged in the putative binding sites where they were placed during the modeling procedure. (b) I3C6 structure obtained at the end of a 200 ns MD simulation, which shows both Ca2+(II) and Ca2+(III) abandoned their original binding site during the simulation. Figure S7. Structural comparison of the amino acid residues involved in metal binding in the I3C6 psychrophilic enzyme (iridium blue sticks) and the 1HVX homolog (white sticks). The calcium and sodium ions are depicted as green and violet spheres, respectively. (a) In the 1HVX structure, seven aspartate residues interact with the Ca2+(I)-Na+-Ca2+(II) linear triad, while only 3 aspartate residues can be found in the same region in the I3C6 structure. (b) In the Ca2+(III) binding site, the 1HVX homolog exhibits a higher count of aspartate residues than the I3C6 enzyme (2 vs. 1). In addition, the psychrophilic system includes two positive residues (K405 and R429) that are not present in the homolog structure. Figure S8. Per-residue RMSF profiles of each pair of psychrophilic (red lines) and homolog (black lines) α-amylases.

Author Contributions

Conceptualization, M.K.B., J.S.N., P.P., P.F., E.V., M.S.T. and D.E.O.; methodology, M.K.B., J.S.N., P.P., P.F., E.V., L.H.P. and D.E.O.; formal analysis, M.K.B., J.S.N., P.P., M.L.H., P.F., J.S.P., E.V., L.H.P., M.S.T. and D.E.O.; investigation, M.K.B., J.S.N., P.P., M.L.H., P.F., N.S.B., E.V., F.B., L.H.P. and A.Z.; writing—original draft preparation, M.K.B., L.H.P., M.S.T. and D.E.O.; writing—review and editing, D.E.O.; visualization, M.K.B., P.P. and P.F.; supervision, J.S.P., D.E.B., P.A.F., M.J.R., P.S., M.S.T. and D.E.O.; project administration, D.E.O.; funding acquisition, D.E.O. All authors have read and agreed to the published version of the manuscript.

Funding

We are grateful for support from Independent Research Foundation Denmark | Technology and Production (grants 9041-00123B and 0217-00052B) to D.E.O., M.S.T., P.S. and J.S.N. This work was also supported by the Novo Nordisk Foundation via the EnZync Center for Enzymatic Deconstruction (grant no. NNF22OC0072891 to D.E.O. and M.J.R.). P.P., P.F., P.A.F. and M.J.R. received support from FCT/MCTES (LA/P/0008/2020 DOI 10.54499/LA/P/0008/2020, UIDP/50006/2020 DOI 10.54499/UIDP/50006/2020 and UIDB/50006/2020 DOI 10.54499/UIDB/50006/2020), through national funds. P.F. thanks Fundação para a Ciência e Tecnologia for funding (DOI: 10.54499/CEECINST/00136/2021/CP2820/CT0002). M.L.H. and J.S.P. thank the Independent Research Fund Denmark, Technology and Production (grant 9041-00075B).

Institutional Review Board Statement

Not applicable.

Informed Consent Statement

Not applicable.

Data Availability Statement

The original contributions presented in this study are included in the article and Supplementary Materials. Further inquiries can be directed to the corresponding author.

Conflicts of Interest

The authors declare no conflicts of interest.

Abbreviations

The following abbreviations are used in this manuscript:
CDcyclodextrin
CiDcircular dichroism
ΔHmelting enthalpy
dpdegree of polymerization (glucose units)
DSFdifferential scanning fluorometry
G2maltose
GHglycoside hydrolase
I3C6amylase isolated from metagenomic analysis of ikaite columns
Ika2amylase from Bacillaceae isolated from ikaite columns
MBTH3-methyl-2-benzothiazolinone hydrazone hydrochloride
MDmolecular dynamics
PCAprincipal component analysis
PDBProtein Data Bank
Rgradius of gyration
Rho13amylase from R. psychrophilum
RMSFroot mean square fluctuation
SECsize exclusion chromatography
SAXSsmall-angle X-ray scattering
tmmelting temperature

References

  1. Liu, Y.; Zhang, N.; Ma, J.; Zhou, Y.; Wei, Q.; Tian, C.; Fang, Y.; Zhong, R.; Chen, G.; Zhang, S. Advances in cold-adapted enzymes derived from microorganisms. Front. Microbiol. 2023, 14, 1152847. [Google Scholar] [CrossRef] [PubMed]
  2. Nowak, J.S.; Otzen, D.E. Helping proteins come in from the cold: 5 burning questions about cold-active enzymes. BBA Adv. 2024, 5, 100104. [Google Scholar] [CrossRef]
  3. Paul, J.S.; Gupta, N.; Beliya, E.; Tiwari, S.; Jadhav, S.K. Aspects and Recent Trends in Microbial α-Amylase: A Review. Appl. Biochem. Biotechnol. 2021, 193, 2649–2698. [Google Scholar] [CrossRef] [PubMed]
  4. Rani, K.; Rana, R.; Datt, S. Review on characteristics and application of amylases. Int. J. Microbiol. Bioinform. 2015, 5, 1–5. [Google Scholar]
  5. Sundarram, A.; Murthy, T.P.K. α-Amylase Production and Applications: A Review. J. Appl. Environ. Microbiol. 2014, 2, 166–175. [Google Scholar]
  6. Kuddus, M.; Roohi, A.J.; Ramteke, P.W. Structural adaptation and biocatalytic prospective of microbial cold-active α-amylase. Afr. J. Microbiol. Res. 2012, 6, 206–213. [Google Scholar]
  7. Sarian, F.D.; Janeček, Š.; Pijning, T.; Ihsanawati; Nurachman, Z.; Radjasa, O.K.; Dijkhuizen, L.; Natalia, D.; Van Der Maarel, M.J.E.C. A new group of glycoside hydrolase family 13 α-amylases with an aberrant catalytic triad. Sci. Rep. 2017, 7, srep44230. [Google Scholar] [CrossRef]
  8. Takata, H.; Kuriki, T.; Okada, S.; Takesada, Y.; Iizuka, M.; Minamiura, N.; Imanaka, T. Action of neopullulanase. Neopullulanase catalyzes both hydrolysis and transglycosylation at α-(1→4)- and α-(1→6)-glucosidic linkages. J. Biol. Chem. 1992, 267, 18447–18452. [Google Scholar] [CrossRef]
  9. Wang, X.; Nie, Y.; Xu, Y. Industrially produced pullulanases with thermostability: Discovery, engineering, and heterologous expression. Bioresour. Technol. 2019, 278, 360–371. [Google Scholar] [CrossRef]
  10. Xu, P.; Zhang, S.-Y.; Luo, Z.-G.; Zong, M.-H.; Li, X.-X.; Lou, W.-Y. Biotechnology and bioengineering of pullulanase: State of the art and perspectives. World J. Microbiol. Biotechnol. 2021, 37, 43. [Google Scholar] [CrossRef]
  11. Park, K.H.; Kim, T.J.; Cheong, T.K.; Kim, J.W.; Oh, B.H.; Svensson, B. Structure, specificity and function of cyclomaltodextrinase, a multispecific enzyme of the α-amylase family. Biochim. Biophys. Acta—Protein Struct. Mol. Enzymol. 2000, 1478, 165–185. [Google Scholar] [CrossRef] [PubMed]
  12. Tonozuka, T.; Ohtsuka, M.; Sakano, Y.; Mogi, S.i.; Sakai, H.; Ohta, T. A Neopullulanase-type α-Amylase Gene from Thermoactinomyces vulgaris R-47. Biosci. Biotechnol. Biochem. 1993, 57, 395–401. [Google Scholar] [CrossRef]
  13. Lee, H.S.; Kim, M.S.; Cho, H.S.; Kim, J.I.; Kim, T.J.; Choi, J.H.; Park, C.; Lee, H.S.; Oh, B.H.; Park, K.H. Cyclomaltodextrinase, neopullulanase, and maltogenic amylase are nearly indistinguishable from each other. J. Biol. Chem. 2002, 277, 21891–21897. [Google Scholar] [CrossRef] [PubMed]
  14. Arabaci, N.; Arikan, B. Isolation and characterization of a cold-active, alkaline, detergent stable α-amylase from a novel bacterium Bacillus subtilis N8. Prep. Biochem. Biotechnol. 2018, 48, 419–426. [Google Scholar] [CrossRef] [PubMed]
  15. Roohi, R.; Kuddus, M.; Saima, S. Cold-active detergent-stable extracellular α-amylase from Bacillus cereus GA6: Biochemical characteristics and its perspectives in laundry detergent formulation. J. Biochem. Technol. 2013, 4, 636–644. [Google Scholar]
  16. Qin, Y.; Huang, Z.; Liu, Z. A novel cold-active and salt-tolerant α-amylase from marine bacterium Zunongwangia profunda: Molecular cloning, heterologous expression and biochemical characterization. Extremophiles 2014, 18, 271–281. [Google Scholar] [CrossRef]
  17. Aghajari, N.; Georges, F.; Gerday, C.; Haser, R. Crystal Structures of the Psychrophilic a-Amylase from Alteromonas haloplanctis in Its Native Form and Complexed with an Inhibitor; Cambridge University Press: Cambridge, UK, 1998. [Google Scholar]
  18. Feller, G.; D’Amico, D.; Gerday, C. Thermodynamic stability of a cold-active α-amylase from the antarctic bacterium Alteromonas haloplanctis. Biochemistry 1999, 38, 4613–4619. [Google Scholar] [CrossRef]
  19. Feller, G.; Lonhienne, T.; Deroanne, C.; Libioulle, C.; Van Beeumen, J.; Gerday, C. Purification, characterization, and nucleotide sequence of the thermolabile α-amylase from the antarctic psychrotroph Alteromonas haloplanctis A23. J. Biol. Chem. 1992, 267, 5217–5221. [Google Scholar] [CrossRef]
  20. Feller, G.; Payan, F.; Theys, F.; Qian, M.; Haser, R.; Gerday, C. Stability and structural analysis of alpha-amylase from the antarctic psychrophile Alteromonas haloplanctis A23. Eur. J. Biochem. 1994, 222, 441–447. [Google Scholar] [CrossRef]
  21. Ito, S. Alkaline Enzymes in Current Detergency. In Extremophiles Handbook; Horikoshi, K., Ed.; Springer: Tokyo, Japan, 2011; pp. 229–251. [Google Scholar]
  22. Buchardt, B.; Seaman, P.; Stockmann, G.; Vous, M.; Wilken, U.; Düwel, L.; Kristiansen, A.; Jenner, C.; Whiticar, M.J.; Kristensen, R.M.; et al. Submarine columns of ikaite tufa. Nature 1997, 390, 129–130. [Google Scholar] [CrossRef]
  23. Schmidt, M.; Priemé, A.; Stougaard, P. Bacterial diversity in permanently cold and alkaline ikaite columns from Greenland. Extremophiles 2006, 10, 551–562. [Google Scholar] [CrossRef]
  24. Schmidt, M.; Priemé, A.; Stougaard, P. Arsukibacterium ikkense gen. nov., sp. nov, a novel alkaliphilic, enzyme-producing γ-Proteobacterium isolated from a cold and alkaline environment in Greenland. Syst. Appl. Microbiol. 2007, 30, 197–201. [Google Scholar] [CrossRef]
  25. Vester, J.K.; Glaring, M.A.; Stougaard, P. Discovery of novel enzymes with industrial potential from a cold and alkaline environment by a combination of functional metagenomics and culturing. Microb. Cell Factories 2014, 13, 72. [Google Scholar] [CrossRef] [PubMed]
  26. Lylloff, J.E.; Hansen, L.B.S.; Jepsen, M.; Sanggaard, K.W.; Vester, J.K.; Enghild, J.J.; Sørensen, S.J.; Stougaard, P.; Glaring, M.A. Genomic and exoproteomic analyses of cold- and alkaline-adapted bacteria reveal an abundance of secreted subtilisin-like proteases. Microb. Biotechnol. 2016, 9, 245–256. [Google Scholar] [CrossRef]
  27. Vester, J.K.; Glaring, M.A.; Stougaard, P. An exceptionally cold-adapted alpha-amylase from a metagenomic library of a cold and alkaline environment. Appl. Microbiol. Biotechnol. 2014, 99, 717–727. [Google Scholar] [CrossRef] [PubMed]
  28. Hauptmann, A.L.; Glaring, M.A.; Hallin, P.F.; Priemé, A.; Stougaard, P. Draft genome sequence of the psychrophilic and alkaliphilic Rhodonellum psychrophilum strain GCM71T. Genome Announc. 2013, 1, 6–7. [Google Scholar] [CrossRef] [PubMed]
  29. Schmidt, M.; Priemé, A.; Stougaard, P. Rhodonellum psychrophilum gen. nov., sp. nov., a novel psychrophilic and alkaliphilic bacterium of the phylum Bacteroidetes isolated from Greenland. Int. J. Syst. Evol. Microbiol. 2006, 56, 2887–2892. [Google Scholar] [CrossRef]
  30. Seemann, T. Prokka: Rapid prokaryotic genome annotation. Bioinformatics 2014, 30, 2068–2069. [Google Scholar] [CrossRef]
  31. Zervas, A.; Stougaard, P.; Thøgersen, M.S. Complete genome sequence of “Bacillaceae sp. strain IKA-2”: A cold-active, amylase-producing bacterium from ikaite columns in SW Greenland. Microbiol. Resour. Announc. 2023, 13, e00887-23. [Google Scholar] [CrossRef]
  32. Gasteiger, E.; Jung, E.; Bairoch, A. SWISS-PROT: Connecting Biomolecular Knowledge Via a Protein Database. Curr. Issues Mol. Biol. 2001, 3, 47–55. [Google Scholar] [CrossRef]
  33. The UniProt Consortium. UniProt: The Universal Protein Knowledgebase in 2023. Nucleic Acids Res. 2023, 51, D523–D531. [Google Scholar] [CrossRef]
  34. Gabler, F.; Nam, S.-Z.; Till, S.; Mirdita, M.; Steinegger, M.; Söding, J.; Lupas, A.N.; Alva, V. Protein Sequence Analysis Using the MPI Bioinformatics Toolkit. Curr. Protoc. Bioinform. 2020, 72, e108. [Google Scholar] [CrossRef] [PubMed]
  35. Blum, M.; Chang, H.Y.; Chuguransky, S.; Grego, T.; Kandasaamy, S.; Mitchell, A.; Nuka, G.; Paysan-Lafosse, T.; Qureshi, M.; Raj, S.; et al. The InterPro protein families and domains database: 20 years on. Nucleic Acids Res. 2021, 49, D344–D354. [Google Scholar] [CrossRef]
  36. Teufel, F.; Almagro Armenteros, J.J.; Johansen, A.R.; Gíslason, M.H.; Pihl, S.I.; Tsirigos, K.D.; Winther, O.; Brunak, S.; von Heijne, G.; Nielsen, H. SignalP 6.0 predicts all five types of signal peptides using protein language models. Nat. Biotechnol. 2022, 40, 1023–1025. [Google Scholar] [CrossRef] [PubMed]
  37. Winder, A.J.; Harris, H. New assays for the tyrosine hydroxylase and dopa oxidase activities of tyrosinase. Eur. J. Biochem. 1991, 198, 317–326. [Google Scholar] [CrossRef] [PubMed]
  38. Mogensen, J.E.; Sehgal, P.; Otzen, D.E. Activation, inhibition, and destabilization of Thermomyces lanuginosus lipase by detergents. Biochemistry 2005, 44, 1719–1730. [Google Scholar] [CrossRef]
  39. Jumper, J.; Evans, R.; Pritzel, A.; Green, T.; Figurnov, M.; Ronneberger, O.; Tunyasuvunakool, K.; Bates, R.; Zidek, A.; Potapenko, A.; et al. Highly accurate protein structure prediction with AlphaFold. Nature 2021, 596, 583–589. [Google Scholar] [CrossRef]
  40. Mirdita, M.; Schütze, K.; Moriwaki, Y.; Heo, L.; Ovchinnikov, S.; Steinegger, M. ColabFold: Making protein folding accessible to all. Nat. Methods 2022, 19, 679–682. [Google Scholar] [CrossRef]
  41. Evans, R.; O’Neill, M.; Pritzel, A.; Antropova, N.; Senior, A.; Green, T.; Žídek, A.; Bates, R.; Blackwell, S.; Yim, J.; et al. Protein complex prediction with AlphaFold-Multimer. biorxiv 2021, 2021-10. [Google Scholar] [CrossRef]
  42. Lyngso, J.; Pedersen, J.S. A high-flux automated laboratory small-angle X-ray scattering instrument optimized for solution scattering. J. Appl. Crystallogr. 2021, 54, 295–305. [Google Scholar] [CrossRef]
  43. Glatter, O. A new method for the evaluation of small-angle scattering data. J. Appl. Crystall. 1977, 10, 415–421. [Google Scholar] [CrossRef]
  44. Pedersen, J.S.; Hansen, S.; Bauer, R. The Aggregation Behavior of Zinc-free Insulin Studied by Small-angle Neutron Scattering. Eur. Biophys. J. 1994, 23, 379–389. [Google Scholar] [CrossRef]
  45. Steiner, E.M.; Lyngsø, J.; Guy, J.E.; Bourenkov, G.; Lindqvist, Y.; Schneider, T.R.; Pedersen, J.S.; Schneider, G.; Schnell, R. The structure of the N-terminal module of the cell wall hydrolase RipA and its role in regulating catalytic activity. Proteins Struct. Funct. Bioinform. 2018, 86, 912–923. [Google Scholar] [CrossRef] [PubMed]
  46. Harwood, S.L.; Lyngso, J.; Zarantonello, A.; Kjoge, K.; Nielsen, P.K.; Andersen, G.R.; Pedersen, J.S.; Enghild, J.J. Structural Investigations of Human A2M Identify a Hollow Native Conformation That Underlies Its Distinctive Protease-Trapping Mechanism. Mol Cell Proteom. 2021, 20, 100090. [Google Scholar] [CrossRef]
  47. Duvjir, S.; Fujimoto, Z.; Takase, K.; Matsumura, M.; Mizuno, H. Crystal Structure of Bacillus stearothermophilus a-Amylase: Possible Factors Determining the Thermostability. J. Biochem. 2001, 129, 461–468. [Google Scholar] [CrossRef]
  48. Hondoh, H.; Kuriki, T.; Matsuura, Y. Three-dimensional Structure and Substrate Binding of Bacillus stearothermophilus Neopullulanase. J. Mol. Biol. 2003, 326, 177–188. [Google Scholar] [CrossRef]
  49. Sivakumar, N.; Li, N.; Tang, J.W.; Patel, B.K.C.; Swaminathan, K. Crystal structure of AmyA lacks acidic surface and provide insights into protein stability at poly-extreme condition. FEBS Lett. 2006, 580, 2646–2652. [Google Scholar] [CrossRef]
  50. Olsson, M.H.M.; Søndergaard, C.R.; Rostkowski, M.; Jensen, J.H. PROPKA3: Consistent Treatment of Internal and Surface Residues in Empirical pKa Predictions. J. Chem. Theory Comput. 2011, 7, 525–537. [Google Scholar] [CrossRef]
  51. Case, D.A.; Aktulga, H.M.; Belfon, K.; Cerutti, D.S.; Cisneros, G.A.; Cruzeiro, V.W.D.; Forouzesh, N.; Giese, T.J.; Götz, A.W.; Gohlke, H.; et al. AmberTools. J. Chem. Inf. Model. 2023, 63, 6183–6191. [Google Scholar] [CrossRef] [PubMed]
  52. Jorgensen, W.L.; Chandrasekhar, J.; Madura, J.D.; Impey, R.W.; Klein, M.L. Comparison of simple potential functions for simulating liquid water. J. Chem. Phys. 1983, 79, 926–935. [Google Scholar] [CrossRef]
  53. Abraham, M.J.; Murtola, T.; Schulz, R.; Pall, S.; Smith, J.C.; Hess, B.; Lindahl, E. GROMACS: High performance molecular simulations through multi-level parallelism from laptops to supercomputers. SoftwareX 2015, 1, 19–25. [Google Scholar] [CrossRef]
  54. Maier, J.A.; Martinez, C.; Kasavajhala, K.; Wickstrom, L.; Hauser, K.E.; Simmerling, C. ff14SB: Improving the Accuracy of Protein Side Chain and Backbone Parameters from ff99SB. J. Chem. Theory Comput. 2015, 11, 3696–3713. [Google Scholar] [CrossRef] [PubMed]
  55. Cauchy, A.-L. Méthode générale pour la résolution des systèmes d’équations simultanées. C. R. Acad. Sci. Paris 1847, 25, 536–538. [Google Scholar]
  56. Hess, B.; Bekker, H.; Berendsen, H.J.C.; Fraaije, J. LINCS: A linear constraint solver for molecular simulations. J. Comput. Chem. 1987, 18, 1463–1472. [Google Scholar] [CrossRef]
  57. Essmann, U.; Perera, L.; Berkowitz, M.L.; Darden, T.; Lee, H.; Pedersen, L.G. A smooth particle mesh Ewald method. J. Chem. Phys. 1995, 103, 8577–8593. [Google Scholar] [CrossRef]
  58. Bussi, G.; Donadio, D.; Parrinello, M. Canonical sampling through velocity rescaling. J. Chem. Phys. 2007, 126, 014101. [Google Scholar] [CrossRef]
  59. Berendsen, H.J.C.; Postma, J.P.M.; Van Gunsteren, W.F.; DiNola, A.; Haak, J.R. Molecular-Dynamics with Coupling to an External Bath. J. Chem. Phys. 1984, 81, 3684–3690. [Google Scholar] [CrossRef]
  60. Parrinello, M. Polymorphic transitions in single crystals: A new molecular dynamics method. J. Appl. Phys. 1981, 52, 7182. [Google Scholar] [CrossRef]
  61. Zhang, Z.-B.; Xia, Y.-L.; Dong, G.-H.; Fu, Y.-X.; Liu, S.-Q. Exploring the Cold-Adaptation Mechanism of Serine Hydroxymethyltransferase by Comparative Molecular Dynamics Simulations. Int. J. Mol. Sci. 2021, 22, 1781. [Google Scholar] [CrossRef]
  62. Zhang, H.; Zhang, T.; Chen, K.; Shen, S.; Ruan, J.; Kurgan, L. On the relation between residue flexibility and local solvent accessibility in proteins. Proteins Struct. Funct. Bioinform. 2009, 76, 617–636. [Google Scholar] [CrossRef]
  63. Humphrey, W.; Dalke, A.; Schulten, K. VMD: Visual molecular dynamics. J. Mol. Graph. 1996, 14, 33–38. [Google Scholar] [CrossRef] [PubMed]
  64. Schrödinger, L. The PyMOL Molecular Graphics System, Version 1.5.0.4. Available online: https://www.pymol.org/support.html (accessed on 15 February 2025).
  65. Kim, J.S.; Cha, S.S.; Kim, H.J.; Kim, T.J.; Ha, N.C.; Oh, S.T.; Cho, H.S.; Cho, M.J.; Kim, M.J.; Lee, H.S.; et al. Crystal structure of a maltogenic amylase provides insights into a catalytic versatility. J. Biol. Chem. 1999, 274, 26279–26286. [Google Scholar] [CrossRef] [PubMed]
  66. Ichikawa, K.; Tonozuka, T.; Yokota, T.; Shimura, Y.; Sakano, Y. Analysis of Catalytic Residues of Thermoactinomyces vulgaris R-47 α-Amylase II (TVA II) by Site-directed Mutagenesis. Biosci. Biotechnol. Biochem. 2000, 64, 2692–2695. [Google Scholar] [CrossRef] [PubMed]
  67. Kamitori, S.; Kondo, S.; Okuyama, K.; Yokota, T.; Shimura, Y.; Tonozuka, T.; Sakano, Y. Crystal structure of thermoactinomyces vulgaris R-47 α-Amylase II (TVAII) hydrolyzing cyclodextrins and pullulan at 2.6 Å resolution. J. Mol. Biol. 1999, 287, 907–921. [Google Scholar] [CrossRef]
  68. Mizuno, M.; Tonozuka, T.; Uechi, A.; Ohtaki, A.; Ichikawa, K.; Kamitori, S.; Nishikawa, A.; Sakano, Y. The crystal structure of Thermoactinomyces vulgaris R-47 α-amylase II (TVA II) complexed with transglycosylated product. Eur. J. Biochem. 2004, 271, 2530–2538. [Google Scholar] [CrossRef]
  69. Møller, M.S.; Svensson, B. Structural biology of starch-degrading enzymes and their regulation. Curr. Opin. Struct. Biol. 2016, 40, 33–42. [Google Scholar] [CrossRef]
  70. Kim, T.J.; Kim, M.J.; Kim, B.C.; Kim, J.C.; Cheong, T.K.; Kim, J.W.; Park, K.H. Modes of action of acarbose hydrolysis and transglycosylation catalyzed by a thermostable maltogenic amylase, the gene for which was cloned from a Thermus strain. Appl. Environ. Microbiol. 1999, 65, 1644–1651. [Google Scholar] [CrossRef]
  71. Pico, J.; Martinez, M.M.; Martin, M.T.; Gomez, M. Quantification of sugars in wheat flours with an HPAEC-PAD method. Food Chem 2015, 173, 674–681. [Google Scholar] [CrossRef]
  72. Carabetta, S.; Di Sanzo, R.; Campone, L.; Fuda, S.; Rastrelli, L.; Russo, M. High-Performance Anion Exchange Chromatography with Pulsed Amperometric Detection (HPAEC–PAD) and Chemometrics for Geographical and Floral Authentication of Honeys from Southern Italy (Calabria region). Foods 2020, 9, 1625. [Google Scholar] [CrossRef]
  73. Duedahl-Olesen, L.; Haastrup Pedersen, L.; Lambertsen Larsen, K. Suitability and limitations of methods for characterisation of activity of malto-oligosaccharide-forming amylases. Carbohydr. Res. 2000, 329, 109–119. [Google Scholar] [CrossRef]
  74. Anthon, G.E.; Barrett, D.M. Determination of reducing sugars with 3-methyl-2-benzothiazolinonehydrazone. Anal. Biochem. 2002, 305, 287–289. [Google Scholar] [CrossRef]
  75. Feller, G. Psychrophilic enzymes: From folding to function and biotechnology. Scientifica 2013, 2013, 512840. [Google Scholar] [CrossRef] [PubMed]
  76. Lonhienne, T.; Gerday, C.; Feller, G. Psychrophilic enzymes: Revisiting the thermodynamic parameters of activation may explain local flexibility. Biochim. Biophys. Acta (BBA)—Protein Struct. Mol. Enzymol. 2000, 1543, 1–10. [Google Scholar] [CrossRef]
  77. Sočan, J.; Isaksen, G.V.; Brandsdal, B.O.; Åqvist, J. Towards Rational Computational Engineering of Psychrophilic Enzymes. Sci. Rep. 2019, 9, 19147. [Google Scholar] [CrossRef] [PubMed]
  78. Siddiqui, K.S.; Cavicchioli, R. Cold-adapted enzymes. Annu. Rev. Biochem. 2006, 75, 403–433. [Google Scholar] [CrossRef]
  79. Papaleo, E.; Tiberti, M.; Invernizzi, G. Molecular Dynamics Simulations to Study Structure-Function Relationship in Psychrophilic Enzymes. In Biotechnology of Extremophiles: Advances and Challenges; Rampelotto, P.H., Ed.; Springer International Publishing: Cham, Switzerland, 2016; pp. 675–698. [Google Scholar]
  80. Papaleo, E.; Riccardi, L.; Villa, C.; Fantucci, P.; De Gioia, L. Flexibility and enzymatic cold-adaptation: A comparative molecular dynamics investigation of the elastase family. Biochim. Biophys. Acta (BBA)—Proteins Proteom. 2006, 1764, 1397–1406. [Google Scholar] [CrossRef]
  81. Isaksen, G.V.; Aqvist, J.; Brandsdal, B.O. Enzyme surface rigidity tunes the temperature dependence of catalytic rates. Proc. Natl. Acad. Sci. USA 2016, 113, 7822–7827. [Google Scholar] [CrossRef]
Figure 1. Cartoon representations of the CoLabFold/AlphaFold-predicted structures of the (a) Rho13, (b) Ika2, and (c) I3C6 psychrophilic α-amylases. Domains A, B, C, and N are shown in bright orange, iridium blue, salmon pink, and light green, respectively. Ca2+ and Na+ ions are depicted as green and violet spheres, respectively.
Biomolecules 15 00415 g001
Figure 2. Oligomer distribution and activity of Rho13 (a), Ika2 (b), and I3C6 (c). Ni-NTA–eluted proteins were subjected to SEC (elution profiles shown as joined black lines), and fractions were tested for activity using an MBTH assay (columns with standard error of linear fit as error bars). Activity was detected in both Rho13 peaks, the last I3C6 peak, and throughout the skewed Ika2 peak. SDS-PAGE showed single-band purity and similar mobility of all fractions for the same protein, indicating that multiple SEC peaks are oligomers. Original images of (ac) can be found in Supplementary Materials.
Biomolecules 15 00415 g002
Figure 3. Degradation and modification of carbohydrates by the three amylases analyzed by pulsed amperometric detection. Products produced by (a) all three amylases upon treatment with starch and (b) Ika2 incubated with γ-cyclodextrin. (c) Transglycosylation of maltoheptaose in the presence of fucose carried out by I3C6. Additional elution profiles are shown in Figure S1.
Biomolecules 15 00415 g003aBiomolecules 15 00415 g003b
Figure 4. SAXS analysis of the quaternary structure of the three amylases. (a) Small angle x-ray scattering profiles of 0.5, 1, and 2 mg/mL enzyme were fitted to AlphaFold predictions of the protein structure using SUPERSAXS. The panel shows scattering profiles at 1 mg/mL enzyme. (b) The SAXS data allowed determination of the radius of gyration, Rg. Rgmeasured (data points) was compared to Rgcalculated (stippled lines) for dimers and monomers. The data are consistent with a dimer for Ika2 and a mix of monomers and dimers for Rho13. Ika2 (red pyramids) was very well described by the dimer, while Rho13 (blue squares) radius was best estimated with a mix of monomers and dimers; only 0.5 and 1 mg/mL datasets were obtained for Rho13 due to aggregation. I3C6 (green triangles) showed a concentration-dependent size increase, which we attributed to aggregation, as seen by the increase in scattering at low q-values (panel a insert: Guinier plot).
Biomolecules 15 00415 g004
Figure 5. Activity optima. Absolute specific activities and relative activities were measured by MBTH assay on the breakdown of starch and formation of reducing ends at different buffer conditions. Rho13 (blue squares), Ika2 (red pyramids), and I3C6 (green triangles). (a) Specific activities measured at the given temperature at pH 7.5 after 10 min of previous incubation. (b) Temperature data normalized to the maximal activity for each enzyme. All enzymes show a clear psychrophilic profile, with low topt and activity below 20 °C. (c) pH optimum. Rho13 and I3C6 showed highest activity under alkaline conditions while Ika2 preferred acidic conditions. (d) Effect of ionic strength (0–1000 mM NaCl together with 2 mM CaCl2 and 50 mM MOPS buffer). The enzymes were relatively unaffected by increasing ionic strength, though with a slight declining trend for I3C6. (e) CaCl2 optima. The hollow symbols in left side of graph are activity in presence of 3 mM EDTA relative to 2 mM CaCl2. Rho13 and I3C6 had a defined optimum at 2 mM, while Ika2 had the highest activity at 0.01 mM. Additional CaCl2 inhibited the activity. The activity was fitted to Equation (1) (solid lines). All data are initial velocities over 330 s, with error bars as standard error of a linear fit.
Biomolecules 15 00415 g005
Figure 6. Structure and stability of the three amylases, as measured by spectroscopy. (a) CD spectra of enzymes with/without 3 mM EDTA (b) Thermal stability of amylases in the presence or absence of 3 mM EDTA. Enzymes were cooled from room temperature to 10 °C and then heated at a scan rate of 1 °C/min, while full CD spectra were recorded (200–260 nm). Top: Selected traces monitored at different wavelengths in the α-helix region (214–230 nm) are shown (points), along with the unfolding fit (solid lines). (c) Example data of thermal unfolding, as measured by differential scanning fluorometry. Amylases were slowly heated from 15 to 95 °C at 1 °C/min (red squares and orange circles) and recooled to measure refolding (blue triangles), and the unfolding regime was fitted to a two-state unfolding (line). Red squares show the unfolding of Ika2 at 2 mM CaCl2, and orange circles show the unfolding of Ika2 with 2 mM CaCl2 and 3mM EDTA. Data are the overlay of three technical repeats measured in parallel.
Biomolecules 15 00415 g006
Figure 7. Sequence alignment with of calcium binding sites from Protein Data Bank (PDB), performed using T-Coffee. One sequence representing the different enzymes in the CAZy (a: GH13_20, b: GH13_36, c: GH13_5) database with structures submitted. (a) Ika2 aligned with 12 GH13_20 enzymes with structures in CAZy. The numbers on top correspond to the Ika2 sequence. A single binding site is present in five structures; in these, residues within 5Å are colored yellow. (b) Rho13 aligned with 5 GH13_36 structures with metals in their submitted structures. “…” denotes hidden parts of the alignment. The numbers on top correspond to the Rho13 sequence, including the signal peptide. Two sites seem to be conserved in Rho13, as well as a loop that is present in all the other GH13_36 structures, and possibly a second site that is occupied by calcium in three of the structures, but is conserved in all. (c) I3C6 aligned with GH13_5 amylases from CAZy. Green represents residues (backbone or sidechain) coordinating the Ca-Na-Ca binding site present in these enzymes, which are mostly conserved in I3C6. Yellow represents a second conserved binding site that is imperfectly conserved in I3C6.
Biomolecules 15 00415 g007
Figure 8. Compilation of the results concerning the MD simulations performed with the three psychrophilic α-amylases (Rho13, Ika2, and I3C6) and their respective homologs (1WZA, 1J0H, and 1HVX). (ac) Cartoon representations of the Rho13 (a), Ika2 (b), and I3C6 (c) enzymes that highlight the residues that, throughout the MD simulations, exhibited increased flexibility (represented by magenta sticks) or increased rigidity (represented by yellow sticks) compared to the corresponding homologs. The domains A, B, C, and N are shown in bright orange, iridium blue, salmon pink, and light green, respectively. The catalytic D/E/D triads are represented by light blue sticks. The calcium and sodium ions are depicted as green and violet spheres, respectively. (df) Projection of the concatenated 1.2 μs MD trajectories onto the two principal eigenvectors (eigenvectors 1 and 2, which represent approximately 50% of the overall motions) for each pair of psychrophilic (red dots)/homolog (black dots) enzymes.
Biomolecules 15 00415 g008
Table 1. Oligomerization properties of the three enzymes probed by SAXS.
ProteinConcentrationAbs280 (mg/mL)Rg (Å) aModelχ2 bConcentrationSAXS (mg/mL)n-mers a (SAXS b)
Ika21.9933.8 ± 0.1AF dimer4.31.691.67 (1.97)
1.0033.8 ± 0.1AF dimer1.90.841.67 (1.99)
0.5134 ± 0.2AF dimer1.40.421.63 (1.96)
Rho0.9449.8 ± 0.5Monomer0.03 mg/mL + dimer0.69 mg/mL2.90.721.58 (1.96)
0.4642.6 ± 0.7Monomer0.06 mg/mL + dimer0.29 mg/mL1.40.351.38 (1.83)
I3C61.7664.5 ± 1---1.6
0.8794 ± 0.8---3.42
0.46111.4 ± 0.4---7.4
Notes: a Determined from the indirect Fourier transformation routine, as described in the Section 2. b SAXS modelling results using the described model. Protein concentrations were obtained from the model fit using an absolute scale.
Table 2. Optimal activity temperatures and melting temperatures (tm) obtained from the thermal unfolding of the three enzymes Ika2, Rho13, and I3C6, as monitored by either DSF or far-UV CiD in the presence of 2 mM CaCl2 alone or with 3 mM EDTA a.
Activity Optimum (°C)tm (DSF) (°C) btm (CiD) (°C) c
2 mM CaCl22 mM CaCl2 +
3 mM EDTA
2 mM CaCl22 mM CaCl2 +
3 mM EDTA
tmtmtmN-ItmI-DtmN-ItmI-D
Ika2 d3561.97 ± 0.0150.82 ± 0.0157.16 ± 1.7762.10 ± 0.9947.80 ± 0.2372.16 ± 0.20
Rho13 e3055.21 ± 0.0153.38 ± 0.0155.98 ± 0.0458.32 ± 0.14N/A gN/A g
I3C6 f3055.40 ± 0.0152.28 ± 0.0152.47 ± 0.0553.85 ± 0.5255.67 ± 0.2575.42 ± 0.70
Notes: a The buffer used was 10 mM MOPS pH 7.5, 50 mM NaCl (CiD), or 50 mM MOPS pH 7.5, 50 mM NaCl (DSF). b DSF unfolding curves were analyzed as global fits of three technical replicates of 330 nm/350 nm fluorescence and followed a single transition in which the signal of both the native and the denatured state changed linearly with rising temperature. c CiD was measured as ellipticity of 210–230 nm and showed a three-state unfolding N-I-D, typically with quite narrow intervals of unfolding. The three states were individually fitted as described below with global fits to 21 different wavelengths from 210 to 230 nm (or from nine different wavelengths from 214 to 230 for Ika2CaCl2). d The CiD data for the unfolding of Ika2CaCl2 did not converge on a fit with the full 214–230 nm spectrum, but could be fitted with every second wavelength to a satisfying fit using linear baseline correction of the intermediate state. Ika2EDTA was required for baseline correction of all three states. e Rho13CaCl2 was baseline-corrected to a linear change in signal with temperature for the native and denatured states, while Rho13EDTA showed a completely different unfolding curve, likely suggesting denaturation upon stripping of the Ca2+. f I3C6CaCl2 required baseline correction of all three states, while I3C6EDTA did not require baseline correction of the native state. g Not fitted because the data did not show a clear transition.
Table 3. Average values ± standard error of the mean of multiple structural metrics determined for the continuous 1.2 μs MD trajectories (i.e., three 400 ns–long replicas concatenated into a single trajectory) performed with the three psychrophilic α-amylases (Rho13, Ika2, and I3C6) and their respective homologs (1WZA, 1J0H, and 1HVX).
Average RMSD (Backbone)/ÅAverage RMSF (Backbone)/ÅAverage No. H-BondsAverage Rg (Backbone)/ÅAverage SASA/nm2
Rho132.763 ± 0.0061.02 ± 0.02413.81 ± 0.0923.46 ± 0.02216.56 ± 0.03
1WZA (homolog)2.600 ± 0.0040.88 ± 0.02417.01 ± 0.0922.88 ± 0.02208.68 ± 0.03
Ika22.837 ± 0.0051.295 ± 0.0081000.6 ± 0.133.400 ± 0.002462.69 ± 0.06
1J0H (homolog)2.123 ± 0.0041.075 ± 0.008999.8 ± 0.133.467 ± 0.002458.63 ± 0.06
I3C61.670 ± 0.0030.92 ± 0.02410.79 ± 0.0924.11 ± 0.02205.81 ± 0.03
1HVX (homolog)1.073 ± 0.0020.72 ± 0.01424.97 ± 0.0923.73 ± 0.02186.45 ± 0.02
Disclaimer/Publisher’s Note: The statements, opinions and data contained in all publications are solely those of the individual author(s) and contributor(s) and not of MDPI and/or the editor(s). MDPI and/or the editor(s) disclaim responsibility for any injury to people or property resulting from any ideas, methods, instructions or products referred to in the content.

