Abstract
The Osgin gene family consists of two members, Osgin1 and Osgin2, involved in the cellular oxidative stress response. While many members of this essential cellular pathway have been extensively characterized, the Osgin gene family, despite its broad phylogenetic distribution, has received far less attention. Here, we review published articles and open-source databases to synthesize the current research on the evolutionary history, structure, biochemical and physiological functions, expression patterns, and role in disease of the Osgin gene family. Although Osgin displays broad spatiotemporal expression during development and adulthood, there is ambiguity regarding the cellular functions of the OSGIN proteins. A recent study identified OSGIN-1 as a flavin-dependent monooxygenase, but the biochemical role of OSGIN-2 has not yet been defined. Moreover, while the Osgin genes are implicated as mediators of cell proliferation, apoptosis, and autophagy, these functions have not been connected to the enzymatic classification of OSGIN. Misregulation of Osgin expression has long been associated with various disease states, yet recent analyses highlight the mechanistic role of OSGIN in pathogenesis and disease progression, underscoring the therapeutic potential of targeting OSGIN. In light of these findings, we suggest further avenues of research to advance our understanding of this essential, yet underexplored, gene family.
1. Introduction
To provide the proper context for understanding the importance of Osgin (oxidative stress-induced growth inhibitor), it is necessary to review the ancient and highly conserved reactive oxygen species (ROS) pathway. The addition of oxygen to the Earth’s atmosphere ~2.45 billion years ago and the evolution of aerobic respiration placed selective pressure on organisms to develop mechanisms to both utilize ROS and survive ROS-related toxicity.
This led to the development of a highly complex system of oxidative stress genes and pathways that are designed to mitigate or utilize oxidative stress as needed [1]. Largely conserved across organisms employing aerobic metabolism, ROS are chemically active free radical and non-radical oxygen species created from the partial reduction of oxygen. ROS are produced endogenously in cellular processes including oxidative metabolism, endoplasmic reticulum (ER) stress, peroxisomal enzyme activity, activity of redox enzymes, as well as interactions with exogenous agents [2,3,4,5].
At physiological levels, ROS are referred to as oxidative eustress or “good stress” and are vital to the regulation of biochemical transformations [6], cellular growth, differentiation, protection, apoptosis, immune response, transcription factor regulation, adhesion, DNA damage response, iron regulation [7], wound healing [8], and stress adaptation due to their involvement in intracellular signaling [2,4,6,9]. However, when ROS levels increase and an imbalance between free radical formation and mitigation is created, oxidative stress—a disruption of redox homeostasis that occurs when the prooxidant–antioxidant system shifts in favor of the prooxidants—is produced. This can result in macromolecular damage and disruption of cell signaling pathways, which have been implicated in pathologies including neurodegenerative diseases and cancer [7,9,10,11,12,13].
A system of enzymatic—which break down ROS into less reactive byproducts—and non-enzymatic antioxidants—which serve as free radical absorbers—function to regulate intracellular ROS homeostasis and prevent accumulation of ROS and oxidative stress [9,13,14,15,16,17,18]. Additionally, cells are often capable of repairing damage caused by ROS utilizing reductase enzymes and base excision repair to reverse the harmful effects of oxidative stress-related modifications [13]. Accumulation of ROS can also stimulate cellular pathways that promote the expression of genes that allow for adaptation to oxidative stress by regulating cell proliferation, differentiation, autophagy, and apoptosis [9].
One such gene involved in this oxidative stress pathway, Osgin1, also known as OKL38 (ovary, kidney, and liver protein 38) and BDGI (bone marrow stromal cell-derived growth inhibitor), was first identified by Huynh et al. (2001) in an experiment to isolate upregulated genes in rat mammary epithelial cells during pregnancy and lactation [19]. Although Osgin1 was expressed ubiquitously in all examined tissues, the mRNA transcripts were most abundant in ovary, kidney, and liver tissues [19]. Thus, Huynh et al. named the gene OKL38.
However, the gene became known as Osgin1 once its expression was stimulated by superoxide production following oxidized 1-palmitoyl-2-arachidonoyl-sn-glycero3-phosphorylcholine (OxPAPC) treatment and it was implicated in the oxidative stress response [20]. The novel Osgin2 gene, originally known as C8orf1 (chromosome 8 open reading frame 1) or hT41 (human testis 4.1-kb transcript), was identified by Tauchi et al. (1999) while characterizing the neighboring NBS1 gene due to its implication in Nijmegen breakage syndrome (NBS). While Osgin2 was also expressed ubiquitously, its expression was highest in ovary and testis tissues [21]. For the purposes of this review, these genes will solely be referred to as Osgin1 and Osgin2 and their proteins as OSGIN-1 and OSGIN-2, respectively, unless otherwise specified. Since their initial discovery, the Osgin genes have been implicated in the cellular response to oxidative stress. However, while the mechanisms of the oxidative stress pathway—as reviewed in Hong et al. (2024)—are well characterized, the role of the Osgin gene family in this process remains poorly understood [9]. The goal of this review is to provide a comprehensive overview of the current state of Osgin research, and due to their largely conserved presence across aerobic species, we suggest future research directions for the essential, yet understudied, Osgin gene family.
2. Methods
A systematic and intensive review of the current literature was performed using PubMed as a database and Google Scholar as an academic search engine. Gene conservation and expression data were curated from the OrthoDB and National Center for Biotechnology Information (NCBI) databases, as well as the ExpressionAtlas, Bgee, Mouse Genome Informatics, GeneCards, Rat Genome Database, Allen Mouse Brain Atlas, Xenbase, VectorBase, Echinobase, and WormBase databases. Key search terms used were oxidative stress-induced growth inhibitor, Osgin, Osgin1, Osgin2, OKL38, BDGI, c8orf1, and hT41. No limitations were placed on article publication date. Identified articles and data were reviewed in their entirety. Articles were excluded if they did not meet the criteria of being: 1. peer-reviewed; 2. written in or translated to English; or 3. not withdrawn. We organized this review to address every characteristic traditionally associated with examining a gene family, including phylogeny and evolutionary history, biochemical and physiological functions, expression throughout development and adulthood, and role in disease. However, the length and depth of the sections were determined by the availability of the literature.
Phylogenetic trees were constructed from protein amino acid sequences retrieved from the OrthoDB and NCBI databases, as well as NCBI BLAST v.2.16.0 search results [22,23]. Sequences were aligned using CLUSTALW v.2.1 software, and the best-fit amino acid substitution model was selected using MEGA11 v.11.0.13 (Molecular Evolutionary Genetics Analysis) [24,25]. Maximum likelihood (ML) trees were assembled using RAxML-NG v.1.2.2 accessed through the CIPRES Science Gateway v.3.3 [26,27]. Robustness of topologies was assessed using the bootstrap method. Trees were visualized using FigTree v.1.4.4 [22].
3. Phylogeny and Evolution of Osgin Genes
The current available genome data support that Osgin1 and Osgin2 represent a rich and phylogenetically diverse gene family. The Osgin genes are paralogs, related through a gene duplication event. While data suggest that these genes are confined to the domain Eukarya, within this group, they are highly conserved throughout vertebrate species and are found widely within a number of invertebrate phyla, and fungal and protist species. Despite this intriguing evolutionary history, little phylogenetic analysis of these genes has been performed. Ong et al. (2004b) and Goupil et al. (2024) provide the most current in-depth analyses of conservation of the Osgin gene family, performing amino acid alignment demonstrating conservation in the coding regions of Osgin 1 orthologs among rats, mice, C. elegans, and humans [23,28]. These studies also demonstrated conservation of function across these orthologous proteins. Beyond this analysis and the use of BLASTp comparing similarity between Osgin paralogs by Satta et al. (2023) and Hu et al. (2014), no complete investigation into the phylogenetics of Osgin has been performed in the period of over 20 years since its initial discovery [29,30].
In the first analysis of Osgin inter-species conservation, Ong et al. (2004b) analyzed three novel rat Osgin1 cDNAs and compared the sequences with H. sapiens and M. musculus [28]. Ong et al. (2004b) employed BLAST to determine that the 52 kDa OSGIN-1 isoform in R. norvegicus shares 85% and 90% nucleotide sequence homology with its 52 kDa isoform orthologs in Homo sapiens and Mus musculus (GenBank: BC022135.1), respectively. Multiple sequence alignment further showed that rat and mouse (GenBank: BC006032.1) OSGIN-1 orthologs share 91% amino acid and 93% nucleotide sequence identity; while rat and human OSGIN-1 orthologs share 85% nucleotide identity and 80% amino acid identity. When investigating conservation between the human and rat 52 kDa isoforms, Ong et al. (2004b) noted conservation in the coding region but not in the 5′ UTRs, prompting the authors to suggest that recent evolution may have led to the variation in the regulation of these genes [28].
Moreover, Ong. et al. (2004b) postulated that the high degree of similarity between the coding regions of these OSGIN-1 orthologs may indicate a conserved function, a theory supported by additional experimental evidence [28]. Further BLAST searches against the non-redundant database revealed the similarity of OSGIN-1 to several proteins of unknown function, including human C8ORF1 protein (GenBank accession no. NP_004328), now known as OSGIN-2, with an identity of 49% and a similarity of 62%; and the Bacillus halodurans protein BH1623 (GenBank accession no. NP_242489), now referred to as a YpdA family putative bacillithiol disulfide reductase, with an identity of 39% and a similarity of 44%. These results prompted Ong et al. (2004b) to suggest that OSGIN-1, C8ORF1, and BH1623 may belong to a larger family of proteins with similar functions [28].
With the goal of assessing the conservation between the human Osgin1 and Osgin2 paralogs, Hu et al. (2014), in a brief review of OSGIN, performed an alignment of the amino acid sequences of the human Osgin genes using CLUSTALW [30]. The results demonstrated that the two paralogs share 49% sequence identity, predominantly in the C-terminal region. In a study investigating the role of Osgin in Nrf2-regulated endothelial detachment, Satta et al. (2023) analyzed the amino acid and structural similarities between the OSGIN proteins [29]. The authors used CLUSTALO to determine that human OSGIN-1 and OSGIN-2 share a 40.8% amino acid identity and further displayed a large degree of conservation across species. Furthermore, Satta et al. (2023) found a high degree of similarity between the tertiary protein structures of human OSGIN-1 and OSGIN-2 [29].
While earlier conservation analysis of OSGIN was limited to vertebrate species, specifically mammals, in the more recent literature, Goupil et al. (2024) used comparative sequence analysis to determine that the F30B5.4 protein (now named OSGN-1) in C. elegans is an ortholog of the mammalian OSGIN-1 [23]. Goupil et al. (2024) further investigated the conservation of the FAD- and NAD(P)H-binding domains in the C. elegans Osgn1 protein with OSGIN-1 and OSGIN-2 homologs from various vertebrate species (H. sapiens, Xenopus tropicalis, M. Musculus, and Danio rerio), identifying a high degree of similarity. This suggested that protein function may be conserved across OSGIN orthologs. Goupil et al. (2024) provided experimental evidence to support the conservation of function between H. sapiens Osgin1 and C. elegans Osgn1 as expression of a catalytically active Osgn1 in Osgin1-depleted HeLa cells rescued the binucleated phenotype during cytokinesis, suggesting that these proteins are functional orthologs [23]. It is important to note that this result does not necessarily dictate a conserved physiological function, simply sufficient conservation of biochemical function. A deeper understanding of homology in other invertebrates, as shown in Goupil et al., offers an important avenue for phylogenetic understanding of these genes.
Available phylogenetic analyses of Osgin are extremely limited, with no complete phylogenetic analysis currently available despite available sequence data. Recent advances in genome sequence analysis have revealed potential Osgin orthologs in numerous species, including fungi and protists. OrthoDB, a database that sorts publicly available genome data to identify orthologous genes, identified Osgin1 and Osgin2 orthologs in 1866 different species, with 505 being identified in species of fungi across the Ascomycota and Mucoromycota phyla, most prominently among Penicillium and Aspergillus [31]. Several fungal species, predominantly among Mucromycota, were identified as containing Osgin2 orthologs. OrthoDB also identified Osgin1 orthologs in seven species of Alveolata protists, including the protist dinoflagellate marine plankton Symbiodinium microadriaticum; as well as a species of Stramenopile, the unicellular algae Tetraparma gracilis. The conservation of Osgin1 among fungal species is supported by other databases, including the Orthologous Matrix (OMA) browser, which has identified 57 fungal Osgin1 orthologs and several Osgin2 orthologs [32]. This widespread cross-kingdom conservation of Osgin suggests a need for a more thorough investigation of the presence and role of these genes in fungi and all non-Animalia.
In an effort to visualize the evolutionary history of this gene family for this review using available sequence data, a phylogenetic tree was generated using publicly available genome data (Figure 1). The phylogenetic tree was created using protein sequences recorded from the OrthoDB database and NCBI BLAST search results from a diverse range of phyla and species to provide an informative picture of the evolution of the Osgin genes (Supplementary Accession Numbers) [31,33]. The labeling of Osgin1 occasionally as Osgn1 (Danio rerio, Salmo salar, Thunnus albacares, and Caenorhabditis elegans, etc.) follows a naming convention for Osgin genes within certain taxa rather than an indication of a separate paralogous gene [29]. Figure 1 supports that Osgin evolved in a common protist ancestor of animals and fungi some time prior to the divergence of the fungal and animal kingdoms ~1 BYA. The Osgin gene family is isolated within the eukaryotic supergroups Opisthokonta and SAR (Stramenopiles, Alveolates, and Rhizaria), which include only animals and fungi, as well as a number of protist species, respectively.
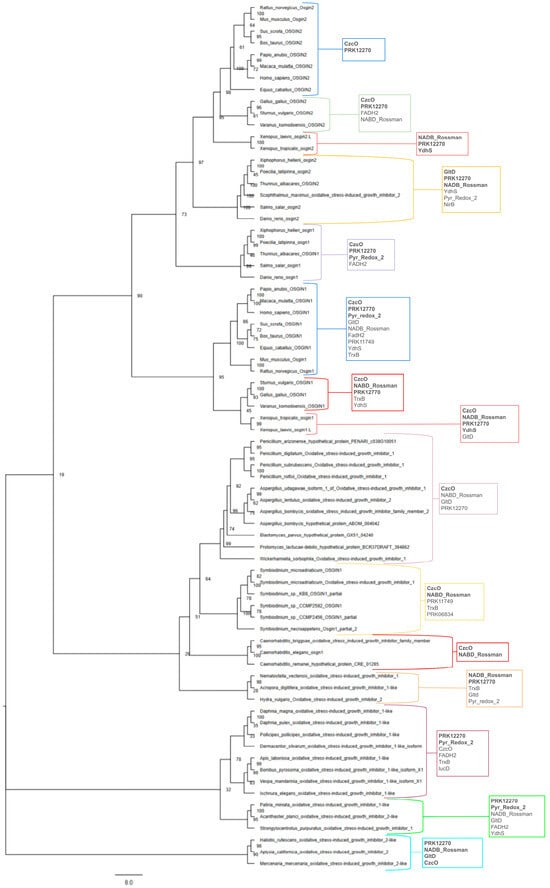
Figure 1.
Maximum likelihood phylogenetic tree depicting evolutionary conservation of Osgin. The evolutionary history was inferred by using the maximum likelihood method and the JTT + G model. The tree with the highest log likelihood (−41,949.196805) is shown. The percentage of trees in which the associated taxa clustered together is shown next to the branches. The initial tree(s) for the heuristic search was obtained by generating 10 random trees and 10 parsimony trees and then selecting the topology with superior log likelihood. The tree is drawn to scale, with branches measured in the number of substitutions per site. This analysis involved 74 amino acid sequences. There were a total of 1243 sites in the final dataset. Evolutionary analyses were conducted in RAxML-NG [26]. Conserved domains within clades are shown, with those conserved in more than half of the studied species being written in bold. This diagram does not attempt any phylogenetic analyses between the homologs and is only a summary of the findings by past literature and potential homologs identified through database searches. Protein accession numbers not included in the diagram are provided in the Supplementary Materials file.
The putative evolutionary history of Osgin1 predicted by Figure 1 mainly follows common patterns in vertebrate and invertebrate evolutionary history. However, surprisingly, Osgin1 in bony fish separates into its own clade from other Osgin1 orthologs, appearing to bear a closer evolutionary relationship to Osgin2 paralogs. Protist orthologs group in a clade with fungi, indicating a greater relationship than to animal orthologs. Interestingly, C. elegans and other nematode Osgin1 orthologs form a monophyletic clade with the fungal and protist orthologs, suggesting that Caenorhabditis Osgn1 orthologs bear a closer evolutionary relationship with fungi than with invertebrate arthropods. This is a trend also seen in Parkinson and Blaxter (2002), who identified that several alcohol dehydrogenase proteins and an FAD-dependent oxidoreductase in C. elegans bore closer similarity to genes in S. cerevisiae than to D. melanogaster and H. sapiens proteins (interestingly, no Osgin orthologs have currently been identified in D. melanogaster) [34]. Parkinson and Blaxter (2002) found that in a neighbor-joining tree, these C. elegans proteins separated into a clade with several fungal species, with no closely related metazoan species; this led them to suggest the gain of these genes in C. elegans through interdomain horizontal gene transfer [34,35]. Evolution in the Osgin2 clade more closely follows the expected vertebrate evolutionary patterns.
Information regarding phylogenetic relationships among Osgin genes can also be gleaned from analysis of conserved domains between OSGIN orthologs. NCBI’s Conserved Domain Database (CDD) was used to identify conserved domains between orthologs. The trends of conserved domains among OSGIN orthologs are shown in Figure 1, with the conserved domain superfamilies identified in more than half of the studied species in each group being in bold. Overall, OSGIN-1 proteins were called as containing a wider range and greater number of conserved domains, while OSGIN-2 proteins were generally called as containing only a CzcO domain and a prk12270 domain, with exceptions in bony fish and amphibians. Invertebrate orthologs appeared to follow the same trends as the OSGIN-1 orthologs, regardless of whether they were called OSGIN-1-like or OSGIN-2-like. Fungi and protists were generally called as containing only conserved domains in the CzcO superfamily, as well as the NABD_Rossman (Rossmann-fold NADPH/NADP+-binding domain) superfamily for protists. Interestingly, Caenorhabditis orthologs follow the same trends as fungi and protists [33,36].
SUPFAM, a superfamily database of structural and functional annotation, identified these OSGIN proteins as containing conserved domains in the FAD/NAD(P)-binding domain superfamily. Furthermore, SUPFAM classifies many of the OSGIN proteins as members of the FAD/NAD-linked reductases, N-terminal and central domains family, or the C-terminal domain of adrenodoxin reductase-like family [37]. The InterPro Protein Families and Domains Database also called these OSGIN proteins as being members of the FAD/NAD(P)-binding domain superfamily and identified them as being in the OKL38 family of proteins, a family containing many fungal and animal proteins [38]. Intriguingly, the InterPro database also putatively identified 81 bacterial proteins encoding a number of oxidoreductases, monooxygenases, and FAD/NAD(P)-binding domain-containing proteins as being members of the OKL38 family. While no database has identified Osgin orthologs in any prokaryotic species, this similarity serves to showcase the ubiquitous nature and conservation of oxidative stress genes across the domains of life.
In summary, the Osgin gene family displays a rich and diverse evolutionary history paralleling the protist origins of animals and fungi. While limited phylogenetic analysis of the Osgin gene family is currently available in the literature, available genomic data show that Osgin genes are highly conserved among a diverse array of species. Furthermore, several studies demonstrate functional and coding sequence conservation among common model organisms. While conservation in the regulation of these genes appears to be limited, studies have confirmed that there is immense evolutionary pressure for the conservation of OSGIN protein structure and function in vertebrates and invertebrates, suggesting it as a gene product essential for cellular activity. Further use of sequence comparison software such as BLASTn and BLASPp as well as conserved domain-identifying software such as NCBI CDD v.3.21 is necessary to identify further OSGIN orthologs across the kingdoms of life. Functional studies as well as phylogenetic analyses of these orthologs using multiple sequence alignment software and diverse phylogenetic tree estimation models are crucial for growing our understanding of the conservation and evolutionary history of this gene family.
4. Structure and Biochemical Function of OSGIN Proteins
4.1. Genomic Structure
While there are multiple studies investigating the genomic structure of both Osgin genes, there is no current consensus. Ong et al. performed the initial genomic characterization of Osgin1, using NCBI BLAST to localize Osgin1 to H. sapiens chromosome 16q23 (2004a) and R. norvegicus chromosome 19q12 (2004b) [28,39]. While the localization assignments are consistent with the current Osgin1 literature [30,40,41], the length of Osgin1 and its exon structure are contested. To characterize the genomic structure of Osgin1, Ong et al. (2004a; 2004b) used dideoxy chain termination to sequence Osgin1 cosmid clones and compared the clones with full-length Osgin1 cDNA amplifications. In H. sapiens, Ong et al. (2004a) determined that Osgin1 spans approximately 18,000 base pairs with eight exons varying from 92 to 1270 base pairs in length [39]. This conflicts with the latest NCBI RefSeq H. sapiens annotation (GRCh38.p14), which estimates that Osgin1 spans approximately 13,000 base pairs with only six exons [41]. Notably, there are consistencies between the models: exons 4–8 of the eight-exon model correspond to exons 2–6 of the six-exon model. However, while the latter model describes the first exon as a 149 base pair segment followed by a 4269 base pair intron, the eight-exon model localizes exons 2 and 3 within this intron [39]. Likewise, Ong et al. (2004b) reported that Osgin1 in R. norvegicus spans approximately 15,000 base pairs with eight exons, yet the current NCBI RefSeq annotation of R. norvegicus proposes that Osgin1 has fifteen exons across 28,830 base pairs [28].
Ong et al. (2004a) also identified two putative promoter regions—P1 and P2—in the human Osgin1 genome using a rapid amplification of cDNA ends (RACE) analysis and ClustalW multiple sequence alignment [39]. Using the MatInspector program, Ong et al. (2004a) identified potential transcription factor binding sites for Ikaros factor 2 (IK2) and upstream stimulating factors in both P1 and P2. However, each promoter had distinct transcription factor binding sites as well, prompting Ong et al. (2004a) to suggest that P1 and P2 are differentially regulated. Additionally, while Ong et al. (2004a) identified a core promoter motif known as an initiator (Inr) within P1, neither promoter includes a TATA or CAAT box [39]. Furthermore, using the CpG Island Searcher program, Ong et al. (2004a) identified putative CpG islands approximately 746 bp and 2500 bp upstream from the putative Osgin1 transcriptional start sites in P1 and P2, respectively.
The genomic structure of Osgin2 in H. sapiens is also inconsistently described in the current literature. Tauchi et al. (1999) conducted shotgun sequencing of five human bacterial artificial chromosome (BAC) clones and aligned these sequences with the human testis cDNA library to identify coding regions. They concluded that human Osgin2 encompasses 25,552 base pairs on chromosome 8q21 and contains six exons between 92 and 3365 base pairs in length [21]. However, Tauchi et al. (1999) supplemented their sequence alignment data with the GENSCAN and GRAIL 2 exon prediction programs, and these results yielded different lengths for all exons except exon 5 (92 base pairs). The NCBI RefSeq H. sapiens annotation further complicates this by proposing that Osgin2 comprises nine exons [41]. To date, no characterization of the Osgin2 promoter region has been published.
4.2. Differential Splicing
Although the genomic structure of the Osgin genes is contested, several studies have identified different protein isoforms that arise from alternative splicing of the Osgin genomes. Building upon their analysis of Osgin1 genomic structure in H. sapiens and R. norvegicus [28,39], Ong et al. used a 5′ RACE analysis, an in vitro transcription and translation study, and a Western blot assay to characterize different OSGIN-1 isoform in both species. In H. sapiens, Ong et al. (2004a) identified three OSGIN-1 isoforms with molecular weights of 52 kDa, 59 kDa, and 61 kDa from four Osgin1 protein-coding cDNA transcripts [39]. Two of these sequences encode an OSGIN-1 isoform with a molecular weight of 52 kDa and an ORF of 477 amino acids; however, these sequences were transcribed from different promoters—P1 and P2—then underwent alternative splicing to produce identical isoforms [39]. Ong et al. (2004a) concluded that alternative splicing of the 5′ UTR and differential promoter usage contribute to the generation of various OSGIN-1 isoforms, a claim supported by Ong and Huynh (2008), who associated promoter P1 with the expression of the 52 kDa OSGIN-1 isoform [42]. The first Osgin1 cDNA sequence isolated by Huynh et al. (2001) encoded a 34.5 kDa OSGIN-1 isoform with an open reading frame (ORF) of 317 amino acids [19]. Ong et al. (2004a) observed low levels of a similar 38 kDa OSGIN-1 isoform in their Western blot assay; however, as the 38 kDa band was in the same lane as the 52 kDa OSGIN-1 isoforms in the blot, Ong et al. (2004a) suggested this isoform may be the result of an internal start codon. In R. norvegicus, Ong et al. (2004b) analyzed three Osgin1 cDNA sequences—one spanning 2.0 kb and two spanning 2.3 kb—but all proteins on the Western blot exhibited an approximate molecular weight of 52 kDa. Although post-translational modifications of the cDNA sequences were not examined in the Western blot, multiple sequence alignment revealed that the three cDNA sequences share the same open reading frame [28], suggesting that alternative splicing of Osgin1 may be conserved across species.
Two OSGIN-2 isoforms have been preliminarily characterized in the current literature. In the first experiment to characterize Osgin2, Tauchi et al. (1999) used a Northern blot assay to identify three Osgin2 cDNA sequence variants spanning 2.9, 3.8, and 4.3 kb [21]. Using NCBI BLASTx, they determined that the 4.3 kb cDNA sequence—considered to be the full-length Osgin2 cDNA with an open reading frame of 4199 bp—is translated into a 505 amino acid protein with a molecular weight of 56.7 kDa [21,43]. An additional OSGIN-2 isoform with an open reading frame of 549 amino acids has been identified [44] but is not characterized in the literature.
4.3. Protein Structure
In terms of protein structure, no nuclear magnetic resonance (NMR), crystallography, or mutagenesis studies have been conducted to date to elucidate the physical structure of OSGIN-1 or OSGIN-2. However, the predicted structures of the OSGIN proteins are available in the AlphaFold Protein Structure Database. Additionally, several protein prediction software programs have identified domains within the H. sapiens OSGIN-1 protein. These domains include Rossman folds [23] and putative N-terminus TrkA and C-terminus Pyr-redox domains [45]. The TrkA domain, a binding site for nerve growth factor (NGF), is associated with superoxide production as NGF-induced neuronal differentiation requires generation of ROS [46], but the specific function of the TrkA domain in OSGIN-1 remains elusive. The Pyr-redox domain has been implicated in redox-dependent processes such as antioxidant defense and regulation of cellular redox state, and it is believed to be conserved in the final exon of all isoforms of H. sapiens OSGIN-1 [39]. Additionally, OSGIN-1 contains a bacillithiol oxidoreductase domain of the YpdA family between amino acid residues 177–471 [30]. The YpdA protein is an FAD-containing NAD(P)H-dependent oxidoreductase buffering compound involved in maintaining cellular redox homeostasis [47]. While these domains are an incomplete representation of the OSGIN proteins, their functions are consistent with the function of OSGIN proteins as mediators of oxidative stress.
4.4. Biochemical Function
A single study, that of Goupil et al. (2024), has identified the biochemical function of OSGIN-1, namely, as a flavin-containing monooxygenase (FMO) [23]. Prior to this publication, there was no literature classifying the biochemical function of either OSGIN protein. Based on previous work by Goupil et al. (2017)—which identified Rossman fold domains and putative FAD- and NAD(P)H-binding domains surrounding a non-canonical monooxygenase (MO) domain in OSGN-1 [48], a structure homologous to the FMO enzyme family—Goupil et al. (2024) proceeded with a DTNB-methimazole biochemical assay to verify the enzymatic activity of OSGN-1. Goupil et al. (2024) observed OSGN-1 oxidize methimazole in vitro and directly oxidized the conversion of nitro-5-thiobenzoate (TNB) into 5,5′-dithiobis(2-nitrobenzoate) (DTNB) [23]. However, in the absence of the NAD(P)H cofactor, this oxidation did not occur. When the assay was repeated with the human OSGIN-1 ortholog, Goupil et al. (2024) observed the oxidation of methimazole and binding of OSGIN-1 to the FAD cofactor. This catalytic activity suggests that both OSGN-1 and OSGIN-1 are FMOs, but the substrates of these enzymes remain unknown. This method of observing methimazole binding in a putative FMO with NADPH- and FAD-binding sites is well supported by the literature. For example, a study by Eswaramoorthy et al. (2006) used crystallography to characterize the mechanism of action of SPBP16F5.08c, a putative FMO in Schizosaccharomyces pombe [49]. As this FMO was classified using the same DTNB-methimazole biochemical assay, it may serve as a future point of comparison to better understand the biochemical function of OSGIN-1. Additionally, FMOs are divided into eight subclasses by functional properties, structural motifs, and the specific oxidation reaction they catalyze [50,51]. Further comparison between OSGIN-1 and other FMOs will be possible once OSGIN-1 is categorized into a subclass and its specific mechanism of action and substrate have been elucidated. This can be accomplished by performing a spectrophotometric analysis of the catalytic activity of OSGIN-1. Since the publication of Goupil et al. (2024), no further work has supported or refuted the classification of OSGIN-1 as an FMO, nor has a functional analysis of the biochemical function of OSGIN-2 been published in the literature.
Prior to the characterization of the biochemical function of OSGIN-1 in Goupil et al. (2024), the function of the OSGIN proteins was primarily explored by determining their subcellular localization and interacting partners. Upon the initial discovery of OSGIN-1, Huynh et al. (2001) determined that the protein lacks both a transmembrane domain and a nuclear localization signal peptide, prompting their hypothesis that the protein is cytosolic [19]. Goupil et al. (2024) support this assertion, as the authors used confocal time-lapse imaging and immunofluorescence to observe a cytosolic localization of OSGIN-1 in dividing HeLa cells until the late telophase, when it colocalized with RhoA to the midbody [23]. Liu et al. (2014) expanded the characterization of OSGIN-1 localization to human hepatocellular carcinoma tissue samples; they observed nuclear localization of OSGIN-1 in six of twenty-eight HCC tissues, whereas all remaining HCC tissues and non-cancerous controls had cytosolic localization [52]. Yao et al. (2008) and Hu et al. (2012) observed translocation of OSGIN-1 from the cytosol to the mitochondria and nucleoplasm, respectively, following the induction of DNA damage [45,53]. However, it is unknown how OSGIN-1 was imported into the nucleus as no canonical NLS has been identified to date. Although the subcellular localization of OSGIN-2 is less explored, Tauchi et al. (1999) used the Protein Subcellular Localization Prediction Tool (PSORT) to suggest that OSGIN-2 also has a cytosolic localization [21].
Relatively few studies have characterized the interacting partners of the OSGIN proteins. A table of putative interacting partners identified by the STRING protein–protein interaction database in H. sapiens, R. norvegicus, and M. musculus for OSGIN-1 and OSGIN-2 are listed in Supplementary Tables S1 and S2, respectively. As for experimental in vitro studies, Zhang et al. (2020) used an immunoprecipitation assay and a luciferase assay to suggest that OSGIN-1 regulates the activity of TFEB, a transcription factor that regulates autophagy- and lysosome-related genes [54]. Additionally, Xie et al. (2023) used an in vitro kinase assay and an in vitro binding assay to support the conclusion that OSGIN-1 increases the binding affinity between tubulin beta 3 class III (TUBB3), a mediator of microtubule dynamics, and dual specificity tyrosine phosphorylation regulated kinase 1A (DYRK1A), a kinase known to phosphorylate TUBB3 at serine 172 [55]. Enhanced OSGIN-1-mediated binding between DYRK1A and TUBB3 induces phosphorylation of TUBB3 serine 172, which effectively reduces tubulin polymerization, a mechanism of tumor migration and invasiveness [55]. Furthermore, Jia et al. (2024) supplemented bioinformatic predictions with co-immunoprecipitation experiments to identify glutamate-cysteine ligase modifier subunit (GCLM), the rate-limiting enzyme in glutathione (GSH) synthesis, as OSGIN-1-binding proteins [56]. Most recently, Deng et al. (2025) performed a Western blot assay in OSGIN-1 overexpression cells to identify OSGIN-1 as a putative modulator of the interaction between ataxia-telangiectasia mutated (ATM) and AMP-activated protein kinase (AMPK) to regulate the AMPK signaling pathway [57]. Yet, some studies provide conflicting evidence regarding the mechanism of these putative OSGIN-1 interactions. Yao et al. (2008) used a ChIP assay to identify PADI4 as a negative regulator of OSGIN-1 expression in breast cancer MCF-7 cells [53]. However, Brennan et al. (2017) challenged this claim as they determined that PADI4 knockdown does not affect OSGIN-1 expression in human astrocytes [58]. Instead, Brennen et al. (2017) proposed that OSGIN-1 regulates PADI4 transcription. To date, no in vitro studies have characterized interacting partners of OSGIN-2.
5. Physiological Function of OSGIN Proteins
The classification of OSGIN-1 as a flavin-containing monooxygenase (FMO) by Goupil et al. (2024) represents a significant advancement in elucidating the role of the OSGIN proteins. However, further functional experiments are necessary to confirm this classification and to clarify the relationship between the FMO activity of OSGIN-1 and its role as a mediator of oxidative stress. The current literature provides limited experimental characterization of the OSGIN proteins, with a notable gap in the literature on OSGIN-2. Nevertheless, the functional studies that have been conducted, summarized in Table 1 and Table 2 with more extensive information available in Supplementary Tables S3 and S4, have implicated the OSGIN proteins in regulating key cellular processes, including cell proliferation, autophagy, and apoptosis.

Table 1.
Physiological function of Osgin1. Functional assays characterizing the physiological function of Osgin1. Studies selected to highlight the cell/tissue cultures or in vivo studies in which Osgin1 physiological function was investigated. See Supplementary Materials for the complete list of functional assays.
Table 2.
Physiological function of Osgin2. Functional assays characterizing the physiological function of Osgin2. Studies selected to highlight the cell/tissue cultures or in vivo studies in which Osgin2 physiological function was investigated. See Supplementary Materials for the complete list of functional assays.
5.1. Role of OSGIN in Detecting and Countering Oxidative Stress
Several functional studies have highlighted the role of the OSGIN proteins in detecting and countering oxidative stress by modulating molecular responses to phospholipid oxidation, apoptosis, and autophagy. For example, Li et al. (2007) reported that OxPAPC, an oxidized modified LDL, stimulates Osgin1 expression through NADPH oxidase (Nox) signaling [20]. Nox signaling, however, induces superoxide production [20]. Treatment with NAC, a superoxide scavenger, negates OxPAPC stimulation of Osgin1, thereby suggesting that Osgin1 responds to oxidative stress produced by oxidized LDLs [20]. Hammad et al. (2009) further supported this assertion when they treated human U937 cells with oxLDL-containing immune complexes and observed an upregulation of Osgin1 expression following oxidized LDL treatment in human U937 cells [59]. These results implicate Osgin1 in the anti-inflammatory response to phospholipid oxidation. Of note, siRNA knockdown studies have implicated Osgin1 as a regulator of several inflammatory and anti-inflammatory genes, as well as the inflammatory response molecules IL-8, ATF4, and KLF4 [71]. Given that the accumulation of oxidized phospholipids is linked to inflammatory diseases like atherosclerosis, OSGIN-1 is positioned as a key mediator of the anti-inflammatory response to OxPAPC-induced oxidative stress.
Likewise, OSGIN-2 has been implicated in countering ROS production and oxidative stress. Defamie et al. (2008) performed RNA-sequencing in patients with initial poor graft function following orthotopic liver transplantation and observed upregulation of Osgin2 [66]. As ROS accumulation is associated with ischemia-reperfusion injury of transplanted tissues, the upregulation of Osgin2 suggests that Osgin2 is a sensor of oxidative stress and ROS accumulation. Keßler et al. (2016) also identified Osgin2 as a downstream target of miR-199a, a microRNA that is downregulated in hypoxic conditions, reinforcing the assertion that Osgin2 expression is linked to oxidative stress conditions [67].
5.2. Role of OSGIN in Regulating Cell Proliferation
Although neither Goupil et al. (2024) nor subsequent studies directly relate the FMO activity of OSGIN-1 to its physiological role in mediating oxidative stress, Goupil et al. proposes a cellular function for OSGIN-1 as a cytokinetic regulator. In a previous study, Goupil et al. (2017) investigated regulators of cytoplasmic bridge stability in primordial germ cells (PGCs), necessary for recruiting the cellular machinery for abscission during late cytokinesis [48]. Using RNAi-mediated depletion, they found that OSGN-1, the C. elegans ortholog of OSGIN-1, is essential for the accumulation of ANI-2, a short anillin protein involved in actomyosin scaffolding at the PGC cytoplasmic bridge [48]. Based on this result, Goupil et al. (2017) hypothesized that OSGN-1 acts upstream of RhoA, a GTPase that recruits and activates actomyosin contractility regulators, to promote localization of ANI-2 to the intracellular cytoplasmic bridge. Goupil et al. (2024) observed a similar phenotype between OSGN-1-depleted and RhoA-depleted C. elegans PGCs and surmised that OSGN-1 is a cytokinetic regulator. To determine if OSGN-1 regulates RhoA activity, Goupil et al. (2024) employed live cell imaging using a GFP-bound anillin probe (GFP::AHPH) and performed RNAi-mediated depletion of OSGN-1, resulting in a significant 50% reduction of GFP::AHPH fluorescence during cell division and a lack of detectable fluorescence at the PGC intracellular bridge in late cytokinesis [23]. Goupil et al. (2024) further supported their hypothesis that OSGN-1 regulates RhoA binding at the PGC intercellular bridge by using confocal time-lapse imaging and immunofluorescence of GFP-bound OSGN-1 in HeLa cells to reveal its colocalization with RhoA at the cell midbody during late telophase. While Goupil et al. (2024) does not directly implicate the role of OSGN-1—or its OSGIN-1 functional ortholog—in regulating cytokinesis to ROS production, ROS accumulation is associated with the activation of RhoA. However, the mechanism, and whether it is direct or indirect, is not yet understood [72,73,74].
As Goupil et al. (2024) was unable to conclude that OSGIN-2 is a functional ortholog of OSGIN-1, it could not be concluded that OSGIN-2 regulates RhoA activity [23]. However, OSGIN-2 has been implicated in regulating cell proliferation in other functional studies. For instance, in gastric cancer cells, knockdown of Osgin2 inhibited tumor cell proliferation and increased the number of cells stuck between the G2/M phases of the cell cycle [68]. Furthermore, Shuai et al. (2022) identified Osgin2 as a negative regulator of osteogenesis in osteoporotic jawbone bone marrow mesenchymal stem cells (BMSCs) subjected to oxidative stress by regulating the retinoic acid-related orphan receptor alpha (RORα)/bone sialoprotein-osteocalcin (BSP-OCN) signaling pathway [69].
5.3. Role of OSGIN in Mediating Apoptosis
Another proposed physiological function of the OSGIN proteins is a mediator of apoptosis. This function was first suggested when overexpression of Osgin1 in Chang liver cells resulted in higher rates of cell death [60]. Interestingly, the 38 kDa OSGIN-1 isoform originally isolated by Huynh et al. (2001) was more potent at inducing cell death than the 52 kDa isoform, leading Ong et al. (2007) to suggest that the cell death function of OSGIN-1 may be encoded within its N-terminal region. Osgin1 overexpression also resulted in apoptosis of U2OS cells [53]. Yao et al. performed immunostaining of OSGIN-1 after apoptosis-inducing Cl-amidine treatment and observed localization to the mitochondria, resulting in altered mitochondria morphology and the release of cytochrome c, an activator of the cellular apoptotic function. Later work by Liu et al. (2014) supports the role of OSGIN-1 in apoptosis as OSGIN-1 knockdown resulted in a significant decrease in the apoptotic index of cisplatin-treated cells [52]. Finally, Yuan et al. (2021) used an RNA binding protein immunoprecipitation assay to identify Osgin1 as a downstream target gene of methyltransferase-like 3 (METTL3), an RNA methylase that performs the M6A mRNA methylation modification [61]. METTL3 was upregulated by PM2.5, a component of air pollution capable of inducing genetic or epigenetic variations in airway epithelial cells including upregulation of apoptosis. Thus, Yuan et al. (2021) concluded that M6A modification of OSGIN-1 by METTL3 was a response to PM2.5-induced airway epithelial cell injury by inducing apoptosis.
While the connection between Osgin2 and apoptosis has not been elucidated to date, expression of Osgin2 was upregulated following activation of PGC-1, a protein involved in maintaining mitochondrial biogenesis [70]. Thus, while direct interaction between OSGIN-2 and the mitochondria has not yet been elucidated, Raharijaona et al. (2009) suggest Osgin2 may be involved in regulating mitochondrial function similar to its Osgin1 homolog.
5.4. Role of OSGIN in Mediating Ferroptosis
Similar to its proposed physiological function of regulating apoptosis, OSGIN-1 has also been implicated in ferroptosis. Ferroptosis is a form of regulated, nonapoptotic cell death driven by iron-dependent phospholipid peroxidation [75]. Ferroptotic death occurs when phospholipid peroxidases (PLOOHs), a subcategory of ROS, accumulate and disrupt the integrity of the plasma membrane. To prevent the accumulation of PLOOHs, enzymes involved in mitigating ROS and lipid peroxidation are expressed. OSGIN-1 was first implicated in this ferroptosis response by Jia et al. (2024) as they measured upregulation of OSGIN-1 after treating human pancreatic ductal adenocarcinoma cells (PDACs) with ferroptosis inducers [56]. Subsequently, Jia et al. (2024) observed that knockout of either OSGIN-1 or NFE2-like BZIP transcription factor 2 (NFE2L2) promoted ferroptosis in PDAC, but re-expression of OSGIN-1 in NFE2L2-deficient cells rescued cellular ferroptosis resistance. This suggested that OSGIN-1 upregulation in ferroptosis is mediated by the NFE2L2 transcription factor, a conclusion that was supported by a ChIP assay that showed direct binding of NFE2L2 to the OSGIN-1 promoter following treatment with ferroptosis inducers, but not the doxorubicin tumor-suppressive positive control. The association between OSGIN-1 and ferroptosis is further supported by Deng et al. (2025), who observed upregulation of Osgin1 mRNA and OSGIN-1 protein expression in ovarian cancer cells treated with erastin, a treatment known to induce ferroptosis [57]. However, cells treated with Fer-1, an antioxidant that inhibits ferroptosis, before erastin demonstrated no change in OSGIN-1 expression. These studies further support the role of OSGIN-1 in regulating accumulation of ROS and thereby mediating ferroptosis, although the exact mechanism by which OSGIN-1 mediates ferroptosis remains unclear.
5.5. Role of OSGIN in Mediating Autophagy
OSGIN-1 also plays a multifaceted role in regulating autophagy across a variety of cellular stress conditions. Osgin1 was upregulated in vitro in response to an autophagy-inducing cigarette smoke extract treatment; however, expression of two autophagy markers—MAP1LC3B and SQSTM1—was enhanced following Osgin1 knockdown in smoking/stress conditions [63]. Of note, two gene markers for autophagy induction—microtubule-associated protein 1 light chain 3 beta (MAP1LC3B) and sequestosome 1 (SQSTM1)—expression were not enhanced following Osgin1 knockdown in normal conditions. Zhang et al. (2020) reported that overexpression and siRNA knockdown of Osgin1 increased and impaired the autophagic response in human breast cancer MCF-7 cells, respectively. Furthermore, fractionation and immunoprecipitation assays performed by Zhang et al. (2020) revealed significant interaction between OSGIN-1 and transcription factor EB (also known as TFEB), a regulator of autophagy and lysosome-related genes [54]. Khoi et al. (2022) propose that Osgin1 expression is regulated by X-box binding protein 1 (XBP1) as part of the palmitic acid (PA)-induced lipotoxicity response in the endoplasmic reticulum of human endothelial cells [64]. Upregulation of Osgin1 counteracts the effects of lipotoxicity by promoting cell migration to maintain the autophagy response [64]. Zheng et al. (2022) identified Osgin1 as a downstream target of FXR—a ligand-activated transcription factor involved in inflammatory responses—in a pathway to induce autophagy in exocrine pancreas cells [65]. Satta et al. (2023) implicated both Osgin1 and Osgin2 in the autophagic activity of human coronary artery endothelial cells (HCAECs) [29]. Overexpression of each Osgin gene induced upregulation of proteostasis genes HSP70 and BAG3, resulting in the accumulation of autophagic vesicles and upregulation of genes in the HSP70/BAG3-controlled chaperone-mediated autophagy pathway [29]. Collectively, these findings indicate that Osgin1 is an essential mediator linking cellular stress to the autophagy response.
5.6. Regulation of Osgin Expression
How Osgin gene expression is regulated remains an area of active investigation. Virtually nothing is known regarding the regulation of Osgin2 expression. For Osgin1 expression, the p53 and nuclear factor E2-related factor (Nrf2) transcription factors have been identified as mediators of Osgin expression in a variety of tissues, stress conditions, and physiological contexts. However, there is disagreement among various studies as to whether the regulation of Osgin is p53- or Nrf2-dependent.
Several studies have concluded that OSGIN-1 activity is mediated by p53. For instance, Yao et al. (2008) postulated that Osgin1 mediates apoptosis in a p53-dependent mechanism [53]. First, Yao et al. (2008) used RT-PCR to compare Osgin1 expression in cell lines with the wild-type and a mutant, inactive form of p53 and only observed upregulation of Osgin1 in cells with functional p53. Subsequently, Yao et al. (2008) used annexin V staining to observe an increase in apoptotic cells following overexpression of Osgin1, correlating the apoptotic function of Osgin1 to its regulation by p53. Furthermore, Yao et al. (2008) identified a putative p53 binding site at −720 bp in the Osgin1 promoter and observed increased p53 binding at this site following doxorubicin treatment, suggesting that p53 regulates the apoptotic response of Osgin1 to DNA damage [53]. This work was supported by Hu et al. (2012), who used immunostaining of U2OS cells to observe colocalization of p53 and OSGIN-1 to the mitochondria following DNA damage [45]. Additionally, Hu et al. (2012) performed co-immunoprecipitation and pull-down assays to determine that p53 and OSGIN-1 undergo direct protein–protein interactions. Zhang et al. (2020) also implicated p53 in mediating Osgin1 expression in autophagy as a decrease in autophagy was observed after Osgin1 knockdown following DNA damage by etoposide treatment [54]. Zhang et al. only observed increased Osgin1 expression following etoposide treatment in cells with wild-type p53, not in p53-deficient cells, prompting their conclusion that Osgin1 is activated in response to cellular stress or DNA damage in a p53-dependent manner.
Despite the conclusions drawn by Yao et al. (2008), Hu et al. (2012), and Zhang et al. (2020), other studies suggest that OSGIN is regulated in a p53-independent manner. Liu et al. (2014), for example, observed localization of OSGIN-1 to the mitochondria of PLC-8024 cells with a p53 loss-of-function mutation [52]. Additionally, Jia et al. (2024) explored whether the TP53 pathway controls the upregulation of OSGIN-1 during ferroptosis [56]. The researchers did not observe a change in OSGIN-1 upregulation in p53-knockout PDAC following treatment with ferroptosis inducers, promoting the conclusion that p53 does not regulate OSGIN-1 in ferroptosis. However, knockout of the NFE2L2 transcription factor in PDAC cells inhibited OSGIN-1 upregulation after ferroptosis induction, suggesting that NFE2L2, not p53, regulates OSGIN-1 expression in ferroptosis. Further exploring whether p53 regulates the physiological functions of OSGIN-1, Liu et al. (2014) did not observe a significant correlation between p53 mutations and OSGIN-1 expression in hepatocellular carcinoma tissue samples, indicating that p53 is involved in, but not necessary for, the pro-apoptotic function of OSGIN-1 [52]. Brennan et al. (2017) also challenged the p53-dependent mechanism of OSGIN-1 in apoptosis, as siRNA knockdown of p53 in human astrocytes had no effect on the expression of Osgin1 mRNA transcripts [58]. Instead, Brennan et al. (2017) proposed that Osgin1 transcription is regulated by Nrf2 in human astrocytes, whereas p53 is a downstream target of Nrf2-regulated Osgin1. They supported this assertion with immunofluorescence microscopy experiments in which monomethyl fumarate (MMF), an activator of the Nrf2 signaling pathway, significantly induced p53 translocation to the nucleus [58]. However, p53 was unable to translocate to the nucleus following siRNA knockdown of Osgin1, prompting Brennan et al. (2017) to suggest that OSGIN-1 may regulate p53-mediated transcription of oxidative stress response genes through the Nrf2 signaling pathway.
Nrf2 is a redox-sensitive transcription factor involved in the oxidative stress response. In a recent review, Baird and Yamamoto (2020) characterized the Nrf2–KEAP1 (Kelch-like ECH-associated protein 1) pathway that provides a protective response to oxidative stress: In homeostatic conditions, KEAP1 represses the expression of cytosolic Nrf2 by forming a KEAP1/CUL3/RBX1 E3 ubiquitin ligase complex, ubiquitinating Nrf2 and targeting it for proteasomal degradation. However, in response to oxidative stress, KEAP1 is oxidized by Nrf2 inducers on cysteine residue 151, inactivating its E3 ubiquitin ligase activity [76]. Once it has escaped ubiquitination, Nrf2 can translocate to the nucleus and promote transcription of antioxidant genes. Many antioxidant genes contain an antioxidant response element (ARE) sequence in their promoter to which Nrf2 binds to promote transcription [61]. Yet, the only study to characterize the promoter of Osgin1, Ong et al. (2004a), did not identify this sequence [34]. Experimental evidence has demonstrated that the Osgin genes are transcriptionally regulated by Nrf2 [27,29,58,77,78], but the molecular mechanism of this modulation, and whether the mechanism is ARE-dependent, remains a matter of continued investigation.
The Nrf2 signaling pathway has been implicated in the response of OSGIN-1 to phospholipid oxidation. For example, Li et al. (2007) observed translocation of Nrf2 to the nucleus of HCAECs following OxPAPC induction, a treatment known to induce Osgin1 expression [20]. They also observed upregulation of OSGIN-1 expression following treatment with MG115, a proteasome inhibitor that enhances Nrf2 nuclear accumulation [20]. Conversely, Li et al. observed an 86% decrease in OSGIN-1 expression following siRNA-mediated knockdown of Nrf2 in MG115-treated cells. Overall, these results suggest that nuclear translocation of Nrf2 promotes Osgin1 transcription. Li et al. (2007) identified PEIPC, one of three primary active components of OxPAPC, as the stimulator of Osgin1 expression. Further supporting this finding, Yan et al. (2014) observed increased Osgin1 expression in a dose-dependent manner following epoxyisoprostane E2 treatment, a fatty acid at the sn-2 position of PEIPC, until siRNA knockdown of Nrf2 nullified this upregulation [70]. Collectively, these findings underscore Nrf2 as a central regulator of OSGIN-1 expression in response to phospholipid oxidation, illustrating its essential role in cellular stress responses.
Conflicting findings between Yamashita et al. (2024) and Brennan et al. (2017) underscore the ambiguity regarding the role of Nrf2 in mediating the apoptotic effects of Osgin1. Yamashita et al. (2024) investigated the impact of methylmercury, a known neurotoxin, on apoptosis in C17.2 mouse neural stem cells and found that methylmercury treatment led to significant upregulation of Osgin1 [58,62]. This increase in Osgin1 mRNA and OSGIN-1 protein levels was countered by actinomycin D, a transcription inhibitor, prompting Yamashita et al. (2024) to conclude that methylmercury induces Osgin1 transcription. Yamashita et al. (2024) also eliminated the increase in Osgin1 expression following siRNA knockdown of Nrf2 in methylmercury-treated cells and concluded that the Nrf2 signaling pathway regulates Osgin1 expression. Additionally, transfecting C17.2 cells with an Osgin1 overexpression plasmid resulted in a significant increase in cleaved caspase-3, an enzyme implicated in apoptotic induction, implying that Osgin1 upregulation promotes apoptosis [62]. As a result, Yamashita et al. (2024) concluded that methylmercury activates the Nrf2 pathway to upregulate Osgin1, enhancing apoptosis in C17.2 cells. The results from Brennan et al. (2017) contradict this by showing that, while Nrf2 regulates Osgin1 expression, Nrf2-mediated Osgin1 did not influence apoptosis in human astrocytes [53]. In the presence of MMF, siRNA knockdown of p53 and Nrf2 significantly induced apoptosis, whereas Osgin1 knockdown had no effect on apoptosis [58]. This discrepancy suggests that, despite the agreement on Nrf2’s role in regulating Osgin1, the effect of Nrf2-mediated Osgin1 expression on apoptosis remains unresolved.
In summary, while there is a clear role of the OSGIN-1 protein in apoptosis, autophagy, and cell proliferation in response to oxidative stress, the underlying mechanisms are complex and involve multiple regulatory pathways. While some studies, namely Yamashita et al. (2024) and Brennan et al. (2017) or Hu et al. (2012) and Liu et al. (2014), present seemingly contradictory findings, further research is needed to elucidate the specific mechanisms of OSGIN regulation across different cell types and stress conditions. Additionally, Brennan et al. (2017) suggested that distinct OSGIN isoforms might be differentially regulated, highlighting a potential area for further investigation [58]. Given the established roles of p53 and Nrf2 in oxidative stress responses and their apparent involvement in OSGIN regulation, additional studies are required to clarify the contexts in which each regulatory mechanism operates.
6. Expression of Osgin Genes
Analysis of the spatiotemporal expression patterns of the Osgin genes in invertebrate and vertebrate species offers an important avenue to understanding their physiological role. Unfortunately, there are minimal data detailing the expression of Osgin genes in the current literature. The majority of available data have been provided through RNA-sequencing (RNA-seq), with only a limited number of spatial in situ hybridization (ISH) or immunocytochemistry (ICC) analyses that explore tissue-specific Osgin expression. Below, we review the current Osgin expression data using available sources of mRNA and protein expression data in published articles, as well as gene expression and organism-specific expression databases. RNA-seq expression levels will be quantified using the following terminology: low (0.5–10 TPM), moderate (11–1000 TPM), or high (>1000 TPM), when appropriate. More detailed expression data are available in Supplementary Tables S6–S10.
6.1. Osgin Gene Expression in Invertebrates
The current analysis of Osgin expression in invertebrates is limited to few organisms, including C. elegans, Strongylocentrotus purpuratus (purple sea urchin), Culex quinquefasciatus (southern house mosquito), Aedes aegypti (yellow fever mosquito), and Biomphalaria glabrata (freshwater snail). To date, the Osgin genes have not been identified in D. melanogaster and Musca domestica (the common house fly). Although the only studies to characterize Osgin expression in invertebrates have been from RNA-seq analyses, these studies show that Osgin genes display broad temporal and spatial expression.
In C. elegans, RNA-seq studies have detected Osgn1 expression from early embryonic stages throughout adulthood (Supplementary Table S5). Low levels of Osgn1 expression have been observed in the pharyngeal muscle, intestines, germline cells, and hypodermal seam of C. elegans embryos and continue into larvae stages [79]. The highest level of Osgn1 expression in C. elegans occurs in the early larvae stages, particularly in the developing nervous system. Notably, Osgn1 is also expressed in the dauer larval stage, an alternative developmental stage in which larvae arrest to resist oxidative stress and anoxia [80]. Similar expression patterns continue into the young adult and adult stages.
While expression data of Osgin1 are less available in other invertebrate species, it maintains similar spatiotemporal expression patterns. In S. purpuratu (sea urchin), RNA-seq data show that Osgin1 is expressed from cleavage into the early pluteus stage after the larva has hatched [81]. In C. quinquefasciatus (mosquito), Osgin1 expression is detected from the larval stage, post-eclosion, and into adulthood. Specifically, expression is observed in the antenna and hindlegs of adults. Tissue-specific RNA-seq data in adult I. scapularis shows low Osgin1 expression in the synganglion [82].
Osgin2 displays a broad temporal expression pattern, predominantly localized to the sex tissues, sensory organs, and digestive system [82]. In Leptotromibidium pallidum (mite), Osgin2 expression is detected in both the larval and adult stages. Similarly, A. stephensi shows Osgin2 expression from embryo to adult stages, with moderate expression observed in the ovaries, fat body, and digestive and excretory systems of adult females. Observed expression patterns in A. arabiensis, A. albiminus, and A. aegypti (mosquito species) further demonstrate expression of Osgin2 in sex tissues. Broader Osgin2 expression has been detected in adult B. glabrata (snail), particularly in the albumin gland, kidney, heart, CNS, ovaries, testis, and digestive system.
6.2. Osgin Gene Expression During Vertebrate Development
Osgin1 expression data in early vertebrate development, from oocytes to blastula stages, consist solely of RNA-seq and microarray studies in D. rerio, X. laevis, X. tropicalis, and M. musculus (Supplementary Table S5). Prior to fertilization, moderate expression of Osgin1 has been detected in M. musculus oocytes [83]. Following fertilization, expression of Osgin1 and the ortholog Osgn1 was detected in M. musculus and D. rerio, respectively, during the cleavage and blastula stages. However, Osgin1 expression was not observed during the early development of Xenopus embryos [84].
In later development, from gastrulation to the postnatal period, more extensive Osgin1 expression data are available in H. sapiens, M. musculus, O. cuniculus, D. rerio, X. laevis, and X. tropicalis using RNA-seq (Supplementary Table S5). In M. musculus, D. rerio, and H. sapiens, additional spatial in situ hybridization (ISH) and microarray data are available. Osgin1 expression data are limited in non-mammalian vertebrates as tissue-specific in situ data are only available in D. rerio. Employing ISH, D. rerio displays expression of Osgn1 from gastrulation through larval stages. During gastrulation and organogenesis, Osgn1 is primarily expressed in the CNS, epidermis, periderm, eye, and pronephric duct, while during the postnatal stage, expression is localized to mouth, anus, and intestine [85]. Global RNA-seq data collected in D. rerio show Osgn1 expression from cleavage onward, displaying earlier expression than identified in the ISH data (Supplementary Table S5). In X. laevis and X. tropicalis, RNA-seq data reveal that Osgin1 is expressed from early gastrulation through organogenesis [84]. However, tissue-specific in situ expression data are currently unavailable for Xenopus during development, offering limited spatial comparison between the non-mammalian vertebrates.
In mammalian vertebrates, RNA-seq data do not reveal a conserved Osgin1 expression pattern during later development. However, comparing spatial data across species demonstrates stronger similarity in Osgin1 expression across species in the developing CNS, liver, kidneys, and reproductive organs. In M. musculus, RNA-seq studies have detected moderate Osgin1 expression in the CNS, liver, intestine, forelimb and hindlimb buds, heart, and reproductive organs between gastrulation and postnatal stages (Supplementary Table S5). While spatial expression analyses predominantly support this pattern of expression, there is some discrepancy between the ISH and microarray data. Of note, while the ISH studies in M. musculus detect moderate Osgin1 expression in the CNS, expression is not observed in the liver, unlike RNA-seq and microarray data [86]. In H. sapiens, RNA-seq data detect low-to-moderate Osgin1 expression in the lungs and ganglionic eminence of developing embryos. While these data alone do not indicate much similarity in expression with M. musculus, additional microarray studies detect Osgin1 expression in the liver, amniotic fluid, metanephros, and testis of H. sapiens embryos [83]. To date, no Osgin1 expression data have been collected in R. norvegicus during development. While further work is needed to address the inconsistency between RNA-seq and spatial expression analyses in H. sapiens and M. musculus, the available data support some commonalities in Osgin1 expression across mammalian vertebrates.
Osgin2 expression data in the early development of vertebrates are available for X. laevis, X. tropicalis, M. musculus, S. scrofa, and D. rerio using RNA-seq and microarray studies (Supplementary Table S6). Pre-fertilization, low expression of Osgin2 has been detected in X. laevis and S. scrofa oocytes but has not been detected in X. tropicalis oocytes [83]. Following fertilization, expression of Osgin2 has been detected in X. laevis, X. tropicalis, and M. musculus from the cleavage through blastula stages.
In later development, Osgin2 expression data are widely available through RNA-seq analyses in D. rerio, H. sapiens, M. musculus, O. cuniculus, X. laevis, and X. tropicalis. In situ hybridization has been performed in D. rerio and M. musculus. In non-mammalian vertebrates, Osgin2 is expressed in the eye, although temporal expression patterns conflict between fish and amphibians. In D. rerio, ISH and RNA-seq reveal Osgin2 expression in the eye at the pharyngula stage during organogenesis and the hatching stage. However, RNA-seq data of X. laevis and X. tropicalis show that Osgin2 is expressed earlier from gastrula to organogenesis, although no spatial data are available for comparison.
Unlike Osgin1, which exhibits variable expression patterns between mammalian vertebrates, Osgin2 shows consistent patterns of expression, predominantly in the CNS, heart, and sex tissues. During gastrulation, tissue-specific RNA-seq data localize Osgin2 expression to the mesodermal cells, epiblast, and ectoplacental cone in M. musculus embryos. During early organogenesis, both ISH and RNA-seq analyses highlight emerging expression in the heart, CNS, limb buds, and yolk sac. Additional microarray data reveal low-level expression in the respiratory primordium and developing sensory systems, such as the otic placode, otic vesicle, and optic fissure. In H. sapiens and O. cuniculus, RNA-seq data support primary Osgin2 expression in the heart and CNS. These patterns continue into the middle and late stages of organogenesis, with ISH and RNA-seq data showing expression in the brain, spinal cord, and ganglia of mammalian species. In M. musculus, Osgin2 continues to be expressed in sensory systems such as the cochlea, membranous labyrinth, olfactory bulb, retina, and lens of the eye. RNA-seq and microarray data further detect Osgin2 expression in the developing mammalian sex tissues, as well as the kidneys and digestive system of M. musculus. To date, no Osgin2 expression data have been collected in R. norvegicus during development (Supplementary Table S6).
6.3. Osgin Gene Expression in Adult Vertebrate Organisms
Similar to the late stages of embryonic development, Osgin1 expression in adult vertebrates is primarily localized to the kidney, liver, and testes, with some species showing expression in additional tissues (Supplementary Table S5). Although spatial microarray expression data are available in a few adult organisms, the majority of Osgin1 expression data in adult vertebrates is derived from RNA-seq studies. In non-mammalian vertebrates, RNA-seq data in X. laevis and X. tropicalis both detect low levels of Osgin1 expression in the liver, but otherwise, the data differ between species. Whereas moderate Osgin1 expression is observed in the mesonephros of adult X. tropicalis, expression in X. laevis is identified in the intestine, stomach, kidney, pancreas, spleen, and testis [83,84]. RNA-seq data in D. rerio display a similar Osgin1 expression pattern to X. laevis, with moderate expression detected in the spleen, intestine, testis, and kidney as well as the heart, granulocytes, pharyngeal gill, and brain [83].
Similar to non-mammalian vertebrates, expression of Osgin1 in mammalian vertebrates, namely M. musculus, R. norvegicus, and H. sapiens, is consistently detected at moderate levels in the liver, kidneys, intestine, muscle tissue, and genitourinary tissues (Supplementary Table S5). In murine expression studies, microarray data support this pattern of expression, with additional Osgin1 expression being observed in the granulocytes, adrenal gland, lung, bone marrow, and esophagus [83]. Tissue-specific RNA-seq conducted in adult R. norvegicus and H. sapiens displays a fairly consistent pattern of Osgin1 expression. Notably, both R. norvegicus and H. sapiens demonstrate low levels of Osgin1 expression in the CNS—specifically, the cerebellum and frontal cortex of the former and the spinal cord of the latter—unlike M. musculus [83].
Osgin2 expression in adult vertebrates is primarily expressed in the brain, heart, and sex tissues, as seen in the late stages of embryonic development (Supplementary Table S6). In non-mammalian vertebrates, RNA-seq in X. laevis and X. tropicalis both show Osgin2 expression in the brain, heart, testes, liver, and ovary tissues. Similarly, RNA-seq data in D. rerio also show Osgin2 localized to the brain and the head. In mammalian vertebrates, namely H. sapiens, M. musculus, and R. norvegicus, Osgin2 expression data are primarily available in RNA-seq analyses and show broad expression. Like non-mammalians, mammalian vertebrates show expression in the CNS and sex tissues. Additional RNA-seq and microarray studies in M. musculus, R. norvegicus, and H. sapiens show further Osgin2 expression in the digestive system, visual and reproductive systems, immune tissue, and the peripheral nervous systems.
7. The Role of Osgin in Disease
Since its discovery, the Osgin gene family has been implicated in tumorigenesis and disease-induced apoptosis (Table 3) [19,28,39,52,55,60,68,78,87,88]. From RNA-seq and microarray differential expression studies, Osgin expression is seen across a wide range of cancer types including brain glioblastomas, epithelial carcinomas, and breast cancer (Supplementary Table S9). However, research has increasingly showcased the roles of Osgin1 and Osgin2 in a wider range of pathologies, including neurological conditions and other varied disorders including arthritis, relapsing-remitting multiple sclerosis, sepsis, and COVID-19 infection (Supplementary Table S10). Furthermore, while the current literature primarily compares the baseline expression of Osgin between healthy and diseased tissues, there is some, albeit limited, work investigating the underlying pathological mechanisms of the Osgin gene family. While there have been some experimental studies that have investigated these pathological mechanisms, most research, as detailed below, involving differential Osgin expression is correlational, most often as RNA-seq and microarray studies.
7.1. The Role of Osgin in Breast Cancer
In the initial identification of Osgin1 by Huynh et al. (2001), researchers established the link of the Osgin family to tumorigenesis [19]. In an experiment to identify abnormal expression of growth factors in rat mammary epithelial cells, upregulation of Osgin1 was seen throughout the progression of pregnancy and lactation. Also, in situ hybridization showed Osgin1 mRNA transcripts localized in mammary gland tissue, and Osgin1 expression was correlated with a reduction in new cell formation. Building on previous studies linking augmented breast cancer risk to older age pregnancies [89], Huynh et al. (2001) extended their investigation to human breast cancer cell lines to determine if dysregulation of Osgin1 expression was critical for the proliferation of breast cancer cells. Differential expression between human breast cancer cell lines and healthy breast tissue was assessed with the Northern blot analysis of cell line poly(A) RNA [19]. While some Osgin1 expression was observed in the cells transfected with human breast cancer cell lines, these cells exhibited much lower expression compared with healthy tissue. Finally, increased expression was examined through transfection of Osgin1 cDNA into MCF-7 breast cancer cells, with reduced tumor proliferation being measured in both in vitro and in vivo lactating rat models. As the results from Huynh et al. (2001) suggest that Osgin1 may be implicated in growth inhibition of cancerous cells in breast tissue, subsequent research has continued to characterize the regulatory role played by Osgin1 in tumorigenesis, especially in breast cancer.
The mechanistic pathway of Osgin1 in breast cancer was further explored with chorionic gonadotropin (CG)-mediated reduction in mammary carcinogenesis. Ong et al. (2004b) isolated three mRNA isoforms of the R. norvegicus homolog of Osgin1 [28]. CG treatment had previously been associated with protection against mammary carcinoma during pregnancy [90]. Through in situ hybridization of CG treated differentiated secretory epithelial cells, Ong et al. (2004b) showed upregulation of these isoforms following CG treatment in mammary glands compared with untreated cells [28]. In addition, transfection of the overexpressed Osgin1 homolog protein in rat liver cells induced apoptosis, suggesting a possible link from CG treatment to mammary carcinoma destruction via upregulation of Osgin1. While this does not demonstrate that Osgin1 is the downstream agent of CG, it suggests that Osgin1 is involved in the pathway of CG’s protection of breast tissue.
Osgin1 has also been implicated in PI3K/Akt/Nrf2 pathways for responding to oxidative stress in breast cancer tumor reduction. Tsai et al. (2017) found that docosahexaenoic acid (DHA) induces the expression of Osgin1 in MCF-7 breast cancer cells, which in turn induces apoptosis through the release of cytochrome C from the mitochondria with increased co-expression of p53 [78]. Downregulation of PI3K/Akt/Nrf2 pathways all downregulated Osgin1 expression and its induction of apoptotic cell markers, overall supporting the potential use of DHA in inducing apoptosis in breast cancer through induction of Osgin1 in these pathways. Tsai et al. (2021) later built on this by extending DHA cellular effects via induction of Osgin1 in AMPK-mediated autophagy pathways [91]. Separate DHA treatment and overexpression of Osgin1 in MCF-7 cells resulted in similar upregulation of p-AMPKαT172, supporting another possible pathway for Osgin1’s impact within breast cancer tissue.
Contrary to the Nrf2-mediated tumor suppression pathway of Osgin1 presented in Tsai et al. (2017), Bottoni et al. (2024) instead found that triple-negative breast cancer (TNBC) cells can exploit this pathway in order to prevent cell death via cytoprotective autophagy [87]. While exploring the overexpression of the cystine/glutamate antiporter SLC7A11/xCT in mesenchymal stem-like subtype (MSL) TNBC cells, the researchers found that the increased cytosolic concentration of cystine induces expression of the Nrf2 pathway through cysteinylation and inactivation of KEAP1, a suppressor of Nrf2. In turn, upregulation of SLC7A11/xCT was positively correlated with upregulation of Nrf2’s downstream targets, including Osgin1, and negatively correlated with tumor cell apoptosis. Based on past studies, Bottoni et al. proposed that Osgin1 expression in TNBC cells contributes to tumor promotion by triggering autophagy [87]. The resulting autophagy helps maintain cellular homeostasis in response to stressful conditions, though this conclusion is highly speculative. Even then, this study highlights how Osgin1 may not be strictly tumor-suppressive as suggested by other papers, with tumors being able to take advantage of the protein’s autophagy pathway for cytoprotective effects.
Osgin1 also appears to be a part of wider physiological disruptions caused by breast cancer. Cancerous cells often release cytokines and hormones that can result in broader changes throughout an organism, and Hojo et al. (2017) investigated this idea with mouse models of triple-negative breast cancer (4T1). RNA-seq showed changes in the expression of hepatic circadian genes in the liver of mouse cell lines with transplanted mammary tumors [92]. Interestingly, while many genes follow rhythmic expression, only a small set of genes were compromised under 4T1 conditions, including Osgin1. Furthermore, qRT-PCR showed that oxidative stress genes coding for ETC subunits were downregulated upon 4T1 transplantation, suggesting a correlation between increased oxidative stress and abnormal Osgin1 expression. Therefore, Hojo et al. illustrated that Osgin1 is involved in the broader biological impacts of breast cancer in the liver [92], but the relationship between Osgin1 and oxidative stress in this pathway was not elucidated.
7.2. The Role of Osgin in Hepatocellular Cancer
In addition to breast cancer, the expression of Osgin1 and its mechanism and hepatocellular cancers have been studied in several papers. Liu et al. (2014) showed that not only is Osgin1 differentially expressed in hepatocellular carcinomas, but allele variants of the transcript are associated with tumorigenesis [52]. In a comparison of 400 tumor samples from human patients to non-cancerous hepatic tissue, the full transcriptome of tissue samples was assessed to find allele imbalances, and the researchers found a specific increase in an Osgin1 variant (nt 1494: G-A, codon 438: Arg-His). This mutation was solely seen in the hepatocellular carcinoma samples, so functional assays were performed in tumor xenografts into mice to understand the effect of this mutation. While Osgin1 normally induces apoptosis following chemotherapy administration, this Osgin1 variant was less effective at apoptosis induction. This may be due to decreased translocation of the Osgin1 variant from the nucleus to mitochondria in comparison with normal Osgin1 transcripts. Liu et al. (2014) also found general downregulation of Osgin1 in hepatocellular carcinomas, with a reduction of 24.7% in comparison with surrounding healthy tissue, and this was correlated to lower survival times of the donor patients [52]. Furthermore, patients with high expression of the Osgin1 variant had on average shorter survival spans and the lowest apoptotic rate [52]. Therefore, the role of Osgin1 in hepatocellular carcinomas may stem from both downregulation and increased expression of less effective mutated transcripts.
The role of 5′ UTRs has also been shown to be essential in the downregulation of Osgin1 in hepatocellular cancers. Building on their previous work in mammary gland cancers, Ong et al. (2007) extended Osgin1 analysis to hepatocellular carcinomas. Through immunohistochemistry, OSGIN-1 was found to be at reduced or even undetectable levels in 74 of 92 hepatocellular carcinoma samples included in the study, matching the prior work with mammary gland carcinoma [60]. The amount of OSGIN-1 expression was also inversely correlated to liver cancer stage/progression, indicating Osgin1 expression as a potential staging biomarker; induced overexpression in transfected Chang liver cells resulted in significantly higher cell death rates, proposing a potential novel cancer treatment method. More interestingly, translational suppression in 5′ UTRs appeared to be key in the reduced expression of Osgin1 in the live tumor samples. Deletion of the 5′ UTRs significantly rescued Osgin1 expression in transfected Chang liver cells, with increased expression being seen across all three Osgin1 cDNA transcripts isolated in Ong et al. (2004a) [39]. From this, the researchers theorized that increased expression of translational suppression proteins under cancerous conditions may potentially be binding to the 5′UTRs to reduce translation of Osgin1 mRNA; in turn, this limits the role of Osgin1 in the oxidative stress-induced apoptosis pathway.
7.3. The Role of Osgin in Ovarian Cancer
Osgin1 has been specifically linked to ovarian cancer suppression and the efficacy of chemotherapy-induced ferroptosis. Deng et al. (2025) supplemented previous RNA-seq studies with qRT-PCR and immunohistochemistry (IHC) studies to conclude that OSGIN-1 expression is significantly lower in ovarian cancer tissue compared with non-cancerous ovarian tissue [57]. To elucidate the role of OSGIN-1 in ovarian cancer growth, Deng et al. (2025) overexpressed OSGIN-1 in mice injected with OVCAR3 tumor cells and observed decreased tumor volume compared with controls, suggesting that OSGIN-1 has a tumor-suppressive effect in ovarian tissue. Deng et al. (2025) also implicated OSGIN-1 in the ferroptosis of ovarian cancer cells; while ovarian cancer cells treated with erastin, a molecule known to induce ferroptosis, demonstrated decreased levels of ROS, malondialdehyde (MDA), and iron, knockdown of OSGIN-1 restored these ferroptosis biomarkers to near-baseline levels [57]. To investigate the signaling pathway through which OSGIN-1 regulates ferroptosis in ovarian cancer cells, Deng et al. (2025) searched the BioGRID protein–protein interaction database to identify ataxia-telangiectasia mutated (ATM), a serine/threonine kinase that phosphorylates AMPK to activate the AMPK signaling pathway, as a putative interacting partner of OSGIN-1. Subsequent qRT-PCR and Western blot assays revealed that OSGIN-1 acts as a negative regulator of solute carrier family 2 member 3 (SLC2A3) via the AMPK signaling pathway. Using flow cytometry to identify the expression of markers of cell death, Deng et al. (2025) concluded that, while OSGIN-1 promotes ferroptosis, SLC2A3 inhibits the ferroptosis cell death response in ovarian cancer cells. Thus, Deng et al. (2025) identified the OSGIN-1/SLC2A3/AMPK axis as a putative clinical target for ovarian cancer therapeutics.
One chemotherapy agent that has been reported to induce apoptosis in some liver cancer cell cultures is sorafenib. Sorafenib, a multitarget, multikinase inhibitor, has shown promise in ovarian cancer treatment in phase II clinical trials, but it has failed phase III. This result prompted Deng et al. (2025) to explore the role of the OSGIN-1/SLC2A3/AMPK axis in the effectiveness of sorafenib [57]. First, in comparing the tumor size of mice treated with sorafenib and with and without overexpression of either OSGIN-1 or SLC2A3, Deng et al. (2025) observed the smallest tumor size in OSGIN-1 overexpression mice treated with sorafenib. This prompted the researchers to conclude that OSGIN-1 promotes the antitumor effects of sorafenib. Furthermore, treating mice with sorafenib and an SLC2A3-neutralizing antibody showed a greater antitumor effect than the antibody alone, suggesting that the SLC2A3-neutralizing antibody improved the ferroptosis-inducing effect of sorafenib. Ultimately, the work by Deng et al. (2025) presents future avenues for exploring the role of OSGIN-1 in ovarian cancer tumorigenesis, particularly as a potential therapeutic for enhancing regulated mechanisms of cell death in tumor cells.
7.4. The Role of Osgin in Other Cancers
The Osgin genes have also been implicated in a variety of other cancer types. Ong et al. (2004a) also investigated the role of Osgin1 in renal cell carcinoma. Similar to their findings with mammary gland and hepatocellular carcinomas, Western blot and immunohistochemical studies showed low expression or even undetectable levels of Osgin1 in kidney tumors in comparison with surrounding non-cancerous tissue [39]. The role of Osgin1 as a tumor suppressor in kidney carcinoma was confirmed, with transfected cells having a high rate of apoptosis. Ong et al. (2004a) proposed several hypotheses for the cause of this downregulation, including point mutations in regulatory sequences, hypermethylation in the promoter region, or loss of heterozygosity (a common trend among other genes on chromosome 16q23.3) [39]. However, their results could not confirm any of these ideas, only suggesting that the disruption of Osgin1 leads to a lessening of regulation over cell proliferation and differentiation.
Building on the role of Osgin1 in tumor suppression, additional evidence is found in DNA methylation arrays of World Trade Center terrorist attack survivors. Environmental exposure to a variety of toxic substances, including heavy metals, asbestos, glass fibers, and combusted jet fuel has been linked to pervasive health effects in the survivors of the attacks, and Arslan et al. (2020) genetically investigated the impacts of this in their study. DNA methylation analyses of blood samples from survivors and non-survivors from 2001 showed that Osgin1 had one of the top two highest methylation differences out of 24 suspected tumor suppressor genes [88]. The methylation rate of CpG sites had an average increase of 54.4%, supporting the link between the downregulation of Osgin1 and increased risk for tumor growth. While the study does not describe a mechanistic impact, it supports an epigenetic link to carcinogenic environmental exposure to cancer development and potentially other exposure-related disease pathways via reduced expression of Osgin1 [88].
In contrast to the prior studies highlighting tumor suppression, Xie et al. (2023) instead found evidence of Osgin1 acting in tumor promotion in non-small cell lung cancer (NSCLC) [55]. Using Western blots and immunohistochemistry to assess expression of Osgin1 and TUBB3, a protein vital to tubulin depolymerization, Xie et al. (2023) observed high upregulation of Osgin1 in NSCLC tumors. Higher expression levels also correlated with increased tumor size and reduced survival rates. Furthermore, knockdown of Osgin1 and TUBB3 reversed NSCLC tumor progression, and Osgin1 knockdown additionally restored the effect of the anti-cancer drug Gefitinib in tumor suppression [55]. Mechanistically, Xie et al. (2023) found that Osgin1 promotes the phosphorylation of TUBB3, activating a tubulin depolymerization pathway that may explain this unique role in tumor progression. This suggests that Osgin1 is involved in multiple distinct cellular pathways, with its role in tumor suppression or progression being dependent upon these pathways across cancer types.
In comparison with Osgin1, much less research has been performed elucidating the mechanistic role of Osgin2 in cancer. However, Osgin2 genes have been utilized in creating prognostic models for colorectal cancer survival spans [93]. Oxidative stress is a widely known risk factor related to cancer progression, with ROS-induced DNA damage acting as one model for tumorigenesis. Chen et al. (2022) therefore decided to utilize the expression patterns of oxidative stress-related genes (OXEGs) to create a prognostic genetic tool for patients with colorectal carcinomas. Following the sequencing of 177 colorectal cancer tumor samples from current patients, Chen et al. (2022) found fourteen OXEGs that were consistently differentially expressed in cancerous and non-cancerous tissues [93]. A risk model was constructed using a combination of multivariate and univariate Cox regression analysis as well as LASSO regression analysis, relating differential expression of OXEGs to the potential for tumor progression. Osgin2 was one of these OXEGs used in the prognostic model, with consistent upregulation in many of the colorectal cancer tumors. While Chen et al. (2022) admitted that the underlying function of Osgin2 is still relatively unknown, its consistent expression patterning could be used in developing more nuanced cancer prognoses.
Similar upregulation of Osgin2 was observed bioinformatically in other cancers. Using The Cancer Genome Atlas Stomach Adenocarcinoma (TCGA-STAD) data collection, Wang et al. (2023) observed upregulation of Osgin2 in glioblastomas, pancreatic cancers, and all stages of gastric cancer [68]. Further characterization of the role of Osgin2 in gastric cancer revealed that gastric carcinoma cells and tissues contain high levels of OSGIN-2 [66]. Moreover, higher levels of Osgin2 expression are correlated with poorer prognosis. Knockout of Osgin2 in gastric cancer cells via siRNA transfection led to cell cycle arrest and inhibited tumor proliferation [68].
Another study correlated the expression of Osgin2 with the prognostic outcome of patients with soft tissue sarcomas [67]. Keßler et al. (2016) analyzed expression of hypoxia-associated miR-199a-5p, a micro-RNA, in ninety-six soft tissue sarcoma tissue samples. Using a luciferase reporter assay, Keßler et al. (2016) concluded that co-transfection of SAOS-2 cells with miR-199a-5p induces 26.2% downregulation of Osgin2 due to an miR-199a-5p binding site in the 3′ UTR [67]. miR-199a-5p transfection also decreased the expression of OSGIN-2 proteins under hypoxic conditions [67]. Moreover, a Kaplan–Meier analysis associated low miR-199a-5p expression with decreased patient survival time, although this association was not statistically significant [67]. Thus, while this study provides insight into the link between miRNA regulation of stress genes implicated in tumorigenesis in a hypoxic environment, the mechanism relating Osgin2 to tumor hypoxia is not yet understood.
7.5. The Role of Osgin in Other Conditions and Diseases
While the majority of research implicating the Osgin genes in disease focuses mainly on their roles in cancers, Osgin1 and Osgin2 have also been abnormally expressed in a wide variety of conditions and disorders. For example, Yildrim, Tola, and Dağ (2020) have implicated underexpression of Osgin1 in polycystic ovary syndrome (PCOS), an endocrine disorder that can lead to infertility and widespread metabolic disorder [94]. Serum levels of Osgin1 were correlated with a variety of anthropometric measurements in patients suffering from PCOS. Osgin1 was found to be consistently downregulated across patients, with Yildrim, Tola, and Dağ, positioning Osgin1 expression as a negative diagnostic indicator for PCOS [94]. Increased expression was often found to reduce the risk of cardiovascular disease and metabolic syndrome disorders, both common secondary effects of PCOS. While they admit that the small sample size of the study limits any conclusions they can make, the researchers hypothesize that Osgin1 is vital in maintaining homeostasis in metabolic processes for patients diagnosed with the disorder.
Multiple studies have also investigated the upregulation of Osgin1 in response to smoking. Wang et al. (2017) obtained airway epithelial cells from healthy smokers and nonsmokers, testing the expression levels of Osgin1. Osgin1 expression was upregulated in smokers in both the large and small airway epithelium, and this was confirmed across PCR microarray data [63]. Also, to determine if the Osgin1 overexpression was due to oxidative stress or DNA damage, airway epithelial cells were treated directly with H2O2, a common source of ROS. Following treatment, the observed Osgin1 upregulation indicated that overexpression was due to the oxidative stress processes. When exposed to cigarette smoke, human airway epithelium cells also showed upregulation of Osgin1 in microarray and RNA-seq data [63]. These results indicate that oxidative stress caused by exposure to cigarette smoke causes the overexpression of the functional Osgin1 gene and protein. Building on this idea, Satta et al. (2023) similarly showed that both Osgin1 and Osgin2 were upregulated in in vitro human coronary artery endothelial cells and in vivo mouse aortas following exposure to cigarette smoke [29]. When Osgin1 and Osgin2 were overexpressed, Satta et al. found increased endothelial cell detachment and cell cycle arrest at the S-phase; furthermore, detachment was found to result in Osgin-mediated dysregulation of the molecular chaperone Hsp70, demonstrating novel treatment targets for long-term smokers.
Cigarette smoke exposure’s upregulation of Osgin1 has also been used to investigate fibrosis in COPD. Tang et al. (2024) exposed human bronchial epithelial cells (HBECs) to cigarette smoke extract in their exploration of fine (2.5 μm or less in diameter) particulate matter’s (PM2.5) link to COPD pathology [95]. Osgin1 upregulation was first confirmed in HBECs treated with PM2.5, and this was also associated with increased fibrosis biomarkers within the cells. Mechanistically, an experimental knockdown of Osgin1 resulted in lower fibrosis biomarkers, indicating that Osgin1 acts as an upstream agent within the COPD fibrosis pathway. In addition, by using miRNA targeting software, Tang et al. were able to identify a miRNA, miR-654–5p, that inhibits translation of Osgin1, blocking its downstream effects related to fibrosis [95]. A Western blot analysis supported this targeting as well as showed Osgin1’s role in inducing autophagy in HBECs that contributes to overall lung fibrosis. Therefore, Tang et al. showcase a novel pathway for treatment of COPD fibrosis, outlining a new regulatory axis in which PM2.5 disinhibits Osgin1 expression by blocking the actions of miR-654–5p, resulting in dysregulated autophagy and increased fibrosis.
Osgin2 has also been implicated in the development of osteoporosis in rat jawbone models. The loss of bone marrow stromal cells (BMSCs) that make bone cells is associated with aging and loss of estrogen levels, resulting in less protection against oxidative stress [69]. Osgin2 is associated with bone marrow loss, specifically in Nijmegen breakage syndrome and retinitis pigmentosa type 62. Under normal conditions, the receptor RORα is able to regulate the differentiation of BMSCs to promote osteogenesis via transcriptional upregulation of osteogenic genes OCN and BSP. Shuai et al. (2022) hoped to elucidate the relation of Osgin2 expression on RORα and ultimately give a better understanding of the pathophysiology of osteoporosis. OCN and BSP levels were first compared via qRT-PCR in rat osteoporitic jawbone BMSCs under the addition of hydrogen peroxide (a common reactive oxygen species). Higher oxidative stress was negatively correlated with the osteopromotive genes, and the effect was lessened with the addition of antioxidants [69]. Shuai et al. (2022) noted that Osgin2 transcription was augmented at these sites following the addition of hydrogen peroxide [69]. Following the knockdown of Osgin2 in the rat models, a reversal was seen towards osteogenesis, with higher levels of OCN and BSP following hydrogen peroxide addition in comparison with the first trial. Therefore, upregulation of Osgin2 measured in osteoporosis appears to be implicated in the destructive properties of reactive oxygen species; Shuai et al. (2022) hypothesized that Osgin2 is a negative indicator of osteogenesis when BMSCs are exposed to increased oxidative stress [69].
Table 3.
Osgin pathological expression in correlational studies. Differential Osgin expression comparing pathological with nonpathological cells and tissues in various cancers and conditions. Pathologies were selected to highlight based on comparable studies focusing on the same pathology in the same tissue type. See Supplementary Materials for a full list of pathologies. An up-facing arrow signifies upregulation in comparison with nonpathological tissue, while a down-facing arrow signifies downregulation. Expression data sourced from [96,97,98,99,100,101,102].
| Pathology | Method | Osgin1 Expression | Osgin2 Expression |
|---|---|---|---|
| Breast Cancer | RNA-seq | ↓ | ↑ |
| Cholangiocarcinoma | RNA-seq | ↓ | ↑ |
| Hepatocellular Carcinoma | RNA-seq | ↑ | ↑ |
| Lung Carcinoma | RNA-seq/ microarray | ↑ | ↓ |
| Osteosarcoma | RNA-seq/ microarray | ↓ | ↑ |
| Glioma | RNA-seq/ microarray | ↓ | ↑ |
| Nevus Sebaceous of Jadassohn | RNA-seq | ↑ | ↓ |
| Sepsis | RNA-seq | ↑ | ↓ |
| Graft vs. Host Disease | RNA-seq | ↓ | ↑ |
The majority of research into the Osgin gene family’s role in disease has been performed in correlational studies, largely through RNA-seq or microarrays that compare expression in pathological with nonpathological tissues. Overall, correlational experiments illustrate that Osgin1 and Osgin2 are differentially expressed across a wide range of pathologies, including many types of cancer [91,92,95], infections [98,99], chronic conditions [100,101,102], and various other disorders [97,103,104]. Some general trends regarding expression can be found through these studies. Osgin1 and Osgin2 tend to have opposite expression patterns, and Osgin1 is found to be more often downregulated in cancerous tissues while Osgin2 is more often upregulated. However, the results of differential expression studies can be inconsistent, indicating that expression patterns may be more dependent on the specific biological pathway the gene is involved in as well as variations among different cancer and organism types. This emphasizes the need for a mechanistic understanding of Osgin1 and Osgin2 so that the reasoning behind upregulation or downregulation can be better understood. Differential expression studies currently dominate research on Osgin expression in disease because the gene is often implicated in large transcriptomic or proteomic studies, so there needs to be a heightened motivation in disease research on the specific mechanistic actions of these seemingly ubiquitous genes.
8. Conclusions
While there has been significant progress in understanding the role of the Osgin genes, overall, this remains an understudied gene family, particularly in light of its physiological importance. Following the discoveries of Osgin1 and Osgin2 by Huynh et al. (2001) and Tauchi et al. (1999), respectively, ongoing research has augmented our understanding of these genes with regard to evolutionary history, structure, and function [19,21]. On a larger scale, analysis of RNA-seq studies that identified differentially expressed Osgin genes have provided greater insight into the expression of Osgin in pathological and nonpathological tissues, leading to advances in elucidating the underlying roles of the Osgin genes in disease-promoting or -suppressing pathways. Despite a growing body of research characterizing the Osgin genes in recent years, there are still many unanswered questions surrounding the Osgin genes, particularly Osgin2. In this review of the current literature on the Osgin gene family, we identify several areas that require further investigation for fully understanding these genes: analysis of the evolutionary history of the genes, elucidation of the OSGIN protein structure, perturbation studies to better elucidate function, positioning of Osgin genes in signaling and gene networks, in-depth and diverse analysis of expression patterns across vertebrate and invertebrate eukarya, and a mechanistic understanding of Osgin expression under normal and pathological cellular conditions.
The current research is still lacking detailed or complete investigation into the phylogenetic and evolutionary history of the Osgin gene family. Although some initial BLASTn analyses were performed in the seminal set of papers by Huynh et al. (2001) and Ong et al. (2004b), as well as more recently in Satta et al. (2023), the characterization of Osgin conservation is limited to extensive conservation of the genes within vertebrate eukarya and between the Osgin1 and Osgin2 paralogs [19,28,29]. More recently, Goupil et al. (2024), although not a dedicated phylogenetic analysis, represents a promising example of an attempt to probe this gene family’s evolutionary conservation in an invertebrate organism, revealing a high degree of conservation within a non-chordate species [23]. Available genome data also indicate conservation of OSGIN proteins across animals, fungi, and protists, an exciting avenue of investigation. The current state of Osgin literature calls for a need for greater inquiry into the phylogenetic history and conservation of this gene family as a whole, with an emphasis on invertebrate, fungal, and protist species. Further functional analyses and more extensive estimations of the phylogenetic history of OSGIN using multiple sequence alignment software and diverse tree construction models will give greater insight into the conservation of this ancient gene family.
With respect to the biochemical functions of the OSGIN proteins, OSGIN-1 was recently identified as a flavin-containing monooxygenase (FMO) that requires the binding of FAD and NAD(P)H cofactors [23]. However, FMOs are a broad class of enzymes with a range of structural and catalytic properties. Further categorization of OSGIN into its FMO subclass can be accomplished with spectrophotometric analysis of the FAD and NAD(P)H cofactors while OSGIN-1 is enzymatically active. This categorization will provide insight into the type of reactions OSGIN-1 can catalyze, modulation of OSGIN-1 activity, and perhaps the substrate of the OSGIN-1 enzyme. Additionally, bioinformatic analysis of the Osgin1 gene have pinpointed several functional domains within the OSGIN-1 structure, such as the Pyr_redox_2 and TrkA flavoprotein domains and the YpdA buffering compound [40,45]. Techniques to elucidate the structure of OSGIN-1 such as NMR, X-ray crystallography, cryo-electron microscopy, and mutagenesis studies are necessary to verify these domains and identify other potential domains or interacting partners. Moreover, RNAi- or CRISPR/Cas9-mediated knockout experiments can be used to evaluate the functionality of each domain within OSGIN-1.
However, despite the advances in characterizing OSGIN-1, the structure and biochemical function of OSGIN-2 is drastically understudied. Although Goupil et al. (2024) concluded that OSGIN-2 is not a functional ortholog of C. elegans OSGN-1, the DTNB-methimazole assay will determine if OSGIN-2, like OSGIN-1, is an FMO [23]. Furthermore, bioinformatic and in vitro characterization of the structure of OSGIN-2 is necessary to elucidate the functionality of OSGIN-2 and its conservation with its OSGIN-1 homolog.
The localization of Osgin in metabolic gene and signaling pathways, including numerous oxidative stress response pathways, remains unclear. In particular, Osgin1 has been characterized as a transcriptional target of Nrf2 and p53 across varying tissues and stress conditions, but the mechanism of these interactions is unclear. Putative binding sites have been identified for both p53 [53] and Nrf2 [62] upstream from the Osgin1 transcriptional start site, but further functional analysis, such as an electrophoretic mobility shift assay, must be performed to establish the function of these binding sites. Furthermore, RNAi- or CRISPR/Cas9-mediated deletion of the p53 and Nrf2 binding sites may elucidate the necessity of each transcription factor in regulating the physiological function of the OSGIN proteins. Finally, additional co-immunoprecipitation and experiments and binding studies should be performed to identify the downstream targets of the OSGIN proteins in oxidative stress response pathways.
The regulation of Osgin gene expression is not well understood. While two promoter regions—P1 and P2—have been identified for Osgin1 [39], further characterization of promoter and enhancer regions via ChIP-Seq experiments for both Osgin genes could provide critical information regarding protein binding sites and epigenetic modification at the transcriptional level. For example, many oxidative stress response genes have an ARE sequence identified in their promoter [76], and the only paper to characterize the promoter of Osgin1, Ong et al. (2004a), did not identify this element. More extensive analysis of the promoters of both Osgin genes to identify whether ARE is present will provide further insight into the role and regulation of Osgin in the oxidative stress pathway.
Surprisingly, at the RNA processing level, there is still no consensus in the current literature regarding the number of introns and exons in Osgin1 or Osgin2. Moreover, while both genes undergo alternative splicing to produce multiple isoforms of each Osgin homolog in vitro, the functional differences and differential expression of each isoform have not been characterized. Although the current literature has primarily characterized the 52 kDa and 56.7 kDa isoforms of OSGIN-1 and OSGIN-2, respectively, the experimentation of Brennan et al. (2017) suggested that different OSGIN isoforms may have different physiological functions [58]. Therefore, identifying which OSGIN isoforms regulate each in vitro physiological function and, once identified, performing overexpression and knockout studies of each isoform is necessary to determine the functional differences between each OSGIN isoform. Finally, at the post-translational level, few putative protein–protein interacting partners have been characterized in vivo or in vitro for OSGIN-1, and none have been characterized for OSGIN-2. To supplement the existing bioinformatic proposed interacting partners, crosslinking, pull-down, co-immunoprecipitation assays are needed to elucidate the intracellular interactions of the OSGIN proteins.
RNA-sequencing has been the primary technique used to analyze expression patterns during organismal development. These experiments show that Osgin1 primarily localizes to the CNS, kidney, testes, and liver and Osgin2 localizes to the brain, heart, and sex tissues in vertebrates and invertebrates. While RNA-sequencing data are available in many vertebrates during embryogenesis, there are currently only two in situ hybridization analyses of Osgin1 and Osgin2 in M. musculus and D. rerio that characterize expression during development, limiting spatial comparison between organisms and other techniques. Even in M. musculus, there are discrepancies between the ISH, RNA-seq, and microarray data that cannot be resolved without additional in situ analyses. Notably, the M. musculus RNA-seq study quantifies Osgin1 expression in the CNS, kidney, liver, and testis during organogenesis, whereas the ISH study by Diez-Roux et al. (2011) characterizes expression only in the CNS [86]. Similarly, expression patterns cannot be compared between non-mammalian vertebrates because ISH data are not available in X. laevis and X. tropicalis. Invertebrate expression data of Osgin are limited because there are few RNA-seq studies. Thus, the use of additional experimental techniques such as in situ hybridization, immunocytochemistry, qRT-PCR, single-cell RNA sequencing, or spatial transcriptomics can provide higher specificity and a more comprehensive overview of baseline expression patterns.
In a majority of the current Osgin literature, Osgin has been studied in disease states. However, the aim of these studies was to identify up- or downregulated genes in disease, so little is known regarding the mechanism of Osgin in pathogenesis. While some studies have partially elucidated Osgin’s mechanistic role in pathways like p-AMPKαT172 autophagy [91] or protein–protein interactions with TUBB3 [55], a large share of research related to Osgin1 or Osgin2 are wide-reaching cancer expression analyses, reporting differential expression across a wide variety of genes with varied and potentially unrelated physiological function. While the existing set of differential expression studies allows for initial patterns of expression to emerge across diseases and emphasizes how Osgin1 and Osgin2 are highly relevant in many pathologies, a mechanistic understanding of Osgin in disease states is lacking in the current literature. Therefore, greater emphasis must be placed on deciphering the roles of Osgin1 and Osgin2 within larger biological pathways—both in normal development and disease states—to understand the role of Osgin in pathogenesis. This can be accomplished by performing Osgin overexpression and knockdown experiments to further understand the understudied functions of the OSGIN proteins and connect this function to the expression of Osgin in disease. Finally, in addition to exploring the use of Osgin in possible breakthroughs in cancerous or chronic conditions, greater emphasis should be placed on understanding other aspects of Osgin1 and Osgin2 beyond their roles in disease.
Due to the apparent link between inappropriate Osgin expression and pathogenesis, the Osgin gene family exhibits potential for therapeutic applications. The current literature shows that Osgin1 and Osgin2 display differential expression in a variety of cancers and diseases, though this is, in most cases, the extent of clinical knowledge. To increase the biomedical relevance of Osgin research, effort must be focused on extending exploration into tangible therapeutic targets and constructs. This potential for therapeutic benefit has already been shown with the use of SCL2A3-neutralizing antibodies for ovarian cancer treatment in Deng et al. (2025) [57]. With a better understanding of the role of OSGIN proteins in the pathogenicity of signaling pathways, rather than simply an assessment of differential expression, viable therapeutic targets could be selected for effective use in a medical context. However, barriers to treatment development should also be addressed. The role of Osgin as a tumor suppressor or tumor promoter appears to potentially be organism- and pathology-specific, suggesting corroboration of findings in animal models to human cell lines is necessary to ensure cross-species effectiveness for new therapeutic approaches. Finally, Osgin genes have also been investigated as prognostic markers for cancer [36,60,67,93]. Additional prognostic data can allow clinicians to create more nuanced treatment plans for their patients; however, further research is necessary to determine how Osgin expression may change throughout the different stages of cancer development.
In conclusion, the current research on the Osgin gene family provides promising future directions yet has many areas in need of further characterization. Most notably, the literature on Osgin2 is far less extensive than Osgin1 as Osgin2 has primarily been identified as a putative inducer of cell proliferation in disease [68]. As expression data reveal differing spatiotemporal expression patterns between Osgin1 and Osgin2, it is likely that the genes are functionally different and require independent investigation. Further research to distinguish the structure, function, and conservation of Osgin2 from Osgin1 are necessary to lapse the disproportionate amount of research between the genes. However, more research is clearly needed on the Osgin gene family as a whole. While research heavily focuses on disease states, there needs to be a more comprehensive analysis of expression, structure–function relationships, phylogeny, regulatory mechanisms, and functional perturbation experiments to understand the role of this ancient and physiologically important gene family during development as well as in homeostasis of the mature organism.
9. Limitations
While this review aims to provide a comprehensive summary of the current Osgin literature, several limitations must be acknowledged. Firstly, the review is inherently limited by the availability of Osgin data and the literature. Secondly, our methodology and exclusion criteria dictate that we did not include studies not available in English, which may omit valuable information and introduce the potential for selection bias. Finally, our review of Osgin expression data is limited to secondary data on major databases, restricting the scope of the review. These limitations should be considered when interpreting the results of this review.
Supplementary Materials
The following supporting information can be downloaded at: https://www.mdpi.com/article/10.3390/biom15030409/s1, Table S1: Putative interacting partners of OSGIN-1 in Homo sapiens, Rattus norvegicus, and Mus musculus, identified by the STRING protein–protein interaction database [43,105]; Table S2: Putative interacting partners of OSGIN-2 in Homo sapiens, Rattus norvegicus, and Mus musculus, identified by the STRING protein–protein interaction database [43,105]; Table S3: Resulting phenotypes from Osgin1 gene expression perturbations [19,20,23,28,29,39,45,52,53,54,58,60,61,62,63,64,65,77,78,91]; Table S4: Resulting phenotypes from Osgin2 gene expression perturbations [23,29,67,68,69,70]; Table S5: RNA-seq data for Osgin1 from gametogenesis through adulthood [79,81,82,83,84,96,106,107,108,109,110,111]; Table S6: RNA-seq data for Osgin2 from gametogenesis through adulthood [79,81,82,83,84,96,106,107,108,109,110,111]; Table S7: Raw expression data of Osgin during development [84,86,97,106,107,108,109,111,112,113,114,115,116,117,118,119,120,121,122,123,124,125,126,127,128,129,130,131,132,133,134,135,136,137,138,139,140,141,142,143,144,145,146,147,148,149,150,151,152,153,154,155,156,157]; Table S8: Raw Osgin expression data of vertebrates across several species [41,84,97,110,111,113,114,117,123,156,158,159,160,161,162,163,164,165]; Table S9: Differential Osgin expression comparing pathological to nonpathological cells and tissues (unless otherwise specified) in cancers and precancerous conditions [97,98,99,100,101,166,167,168,169,170,171,172,173]; Table S10: Differential Osgin expression comparing pathological to nonpathological cells and tissues (unless otherwise specified) in diseases other than cancers [97,102,103,104,174,175,176,177,178,179,180,181,182,183,184,185,186].
Author Contributions
Conceptualization, M.S.S.; methodology, M.S.S. and M.R.; analysis of published work: G.H., M.R., N.V., M.C. and M.S.S.; writing—original draft preparation, G.H., M.R., N.V., M.C. and M.S.S.; writing—review and editing, G.H., M.R., N.V., M.C. and M.S.S.; supervision, G.H., M.R. and M.S.S.; project administration, M.S.S.; funding acquisition, M.S.S. All authors have read and agreed to the published version of the manuscript.
Funding
This research was funded by National Institute of Health grant 1R15HD114135-01.
Institutional Review Board Statement
Not applicable.
Informed Consent Statement
Not applicable.
Data Availability Statement
Not applicable.
Conflicts of Interest
The authors declare no conflicts of interest. The funders had no role in the design of the study; in the collection, analyses, or interpretation of data; in the writing of the manuscript; or in the decision to publish the results.
Abbreviations
The following abbreviations are used in this manuscript:
| AMPK | Adenosine monophosphate-activated protein kinase |
| ARE | Antioxidant response element |
| ATM | Ataxia-telangiectasia mutated |
| BAC | Bacterial artificial chromosome |
| BDGI | Bone marrow stromal cell-derived growth inhibitor |
| BYA | Billion years ago |
| C8orf1 | Chromosome 8 open reading frame 1 |
| CDD | Conserved Domain Database |
| CG | Chorionic gonadotropin |
| COPD | Chronic obstructive pulmonary disease |
| DHA | Docosahexaenoic acid |
| DTNB | 5,5′-dithiobis(2-nitrobenzoate) |
| ER | Endoplasmic reticulum |
| ETC | Electron transport chain |
| FAD | Flavin adenine dinucleotide |
| FMO | Flavin-containing monooxygenase |
| GCLM | Glutamate-cysteine ligase modifier subunit |
| GSH | Glutathione |
| HBEC | Human bronchial epithelial cell |
| hT41 | Human testis 4.1-kb transcript |
| ICC | Immunocytochemistry |
| IHC | Immunohistochemistry |
| IK2 | Ikaros factor 2 |
| ISH | In situ hybridization |
| MDA | Malondialdehyde |
| MEGA | Molecular Evolutionary Genetics Analysis |
| MGI | Mouse Genome Informatics |
| ML | Maximum likelihood |
| MSL | Mesenchymal stem-like |
| NAD(P)H | Nicotinamide adenine dinucleotide phosphate hydrogen |
| NBS | Nijmegen breakage syndrome |
| NCBI | National Center for Biotechnology Information |
| NGF | Nerve growth factor |
| NMR | Nuclear magnetic resonance |
| NSCLC | Non-small cell lung cancer |
| OKL38 | Ovary, kidney, and liver protein 38 |
| ORF | Open reading frame |
| Osgin | Oxidative stress-induced growth inhibitor |
| Osgin1 | Oxidative stress-induced growth inhibitor 1 |
| Osgin2 | Oxidative stress-induced growth inhibitor 2 |
| OXEG | Oxidative stress-related gene |
| OxPAPC | Oxidized 1-palmitoyl-2-arachidonoyl-sn-glycero3-phosphorylcholine |
| P1 | Promoter 1 |
| P2 | Promoter 2 |
| PCOS | Polycystic ovary syndrome |
| PCR | Polymerase chain reaction |
| PDAC | Pancreatic ductal adenocarcinoma cells |
| PLOOH | Phospholipid peroxidases |
| PM2.5 | Fine (diameter of 2.5 μm or less) particulate matter |
| qRT-PCR | Quantitative reverse transcription polymerase chain reaction |
| RACE | Rapid amplification of cDNA ends |
| RGD | Rat Genome Database |
| RNA-seq | RNA sequencing |
| ROS | Reactive oxygen species |
| RPKM | Reads per kilobase million |
| SAR | Stramenopiles, Alveolates, and Rhizaria |
| SLC2A3 | Solute carrier family 2 member 3 |
| TCGA-STAD | The Cancer Genome Atlas Stomach Adenocarcinoma |
| TNB | Nitro-5-thiobenzoate |
| TNBC | Triple-negative breast cancer |
| TPE | Transcripts per embryo |
| TPM | Transcripts per million |
| UTR | Untranslated region |
References
- Preiser, J.C. Oxidative stress. JPEN J. Parenter. Enteral Nutr. 2012, 36, 147–154. [Google Scholar] [CrossRef]
- Hamanaka, R.B.; Chandel, N.S. Mitochondrial reactive oxygen species regulate cellular signaling and dictate biological outcomes. Trends Biochem. Sci. 2010, 35, 505–513. [Google Scholar] [CrossRef] [PubMed]
- Ma, Q. Role of nrf2 in oxidative stress and toxicity. Annu. Rev. Pharmacol. Toxicol. 2013, 53, 401–426. [Google Scholar] [CrossRef] [PubMed]
- Krumova, K.; Cosa, G. Overview of Reactive Oxygen Species. In Singlet Oxygen: Applications in Biosciences and Nanosciences; Nonell, S., Flors, C., Nonell, S., Flors, C., Eds.; The Royal Society of Chemistry: London, UK, 2016; pp. 1–21. [Google Scholar]
- Ahmed, O.M.; Mohammed, M.T. Oxidative Stress: The Role of Reactive Oxygen Species (ROS) and Antioxidants in Human Diseases. Plant Arch. 2020, 20, 4089–4096. [Google Scholar]
- Jomova, K.; Raptova, R.; Alomar, S.Y.; Alwasel, S.H.; Nepovimova, E.; Kuca, K.; Valko, M. Reactive oxygen species, toxicity, oxidative stress, and antioxidants: Chronic diseases and aging. Arch. Toxicol. 2023, 97, 2499–2574. [Google Scholar] [CrossRef]
- Ray, P.D.; Huang, B.W.; Tsuji, Y. Reactive oxygen species (ROS) homeostasis and redox regulation in cellular signaling. Cell Signal 2012, 24, 981–990. [Google Scholar] [CrossRef]
- Khorsandi, K.; Hosseinzadeh, R.; Esfahani, H.; Zandsalimi, K.; Shahidi, F.K.; Abrahamse, H. Accelerating skin regeneration and wound healing by controlled ROS from photodynamic treatment. Inflamm. Regen. 2022, 42, 40. [Google Scholar] [CrossRef]
- Hong, Y.; Boiti, A.; Vallone, D.; Foulkes, N.S. Reactive Oxygen Species Signaling and Oxidative Stress: Transcriptional Regulation and Evolution. Antioxidants 2024, 13, 312. [Google Scholar] [CrossRef]
- Nakamura, H.; Takada, K. Reactive oxygen species in cancer: Current findings and future directions. Cancer Sci. 2021, 112, 3945–3952. [Google Scholar] [CrossRef]
- Pizzino, G.; Irrera, N.; Cucinotta, M.; Pallio, G.; Mannino, F.; Arcoraci, V.; Squadrito, F.; Altavilla, D.; Bitto, A. Oxidative Stress: Harms and Benefits for Human Health. Oxid. Med. Cell Longev. 2017, 2017, 8416763. [Google Scholar] [CrossRef]
- Thannickal, V.J.; Fanburg, B.L. Reactive oxygen species in cell signaling. Am. J. Physiol. Lung Cell Mol. Physiol. 2000, 279, L1005–L1028. [Google Scholar] [CrossRef]
- Siauciunaite, R.; Foulkes, N.S.; Calabro, V.; Vallone, D. Evolution Shapes the Gene Expression Response to Oxidative Stress. Int. J. Mol. Sci. 2019, 20, 3040. [Google Scholar] [CrossRef]
- Lennicke, C.; Cocheme, H.M. Redox metabolism: ROS as specific molecular regulators of cell signaling and function. Mol. Cell 2021, 81, 3691–3707. [Google Scholar] [CrossRef]
- Ruder, E.H.; Hartman, T.J.; Blumberg, J.; Goldman, M.B. Oxidative stress and antioxidants: Exposure and impact on female fertility. Hum. Reprod. Update 2008, 14, 345–357. [Google Scholar] [CrossRef]
- Guerin, P.; El Mouatassim, S.; Menezo, Y. Oxidative stress and protection against reactive oxygen species in the pre-implantation embryo and its surroundings. Hum. Reprod. Update 2001, 7, 175–189. [Google Scholar] [CrossRef]
- Nimse, S.B.; Pal, D. Free radicals, natural antioxidants, and their reaction mechanisms. RSC Adv. 2015, 5, 27986–28006. [Google Scholar] [CrossRef]
- Hayes, J.D.; Dinkova-Kostova, A.T.; Tew, K.D. Oxidative Stress in Cancer. Cancer Cell 2020, 38, 167–197. [Google Scholar] [CrossRef]
- Huynh, H.; Ng, C.Y.; Ong, C.K.; Lim, K.B.; Chan, T.W. Cloning and characterization of a novel pregnancy-induced growth inhibitor in mammary gland. Endocrinology 2001, 142, 3607–3615. [Google Scholar] [CrossRef]
- Li, R.; Chen, W.; Yanes, R.; Lee, S.; Berliner, J.A. OKL38 is an oxidative stress response gene stimulated by oxidized phospholipids. J. Lipid Res. 2007, 48, 709–715. [Google Scholar] [CrossRef]
- Tauchi, H.; Matsuura, S.; Isomura, M.; Kinjo, T.; Nakamura, A.; Sakamoto, S.; Kondo, N.; Endo, S.; Komatsu, K.; Nakamura, Y. Sequence analysis of an 800-kb genomic DNA region on chromosome 8q21 that contains the Nijmegen breakage syndrome gene, NBS1. Genomics 1999, 55, 242–247. [Google Scholar] [CrossRef]
- Rambaut, A. FigTree v1.4.4, a Graphical Viewer of Phylogenetic Trees; University of Edinburgh, Institute of Evolutionary Biology: Edinburgh, UK, 2018. [Google Scholar]
- Goupil, E.; Lacroix, L.; Briere, J.; Guga, S.; Saba-El-Leil, M.K.; Meloche, S.; Labbe, J.C. OSGN-1 is a conserved flavin-containing monooxygenase required to stabilize the intercellular bridge in late cytokinesis. Proc. Natl. Acad. Sci. USA 2024, 121, e2308570121. [Google Scholar] [CrossRef] [PubMed]
- Larkin, M.A.; Blackshields, G.; Brown, N.P.; Chenna, R.; McGettigan, P.A.; McWilliam, H.; Valentin, F.; Wallace, I.M.; Wilm, A.; Lopez, R.; et al. Clustal W and Clustal X version 2.0. Bioinformatics 2007, 23, 2947–2948. [Google Scholar] [CrossRef] [PubMed]
- Tamura, K.; Stecher, G.; Kumar, S. MEGA11: Molecular Evolutionary Genetics Analysis Version 11. Mol. Biol. Evol. 2021, 38, 3022–3027. [Google Scholar] [CrossRef]
- Kozlov, A.M.; Darriba, D.; Flouri, T.; Stamatakis, A. RAxML-NG: A fast, scalable and user-friendly tool for maximum likelihood phylogenetic inference. Bioinformatics 2019, 35, 4453–4455. [Google Scholar] [CrossRef]
- Miller, M.A.; Pfeiffer, W.; Schwartz, T. Creating the CIPRES Science Gateway for Inference of Large Phylogenetic Trees. In Proceedings of the 2010 Gateway Computing Environments Workshop (GCE), New Orleans, LA, USA, 14 November 2010. [Google Scholar] [CrossRef]
- Ong, C.K.; Ng, C.Y.; Leong, C.; Ng, C.P.; Ong, C.S.; Nguyen, T.T.; Huynh, H. Structural characterization of three novel rat OKL38 transcripts, their tissue distributions, and their regulation by human chorionic gonadotropin. Endocrinology 2004, 145, 4763–4774. [Google Scholar] [CrossRef]
- Satta, S.; Beal, R.; Smith, R.; Luo, X.; Ferris, G.R.; Langford-Smith, A.; Teasdale, J.; Ajime, T.T.; Serre, J.; Hazell, G.; et al. A Nrf2-OSGIN1&2-HSP70 axis mediates cigarette smoke-induced endothelial detachment: Implications for plaque erosion. Cardiovasc. Res. 2023, 119, 1869–1882. [Google Scholar] [CrossRef]
- Hu, J.; Wang, Y. OSGIN1 (oxidative stress induced growth inhibitor 1). Atlas Genet. Cytogenet. Oncol. Haematol. 2014, 19, 117–120. [Google Scholar] [CrossRef]
- Tegenfeldt, F.; Kuznetsov, D.; Manni, M.; Berkeley, M.; Zdobnov, E.M.; Kriventseva, E.V. OrthoDB and BUSCO update: Annotation of orthologs in the widest sampling of organismal diversity. Nucleic Acids Res. 2025, 51, D516–D522. [Google Scholar] [CrossRef]
- Altenhoff, A.M.; Warwick Vesztrocy, A.; Bernard, C.; Train, C.M.; Nicheperovich, A.; Prieto Banos, S.; Julca, I.; Moi, D.; Nevers, Y.; Majidian, S.; et al. OMA orthology in 2024: Improved prokaryote coverage, ancestral and extant GO enrichment, a revamped synteny viewer and more in the OMA Ecosystem. Nucleic Acids Res. 2024, 52, D513–D521. [Google Scholar] [CrossRef]
- Altschul, S.F.; Gish, W.; Miller, W.; Myers, E.W.; Lipman, D.J. Basic local alignment search tool. J. Mol. Biol. 1990, 215, 403–410. [Google Scholar] [CrossRef]
- Parkinson, J.; Blaxter, M. SimiTri--visualizing similarity relationships for groups of sequences. Bioinformatics 2003, 19, 390–395. [Google Scholar] [CrossRef]
- Coghlan, A. Nematode genome evolution. In WormBook: The Online Review of C. elegans Biology; WormBook: Pasadena, CA, USA, 2005. [Google Scholar]
- Wang, J.; Chitsaz, F.; Derbyshire, M.K.; Gonzales, N.R.; Gwadz, M.; Lu, S.; Marchler, G.H.; Song, J.S.; Thanki, N.; Yamashita, R.A.; et al. The conserved domain database in 2023. Nucleic Acids Res. 2023, 51, D384–D388. [Google Scholar] [CrossRef]
- Pandurangan, A.P.; Stahlhacke, J.; Oates, M.E.; Smithers, B.; Gough, J. The SUPERFAMILY 2.0 database: A significant proteome update and a new webserver. Nucleic Acids Res. 2019, 47, D490–D494. [Google Scholar] [CrossRef]
- Hunter, S.; Apweiler, R.; Attwood, T.K.; Bairoch, A.; Bateman, A.; Binns, D.; Bork, P.; Das, U.; Daugherty, L.; Duquenne, L.; et al. InterPro: The integrative protein signature database. Nucleic Acids Res. 2009, 37, D211–D215. [Google Scholar] [CrossRef]
- Ong, C.K.; Ng, C.Y.; Leong, C.; Ng, C.P.; Foo, K.T.; Tan, P.H.; Huynh, H. Genomic structure of human OKL38 gene and its differential expression in kidney carcinogenesis. J. Biol. Chem. 2004, 279, 743–754. [Google Scholar] [CrossRef]
- Stelzer, G.; Rosen, N.; Plaschkes, I.; Zimmerman, S.; Twik, M.; Fishilevich, S.; Stein, T.I.; Nudel, R.; Lieder, I.; Mazor, Y.; et al. The GeneCards Suite: From Gene Data Mining to Disease Genome Sequence Analyses. Curr. Protoc. Bioinform. 2016, 54, 1.30.1–1.30.33. [Google Scholar] [CrossRef]
- NCBI Resource Coordinators. Database resources of the National Center for Biotechnology Information. Nucleic Acids Res. 2018, 46, D8–D13. [Google Scholar] [CrossRef]
- Ong, C.K.; Huynh, H. Interaction of Nuclear Factor 1 with promoter P1 of OSGIN1 represses transcription of OSGIN-1a variant. Cancer Res. 2008, 68, 165. [Google Scholar]
- The UniProt Consortium. UniProt: The Universal Protein Knowledgebase in 2023. Nucleic Acids Res. 2023, 51, D523–D531. [Google Scholar] [CrossRef]
- Martin, F.J.; Amode, M.R.; Aneja, A.; Austine-Orimoloye, O.; Azov, A.G.; Barnes, I.; Becker, A.; Bennett, R.; Berry, A.; Bhai, J.; et al. Ensembl 2023. Nucleic Acids Res. 2023, 51, D933–D941. [Google Scholar] [CrossRef]
- Hu, J.; Yao, H.; Gan, F.; Tokarski, A.; Wang, Y. Interaction of OKL38 and p53 in regulating mitochondrial structure and function. PLoS ONE 2012, 7, e43362. [Google Scholar] [CrossRef] [PubMed]
- Suzukawa, K.; Miura, K.; Mitsushita, J.; Resau, J.; Hirose, K.; Crystal, R.; Kamata, T. Nerve growth factor-induced neuronal differentiation requires generation of Rac1-regulated reactive oxygen species. J. Biol. Chem. 2000, 275, 13175–13178. [Google Scholar] [CrossRef] [PubMed]
- Hammerstad, M.; Gudim, I.; Hersleth, H.P. The Crystal Structures of Bacillithiol Disulfide Reductase Bdr (YpdA) Provide Structural and Functional Insight into a New Type of FAD-Containing NADPH-Dependent Oxidoreductase. Biochemistry 2020, 59, 4793–4798. [Google Scholar] [CrossRef] [PubMed]
- Goupil, E.; Amini, R.; Hall, D.H.; Labbe, J.C. Actomyosin contractility regulators stabilize the cytoplasmic bridge between the two primordial germ cells during Caenorhabditis elegans embryogenesis. Mol. Biol. Cell 2017, 28, 3789–3800. [Google Scholar] [CrossRef]
- Eswaramoorthy, S.; Bonanno, J.B.; Burley, S.K.; Swaminathan, S. Mechanism of action of a flavin-containing monooxygenase. Proc. Natl. Acad. Sci. USA 2006, 103, 9832–9837. [Google Scholar] [CrossRef]
- Huijbers, M.M.; Montersino, S.; Westphal, A.H.; Tischler, D.; van Berkel, W.J. Flavin dependent monooxygenases. Arch. Biochem. Biophys. 2014, 544, 2–17. [Google Scholar] [CrossRef]
- Reis, R.A.G.; Li, H.; Johnson, M.; Sobrado, P. New frontiers in flavin-dependent monooxygenases. Arch. Biochem. Biophys. 2021, 699, 108765. [Google Scholar] [CrossRef]
- Liu, M.; Li, Y.; Chen, L.; Chan, T.H.; Song, Y.; Fu, L.; Zeng, T.T.; Dai, Y.D.; Zhu, Y.H.; Li, Y.; et al. Allele-specific imbalance of oxidative stress-induced growth inhibitor 1 associates with progression of hepatocellular carcinoma. Gastroenterology 2014, 146, 1084–1096. [Google Scholar] [CrossRef]
- Yao, H.; Li, P.; Venters, B.J.; Zheng, S.; Thompson, P.R.; Pugh, B.F.; Wang, Y. Histone Arg modifications and p53 regulate the expression of OKL38, a mediator of apoptosis. J. Biol. Chem. 2008, 283, 20060–20068. [Google Scholar] [CrossRef]
- Zhang, J.; Wang, L.; Xu, J.; Tang, Y.; Huang, B.; Chen, Z.; Zhang, T.; Shen, H.M.; Wu, Y.; Xia, D. Bone marrow stromal cell-derived growth inhibitor serves as a stress sensor to induce autophagy. FEBS Lett. 2020, 594, 1248–1260. [Google Scholar] [CrossRef]
- Xie, X.; Laster, K.V.; Li, J.; Nie, W.; Yi, Y.W.; Liu, K.; Seong, Y.S.; Dong, Z.; Kim, D.J. OSGIN1 is a novel TUBB3 regulator that promotes tumor progression and gefitinib resistance in non-small cell lung cancer. Cell Mol. Life Sci. 2023, 80, 272. [Google Scholar] [CrossRef] [PubMed]
- Jia, Y.; Zhang, X.; Cai, Y.; Yu, H.; Cao, G.; Dai, E.; Kang, R.; Tang, D.; Hu, N.; Han, L. OSGIN1 promotes ferroptosis resistance by directly enhancing GCLM activity. Biochem. Biophys. Res. Commun. 2024, 740, 151015. [Google Scholar] [CrossRef]
- Deng, M.; Tang, F.; Chang, X.; Zhang, Y.; Liu, P.; Ji, X.; Zhang, Y.; Yang, R.; Jiang, J.; He, J.; et al. A targetable OSGIN1-AMPK-SLC2A3 axis controls the vulnerability of ovarian cancer to ferroptosis. NPJ Precis. Oncol. 2025, 9, 15. [Google Scholar] [CrossRef] [PubMed]
- Brennan, M.S.; Matos, M.F.; Richter, K.E.; Li, B.; Scannevin, R.H. The NRF2 transcriptional target, OSGIN1, contributes to monomethyl fumarate-mediated cytoprotection in human astrocytes. Sci. Rep. 2017, 7, 42054. [Google Scholar] [CrossRef]
- Hammad, S.M.; Twal, W.O.; Barth, J.L.; Smith, K.J.; Saad, A.F.; Virella, G.; Argraves, W.S.; Lopes-Virella, M.F. Oxidized LDL immune complexes and oxidized LDL differentially affect the expression of genes involved with inflammation and survival in human U937 monocytic cells. Atherosclerosis 2009, 202, 394–404. [Google Scholar] [CrossRef]
- Ong, C.K.; Leong, C.; Tan, P.H.; Van, T.; Huynh, H. The role of 5′ untranslated region in translational suppression of OKL38 mRNA in hepatocellular carcinoma. Oncogene 2007, 26, 1155–1165. [Google Scholar] [CrossRef]
- Yuan, Q.; Zhu, H.; Liu, H.; Wang, M.; Chu, H.; Zhang, Z. METTL3 regulates PM2.5-induced cell injury by targeting OSGIN1 in human airway epithelial cells. J. Hazard. Mater. 2021, 415, 125573. [Google Scholar] [CrossRef]
- Yamashita, N.; Uchiyama, M.; Yamagata, R.; Hwang, G.W. Methylmercury Induces Apoptosis in Mouse C17.2 Neural Stem Cells through the Induction of OSGIN1 Expression by NRF2. Int. J. Mol. Sci. 2024, 25, 3886. [Google Scholar] [CrossRef]
- Wang, G.; Zhou, H.; Strulovici-Barel, Y.; Al-Hijji, M.; Ou, X.; Salit, J.; Walters, M.S.; Staudt, M.R.; Kaner, R.J.; Crystal, R.G. Role of OSGIN1 in mediating smoking-induced autophagy in the human airway epithelium. Autophagy 2017, 13, 1205–1220. [Google Scholar] [CrossRef]
- Khoi, C.S.; Xiao, C.Q.; Hung, K.Y.; Lin, T.Y.; Chiang, C.K. Oxidative Stress-Induced Growth Inhibitor (OSGIN1), a Target of X-Box-Binding Protein 1, Protects Palmitic Acid-Induced Vascular Lipotoxicity through Maintaining Autophagy. Biomedicines 2022, 10, 992. [Google Scholar] [CrossRef]
- Zheng, Y.; Sun, W.; Wang, Z.; Liu, J.; Shan, C.; He, C.; Li, B.; Hu, X.; Zhu, W.; Liu, L.; et al. Activation of Pancreatic Acinar FXR Protects against Pancreatitis via Osgin1-Mediated Restoration of Efficient Autophagy. Research 2022, 2022, 9784081. [Google Scholar] [CrossRef] [PubMed]
- Defamie, V.; Cursio, R.; Le Brigand, K.; Moreilhon, C.; Saint-Paul, M.C.; Laurens, M.; Crenesse, D.; Cardinaud, B.; Auberger, P.; Gugenheim, J.; et al. Gene expression profiling of human liver transplants identifies an early transcriptional signature associated with initial poor graft function. Am. J. Transplant. 2008, 8, 1221–1236. [Google Scholar] [CrossRef]
- Kessler, J.; Rot, S.; Bache, M.; Kappler, M.; Wurl, P.; Vordermark, D.; Taubert, H.; Greither, T. miR-199a-5p regulates HIF-1alpha and OSGIN2 and its expression is correlated to soft-tissue sarcoma patients’ outcome. Oncol. Lett. 2016, 12, 5281–5288. [Google Scholar] [CrossRef]
- Wang, P.; Zhu, Y.; Jia, X.; Ying, X.; Sun, L.; Ruan, S. Clinical prognostic value of OSGIN2 in gastric cancer and its proliferative effect in vitro. Sci. Rep. 2023, 13, 5775. [Google Scholar] [CrossRef]
- Shuai, Y.; Liu, B.; Rong, L.; Shao, B.; Chen, B.; Jin, L. OSGIN2 regulates osteogenesis of jawbone BMSCs in osteoporotic rats. BMC Mol. Cell Biol. 2022, 23, 22. [Google Scholar] [CrossRef]
- Raharijaona, M.; Le Pennec, S.; Poirier, J.; Mirebeau-Prunier, D.; Rouxel, C.; Jacques, C.; Fontaine, J.F.; Malthiery, Y.; Houlgatte, R.; Savagner, F. PGC-1-related coactivator modulates mitochondrial-nuclear crosstalk through endogenous nitric oxide in a cellular model of oncocytic thyroid tumours. PLoS ONE 2009, 4, e7964. [Google Scholar] [CrossRef]
- Romanoski, C.E.; Che, N.; Yin, F.; Mai, N.; Pouldar, D.; Civelek, M.; Pan, C.; Lee, S.; Vakili, L.; Yang, W.P.; et al. Network for activation of human endothelial cells by oxidized phospholipids: A critical role of heme oxygenase 1. Circ. Res. 2011, 109, e27–e41. [Google Scholar] [CrossRef]
- Boscaro, C.; Schimdt, G.; Cignarella, A.; Dal Maso, L.; Bolego, C.; Trevisi, L. The antiangiogenic effect of digitoxin is dependent on a ROS-elicited RhoA/ROCK pathway activation. Biochem. Pharmacol. 2024, 222, 116049. [Google Scholar] [CrossRef]
- Hobbs, G.A.; Zhou, B.; Cox, A.D.; Campbell, S.L. Rho GTPases, oxidation, and cell redox control. Small GTPases 2014, 5, e28579. [Google Scholar] [CrossRef]
- Hurst, M.; McGarry, D.J.; Olson, M.F. Rho GTPases: Non-canonical regulation by cysteine oxidation. Bioessays 2022, 44, e2100152. [Google Scholar] [CrossRef]
- Liang, D.; Minikes, A.M.; Jiang, X. Ferroptosis at the intersection of lipid metabolism and cellular signaling. Mol. Cell 2022, 82, 2215–2227. [Google Scholar] [CrossRef] [PubMed]
- Baird, L.; Yamamoto, M. The Molecular Mechanisms Regulating the KEAP1-NRF2 Pathway. Mol. Cell. Biol. 2020, 40, e00099-20. [Google Scholar] [CrossRef]
- Yan, X.; Lee, S.; Gugiu, B.G.; Koroniak, L.; Jung, M.E.; Berliner, J.; Cheng, J.; Li, R. Fatty acid epoxyisoprostane E2 stimulates an oxidative stress response in endothelial cells. Biochem. Biophys. Res. Commun. 2014, 444, 69–74. [Google Scholar] [CrossRef]
- Tsai, C.H.; Shen, Y.C.; Chen, H.W.; Liu, K.L.; Chang, J.W.; Chen, P.Y.; Lin, C.Y.; Yao, H.T.; Li, C.C. Docosahexaenoic acid increases the expression of oxidative stress-induced growth inhibitor 1 through the PI3K/Akt/Nrf2 signaling pathway in breast cancer cells. Food Chem. Toxicol. 2017, 108, 276–288. [Google Scholar] [CrossRef]
- Sternberg, P.W.; Van Auken, K.; Wang, Q.; Wright, A.; Yook, K.; Zarowiecki, M.; Arnaboldi, V.; Becerra, A.; Brown, S.; Cain, S.; et al. WormBase 2024: Status and transitioning to Alliance infrastructure. Genetics 2024, 227, iyae050. [Google Scholar] [CrossRef]
- Wolkow, C.A.; Hall, D.H. Introduction to the Dauer Larva, Overview. WormAtlas 2015. [Google Scholar] [CrossRef]
- Kudtarkar, P.; Cameron, R.A. Echinobase: An expanding resource for echinoderm genomic information. Database 2017, 2017, bax074. [Google Scholar] [CrossRef]
- Giraldo-Calderon, G.I.; Emrich, S.J.; MacCallum, R.M.; Maslen, G.; Dialynas, E.; Topalis, P.; Ho, N.; Gesing, S.; the VectorBase Consortium; Madey, G.; et al. VectorBase: An updated bioinformatics resource for invertebrate vectors and other organisms related with human diseases. Nucleic Acids Res. 2015, 43, D707–D713. [Google Scholar] [CrossRef]
- Bastian, F.B.; Cammarata, A.B.; Carsanaro, S.; Detering, H.; Huang, W.T.; Joye, S.; Niknejad, A.; Nyamari, M.; Mendes de Farias, T.; Moretti, S.; et al. Bgee in 2024: Focus on curated single-cell RNA-seq datasets, and query tools. Nucleic Acids Res. 2025, 53, D878–D885. [Google Scholar] [CrossRef]
- Karimi, K.; Fortriede, J.D.; Lotay, V.S.; Burns, K.A.; Wang, D.Z.; Fisher, M.E.; Pells, T.J.; James-Zorn, C.; Wang, Y.; Ponferrada, V.G.; et al. Xenbase: A genomic, epigenomic and transcriptomic model organism database. Nucleic Acids Res. 2018, 46, D861–D868. [Google Scholar] [CrossRef]
- Thisse, C.; Thisse, B. High Throughput Expression Analysis of ZF-Models Consortium Clones. Available online: http://zfin.org. (accessed on 4 March 2025).
- Diez-Roux, G.; Banfi, S.; Sultan, M.; Geffers, L.; Anand, S.; Rozado, D.; Magen, A.; Canidio, E.; Pagani, M.; Peluso, I.; et al. A high-resolution anatomical atlas of the transcriptome in the mouse embryo. PLoS Biol. 2011, 9, e1000582. [Google Scholar] [CrossRef] [PubMed]
- Bottoni, L.; Minetti, A.; Realini, G.; Pio, E.; Giustarini, D.; Rossi, R.; Rocchio, C.; Franci, L.; Salvini, L.; Catona, O.; et al. NRF2 activation by cysteine as a survival mechanism for triple-negative breast cancer cells. Oncogene 2024, 43, 1701–1713. [Google Scholar] [CrossRef] [PubMed]
- Arslan, A.A.; Tuminello, S.; Yang, L.; Zhang, Y.; Durmus, N.; Snuderl, M.; Heguy, A.; Zeleniuch-Jacquotte, A.; Shao, Y.; Reibman, J. Genome-Wide DNA Methylation Profiles in Community Members Exposed to the World Trade Center Disaster. Int. J. Environ. Res. Public Health 2020, 17, 5493. [Google Scholar] [CrossRef]
- Trichopoulos, D.; Hsieh, C.C.; MacMahon, B.; Lin, T.M.; Lowe, C.R.; Mirra, A.P.; Ravnihar, B.; Salber, E.J.; Valaoras, V.G.; Yuasa, S. Age at any birth and breast cancer risk. Int. J. Cancer 1983, 31, 701–704. [Google Scholar] [CrossRef] [PubMed]
- Russo, I.H.; Koszalka, M.; Russo, J. Human chorionic gonadotropin and rat mammary cancer prevention. J. Natl. Cancer Inst. 1990, 82, 1286–1289. [Google Scholar] [CrossRef]
- Tsai, C.H.; Lii, C.K.; Wang, T.S.; Liu, K.L.; Chen, H.W.; Huang, C.S.; Li, C.C. Docosahexaenoic acid promotes the formation of autophagosomes in MCF-7 breast cancer cells through oxidative stress-induced growth inhibitor 1 mediated activation of AMPK/mTOR pathway. Food Chem. Toxicol. 2021, 154, 112318. [Google Scholar] [CrossRef]
- Hojo, H.; Enya, S.; Arai, M.; Suzuki, Y.; Nojiri, T.; Kangawa, K.; Koyama, S.; Kawaoka, S. Remote reprogramming of hepatic circadian transcriptome by breast cancer. Oncotarget 2017, 8, 34128–34140. [Google Scholar] [CrossRef]
- Chen, Z.; Mei, K.; Xiao, Y.; Xiong, Y.; Long, W.; Wang, Q.; Zhong, J.; Di, D.; Ge, Y.; Luo, Y.; et al. Prognostic Assessment of Oxidative Stress-Related Genes in Colorectal Cancer and New Insights into Tumor Immunity. Oxid. Med. Cell Longev. 2022, 2022, 2518340. [Google Scholar] [CrossRef]
- Yetkin Yildirim, G.; Tola, E.N.; Dag, I. A novel biochemical marker -OKL38- with its apoptotic and antioxidant properties for the development of PCOS and its related clinical implications. Gynecol. Endocrinol. 2020, 36, 673–677. [Google Scholar] [CrossRef]
- Tang, X.; Zhu, H.; Zhou, M.; Zhang, H.; Xiao, Q.; Yuan, Q.; Sun, G.; Zhang, Z.; Chu, H. OSGIN1 regulates PM2.5-induced fibrosis via mediating autophagy in an in vitro model of COPD. Toxicol. Lett. 2024, 401, 35–43. [Google Scholar] [CrossRef]
- Eswaran, J.; Cyanam, D.; Mudvari, P.; Reddy, S.D.; Pakala, S.B.; Nair, S.S.; Florea, L.; Fuqua, S.A.; Godbole, S.; Kumar, R. Transcriptomic landscape of breast cancers through mRNA sequencing. Sci. Rep. 2012, 2, 264. [Google Scholar] [CrossRef] [PubMed]
- Papatheodorou, I.; Moreno, P.; Manning, J.; Fuentes, A.M.; George, N.; Fexova, S.; Fonseca, N.A.; Fullgrabe, A.; Green, M.; Huang, N.; et al. Expression Atlas update: From tissues to single cells. Nucleic Acids Res. 2020, 48, D77–D83. [Google Scholar] [CrossRef]
- The ICGC/TCGA Pan-Cancer Analysis of Whole Genomes Consortium. Pan-cancer analysis of whole genomes. Nature 2020, 578, 82–93. [Google Scholar] [CrossRef] [PubMed]
- Choi, H.; Sheng, J.; Gao, D.; Li, F.; Durrans, A.; Ryu, S.; Lee, S.B.; Narula, N.; Rafii, S.; Elemento, O.; et al. Transcriptome analysis of individual stromal cell populations identifies stroma-tumor crosstalk in mouse lung cancer model. Cell Rep. 2015, 10, 1187–1201. [Google Scholar] [CrossRef]
- Straessler, K.M.; Jones, K.B.; Hu, H.; Jin, H.; van de Rijn, M.; Capecchi, M.R. Modeling clear cell sarcomagenesis in the mouse: Cell of origin differentiation state impacts tumor characteristics. Cancer Cell 2013, 23, 215–227. [Google Scholar] [CrossRef]
- Jones, K.B.; Salah, Z.; Del Mare, S.; Galasso, M.; Gaudio, E.; Nuovo, G.J.; Lovat, F.; LeBlanc, K.; Palatini, J.; Randall, R.L.; et al. miRNA signatures associate with pathogenesis and progression of osteosarcoma. Cancer Res. 2012, 72, 1865–1877. [Google Scholar] [CrossRef]
- Linsley, P.S.; Speake, C.; Whalen, E.; Chaussabel, D. Copy number loss of the interferon gene cluster in melanomas is linked to reduced T cell infiltrate and poor patient prognosis. PLoS ONE 2014, 9, e109760. [Google Scholar] [CrossRef]
- Wu, M.; Chen, Y.; Xia, H.; Wang, C.; Tan, C.Y.; Cai, X.; Liu, Y.; Ji, F.; Xiong, P.; Liu, R.; et al. Transcriptional and proteomic insights into the host response in fatal COVID-19 cases. Proc. Natl. Acad. Sci. USA 2020, 117, 28336–28343. [Google Scholar] [CrossRef]
- Cho, J.S.; Guo, Y.; Ramos, R.I.; Hebroni, F.; Plaisier, S.B.; Xuan, C.; Granick, J.L.; Matsushima, H.; Takashima, A.; Iwakura, Y.; et al. Neutrophil-derived IL-1beta is sufficient for abscess formation in immunity against Staphylococcus aureus in mice. PLoS Pathog. 2012, 8, e1003047. [Google Scholar] [CrossRef]
- Szklarczyk, D.; Kirsch, R.; Koutrouli, M.; Nastou, K.; Mehryary, F.; Hachilif, R.; Gable, A.L.; Fang, T.; Doncheva, N.T.; Pyysalo, S.; et al. The STRING database in 2023: Protein-protein association networks and functional enrichment analyses for any sequenced genome of interest. Nucleic Acids Res. 2023, 51, D638–D646. [Google Scholar] [CrossRef]
- Bult, C.J.; Blake, J.A.; Smith, C.L.; Kadin, J.A.; Richardson, J.E.; Mouse Genome Database, G. Mouse Genome Database (MGD) 2019. Nucleic Acids Res. 2019, 47, D801–D806. [Google Scholar] [CrossRef] [PubMed]
- White, R.J.; Collins, J.E.; Sealy, I.M.; Wali, N.; Dooley, C.M.; Digby, Z.; Stemple, D.L.; Murphy, D.N.; Billis, K.; Hourlier, T.; et al. A high-resolution mRNA expression time course of embryonic development in zebrafish. eLife 2017, 6, e30860. [Google Scholar] [CrossRef] [PubMed]
- Owens, N.D.L.; Blitz, I.L.; Lane, M.A.; Patrushev, I.; Overton, J.D.; Gilchrist, M.J.; Cho, K.W.Y.; Khokha, M.K. Measuring Absolute RNA Copy Numbers at High Temporal Resolution Reveals Transcriptome Kinetics in Development. Cell Rep. 2016, 14, 632–647. [Google Scholar] [CrossRef]
- Lindsay, S.J.; Xu, Y.; Lisgo, S.N.; Harkin, L.F.; Copp, A.J.; Gerrelli, D.; Clowry, G.J.; Talbot, A.; Keogh, M.J.; Coxhead, J.; et al. HDBR Expression: A Unique Resource for Global and Individual Gene Expression Studies during Early Human Brain Development. Front. Neuroanat. 2016, 10, 86. [Google Scholar] [CrossRef] [PubMed]
- GTEx Consortium, Human genomics. The Genotype-Tissue Expression (GTEx) pilot analysis: Multitissue gene regulation in humans. Science 2015, 348, 648–660. [Google Scholar] [CrossRef]
- Pipes, L.; Li, S.; Bozinoski, M.; Palermo, R.; Peng, X.; Blood, P.; Kelly, S.; Weiss, J.M.; Thierry-Mieg, J.; Thierry-Mieg, D.; et al. The non-human primate reference transcriptome resource (NHPRTR) for comparative functional genomics. Nucleic Acids Res. 2013, 41, D906–D914. [Google Scholar] [CrossRef]
- Steen, R.G.; Kwitek-Black, A.E.; Glenn, C.; Gullings-Handley, J.; Van Etten, W.; Atkinson, O.S.; Appel, D.; Twigger, S.; Muir, M.; Mull, T.; et al. A high-density integrated genetic linkage and radiation hybrid map of the laboratory rat. Genome Res. 1999, 9, AP1–AP8. [Google Scholar] [CrossRef]
- Allen Institute for Brain Science. Allen Developing Mouse Brain Atlas. 2025. Available online: https://developingmouse.brain-map.org/ (accessed on 4 March 2025).
- Session, A.M.; Uno, Y.; Kwon, T.; Chapman, J.A.; Toyoda, A.; Takahashi, S.; Fukui, A.; Hikosaka, A.; Suzuki, A.; Kondo, M.; et al. Genome evolution in the allotetraploid frog Xenopus laevis. Nature 2016, 538, 336–343. [Google Scholar] [CrossRef]
- Cardoso-Moreira, M.; Halbert, J.; Valloton, D.; Velten, B.; Chen, C.; Shao, Y.; Liechti, A.; Ascencao, K.; Rummel, C.; Ovchinnikova, S.; et al. Gene expression across mammalian organ development. Nature 2019, 571, 505–509. [Google Scholar] [CrossRef]
- Mirzamohammadi, F.; Kozlova, A.; Papaioannou, G.; Paltrinieri, E.; Ayturk, U.M.; Kobayashi, T. Distinct molecular pathways mediate Mycn and Myc-regulated miR-17-92 microRNA action in Feingold syndrome mouse models. Nat. Commun. 2018, 9, 1352. [Google Scholar] [CrossRef]
- Delpretti, S.; Montavon, T.; Leleu, M.; Joye, E.; Tzika, A.; Milinkovitch, M.; Duboule, D. Multiple enhancers regulate Hoxd genes and the Hotdog LncRNA during cecum budding. Cell Rep. 2013, 5, 137–150. [Google Scholar] [CrossRef] [PubMed]
- Tallack, M.R.; Magor, G.W.; Dartigues, B.; Sun, L.; Huang, S.; Fittock, J.M.; Fry, S.V.; Glazov, E.A.; Bailey, T.L.; Perkins, A.C. Novel roles for KLF1 in erythropoiesis revealed by mRNA-seq. Genome Res. 2012, 22, 2385–2398. [Google Scholar] [CrossRef] [PubMed]
- Dupacova, N.; Antosova, B.; Paces, J.; Kozmik, Z. Meis homeobox genes control progenitor competence in the retina. Proc. Natl. Acad. Sci. USA 2021, 118, e2013136118. [Google Scholar] [CrossRef] [PubMed]
- Kraiczy, J.; Nayak, K.M.; Howell, K.J.; Ross, A.; Forbester, J.; Salvestrini, C.; Mustata, R.; Perkins, S.; Andersson-Rolf, A.; Leenen, E.; et al. DNA methylation defines regional identity of human intestinal epithelial organoids and undergoes dynamic changes during development. Gut 2019, 68, 49–61. [Google Scholar] [CrossRef]
- Yamaji, D.; Kang, K.; Robinson, G.W.; Hennighausen, L. Sequential activation of genetic programs in mouse mammary epithelium during pregnancy depends on STAT5A/B concentration. Nucleic Acids Res. 2013, 41, 1622–1636. [Google Scholar] [CrossRef]
- Kistler, W.S.; Baas, D.; Lemeille, S.; Paschaki, M.; Seguin-Estevez, Q.; Barras, E.; Ma, W.; Duteyrat, J.L.; Morle, L.; Durand, B.; et al. RFX2 Is a Major Transcriptional Regulator of Spermiogenesis. PLoS Genet. 2015, 11, e1005368. [Google Scholar] [CrossRef]
- Merkin, J.; Russell, C.; Chen, P.; Burge, C.B. Evolutionary dynamics of gene and isoform regulation in Mammalian tissues. Science 2012, 338, 1593–1599. [Google Scholar] [CrossRef]
- Chang, A.J.; Ortega, F.E.; Riegler, J.; Madison, D.V.; Krasnow, M.A. Oxygen regulation of breathing through an olfactory receptor activated by lactate. Nature 2015, 527, 240–244. [Google Scholar] [CrossRef]
- Suzuki, T.; Kikuguchi, C.; Nishijima, S.; Nagashima, T.; Takahashi, A.; Okada, M.; Yamamoto, T. Postnatal liver functional maturation requires Cnot complex-mediated decay of mRNAs encoding cell cycle and immature liver genes. Development 2019, 146, dev168146. [Google Scholar] [CrossRef]
- Jain, M.; Kaiser, R.W.J.; Bohl, K.; Hoehne, M.; Gobel, H.; Bartram, M.P.; Habbig, S.; Muller, R.U.; Fogo, A.B.; Benzing, T.; et al. Inactivation of Apoptosis Antagonizing Transcription Factor in tubular epithelial cells induces accumulation of DNA damage and nephronophthisis. Kidney Int. 2019, 95, 846–858. [Google Scholar] [CrossRef]
- Fuhrmann, D.; Mernberger, M.; Nist, A.; Stiewe, T.; Elsasser, H.P. Miz1 Controls Schwann Cell Proliferation via H3K36(me2) Demethylase Kdm8 to Prevent Peripheral Nerve Demyelination. J. Neurosci. 2018, 38, 858–877. [Google Scholar] [CrossRef] [PubMed]
- Bao, J.; Vitting-Seerup, K.; Waage, J.; Tang, C.; Ge, Y.; Porse, B.T.; Yan, W. UPF2-Dependent Nonsense-Mediated mRNA Decay Pathway Is Essential for Spermatogenesis by Selectively Eliminating Longer 3′UTR Transcripts. PLoS Genet. 2016, 12, e1005863. [Google Scholar] [CrossRef] [PubMed]
- Mostafa, D.; Yanagiya, A.; Georgiadou, E.; Wu, Y.; Stylianides, T.; Rutter, G.A.; Suzuki, T.; Yamamoto, T. Loss of beta-cell identity and diabetic phenotype in mice caused by disruption of CNOT3-dependent mRNA deadenylation. Commun. Biol. 2020, 3, 476. [Google Scholar] [CrossRef]
- Mishra, V.; Bose, A.; Kiran, S.; Banerjee, S.; Shah, I.A.; Chaukimath, P.; Reshi, M.M.; Srinivas, S.; Barman, A.; Visweswariah, S.S. Gut-associated cGMP mediates colitis and dysbiosis in a mouse model of an activating mutation in GUCY2C. J. Exp. Med. 2021, 218, e20210479. [Google Scholar] [CrossRef]
- Anuar, N.D.; Kurscheid, S.; Field, M.; Zhang, L.; Rebar, E.; Gregory, P.; Buchou, T.; Bowles, J.; Koopman, P.; Tremethick, D.J.; et al. Gene editing of the multi-copy H2A.B gene and its importance for fertility. Genome Biol. 2019, 20, 23. [Google Scholar] [CrossRef]
- Martin-Alonso, M.; Iqbal, S.; Vornewald, P.M.; Lindholm, H.T.; Damen, M.J.; Martinez, F.; Hoel, S.; Diez-Sanchez, A.; Altelaar, M.; Katajisto, P.; et al. Smooth muscle-specific MMP17 (MT4-MMP) regulates the intestinal stem cell niche and regeneration after damage. Nat. Commun. 2021, 12, 6741. [Google Scholar] [CrossRef]
- Takahashi, A.; Takaoka, S.; Kobori, S.; Yamaguchi, T.; Ferwati, S.; Kuba, K.; Yamamoto, T.; Suzuki, T. The CCR4—NOT Deadenylase Complex Maintains Adipocyte Identity. Int. J. Mol. Sci. 2019, 20, 5274. [Google Scholar] [CrossRef]
- Kim, J.Y.; Park, Y.K.; Lee, K.P.; Lee, S.M.; Kang, T.W.; Kim, H.J.; Dho, S.H.; Kim, S.Y.; Kwon, K.S. Genome-wide profiling of the microRNA-mRNA regulatory network in skeletal muscle with aging. Aging 2014, 6, 524–544. [Google Scholar] [CrossRef]
- Patial, S.; Stumpo, D.J.; Young, W.S., 3rd; Ward, J.M.; Flake, G.P.; Blackshear, P.J. Effects of Combined Tristetraprolin/Tumor Necrosis Factor Receptor Deficiency on the Splenic Transcriptome. Mol. Cell Biol. 2016, 36, 1395–1411. [Google Scholar] [CrossRef]
- Haering, C.; Kanageswaran, N.; Bouvain, P.; Scholz, P.; Altmuller, J.; Becker, C.; Gisselmann, G.; Waring-Bischof, J.; Hatt, H. Ion transporter NKCC1, modulator of neurogenesis in murine olfactory neurons. J. Biol. Chem. 2015, 290, 9767–9779. [Google Scholar] [CrossRef]
- West, D.B.; Engelhard, E.K.; Adkisson, M.; Nava, A.J.; Kirov, J.V.; Cipollone, A.; Willis, B.; Rapp, J.; de Jong, P.J.; Lloyd, K.C. Transcriptome Analysis of Targeted Mouse Mutations Reveals the Topography of Local Changes in Gene Expression. PLoS Genet. 2016, 12, e1005691. [Google Scholar] [CrossRef] [PubMed]
- Muller, C.; Zidek, L.M.; Ackermann, T.; de Jong, T.; Liu, P.; Kliche, V.; Zaini, M.A.; Kortman, G.; Harkema, L.; Verbeek, D.S.; et al. Reduced expression of C/EBPβ-LIP extends health and lifespan in mice. eLife 2018, 7, e34985. [Google Scholar] [CrossRef] [PubMed]
- Guccini, I.; Revandkar, A.; D’Ambrosio, M.; Colucci, M.; Pasquini, E.; Mosole, S.; Troiani, M.; Brina, D.; Sheibani-Tezerji, R.; Elia, A.R.; et al. Senescence Reprogramming by TIMP1 Deficiency Promotes Prostate Cancer Metastasis. Cancer Cell 2021, 39, 68–82.e69. [Google Scholar] [CrossRef]
- Munger, S.C.; Raghupathy, N.; Choi, K.; Simons, A.K.; Gatti, D.M.; Hinerfeld, D.A.; Svenson, K.L.; Keller, M.P.; Attie, A.D.; Hibbs, M.A.; et al. RNA-Seq alignment to individualized genomes improves transcript abundance estimates in multiparent populations. Genetics 2014, 198, 59–73. [Google Scholar] [CrossRef]
- Bond, S.T.; King, E.J.; Henstridge, D.C.; Tran, A.; Moody, S.C.; Yang, C.; Liu, Y.; Mellett, N.A.; Nath, A.P.; Inouye, M.; et al. Deletion of Trim28 in committed adipocytes promotes obesity but preserves glucose tolerance. Nat. Commun. 2021, 12, 74. [Google Scholar] [CrossRef]
- O’Rourke, J.G.; Bogdanik, L.; Muhammad, A.; Gendron, T.F.; Kim, K.J.; Austin, A.; Cady, J.; Liu, E.Y.; Zarrow, J.; Grant, S.; et al. C9orf72 BAC Transgenic Mice Display Typical Pathologic Features of ALS/FTD. Neuron 2015, 88, 892–901. [Google Scholar] [CrossRef]
- Ishimura, R.; Nagy, G.; Dotu, I.; Chuang, J.H.; Ackerman, S.L. Activation of GCN2 kinase by ribosome stalling links translation elongation with translation initiation. eLife 2016, 5, e14295. [Google Scholar] [CrossRef]
- Brooks, M.J.; Rajasimha, H.K.; Roger, J.E.; Swaroop, A. Next-generation sequencing facilitates quantitative analysis of wild-type and Nrl−/− retinal transcriptomes. Mol. Vis. 2011, 17, 3034–3054. [Google Scholar]
- Narayanan, M.; Huynh, J.L.; Wang, K.; Yang, X.; Yoo, S.; McElwee, J.; Zhang, B.; Zhang, C.; Lamb, J.R.; Xie, T.; et al. Common dysregulation network in the human prefrontal cortex underlies two neurodegenerative diseases. Mol. Syst. Biol. 2014, 10, 743. [Google Scholar] [CrossRef]
- Aldunate, E.Z.; Di Foggia, V.; Di Marco, F.; Hervas, L.A.; Ribeiro, J.C.; Holder, D.L.; Patel, A.; Jannini, T.B.; Thompson, D.A.; Martinez-Barbera, J.P.; et al. Conditional Dicer1 depletion using Chrnb4-Cre leads to cone cell death and impaired photopic vision. Sci. Rep. 2019, 9, 2314. [Google Scholar] [CrossRef]
- Isaac, J.; Erthal, J.; Gordon, J.; Duverger, O.; Sun, H.W.; Lichtler, A.C.; Stein, G.S.; Lian, J.B.; Morasso, M.I. DLX3 regulates bone mass by targeting genes supporting osteoblast differentiation and mineral homeostasis in vivo. Cell Death Differ. 2014, 21, 1365–1376. [Google Scholar] [CrossRef] [PubMed]
- Rousset, F.; Nacher-Soler, G.; Coelho, M.; Ilmjarv, S.; Kokje, V.B.C.; Marteyn, A.; Cambet, Y.; Perny, M.; Roccio, M.; Jaquet, V.; et al. Redox activation of excitatory pathways in auditory neurons as mechanism of age-related hearing loss. Redox Biol. 2020, 30, 101434. [Google Scholar] [CrossRef] [PubMed]
- Jena, K.K.; Mehto, S.; Nath, P.; Chauhan, N.R.; Sahu, R.; Dhar, K.; Das, S.K.; Kolapalli, S.P.; Murmu, K.C.; Jain, A.; et al. Autoimmunity gene IRGM suppresses cGAS-STING and RIG-I-MAVS signaling to control interferon response. EMBO Rep. 2020, 21, e50051. [Google Scholar] [CrossRef]
- Huntley, M.A.; Lou, M.; Goldstein, L.D.; Lawrence, M.; Dijkgraaf, G.J.; Kaminker, J.S.; Gentleman, R. Complex regulation of ADAR-mediated RNA-editing across tissues. BMC Genom. 2016, 17, 61. [Google Scholar] [CrossRef]
- Zheng, C.L.; Wilmot, B.; Walter, N.A.; Oberbeck, D.; Kawane, S.; Searles, R.P.; McWeeney, S.K.; Hitzemann, R. Splicing landscape of the eight collaborative cross founder strains. BMC Genom. 2015, 16, 52. [Google Scholar] [CrossRef]
- Kao, C.S.; van Bruggen, R.; Kim, J.R.; Chen, X.X.L.; Chan, C.; Lee, J.; Cho, W.I.; Zhao, M.; Arndt, C.; Maksimovic, K.; et al. Selective neuronal degeneration in MATR3 S85C knock-in mouse model of early-stage ALS. Nat. Commun. 2020, 11, 5304. [Google Scholar] [CrossRef]
- Lipiec, M.A.; Bem, J.; Kozinski, K.; Chakraborty, C.; Urban-Ciecko, J.; Zajkowski, T.; Dabrowski, M.; Szewczyk, L.M.; Toval, A.; Ferran, J.L.; et al. TCF7L2 regulates postmitotic differentiation programmes and excitability patterns in the thalamus. Development 2020, 147, dev190181. [Google Scholar] [CrossRef]
- Klaus, C.; Hansen, J.N.; Ginolhac, A.; Gerard, D.; Gnanapragassam, V.S.; Horstkorte, R.; Rossdam, C.; Buettner, F.F.R.; Sauter, T.; Sinkkonen, L.; et al. Reduced sialylation triggers homeostatic synapse and neuronal loss in middle-aged mice. Neurobiol. Aging 2020, 88, 91–107. [Google Scholar] [CrossRef]
- Alen, F.; Gomez-Redondo, I.; Rivera, P.; Suarez, J.; Ramos-Ibeas, P.; Pericuesta, E.; Fernandez-Gonzalez, R.; Perez-Cerezales, S.; Horiuchi, K.; Orio, L.; et al. Sex-Dimorphic Behavioral Alterations and Altered Neurogenesis in U12 Intron Splicing-Defective Zrsr1 Mutant Mice. Int. J. Mol. Sci. 2019, 20, 3543. [Google Scholar] [CrossRef]
- Yu, Y.; Fuscoe, J.C.; Zhao, C.; Guo, C.; Jia, M.; Qing, T.; Bannon, D.I.; Lancashire, L.; Bao, W.; Du, T.; et al. A rat RNA-Seq transcriptomic BodyMap across 11 organs and 4 developmental stages. Nat. Commun. 2014, 5, 3230. [Google Scholar] [CrossRef]
- Langfelder, P.; Cantle, J.P.; Chatzopoulou, D.; Wang, N.; Gao, F.; Al-Ramahi, I.; Lu, X.H.; Ramos, E.M.; El-Zein, K.; Zhao, Y.; et al. Integrated genomics and proteomics define huntingtin CAG length-dependent networks in mice. Nat. Neurosci. 2016, 19, 623–633. [Google Scholar] [CrossRef] [PubMed]
- Naqvi, S.; Godfrey, A.K.; Hughes, J.F.; Goodheart, M.L.; Mitchell, R.N.; Page, D.C. Conservation, acquisition, and functional impact of sex-biased gene expression in mammals. Science 2019, 365, eaaw7317. [Google Scholar] [CrossRef] [PubMed]
- Schmidt, T.; Samaras, P.; Frejno, M.; Gessulat, S.; Barnert, M.; Kienegger, H.; Krcmar, H.; Schlegl, J.; Ehrlich, H.C.; Aiche, S.; et al. ProteomicsDB. Nucleic Acids Res. 2018, 46, D1271–D1281. [Google Scholar] [CrossRef] [PubMed]
- Darbellay, F.; Necsulea, A. Comparative Transcriptomics Analyses across Species, Organs, and Developmental Stages Reveal Functionally Constrained lncRNAs. Mol. Biol. Evol. 2020, 37, 240–259. [Google Scholar] [CrossRef]
- Fagerberg, L.; Hallstrom, B.M.; Oksvold, P.; Kampf, C.; Djureinovic, D.; Odeberg, J.; Habuka, M.; Tahmasebpoor, S.; Danielsson, A.; Edlund, K.; et al. Analysis of the human tissue-specific expression by genome-wide integration of transcriptomics and antibody-based proteomics. Mol. Cell Proteom. 2014, 13, 397–406. [Google Scholar] [CrossRef]
- Barbosa-Morais, N.L.; Irimia, M.; Pan, Q.; Xiong, H.Y.; Gueroussov, S.; Lee, L.J.; Slobodeniuc, V.; Kutter, C.; Watt, S.; Colak, R.; et al. The evolutionary landscape of alternative splicing in vertebrate species. Science 2012, 338, 1587–1593. [Google Scholar] [CrossRef]
- Brawand, D.; Soumillon, M.; Necsulea, A.; Julien, P.; Csardi, G.; Harrigan, P.; Weier, M.; Liechti, A.; Aximu-Petri, A.; Kircher, M.; et al. The evolution of gene expression levels in mammalian organs. Nature 2011, 478, 343–348. [Google Scholar] [CrossRef]
- Soumillon, M.; Necsulea, A.; Weier, M.; Brawand, D.; Zhang, X.; Gu, H.; Barthes, P.; Kokkinaki, M.; Nef, S.; Gnirke, A.; et al. Cellular source and mechanisms of high transcriptome complexity in the mammalian testis. Cell Rep. 2013, 3, 2179–2190. [Google Scholar] [CrossRef]
- Duff, M.O.; Olson, S.; Wei, X.; Garrett, S.C.; Osman, A.; Bolisetty, M.; Plocik, A.; Celniker, S.E.; Graveley, B.R. Genome-wide identification of zero nucleotide recursive splicing in Drosophila. Nature 2015, 521, 376–379. [Google Scholar] [CrossRef]
- Madhavan, S.; Zenklusen, J.C.; Kotliarov, Y.; Sahni, H.; Fine, H.A.; Buetow, K. Rembrandt: Helping personalized medicine become a reality through integrative translational research. Mol. Cancer Res. 2009, 7, 157–167. [Google Scholar] [CrossRef]
- Birks, D.K.; Donson, A.M.; Patel, P.R.; Sufit, A.; Algar, E.M.; Dunham, C.; Kleinschmidt-DeMasters, B.K.; Handler, M.H.; Vibhakar, R.; Foreman, N.K. Pediatric rhabdoid tumors of kidney and brain show many differences in gene expression but share dysregulation of cell cycle and epigenetic effector genes. Pediatr. Blood Cancer 2013, 60, 1095–1102. [Google Scholar] [CrossRef] [PubMed]
- Kanth, P.; Bronner, M.P.; Boucher, K.M.; Burt, R.W.; Neklason, D.W.; Hagedorn, C.H.; Delker, D.A. Gene Signature in Sessile Serrated Polyps Identifies Colon Cancer Subtype. Cancer Prev. Res. 2016, 9, 456–465. [Google Scholar] [CrossRef] [PubMed]
- Wu, T.; Hong, Y.; Jia, L.; Wu, J.; Xia, J.; Wang, J.; Hu, Q.; Cheng, B. Modulation of IL-1beta reprogrammes the tumor microenvironment to interrupt oral carcinogenesis. Sci. Rep. 2016, 6, 20208. [Google Scholar] [CrossRef]
- Griesinger, A.M.; Josephson, R.J.; Donson, A.M.; Mulcahy Levy, J.M.; Amani, V.; Birks, D.K.; Hoffman, L.M.; Furtek, S.L.; Reigan, P.; Handler, M.H.; et al. Interleukin-6/STAT3 Pathway Signaling Drives an Inflammatory Phenotype in Group A Ependymoma. Cancer Immunol. Res. 2015, 3, 1165–1174. [Google Scholar] [CrossRef]
- Madan, V.; Kanojia, D.; Li, J.; Okamoto, R.; Sato-Otsubo, A.; Kohlmann, A.; Sanada, M.; Grossmann, V.; Sundaresan, J.; Shiraishi, Y.; et al. Aberrant splicing of U12-type introns is the hallmark of ZRSR2 mutant myelodysplastic syndrome. Nat. Commun. 2015, 6, 6042. [Google Scholar] [CrossRef]
- Woodward, W.A.; Krishnamurthy, S.; Yamauchi, H.; El-Zein, R.; Ogura, D.; Kitadai, E.; Niwa, S.; Cristofanilli, M.; Vermeulen, P.; Dirix, L.; et al. Genomic and expression analysis of microdissected inflammatory breast cancer. Breast Cancer Res. Treat. 2013, 138, 761–772. [Google Scholar] [CrossRef]
- Marcinkiewicz, K.M.; Gudas, L.J. Altered epigenetic regulation of homeobox genes in human oral squamous cell carcinoma cells. Exp. Cell Res. 2014, 320, 128–143. [Google Scholar] [CrossRef][Green Version]
- Haberman, Y.; Tickle, T.L.; Dexheimer, P.J.; Kim, M.O.; Tang, D.; Karns, R.; Baldassano, R.N.; Noe, J.D.; Rosh, J.; Markowitz, J.; et al. Pediatric Crohn disease patients exhibit specific ileal transcriptome and microbiome signature. J. Clin. Investig. 2014, 124, 3617–3633. [Google Scholar] [CrossRef]
- Voisin, G.; Bouvet, G.F.; Legendre, P.; Dagenais, A.; Masse, C.; Berthiaume, Y. Oxidative stress modulates the expression of genes involved in cell survival in DeltaF508 cystic fibrosis airway epithelial cells. Physiol. Genom. 2014, 46, 634–646. [Google Scholar] [CrossRef]
- Spurlock, C.F., 3rd; Tossberg, J.T.; Guo, Y.; Sriram, S.; Crooke, P.S., 3rd; Aune, T.M. Defective structural RNA processing in relapsing-remitting multiple sclerosis. Genome Biol. 2015, 16, 58. [Google Scholar] [CrossRef]
- Grunert, M.; Dorn, C.; Schueler, M.; Dunkel, I.; Schlesinger, J.; Mebus, S.; Alexi-Meskishvili, V.; Perrot, A.; Wassilew, K.; Timmermann, B.; et al. Rare and private variations in neural crest, apoptosis and sarcomere genes define the polygenic background of isolated Tetralogy of Fallot. Hum. Mol. Genet. 2014, 23, 3115–3128. [Google Scholar] [CrossRef] [PubMed]
- Roedder, S.; Kimura, N.; Okamura, H.; Hsieh, S.C.; Gong, Y.; Sarwal, M.M. Significance and suppression of redundant IL17 responses in acute allograft rejection by bioinformatics based drug repositioning of fenofibrate. PLoS ONE 2013, 8, e56657. [Google Scholar] [CrossRef] [PubMed][Green Version]
- Sharma, S.M.; Choi, D.; Planck, S.R.; Harrington, C.A.; Austin, C.R.; Lewis, J.A.; Diebel, T.N.; Martin, T.M.; Smith, J.R.; Rosenbaum, J.T. Insights in to the pathogenesis of axial spondyloarthropathy based on gene expression profiles. Arthritis Res. Ther. 2009, 11, R168. [Google Scholar] [CrossRef]
- Spiess, A.N.; Feig, C.; Schulze, W.; Chalmel, F.; Cappallo-Obermann, H.; Primig, M.; Kirchhoff, C. Cross-platform gene expression signature of human spermatogenic failure reveals inflammatory-like response. Hum. Reprod. 2007, 22, 2936–2946. [Google Scholar] [CrossRef]
- Ulmasov, B.; Oshima, K.; Rodriguez, M.G.; Cox, R.D.; Neuschwander-Tetri, B.A. Differences in the degree of cerulein-induced chronic pancreatitis in C57BL/6 mouse substrains lead to new insights in identification of potential risk factors in the development of chronic pancreatitis. Am. J. Pathol. 2013, 183, 692–708. [Google Scholar] [CrossRef]
- Chen, Y.W.; Shi, R.; Geraci, N.; Shrestha, S.; Gordish-Dressman, H.; Pachman, L.M. Duration of chronic inflammation alters gene expression in muscle from untreated girls with juvenile dermatomyositis. BMC Immunol. 2008, 9, 43. [Google Scholar] [CrossRef]
- Canna, S.W.; de Jesus, A.A.; Gouni, S.; Brooks, S.R.; Marrero, B.; Liu, Y.; DiMattia, M.A.; Zaal, K.J.; Sanchez, G.A.; Kim, H.; et al. An activating NLRC4 inflammasome mutation causes autoinflammation with recurrent macrophage activation syndrome. Nat. Genet. 2014, 46, 1140–1146. [Google Scholar] [CrossRef]
- Frades, I.; Andreasson, E.; Mato, J.M.; Alexandersson, E.; Matthiesen, R.; Martinez-Chantar, M.L. Integrative genomic signatures of hepatocellular carcinoma derived from nonalcoholic Fatty liver disease. PLoS ONE 2015, 10, e0124544. [Google Scholar] [CrossRef]
- Bronner, I.F.; Bochdanovits, Z.; Rizzu, P.; Kamphorst, W.; Ravid, R.; van Swieten, J.C.; Heutink, P. Comprehensive mRNA expression profiling distinguishes tauopathies and identifies shared molecular pathways. PLoS ONE 2009, 4, e6826. [Google Scholar] [CrossRef][Green Version]
- Platts, A.E.; Dix, D.J.; Chemes, H.E.; Thompson, K.E.; Goodrich, R.; Rockett, J.C.; Rawe, V.Y.; Quintana, S.; Diamond, M.P.; Strader, L.F.; et al. Success and failure in human spermatogenesis as revealed by teratozoospermic RNAs. Hum. Mol. Genet. 2007, 16, 763–773. [Google Scholar] [CrossRef]
Disclaimer/Publisher’s Note: The statements, opinions and data contained in all publications are solely those of the individual author(s) and contributor(s) and not of MDPI and/or the editor(s). MDPI and/or the editor(s) disclaim responsibility for any injury to people or property resulting from any ideas, methods, instructions or products referred to in the content. |
© 2025 by the authors. Licensee MDPI, Basel, Switzerland. This article is an open access article distributed under the terms and conditions of the Creative Commons Attribution (CC BY) license (https://creativecommons.org/licenses/by/4.0/).