1. Introduction
Alkaptonuria (AKU) is a rare autosomal recessive metabolic disorder (OMIM 203500, prevalence <0.1 per 10,000 individuals) that results in early-onset and progressively debilitating spondyloarthropathy [
1]. Caused by mutations in the homogentisate 1,2-dioxygenase (HGD) gene, AKU disrupts tyrosine and phenylalanine metabolism [
2]. This disruption causes an abnormal homogentisic acid (HGA) build-up, a metabolic intermediate that, upon accumulation, leads to ochronosis. This dark, insoluble pigment deposits within connective tissues, especially cartilage and bone. These ochronotic deposits cause tissue hardening and pigmentation, which contribute to AKU’s hallmark chronic inflammation, joint deterioration, and multiorgan complications, including cardiac and renal involvement [
3].
Over time, AKU patients experience severe and disabling pain and a marked reduction in quality of life due to these cumulative pathological effects.
SAA is a family of acute-phase proteins synthesized by hepatocytes in response to inflammatory stimuli. In humans, four SAA genes (SAA1, SAA2, SAA3, and SAA4), located within a 150 kb region on chromosome 11p15.1, encode SAA proteins with substantial sequence similarity [
4,
5,
6]. Under normal conditions, the plasma levels of SAA are approximately 3 mg/L. Still, they can surge to over 2000 mg/L during inflammation, primarily due to the action of pro-inflammatory cytokines such as IL-1, IL-6, and TNF-α, which enhance SAA gene expression [
7,
8]. A distinctive aspect of SAA lies in its role in amyloidosis, particularly AA amyloidosis, a condition characterized by the extracellular accumulation of insoluble protein fibrils that damage tissue and organ function [
9,
10]. Prolonged inflammation, as seen in AKU, can trigger AA amyloidosis: SAA undergoes aberrant cleavage, misfolding, and aggregation, adopting a pathological β-sheet conformation that promotes amyloid fibril formation [
11,
12].
Among SAA proteins, SAA1 has received significant attention due to its role in inflammatory responses and its genetic polymorphisms [
13]. The SAA1 gene encodes a precursor protein of 122 amino acids, including an 18-amino acid signal peptide. SAA1 is built up from helices 1, 2, 3, and 4, comprising residues 1–27, 32–47, 50–69, and 73–88, respectively. Unlike conventional helix bundles, the SAA1 helix bundle adopts a cone-shaped topology, with the N-termini of helices 1 and 3 closely packing against the C-termini of helices 2 and 4 [
14]. The C-terminal tail, encompassing residues 89–104, is well ordered and wraps around one face of the helix bundle, stabilizing it through multiple salt bridges and hydrogen bonds with residues from helices 1, 2, and 4. These interactions include Glu-26 and Tyr-29 from helix 1, Tyr-35 and Arg-39 from helix 2, and Trp-85 and Gly-86 from helix 4 [
14]. A critical structural feature is the invariant charge cluster formed by Tyr-104, Tyr-35, Arg-39, and Arg-96, where bifurcated salt bridges involving the carboxylate termini and the hydroxyl group of Tyr-35 stabilize the C-terminal region. This charge quartet is conserved across SAA proteins in all species. Additionally, the C-terminal tail contains three invariant proline residues at positions 92, 97, and 101, which impose further conformational rigidity. Collectively, these conserved interactions emphasize the role of the C-terminal tail in maintaining the structural integrity of the SAA1 helix bundle [
14].
Following cleavage of its signal peptide, a mature 104-amino-acid SAA1 protein is released into the bloodstream, where it participates in various physiological processes [
12]. Currently, five known SAA1 polymorphisms (SAA1.1, SAA1.2, SAA1.3, SAA1.4, and SAA1.5) are reported, with 274 variants annotated on the UniProt Database, including missense mutations along the entire protein sequence, each with varying clinical significance [
13]. Specifically, the N-terminal and C-terminal regions of SAA1 work together to regulate amyloid formation. The C-terminal tail stabilizes the protein’s structure by wrapping around its four-helix bundle and locking it into a non-amyloidogenic hexamer. The N-terminal region, containing amyloid-prone segments, is normally hidden within this structure, preventing fibril formation. However, under inflammatory conditions, glycosaminoglycans (GAGs) like heparan sulfate can displace high-density lipoprotein (HDL) from SAA, exposing the N-terminal and promoting aggregation. Additionally, SAA1.1 is more susceptible to MMP-1-mediated degradation than other SAA1 variants, leading to the generation of amyloidogenic N-terminal fragments, such as the 1–57 fragment, which further enhance fibril formation in pathological states [
14]. Consistently, previous work [
15] showed that SAA1.1 was the major isoform present in the amyloid deposits of all affected individuals, including those heterozygous for SAA1.1. These findings highlight the critical role of isoform-specific structural properties and susceptibilities in amyloidogenesis [
15]. Thus, the C-terminal maintains stability, while the N-terminal holds amyloid-forming potential that is activated in pathological states [
15].
Recent studies have highlighted the role of serum amyloid A (SAA) proteins in the pathophysiology of AKU, specifically associating the disease with secondary amyloid A (AA) amyloidosis [
16].
Furthermore, in AKU, the presence of elevated HGA appears to increase the misfolding of SAA1, acting as a destabilizing factor that accelerates the transition of SAA1 proteins to amyloidogenic conformations [
17]. This biochemical interplay between HGA and SAA1 aggravates amyloid deposition in affected tissues, potentially worsening inflammation and organ damage. Notably, previous works highlighted the propensity of the SAA1.1 polymorphism, distinguished from other variants by the presence of the Ala52Val, Val57Ala, and Thr59Ser mutations, to induce an early and more severe inflammatory response compared to the other SAA1 variants [
18].
Despite the known role of SAA proteins in amyloidosis, the specific involvement of the SAA1.1 isoform in alkaptonuria (AKU) has not been previously established [
11,
12,
13,
14,
15,
16,
17]. While these studies have explored the role of SAA1 and its variants in amyloidogenesis, they have not specifically linked the SAA1.1 isoform to AKU severity. This study aims to fill this gap by identifying SAA1.1 as a potential biomarker for AKU severity and progression. Our research design differs from previous studies by integrating a comparative analysis using the ApreciseKUre Precision Medicine Ecosystem (AKU-PME) [
19]. This study not only analyzes the relationship between SAA1.1 and markers of inflammation but also investigates the underlying structural mechanisms of SAA1.1’s amyloidogenic properties using molecular dynamics simulations. Our findings indicate that SAA1.1 exhibits significant structural instability, particularly in the C-terminal region, which enhances its tendency to form amyloid fibrils. This structural destabilization is consistent with our clinomics analysis, which highlights the potential of SAA1.1 as a high-risk biomarker for predicting the severity of amyloid-related complications in AKU.
The ApreciseKUre Precision Medicine Ecosystem (AKU-PME) platform is a comprehensive, multidisciplinary, and interactive database that integrates genetic, biochemical, and clinical data on AKU [
19]. This integrative study, utilizing data from AKU-PME, investigated the relationships between SAA variants and markers of inflammation and metabolism. To uncover the molecular features that grant SAA1.1—identified as the predominant isoform in amyloid deposits—its strong amyloidogenic properties, a comparative analysis was performed. Molecular dynamics simulations were used to compare SAA1.1 with the reference sequence from the UniProt database, corresponding to SAA1.2, which reflects the translation of the current human genome reference assembly GRCh38/hg38. Our analyses confirmed the clinomics approach, shedding light on a lower C-ter region structural stability of SAA1.1, reflecting an SAA1.1 early structural destabilization and its significant increase in the fibrilization process compared to the other variant. Our findings support the presence of the SAA1.1 allelic variant as a high-risk biomarker for predicting a more severe and early-onset amyloidogenic profile in AKU, paving the way for more personalized therapeutic strategies targeting inflammation management in patients with an elevated risk of amyloid complications. Beyond AKU, these insights may also broaden our understanding of the role of SAA polymorphisms in other inflammatory conditions associated with secondary amyloidosis.
4. Discussion
The investigation of structural conformations and dynamic stability of the SAA1 protein variants (SAA1.1 and SAA1.2) offers profound insights into their distinct molecular behaviors.
While SAA proteins, particularly SAA1, have been studied in other amyloid-related diseases [
17], our study uniquely links the SAA1.1 isoform to AKU severity through computational modeling, providing new insights into its potential role as a biomarker.
Our study integrates clinomics and molecular dynamics (MD) simulations to predict molecular behaviors and disease outcomes. Clinomics, which combines clinical data with high-throughput “-omics” technologies, provides a framework for understanding disease pathways and identifying biomarkers by linking clinical phenotypes to molecular profiles. This approach enabled us to establish a novel connection between the SAA1.1 allelic variant and heightened disease severity in alkaptonuria (AKU), moving beyond mere observation to predictive insights. By identifying the SAA1.1 isoform’s destabilizing effects, we demonstrated how MD simulations can predict the structural instability of proteins, revealing conformational shifts that drive amyloid fibril formation and inflammation.
However, the inherent ultra-rarity of AKU poses significant challenges to achieving conventional statistical significance, requiring an analytical approach that emphasizes descriptive and exploratory methods suited for small sample sizes.
Figure 1 illustrates the range, distribution, and variability of key biochemical markers across allelic groups. Rather than serving as a basis for definitive statistical conclusions, it highlights observable patterns and trends that may hold biological and clinical relevance. These trends, such as potential links between SAA1 variants and inflammatory markers, are further supported by molecular dynamics analysis, offering a multidimensional perspective on the data and guiding hypothesis generation. This approach aligns with best practices in rare disease research, where descriptive and exploratory analyses often advance knowledge despite sample size constraints. By integrating visualization with molecular modeling, this study maximizes the utility of the available data while addressing their limitations, providing a strong foundation for future investigations.
MD simulations, as applied in our study, offer a mechanistic understanding of these molecular events, surpassing experimental validation by predicting how genetic variations impact protein behavior. These simulations enabled us to foresee how structural changes in the SAA1.1 variant lead to pathological transitions, thus providing a predictive model for disease severity. This predictive framework opens new avenues for therapeutic strategies, such as stabilizing agents to prevent amyloidogenesis or mitigate inflammatory responses.
Together, clinomics and MD simulations enhance our ability to predict the outcomes of genetic variations, offering a dual approach to disease progression and therapeutic development. By capturing transient states and revealing molecular instability that is difficult to observe experimentally, these methods provide valuable insights that can guide precision medicine strategies tailored to individual genetic profiles.
These implications are particularly noteworthy for alkaptonuria. AKU is a rare disorder characterized by the accumulation of homogentisic acid and associated complications, including tissue degeneration and amyloidosis, identifying SAA1.1 as a potentially destabilizing variant that offers a novel biomarker for predicting disease severity. This insight provides a transformative approach to AKU management by enabling the early diagnosis and severity assessment of secondary amyloidosis and exemplifying how structural biology can inform early interventions, potentially mitigating irreversible damage associated with disease progression. Genetic stratification of patients through genotype analysis can guide personalized interventions, with monoclonal antibodies targeting inflammatory mediators, such as tocilizumab [
15], presenting a potential prevention/therapeutic option. Furthermore, linking allelic variants to disease progression establishes a foundation for precision medicine strategies tailored to the molecular profiles of individual patients.
Beyond AKU, this work has broader relevance for amyloid-related diseases, where protein misfolding and aggregation play central roles in pathology. The innovative use of molecular dynamics simulations and interaction network analyses sets a new standard for exploring protein variant stability. This approach can be applied to identify critical molecular markers and therapeutic targets in other conditions where amyloidogenesis contributes to disease, such as Alzheimer’s or systemic amyloidosis.
By employing a comprehensive 1 μs classical molecular dynamics (cMD) simulation, coupled with analyses such as RMSD, RMSF, principal component analysis (PCA), and intramolecular interaction networks, this study delineates the fundamental factors contributing to the divergent structural stabilities and interaction profiles of these variants. The implications of these findings extend to understanding the functional disparities between the variants and providing a molecular basis for their differential roles in pathological and physiological contexts.
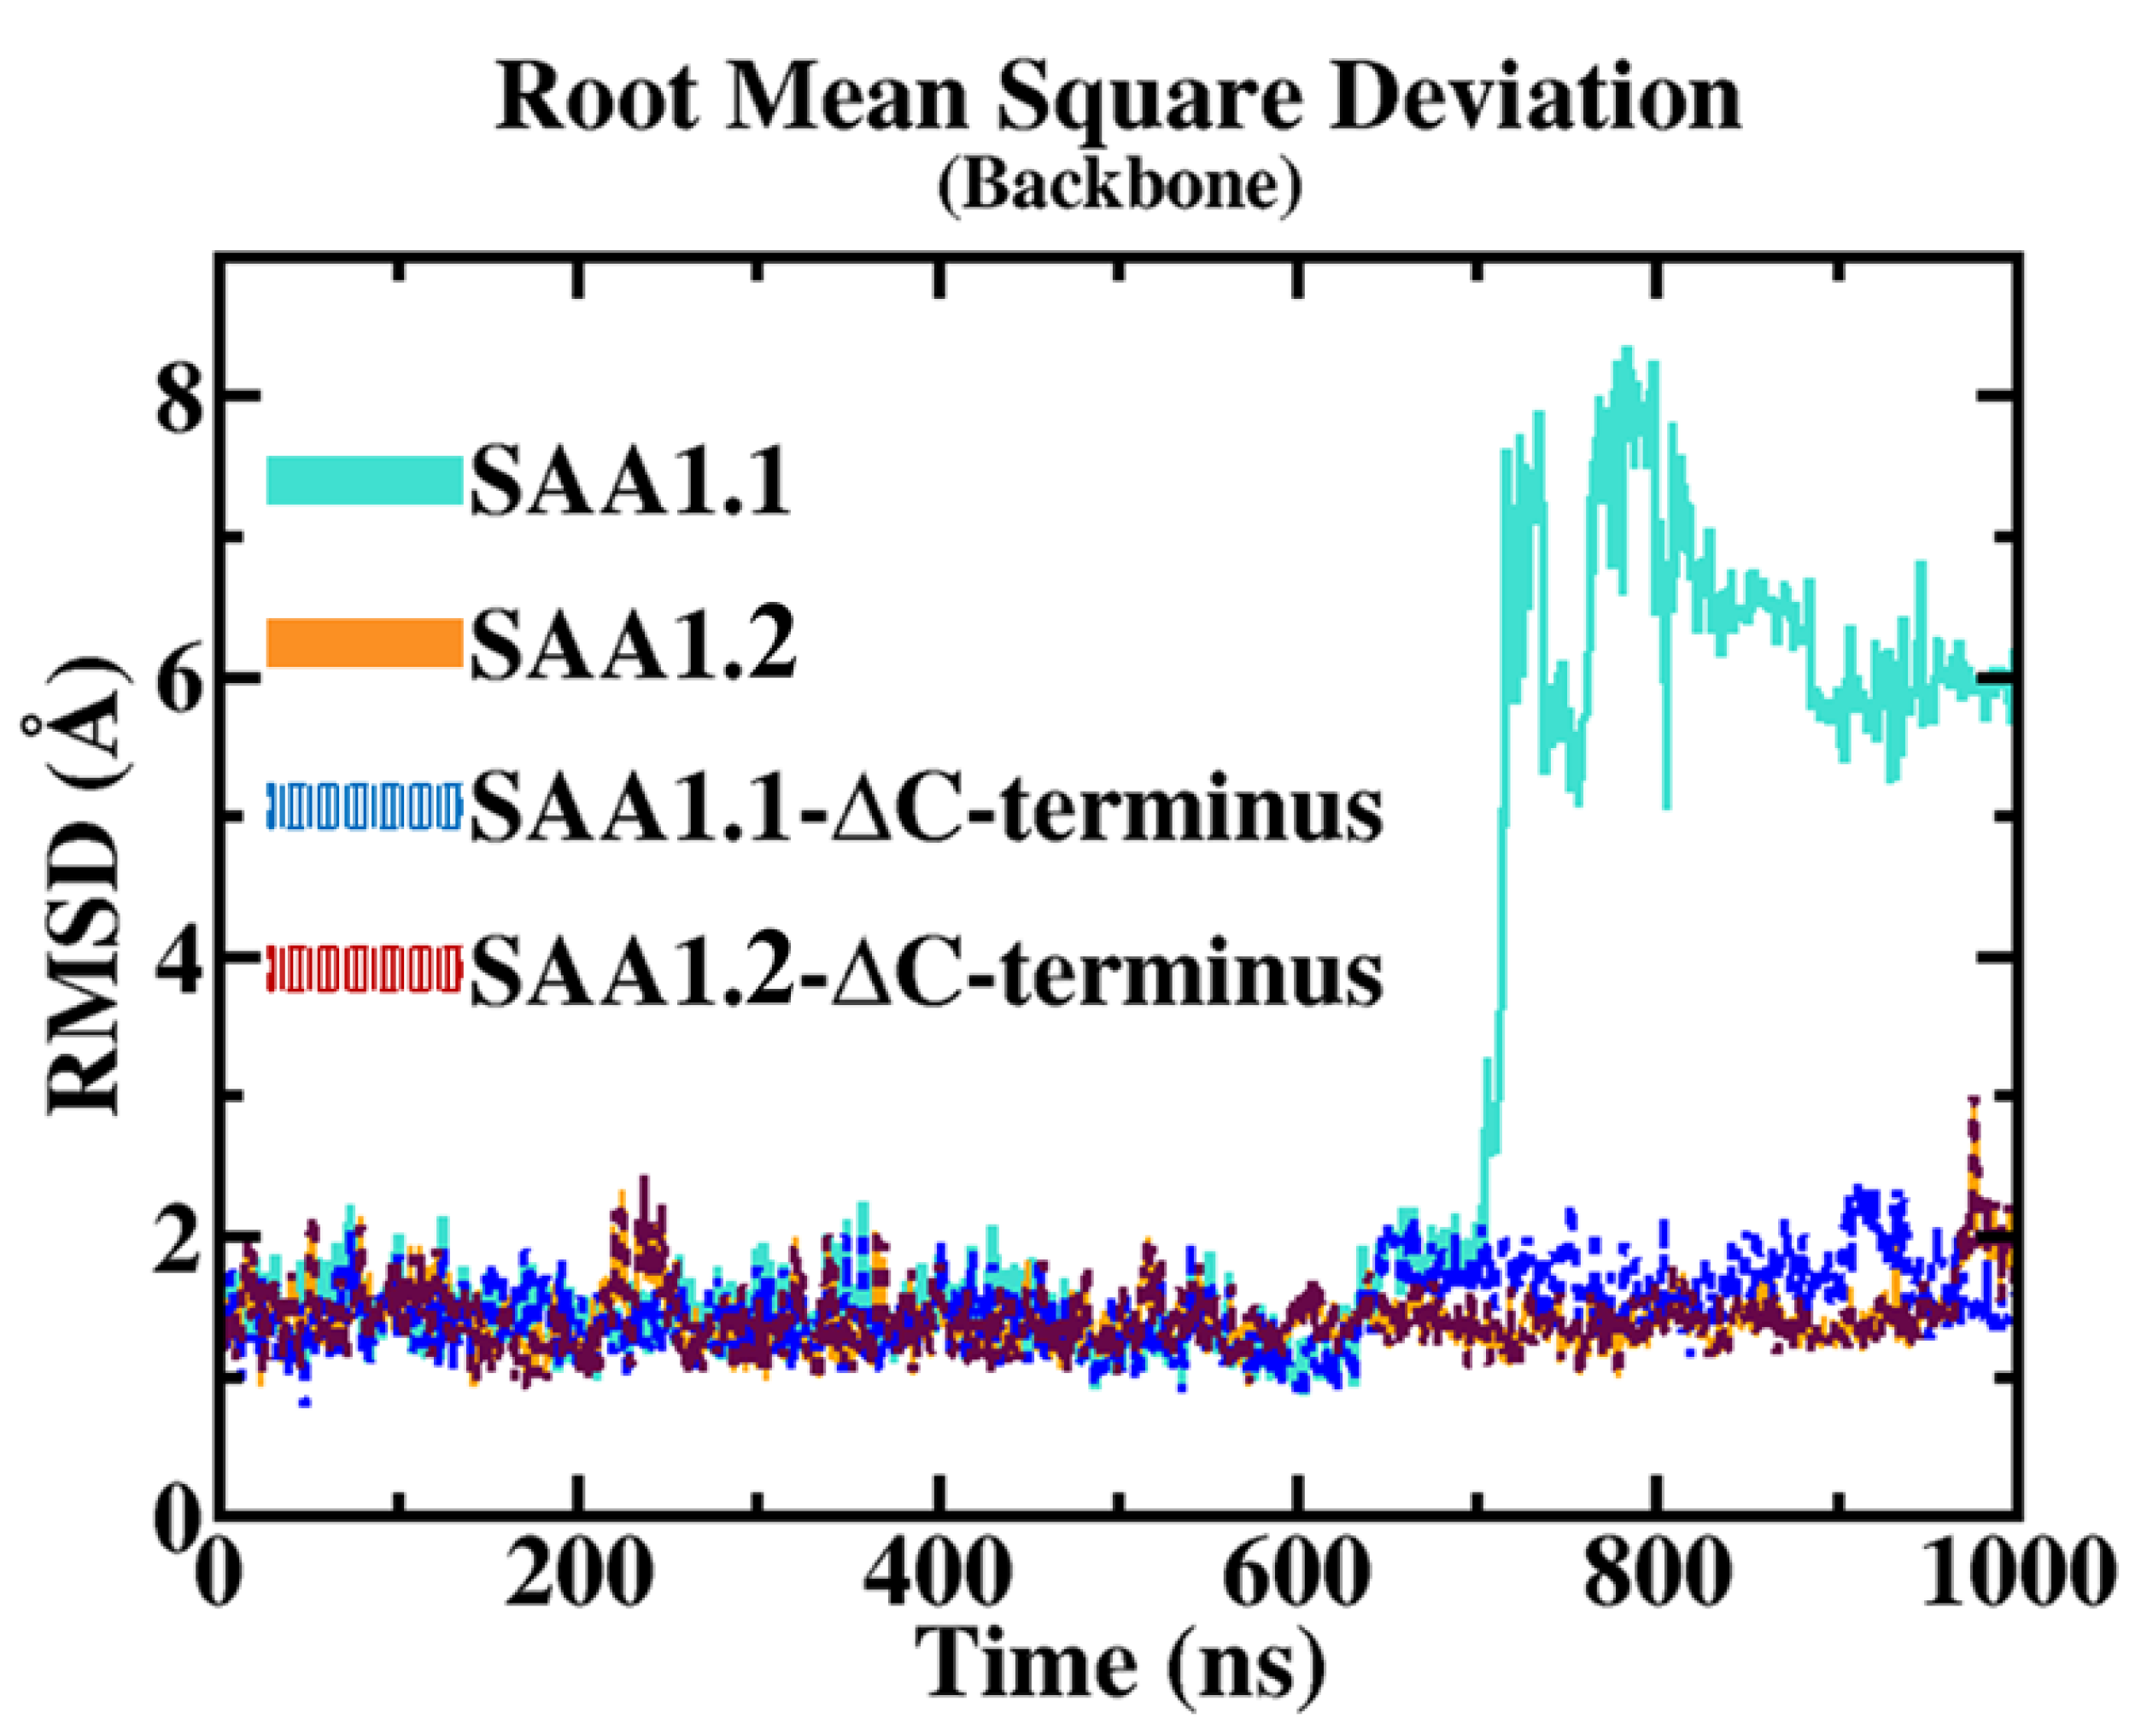
The root mean square deviation (RMSD) results provide a clear comparative view of the structural stability between the SAA1.1 and SAA1.2 isoforms over the molecular dynamics (MD) trajectory. The RMSD measures the average deviation of atomic positions from a reference structure and serves as a reliable indicator of overall structural stability. For SAA1.2, RMSD values remained consistently low throughout the simulation, reflecting robust structural integrity. This stability suggests that SAA1.2 retains its native conformation under simulated conditions, with minimal deviation over time. Such behavior is characteristic of a well-folded protein with a stable intramolecular interaction network.
In contrast, the SAA1.1 isoform displayed a markedly different RMSD profile. While initially stable for the first 700 nanoseconds (ns) of the simulation, SAA1.1 underwent a significant conformational shift, as evidenced by a sharp increase in RMSD to approximately 6 Å. This sudden and pronounced deviation signifies a destabilizing event, likely linked to the intrinsic structural properties of the isoform. The observed RMSD spike underscores a fundamental loss of stability, prompting further investigation into the specific molecular features responsible for this destabilization.
To isolate the source of this structural instability, additional RMSD analyses were conducted, excluding the C-terminal (C-ter) region from the calculations. Interestingly, when the C-ter region was excluded, both SAA1.1 and SAA1.2 exhibited comparable RMSD values of approximately 1.5 Å, indicating that the backbone dynamics of the core region (excluding the C-ter) are similar for both isoforms. This finding highlights the pivotal role of the C-ter region in modulating the structural integrity of SAA1.1 and implicates it as the primary driver of the observed destabilization.
Building on these findings, root mean square fluctuation (RMSF) analyses were employed to gain residue-specific insights into the flexibility and dynamic behavior of the protein. RMSF measures the average fluctuation of each residue around its mean position, providing a granular view of local flexibility. The analysis revealed significant differences in the dynamic profiles of the two isoforms. Specifically, two regions of interest—the alpha–alpha hairpin (residues 20–37) and the random loop (residues 96–104)—exhibited strikingly distinct behavior between the isoforms.
In SAA1.2, these regions demonstrated high stability throughout the simulation. The alpha–alpha hairpin and the random loop remained in close proximity, maintaining critical hydrophobic and polar interactions. These interactions serve to anchor the C-ter region to the rest of the protein, ensuring the structural cohesion of the molecule. This stability likely contributes to the robust conformational integrity observed in the SAA1.2 isoform.
Conversely, in SAA1.1, the alpha–alpha hairpin exhibited destabilization, characterized by increased fluctuations and disrupted interactions with the C-ter region. This loss of stabilizing interactions between the alpha–alpha hairpin and the C-ter led to a cascading destabilization of the entire C-ter region. The decoupling of these domains not only resulted in localized instability but also amplified the overall structural deviation of the protein. Such behavior is indicative of an inherent vulnerability in the SAA1.1 isoform, driven by its unique sequence and structural properties.
These findings underscore the critical interplay between the alpha–alpha hairpin and the C-ter region in maintaining the structural integrity of SAA proteins. In SAA1.2, the cohesive interaction network between these domains fortifies the protein against destabilizing forces, while in SAA1.1, the breakdown of this network results in significant conformational instability. This comparative analysis highlights the molecular basis for the differential stability of the two isoforms, offering valuable insights into their distinct functional and pathological roles.
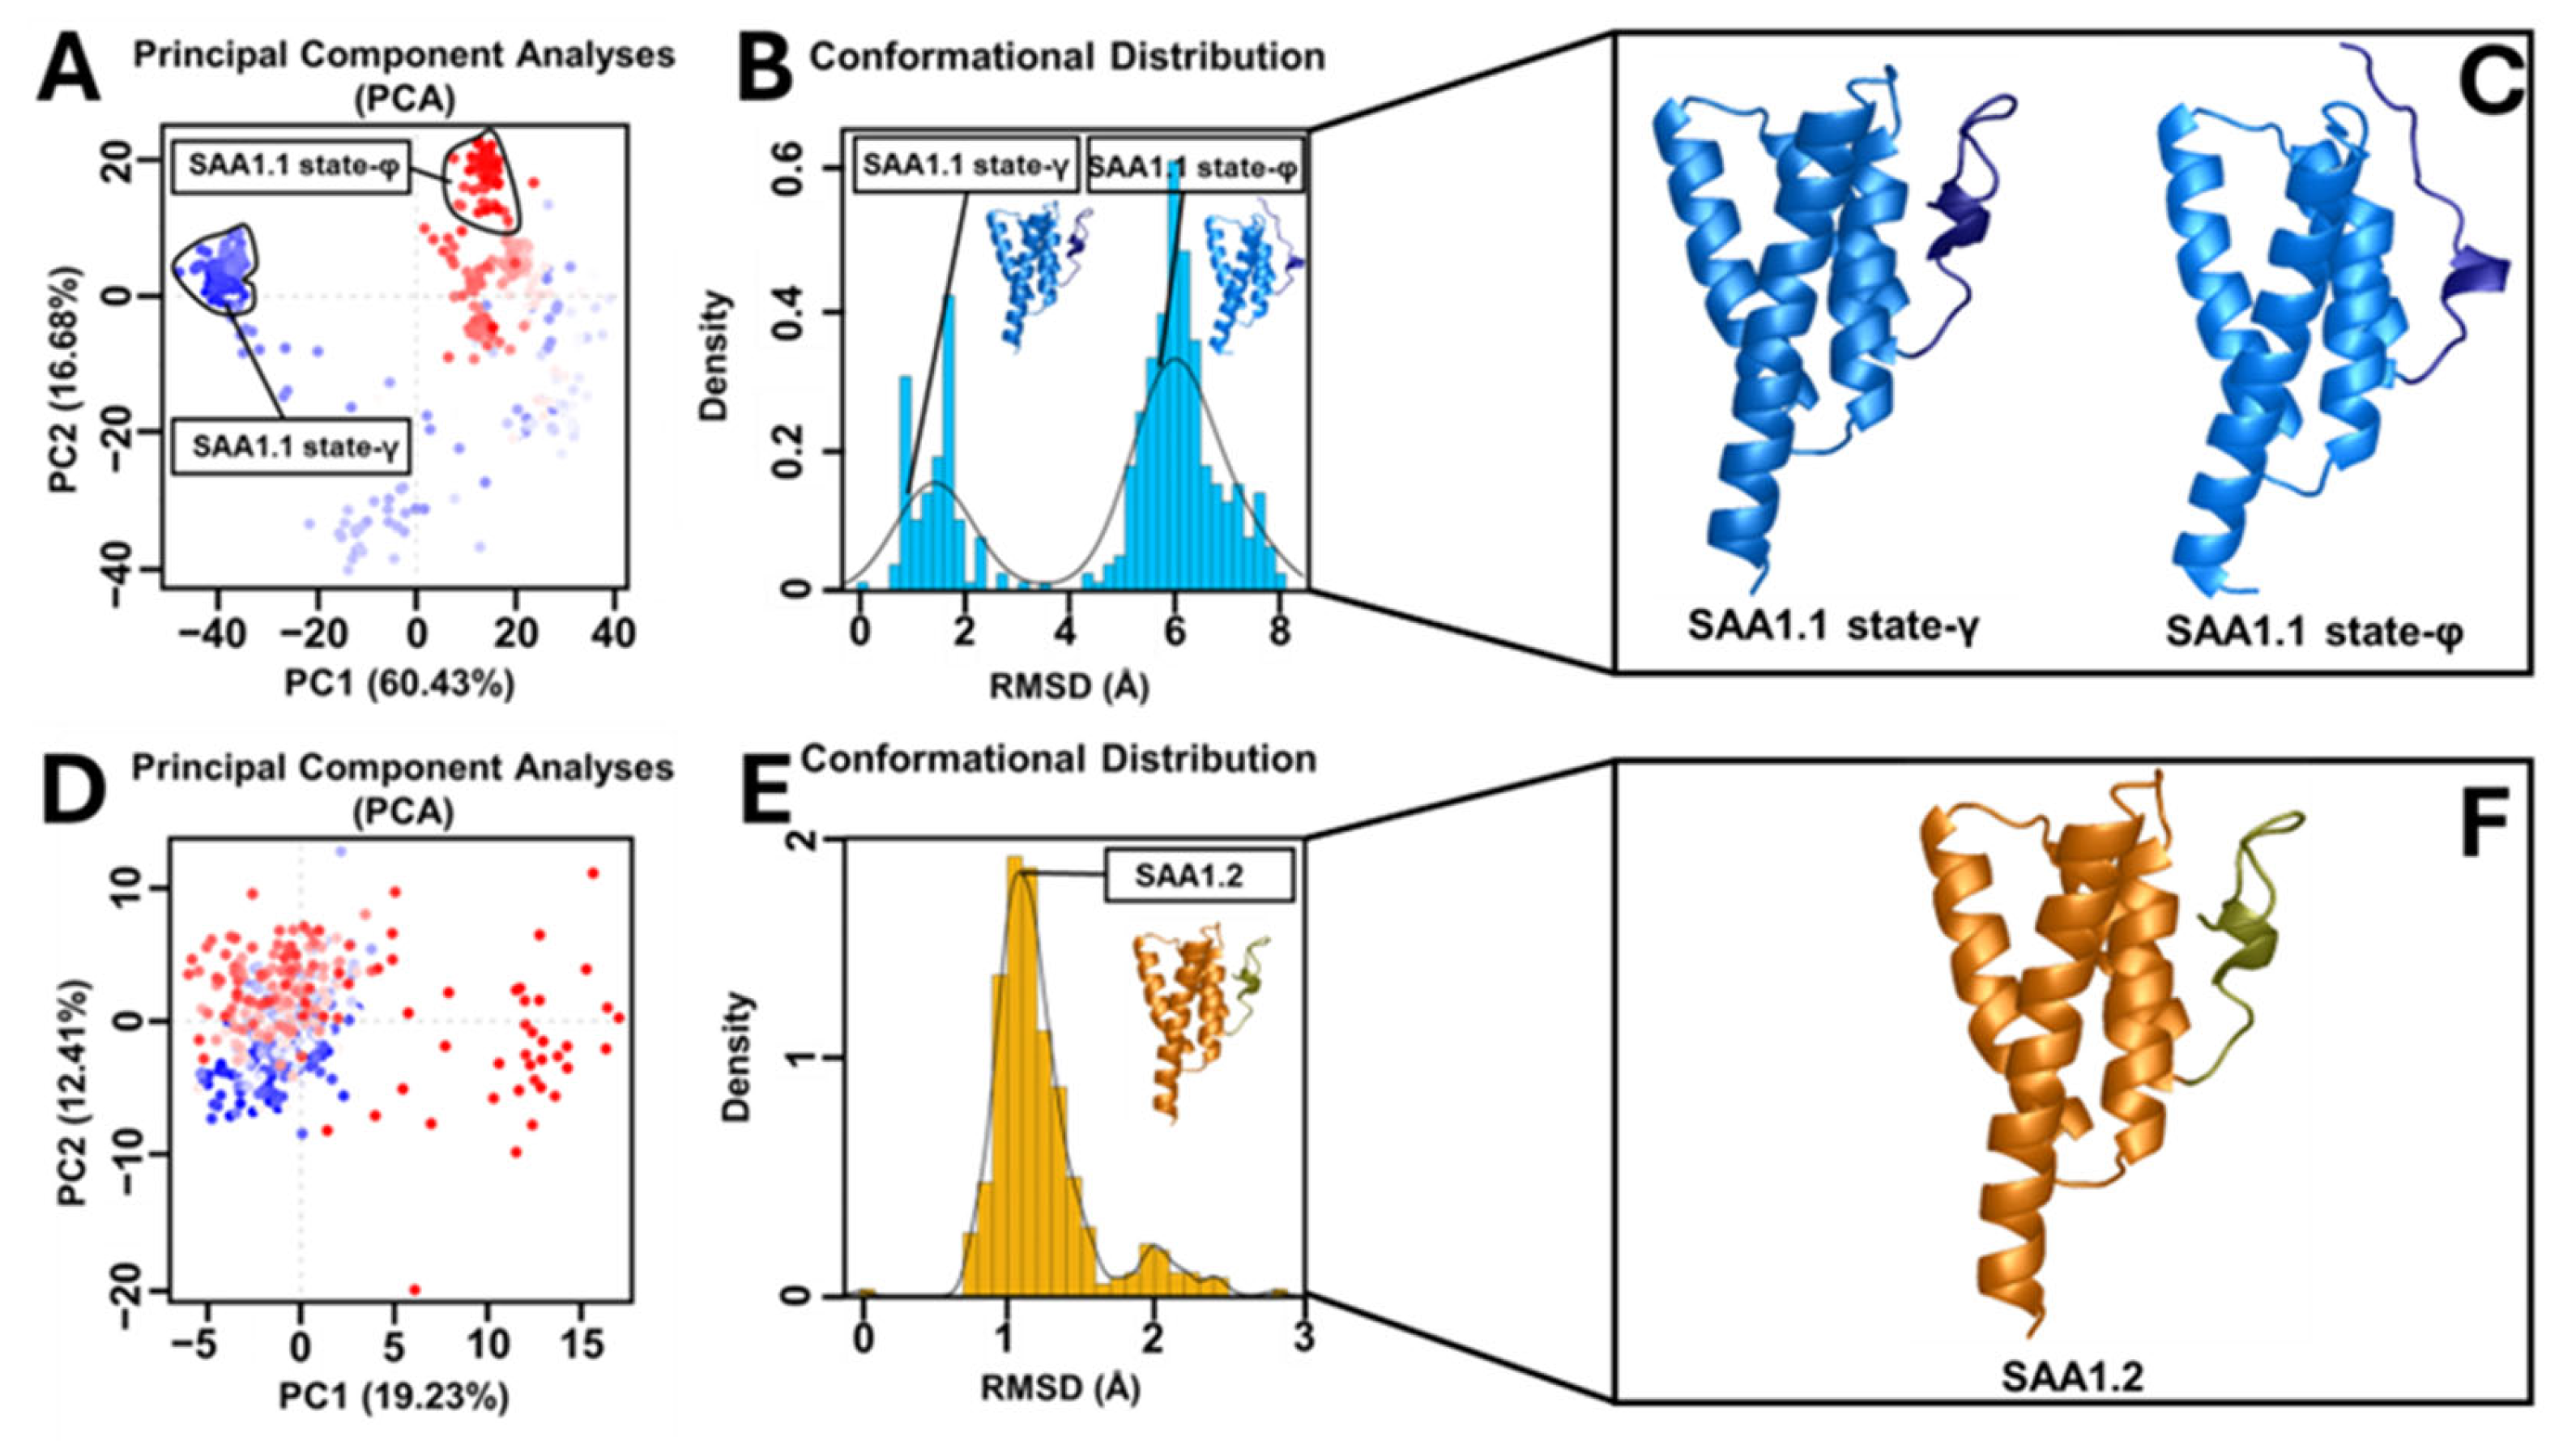
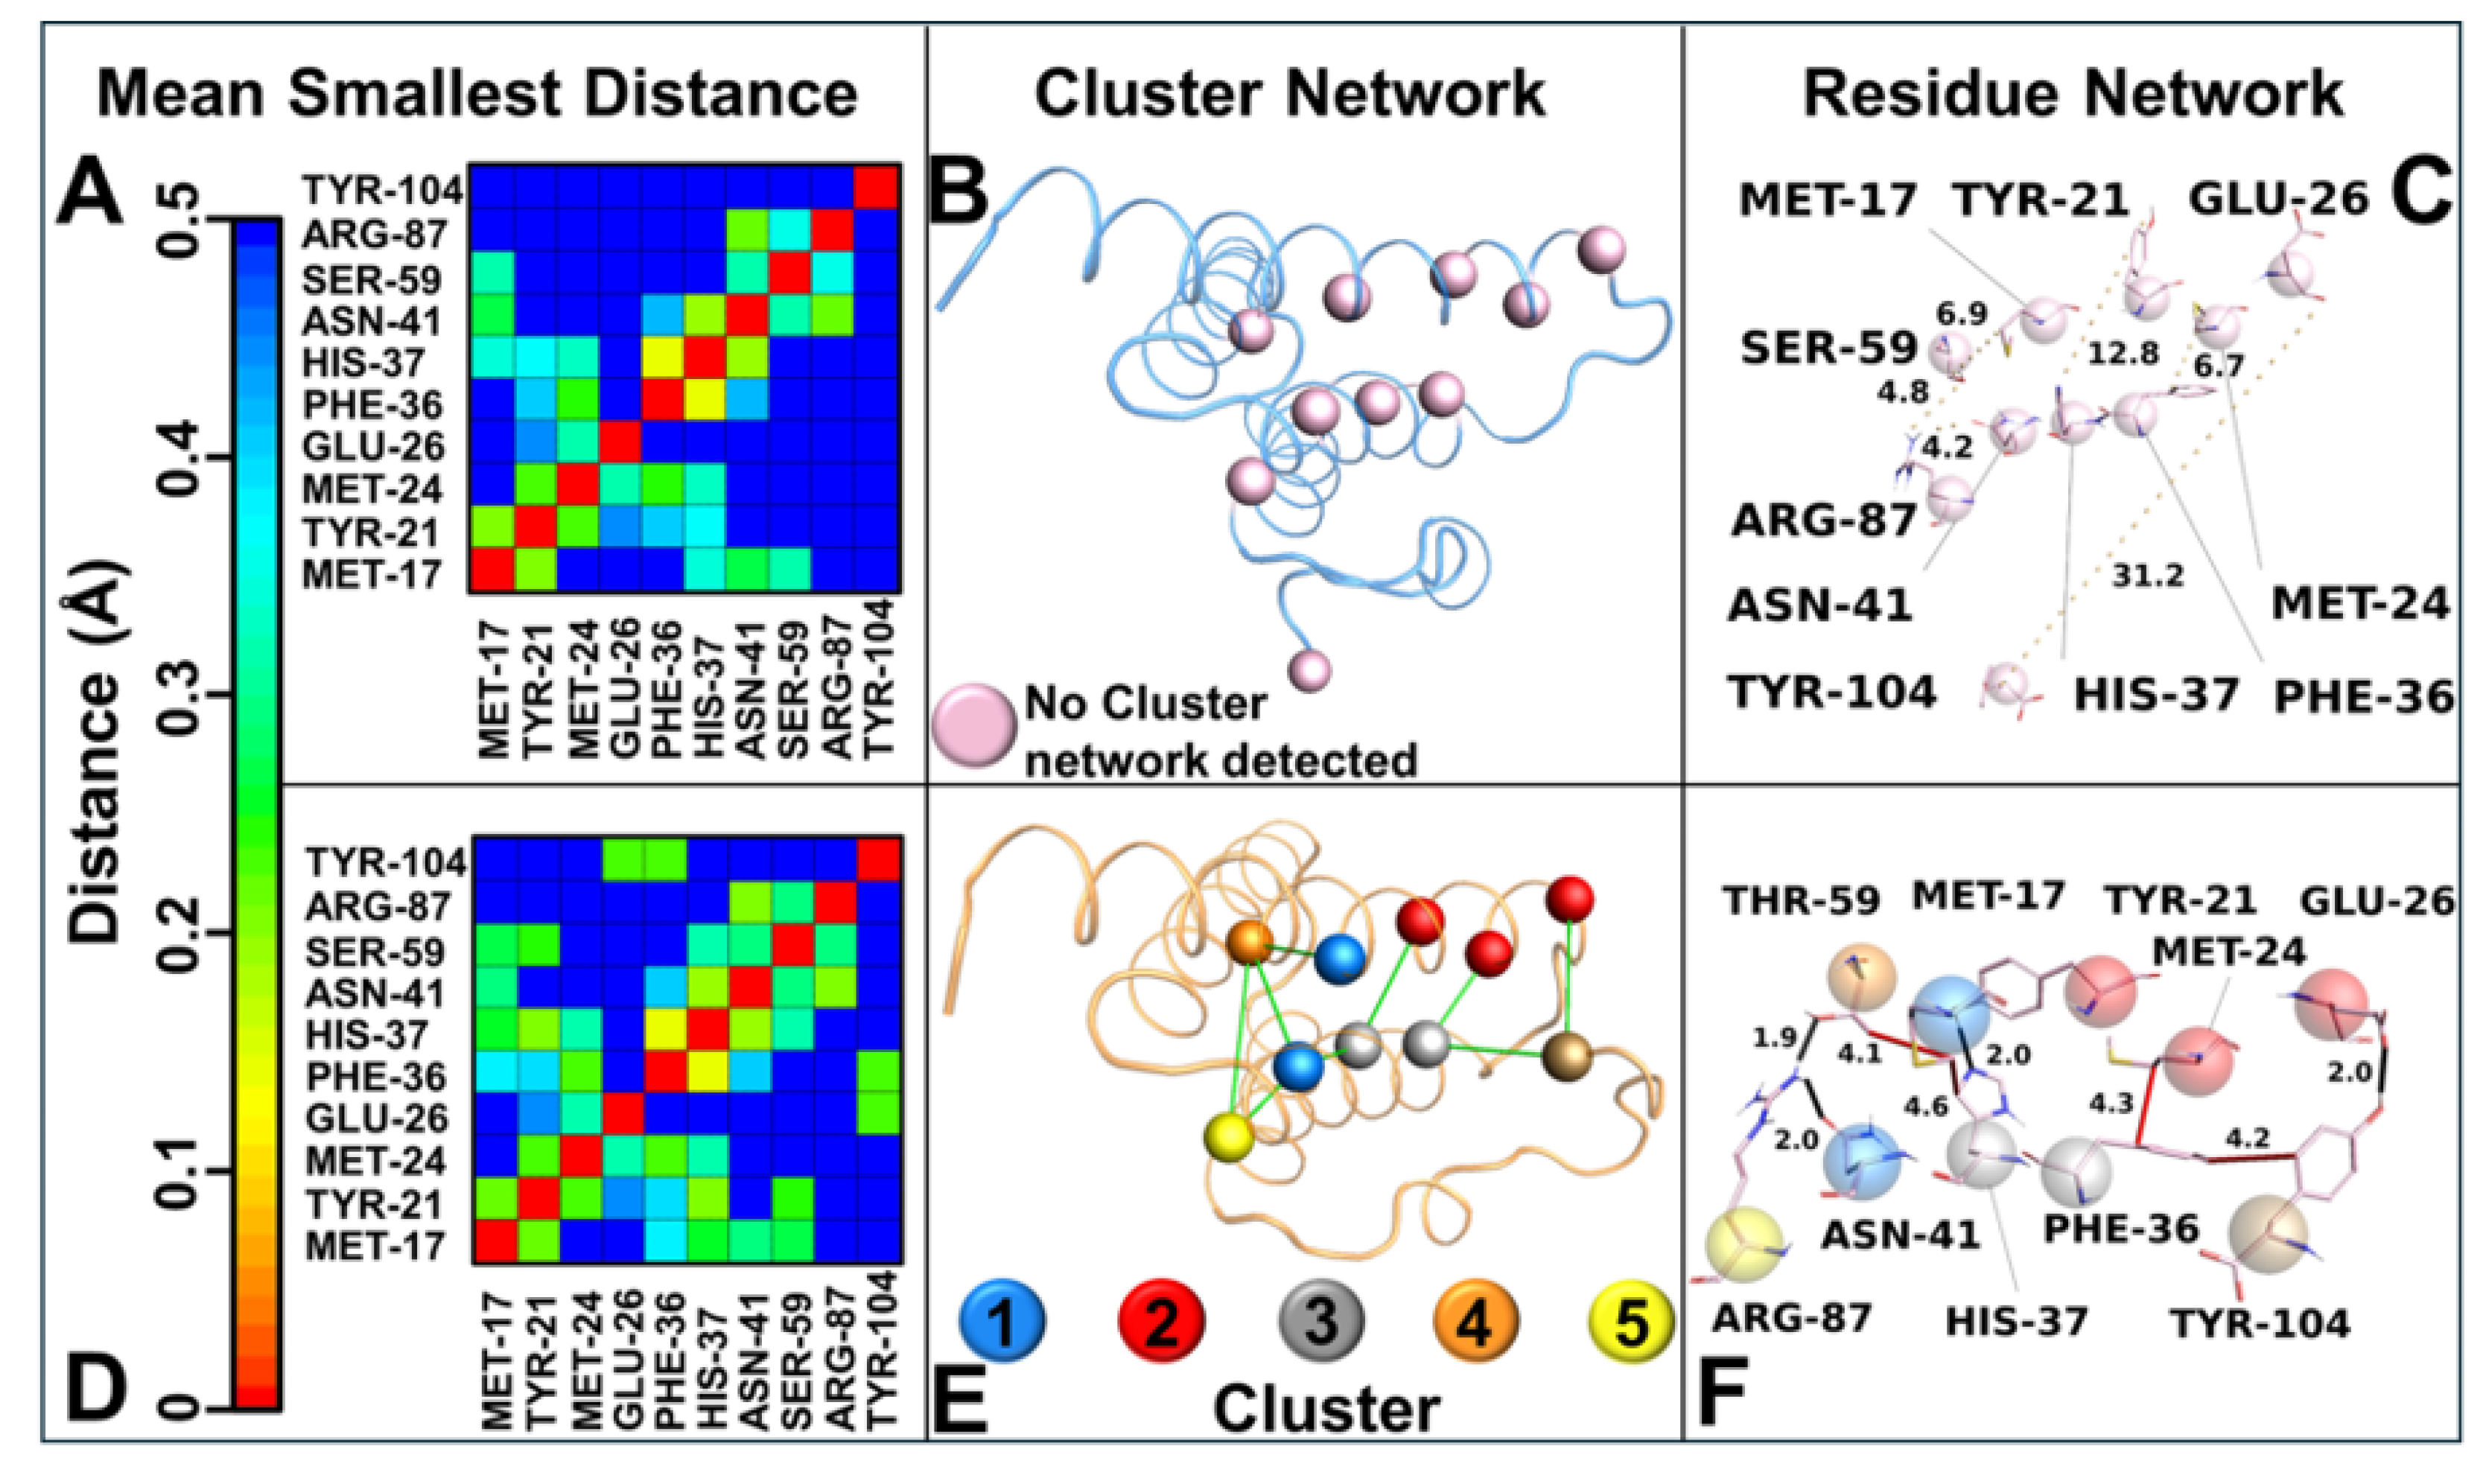
Principal component analysis (PCA) of the MD trajectories revealed divergent conformational landscapes for the two variants. SAA1.2 confined most of its conformations within a single subspace, corresponding to a stable state where the C-ter region is proximate to the alpha–alpha hairpin. In stark contrast, SAA1.1 exhibited two distinct subspaces: the stable state-γ and a secondary state (state-φ), characterized by the C-ter region’s departure from the alpha–alpha hairpin. The dual-state behavior of SAA1.1 aligns with its heightened structural instability and susceptibility to conformational shifts. Intramolecular interaction analysis further elucidated the mechanistic underpinnings of variant-specific stability. The contact map analysis highlighted that SAA1.2 fosters a broader interaction network with shorter residue–residue distances, whereas SAA1.1 exhibits a more fragmented interaction profile lacking important interactions. These observations were corroborated by correlation network analysis (CNA), which identified an intricate hydrophobic and polar interaction network in SAA1.2, encompassing residues from the N-terminal (N-ter) to the C-ter region.
The intricate network of intramolecular interactions revealed in this study sheds light on a critical determinant of SAA1 variant stability—Thr-59 in SAA1.2. This residue, solely present in SAA 1.2 among all variants, emerges as a pivotal stabilizing force, enabling SAA1.2 to maintain structural integrity and foster effective interplay between key structural domains. By contrast, the SAA1.1 variant lacks this stabilizing feature, as it contains serine (Ser-59) in place of threonine, a substitution with profound ramifications for its structural and dynamic behavior.
In SAA1.2, Thr-59 acts as a molecular linchpin, forming a strong hydrogen bond with Arg-87 and a consistent hydrophobic interaction with Met-17. This dual interaction anchors the alpha–alpha hairpin (residues 20–37) to the random loop (residues 96–104), reinforcing their spatial proximity and promoting structural stability in the C-terminal (C-ter) region. This interplay creates a robust molecular framework, ensuring that the C-ter region remains in the γ-conformational state, where it is closely associated with the alpha-alpha hairpin. This configuration stabilizes the overall protein structure and optimizes the hydrophobic and polar interaction network critical for the biological function of SAA1.2. Conversely, SAA1.1 is deprived of this stabilizing interaction due to the substitution of Thr-59 with Ser-59. Unlike threonine, serine lacks a methyl group, a structural feature indispensable for hydrophobic interactions with Met-17. The absence of this methyl group eliminates the stabilizing hydrophobic contact and weakens the interaction with Arg-87. Consequently, the interplay between the alpha–alpha hairpin and random loop is significantly impaired in SAA1.1, causing a breakdown in the cohesive interaction network responsible for the C-ter stability. This disruption is a primary factor behind the conformational heterogeneity observed in SAA1.1, as evidenced by its tendency to alternate between the γ-state and a destabilized φ-state, where the C-ter region diverges from the alpha–alpha hairpin. The role of Thr-59 extends beyond local interactions, influencing the broader structural dynamics of SAA1.2. By stabilizing the alpha–alpha hairpin and random loop, Thr-59 ensures the preservation of hydrophobic and polar networks that span from the N-terminal (N-ter) to the C-ter region. This interconnected network promotes uniform conformational dynamics, as demonstrated by PCA results showing that SAA1.2 conformations are confined to a single stable subspace. This structural coherence is absent in SAA1.1, where the lack of Thr-59 contributes to the fragmentation of the interaction network, destabilizing the alpha–alpha hairpin and weakening its coordination with the C-ter region.
The absence of Thr-59 in SAA1.1 not only undermines the integrity of the alpha–alpha hairpin but also disrupts its role as a structural mediator. The resulting decoupling between the hairpin and the random loop precipitates a cascade of destabilizing effects, leaving the C-ter region vulnerable to conformational fluctuations. This is reflected in the PCA and RMSD analyses, where SAA1.1 exhibits a dual conformational state and increased structural deviation, hallmarks of reduced stability. Thr-59 represents a cornerstone of SAA1.2 stability, acting as a molecular nexus that links key structural domains and preserves the cohesiveness of the protein. Its unique ability to engage in both hydrogen bonding and hydrophobic interactions distinguishes it as an irreplaceable element of the SAA1.2 interaction network. The absence of Thr-59 in SAA1.1, replaced by the less versatile Ser-59, underscores the delicate balance required for maintaining structural stability. This single-residue substitution exemplifies the profound impact of subtle amino acid variations on protein dynamics and highlights the vulnerability of SAA1.1 to destabilizing perturbations. The findings underscore the centrality of Thr-59 in dictating not only the stability of SAA1.2 but also its potential functional roles. The preservation of a cohesive interaction network and a stable C-ter region is likely to confer functional advantages to SAA1.2, enhancing its ability to interact with ligands or participate in multimeric assemblies. By contrast, the compromised structural stability of SAA1.1 may predispose it to pathological transitions, such as misfolding or aggregation, which are often implicated in amyloid-related diseases.
Briefly, Thr-59 serves as a molecular cornerstone in SAA1.2, ensuring the stable interplay between the alpha–alpha hairpin and random loop regions and safeguarding the structural integrity of the C-ter region. The absence of this critical residue in SAA1.1 underscores the profound implications of single-residue substitutions, shedding light on the mechanistic underpinnings of variant-specific dynamics and their broader functional consequences. This finding accentuates the power of molecular simulations and interaction network analyses to unravel intricate structural phenomena, offering a compelling narrative for the centrality of Thr-59 in maintaining protein stability and function. This comprehensive analysis delineates the molecular determinants underlying the differential stability of SAA1 variants. The stable structural dynamics of SAA1.2 are driven by a synergistic interplay of robust intramolecular interactions, conformational uniformity, and network connectivity, positioning it as a structurally superior variant. In contrast, the pronounced destabilization in SAA1.1 arises from localized disruptions, particularly within the alpha–alpha hairpin and its interaction with the C-ter region.
These findings hold significant implications for understanding the functional roles of SAA1 variants in AKU and other amyloidosis pathological contexts where protein misfolding or instability plays a role. The ability of SAA1.2 to sustain a stable conformation and maintain an intricate interaction network may confer functional advantages, potentially influencing its interactions with ligands or other biomolecules. Meanwhile, the instability of SAA1.1 could predispose it to pathogenic transitions, such as aggregation or misfolding, relevant to amyloid diseases.
5. Conclusions
Serum amyloid A (SAA) is a well-characterized acute-phase protein predominantly produced by hepatocytes in response to pro-inflammatory cytokines such as IL-6, IL-1β, and TNF-α during systemic inflammation.
Its physiological role includes modulating immune responses, promoting chemotaxis, and participating in high-density lipoprotein metabolism during acute and chronic inflammatory states.
In the context of AKU, chronic inflammation arising from ochronotic pigment deposits—formed by homogentisic acid (HGA) polymerization within connective tissues—leads to significant local and systemic upregulation of SAA. This aligns with its known function as a biomarker of persistent inflammation associated with tissue damage. However, as previous studies and findings in the present manuscript demonstrate, the elevated levels of SAA observed in AKU patients cannot be solely attributed to ochronosis-related inflammation. The homozygosity of the SAA1.1 allele plays a distinct and pivotal role in exacerbating the inflammatory response. Structural instability inherent to the SAA1.1 isoform renders it more prone to amyloidogenic transformations, characterized by the misfolding and aggregation of the protein into pathological β-sheet-rich fibrils.
This isoform-specific susceptibility is directly linked to the heightened and accelerated inflammatory progression observed in individuals homozygous for SAA1.1, in contrast to carriers of other polymorphic variants such as SAA1.2.
This manuscript provides compelling evidence from molecular dynamics simulations showing that the SAA1.1 isoform exhibits significant conformational destabilization, particularly in the C-terminal region. This structural instability facilitates the generation of amyloidogenic fragments that exacerbate inflammation by activating immune cells through pattern recognition receptors, such as Toll-like receptors (TLRs). These pathways amplify the production of pro-inflammatory cytokines, creating a feedback loop that further elevates SAA levels and promotes secondary amyloidosis.
This finding is consistent with studies identifying the SAA1.1 isoform as the predominant variant in amyloid deposits across multiple inflammatory conditions. The polymorphism’s unique sequence features, including specific residue substitutions, enhance its susceptibility to degradation and amyloid fibril formation, distinguishing it from other SAA1 isoforms.
This study represents a significant advancement in understanding the molecular mechanisms underlying alkaptonuria (AKU) and related amyloid diseases, highlighting the potential of computational approaches to inform biomarker discovery and therapeutic development. By focusing on structural and dynamic differences between SAA1 protein variants derived from AKU patients, this work bridges fundamental molecular biology with translational medicine. The findings emphasize how single-residue variations can drastically influence protein stability, offering deep insights into the molecular underpinnings of disease progression. The study’s implications for alkaptonuria (AKU) are significant, as AKU is a rare disorder marked by homogentisic acid accumulation, tissue degeneration, and amyloidosis. Identifying SAA1.1 as a destabilizing variant provides a novel biomarker for predicting disease severity, enabling the early diagnosis of secondary amyloidosis and assessment of progression. This insight offers a transformative approach to AKU management, guiding personalized interventions, such as monoclonal antibodies like tocilizumab [
15]. The data presented here support the role of SAA1.1 as a novel biomarker for AKU. Our findings provide strong mechanistic insights into how the destabilizing nature of SAA1.1 contributes to disease progression, laying the groundwork for potential therapeutic interventions. However, linking allelic variants to disease progression supports precision medicine strategies tailored to individual molecular profiles. Beyond AKU, this work holds broader relevance for amyloid-related diseases, where protein misfolding and aggregation drive pathology.
This integrative methodology not only emphasizes the power of combining clinomics with MD simulations but also addresses a critical gap in AKU research by linking allelic variants to specific molecular mechanisms of disease progression. Its relevance extends beyond AKU, providing a paradigm for using computational tools to transform our understanding and treatment of protein misfolding diseases. The study’s impact is poised to resonate across scientific and medical communities, enhancing our ability to understand and treat the profound impact that even single-point allelic variations exert on protein structure, stability, and their critical role in the progression of diseases. By establishing these allelic differences as biomarkers to disease progression, our work underscores the importance of genetic profiling in understanding and managing complex diseases.
In summary, while ochronotic pigment deposits within connective tissues undoubtedly trigger a pro-inflammatory response and elevate SAA levels as part of the acute-phase reaction, the presence of the SAA1.1 allele in a homozygous state significantly amplifies this effect. The allele-specific structural instability of SAA1.1 accelerates amyloidogenic processes, driving a more rapid and severe inflammatory progression in affected individuals. This underscores the importance of genotypic screening for SAA1.1 as a predictive biomarker for inflammation severity and amyloid-related complications in AKU and other chronic inflammatory diseases. Future therapeutic strategies targeting the stabilization of SAA1.1 or its amyloidogenic intermediates may hold promise for mitigating disease progression.


 ,
, 
