
In Silico Study of Camptothecin-Based Pro-Drugs Binding to Human Carboxylesterase 2
 , , , and
Abstract
1. Introduction
2. Materials and Methods
2.1. Ligands in Water
2.2. Protein Model
2.3. Modelling of Protein–Ligand Complexes by Docking
2.4. Molecular Dynamics Simulations of the Protein–Ligand Complexes
2.5. Analysis of Molecular Dynamics Simulation Data
3. Results
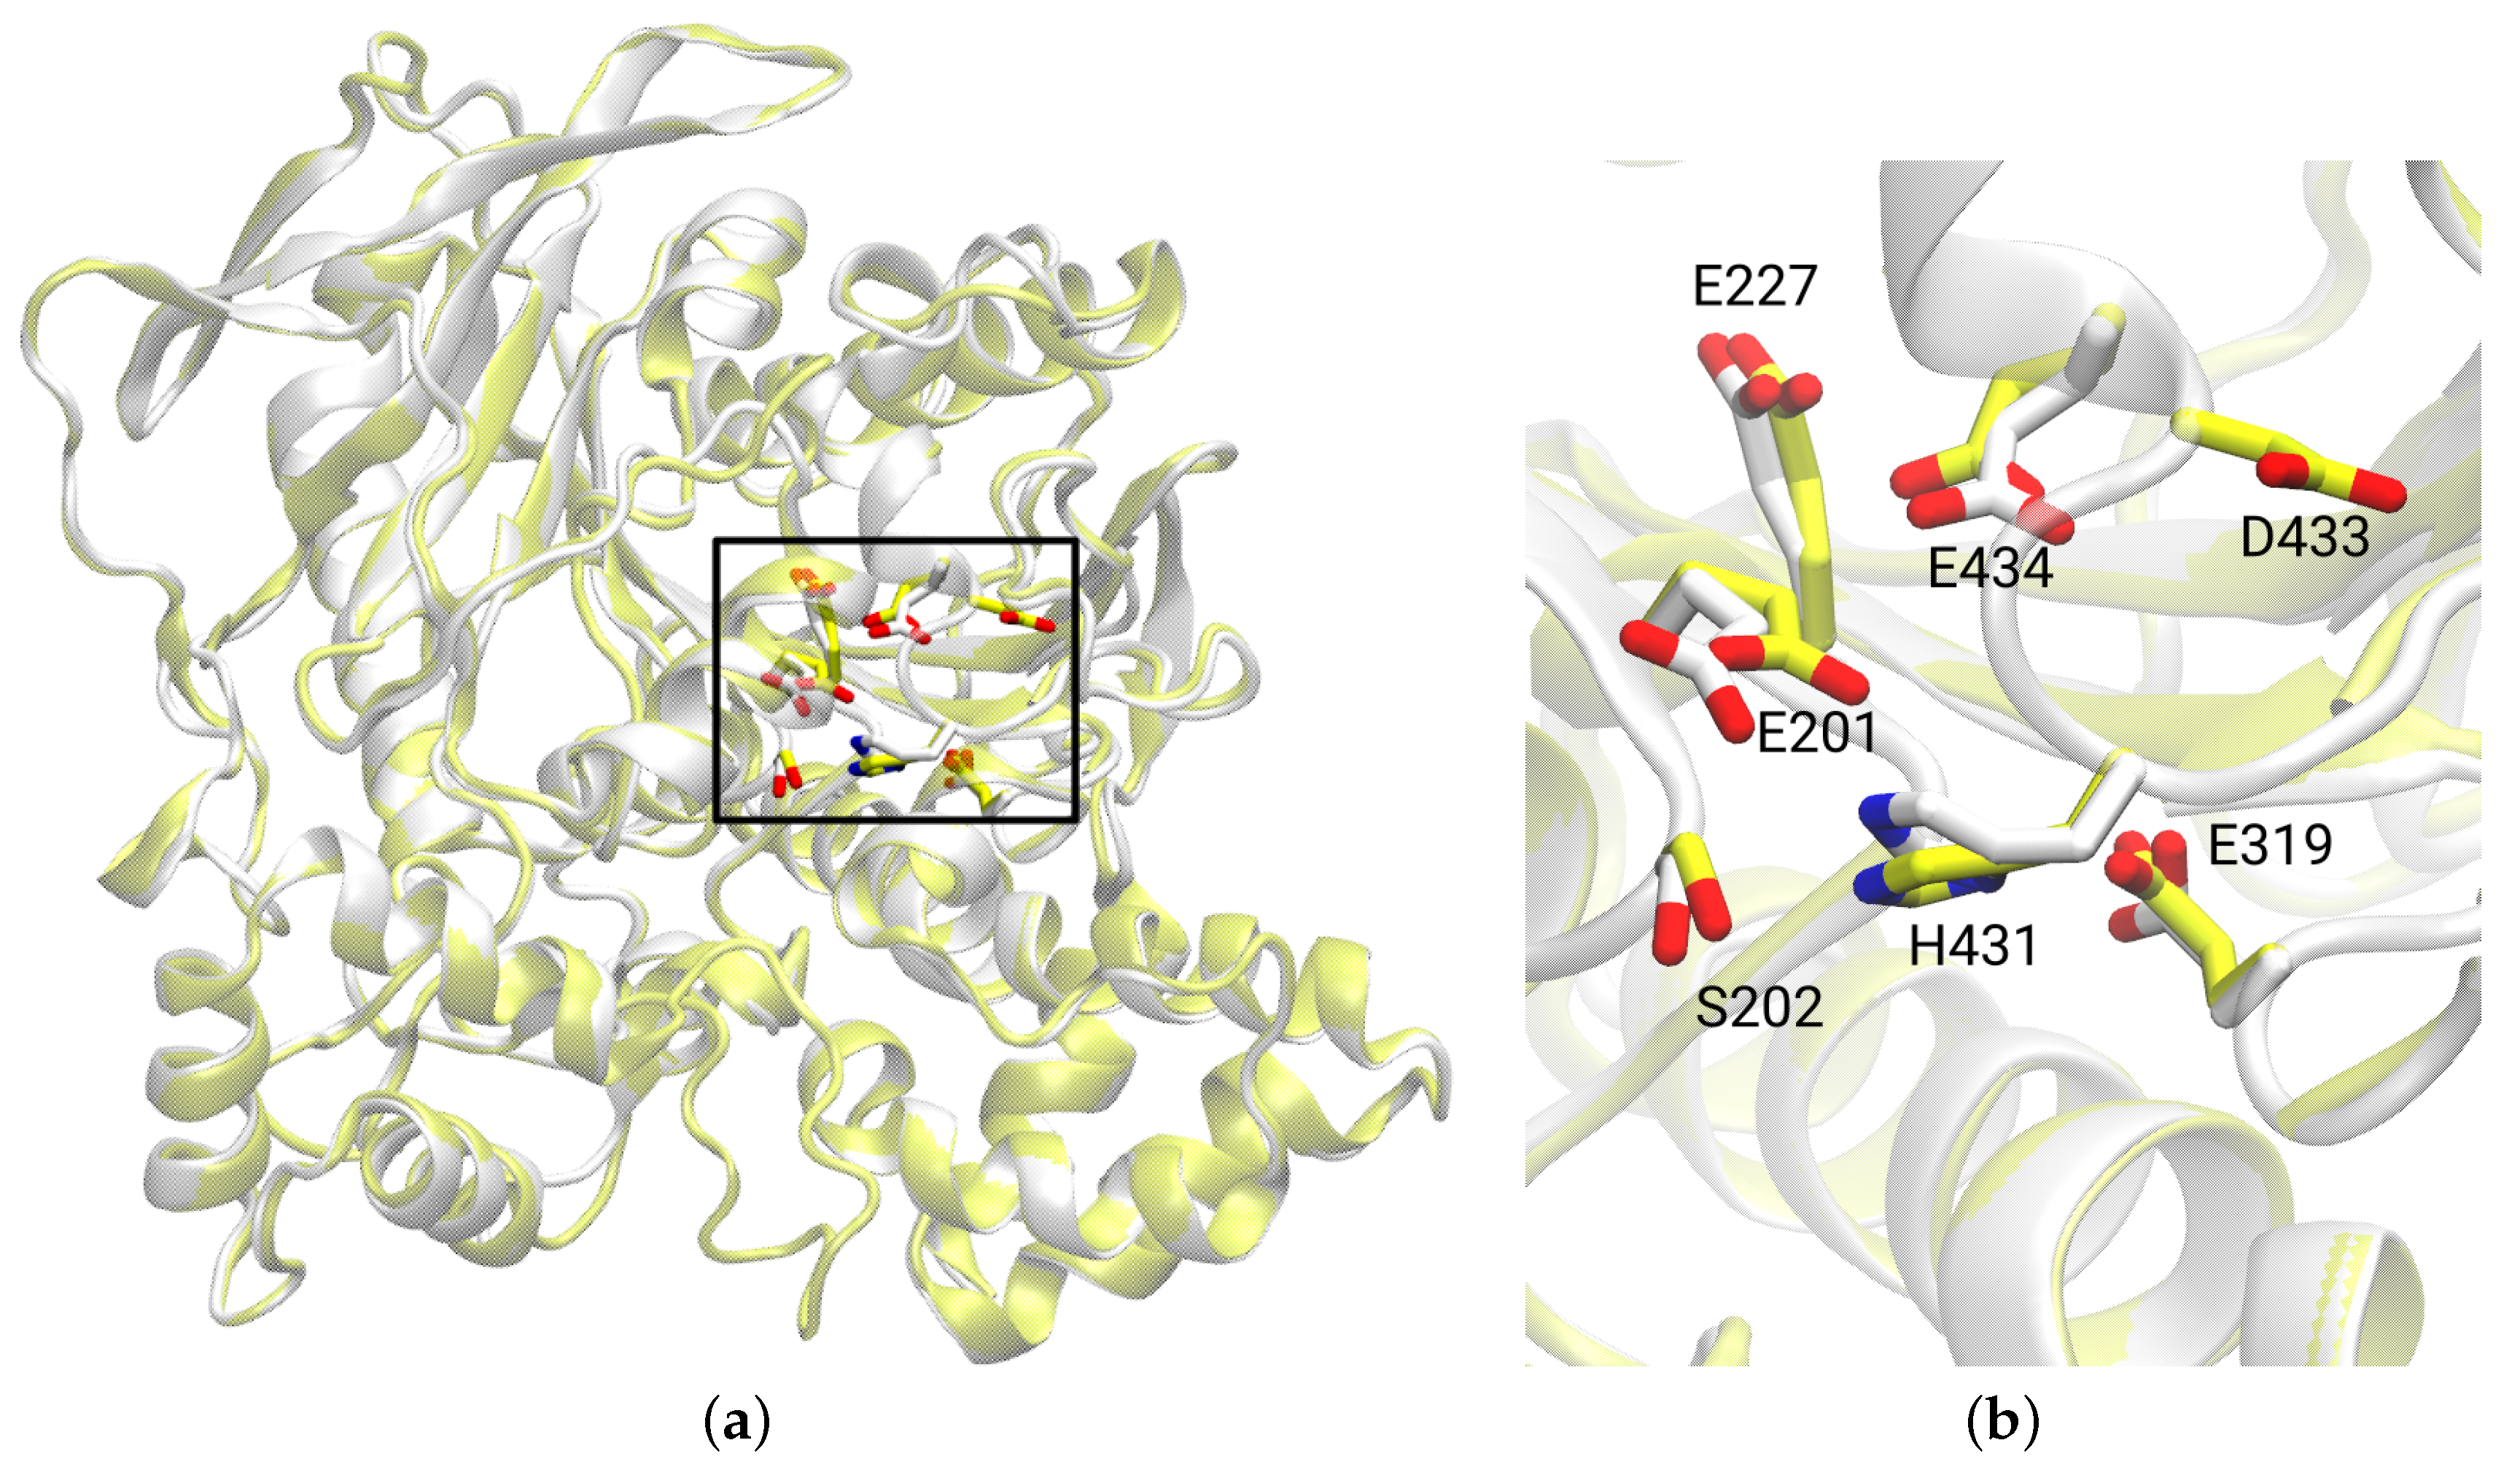
3.1. Protein Model
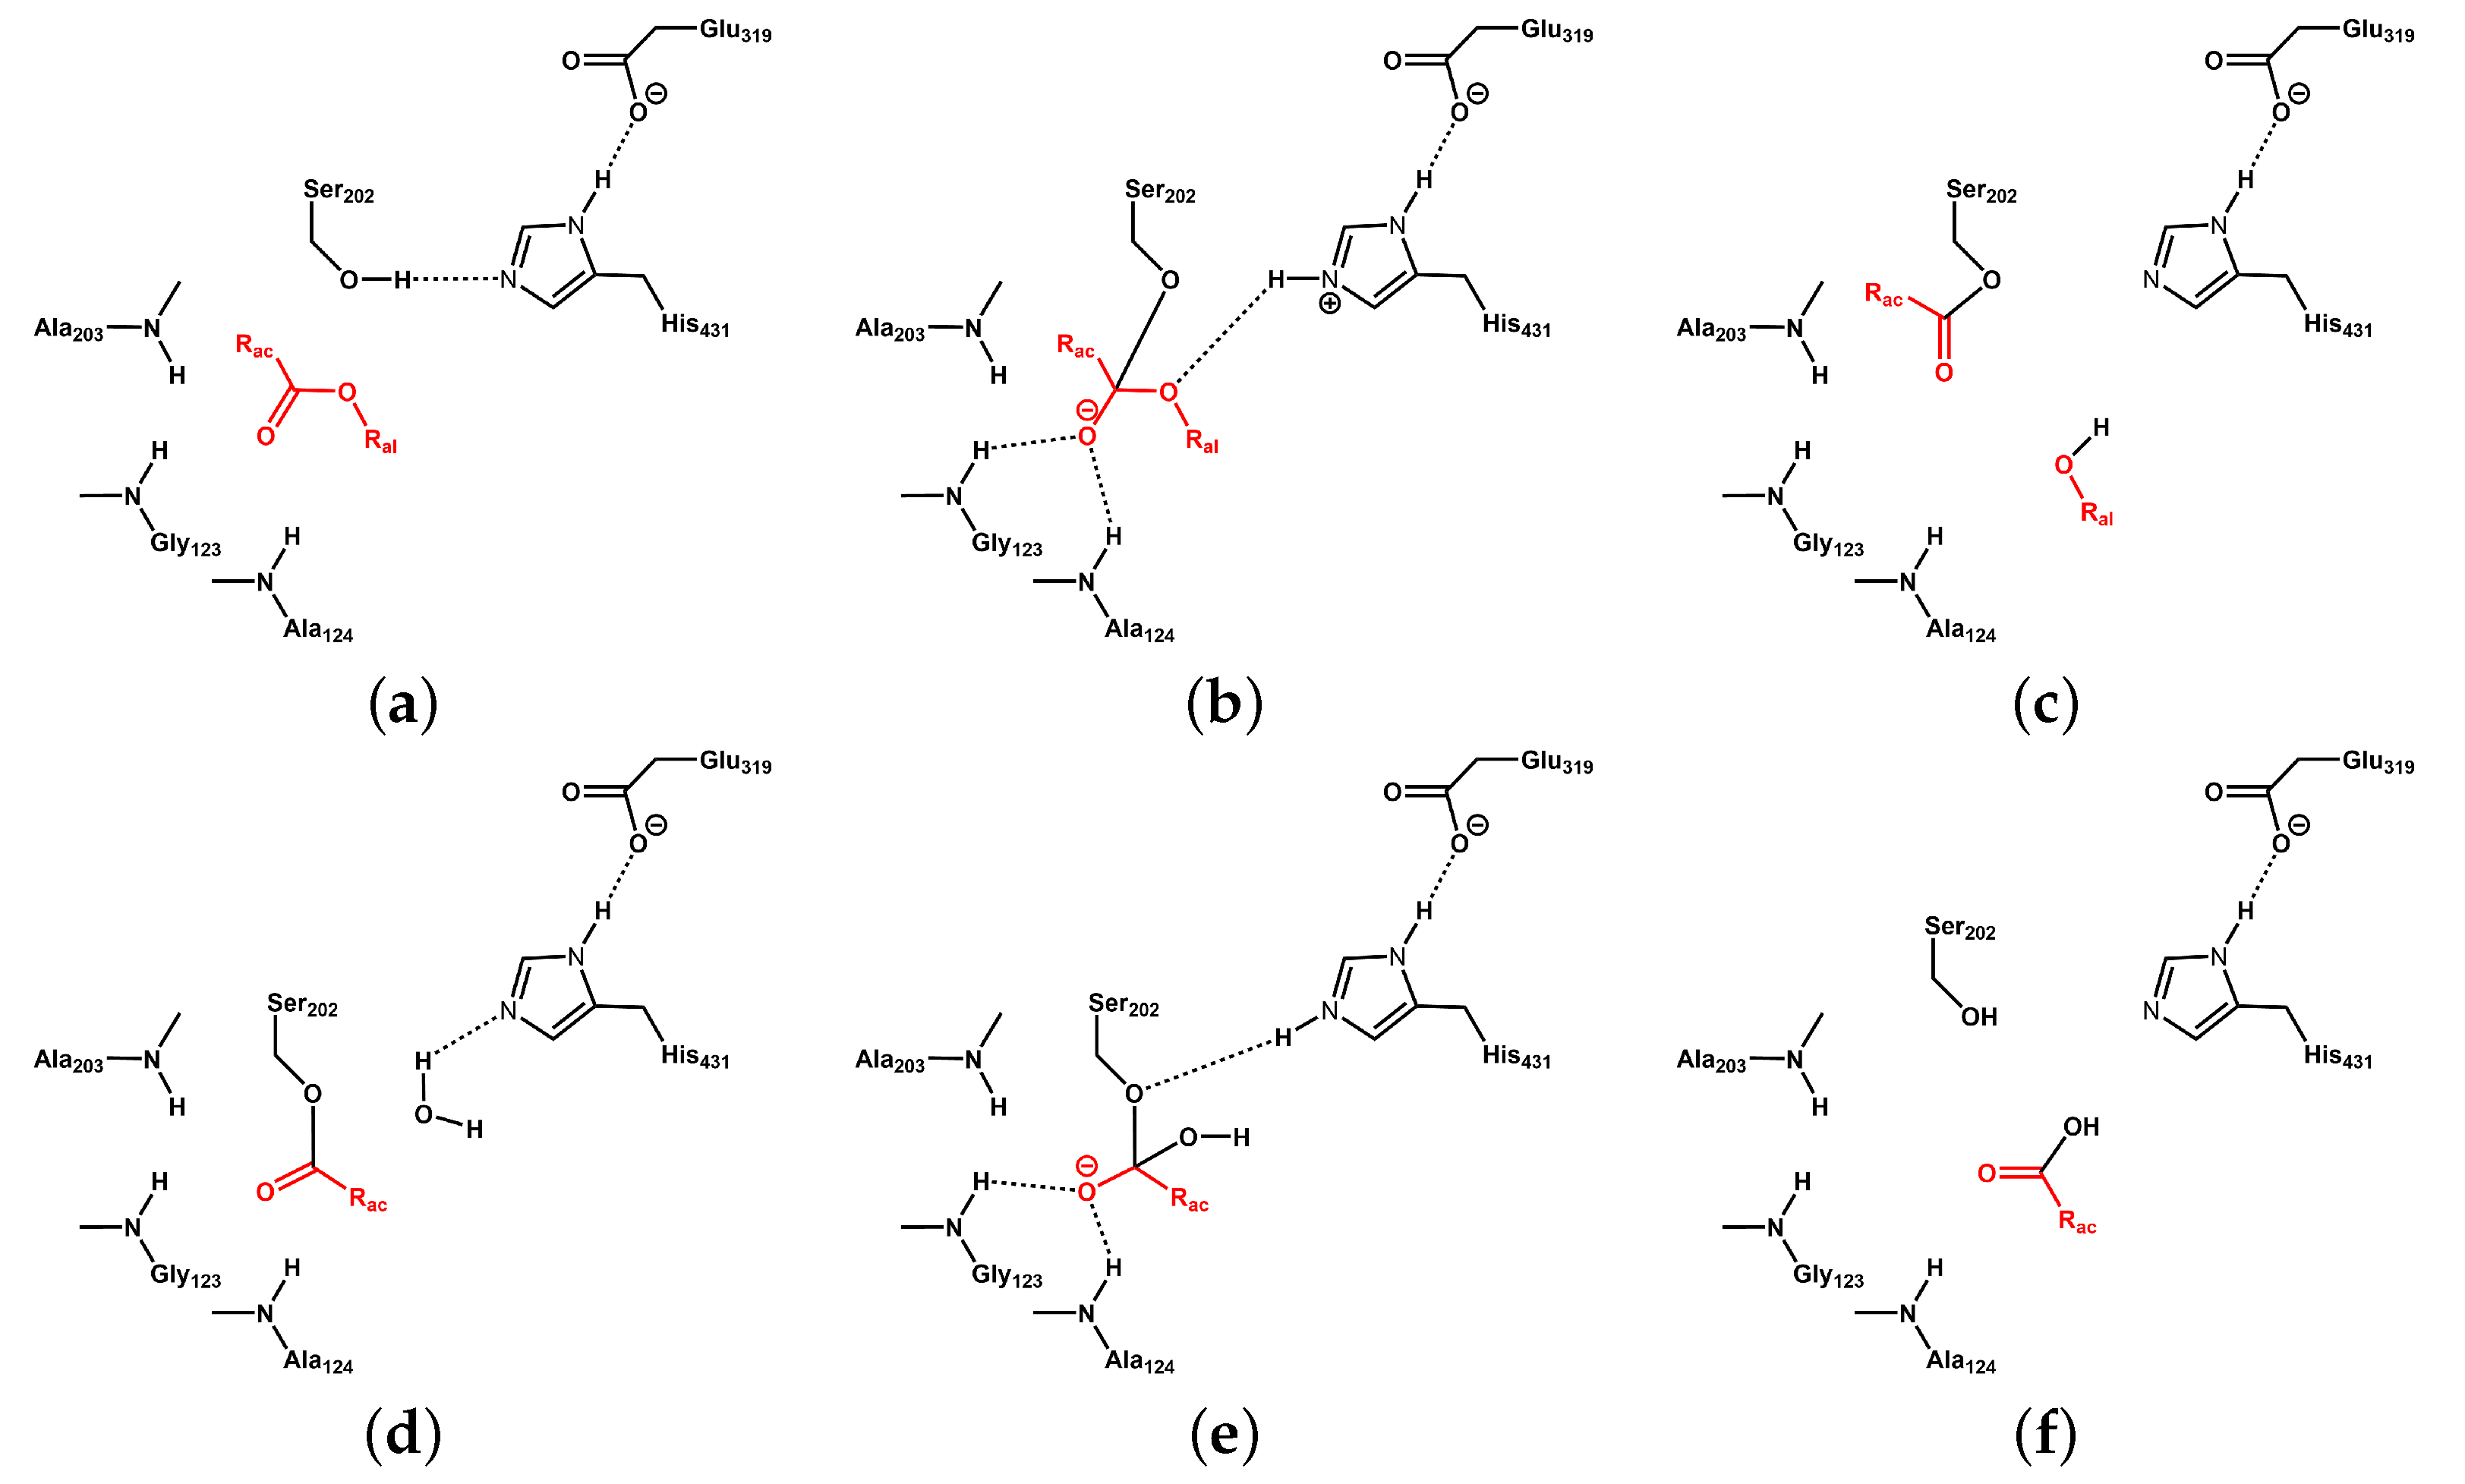
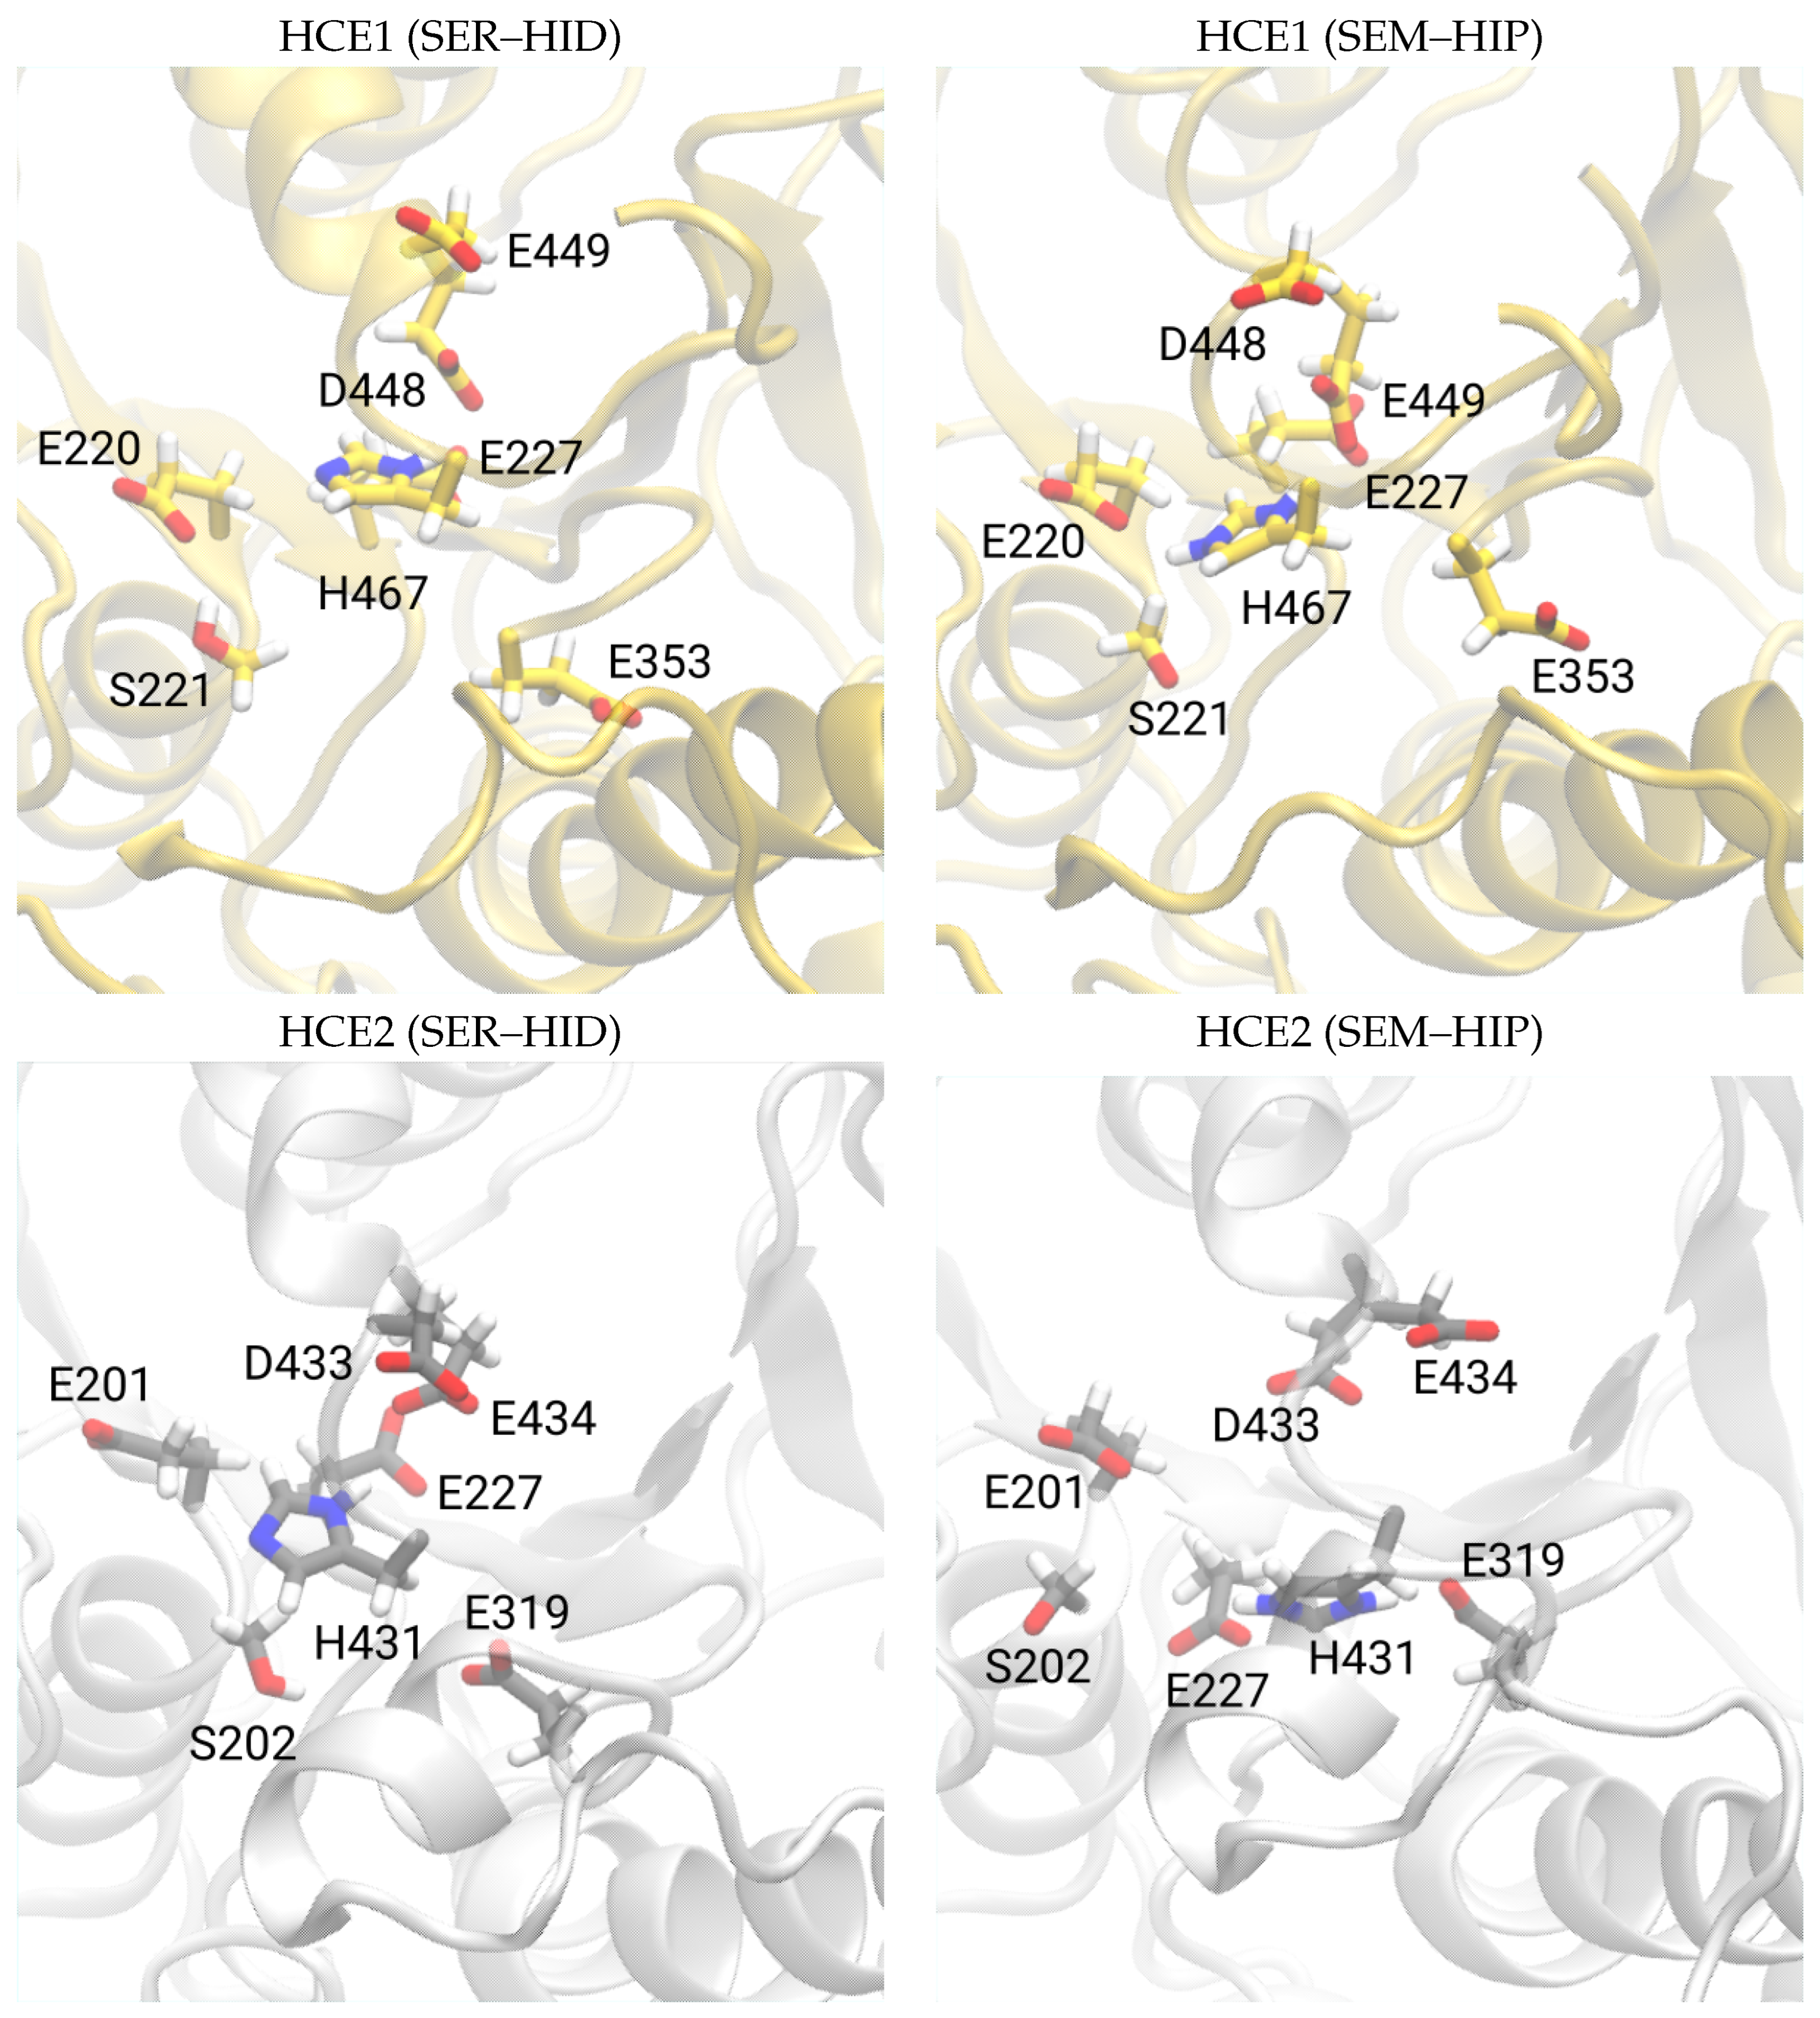
3.2. Catalytic Triad of Protein–Ligand Complexes
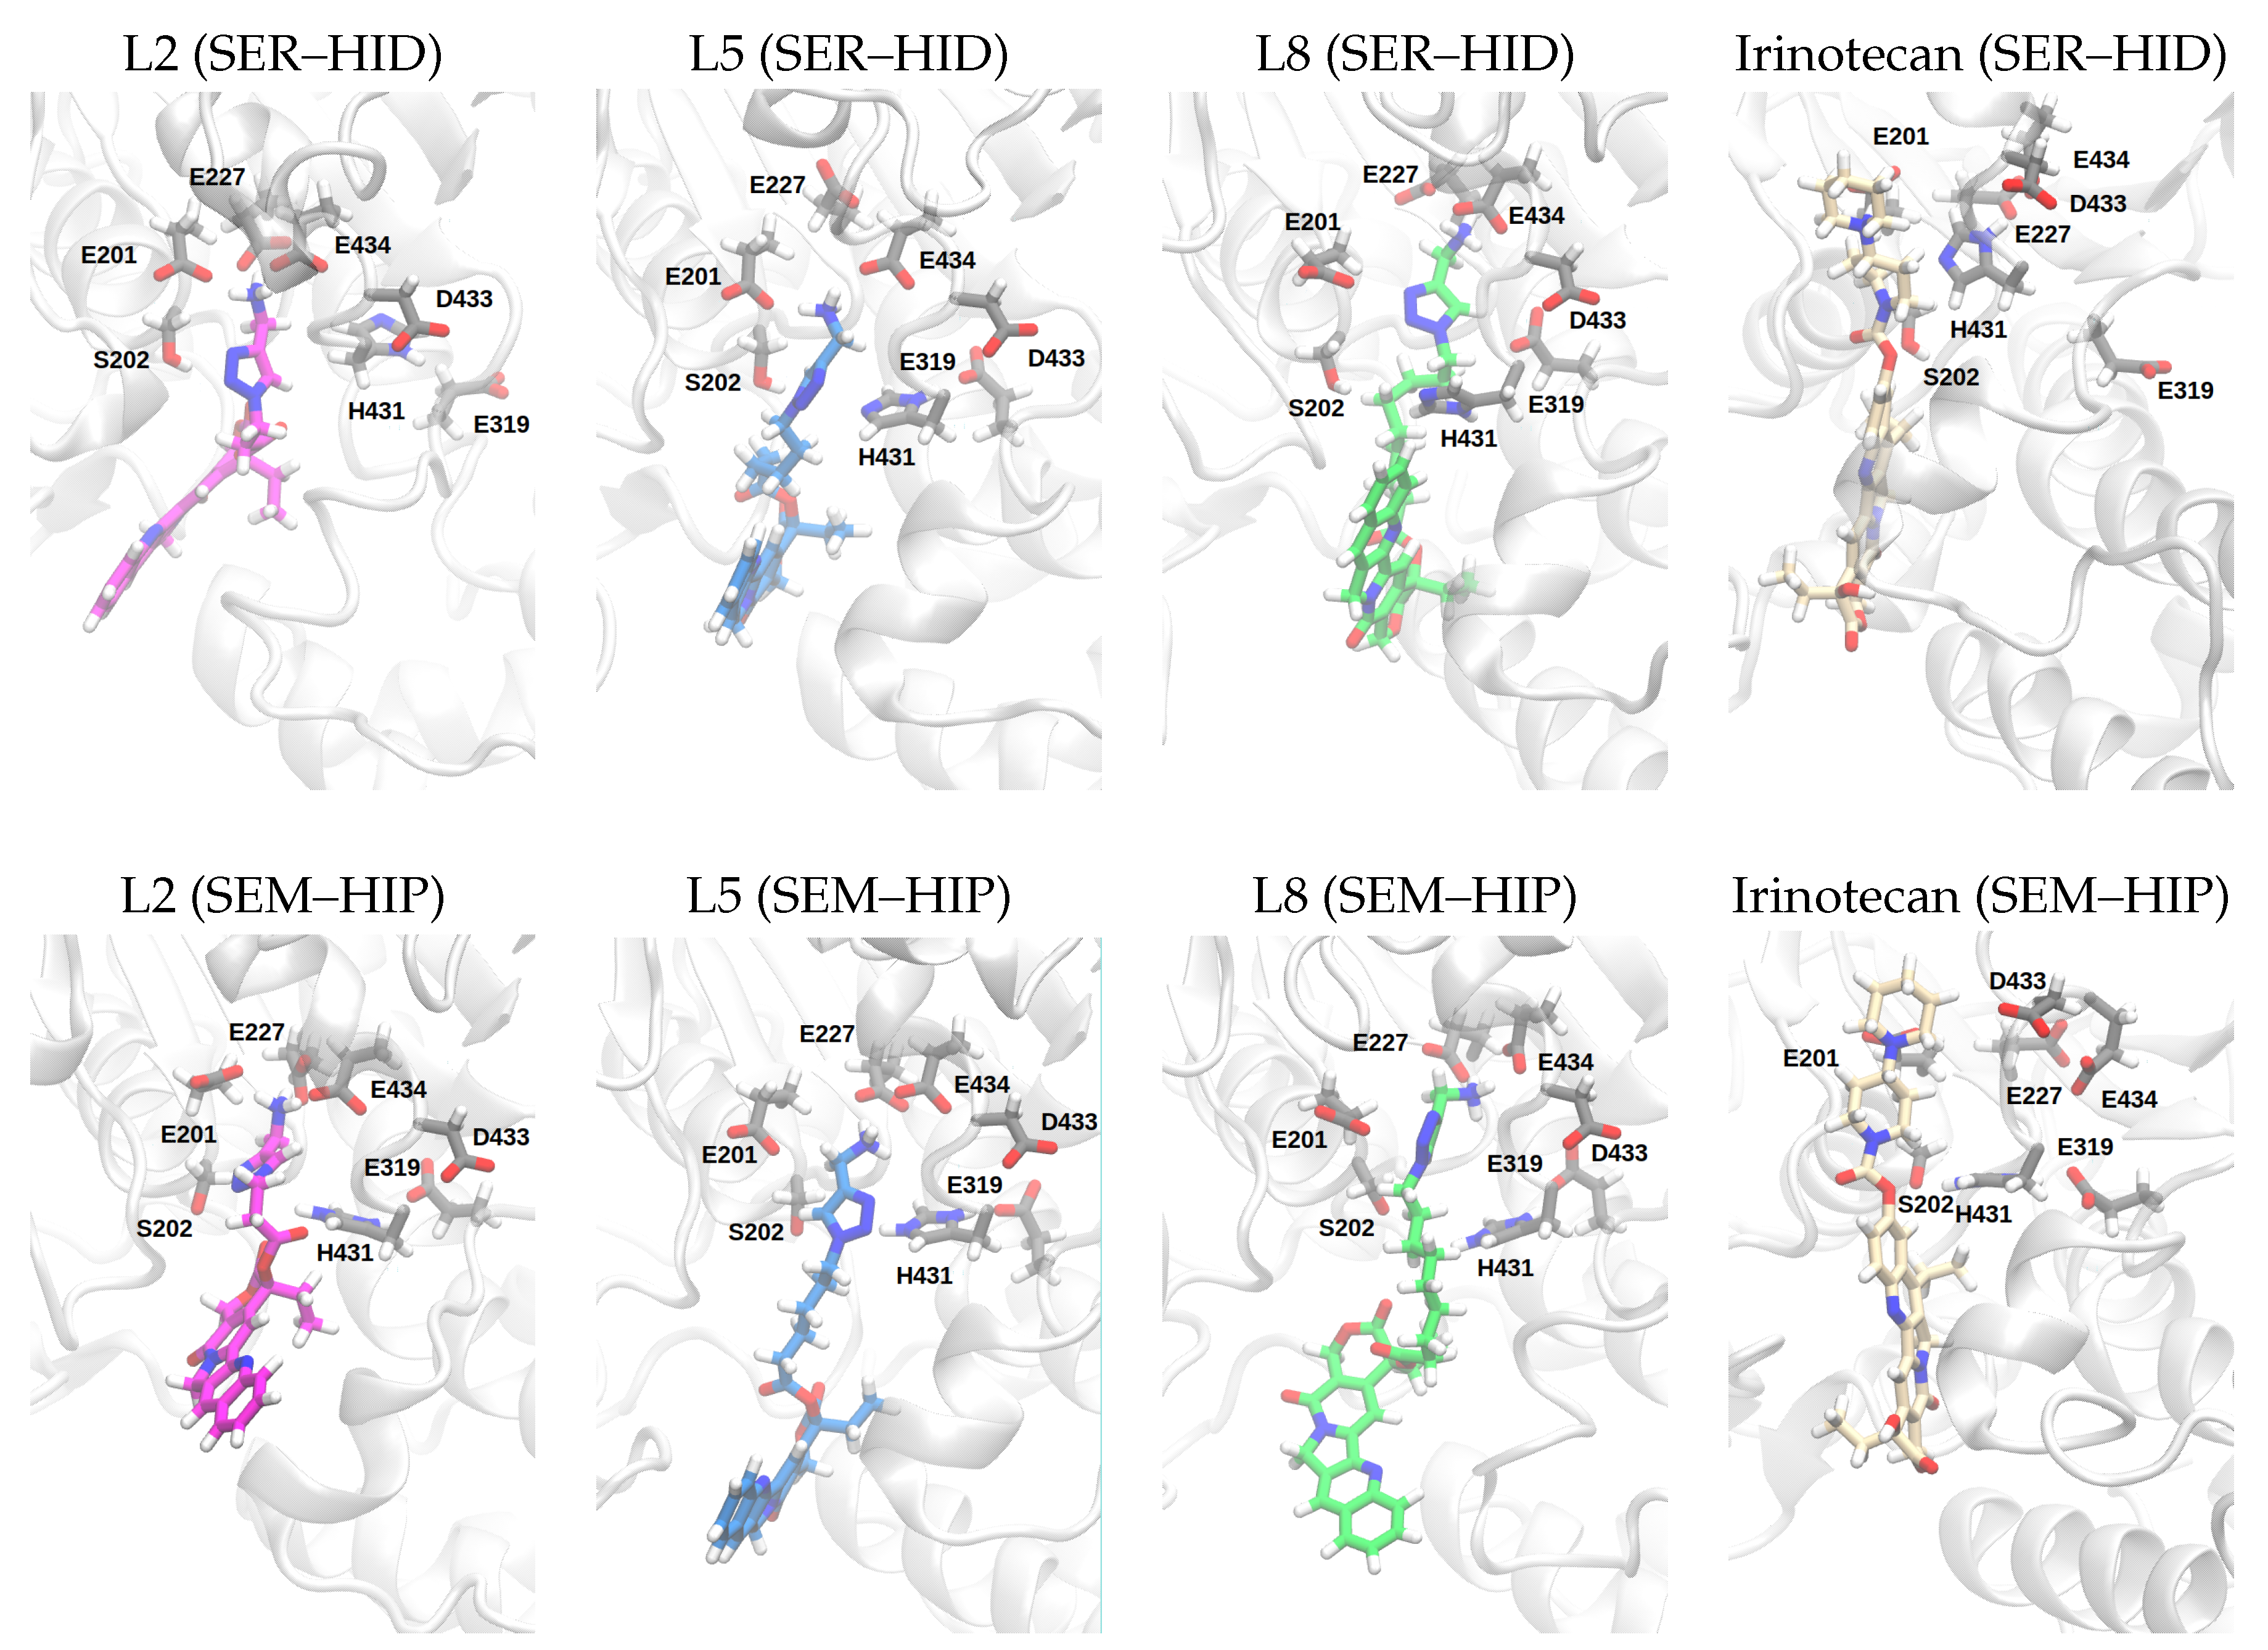
3.3. Ligand Poses and Conformations
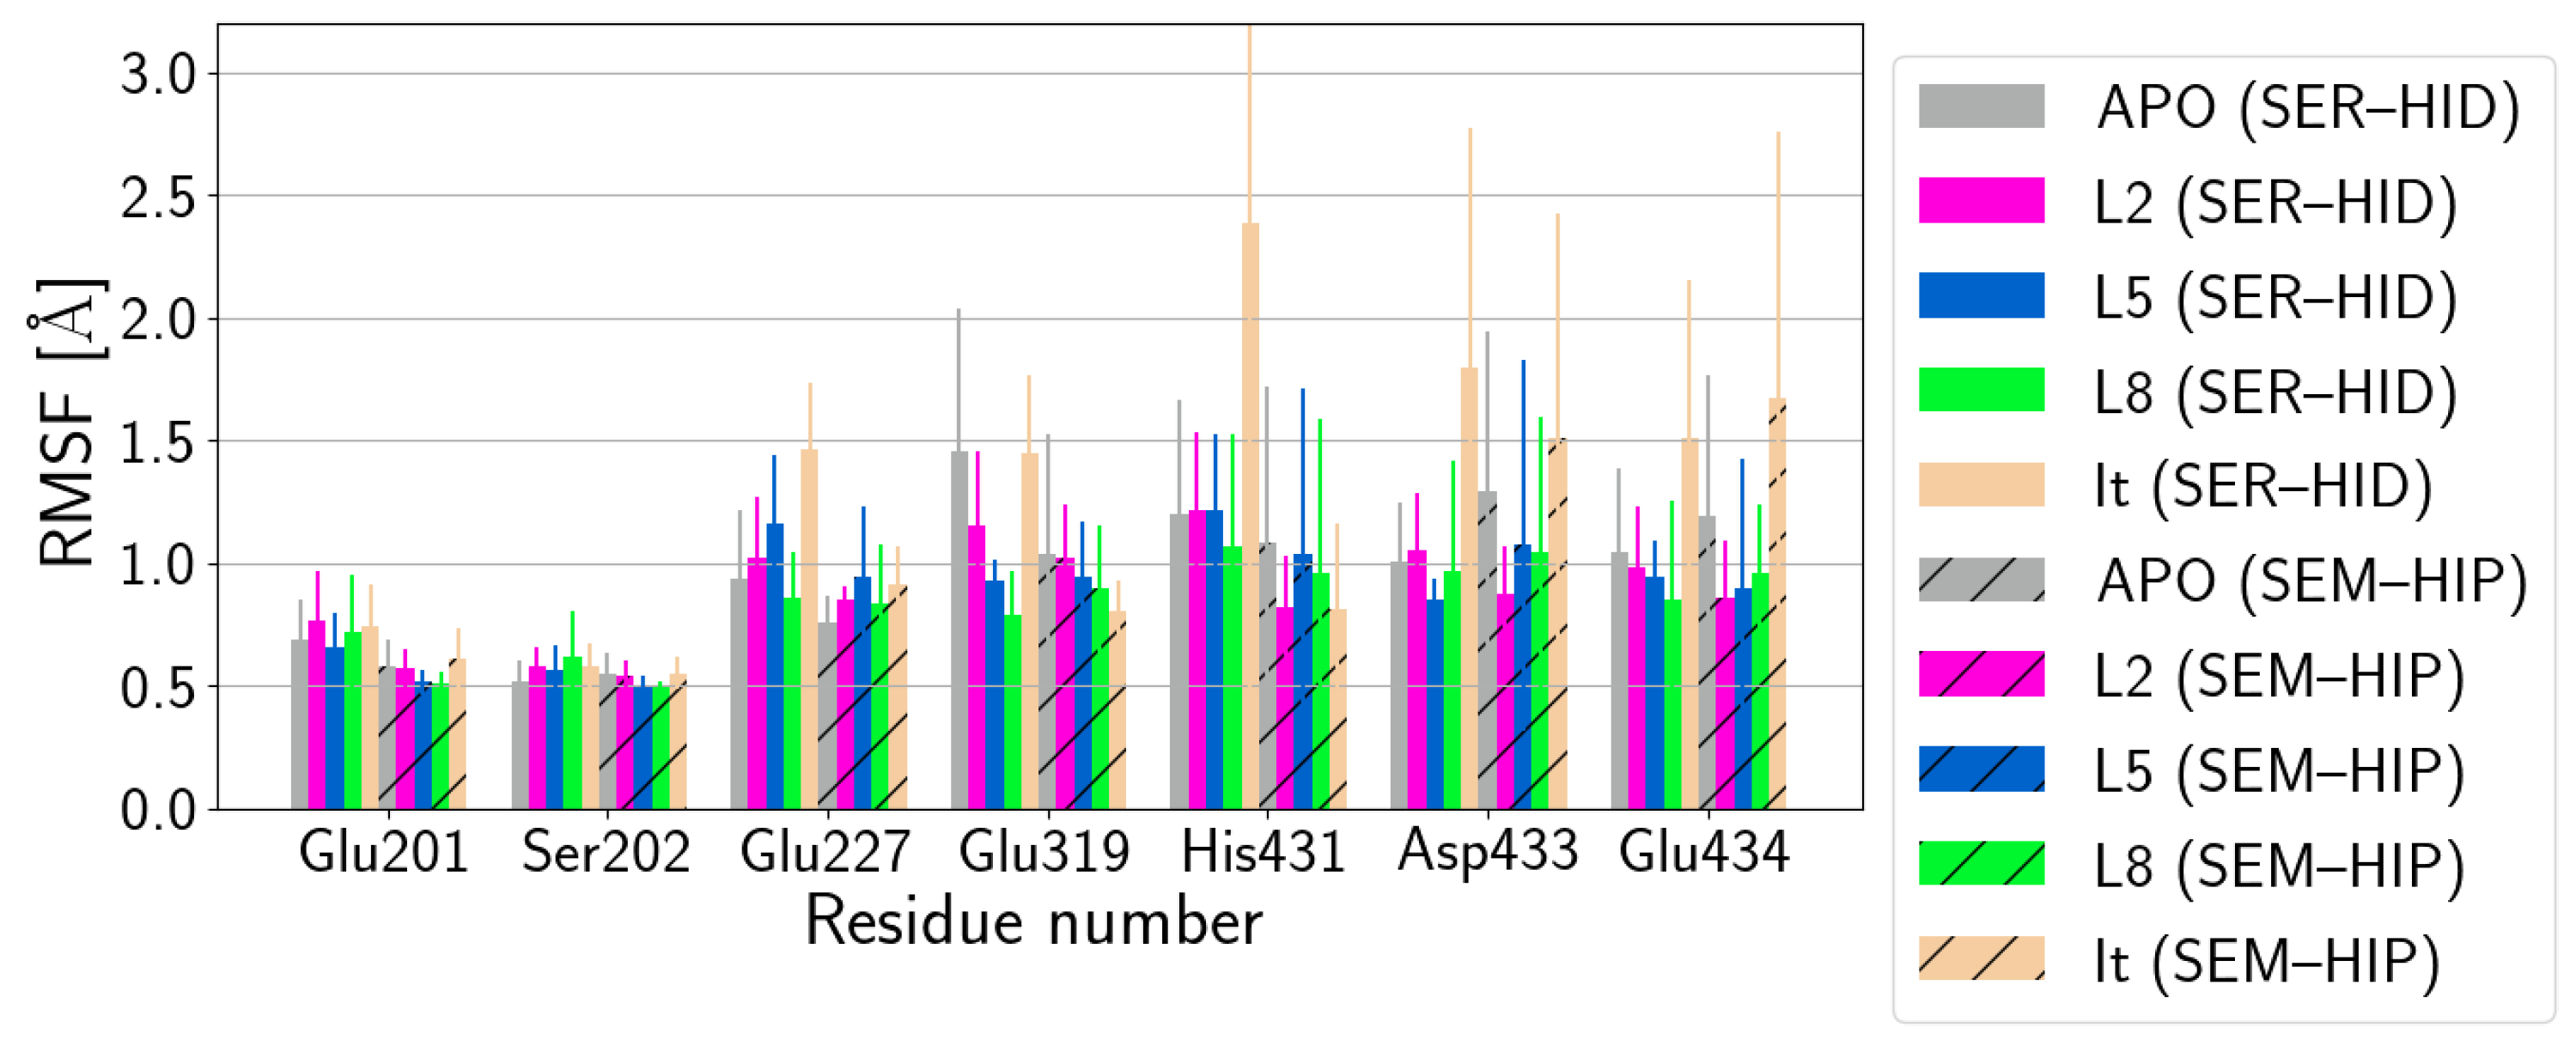
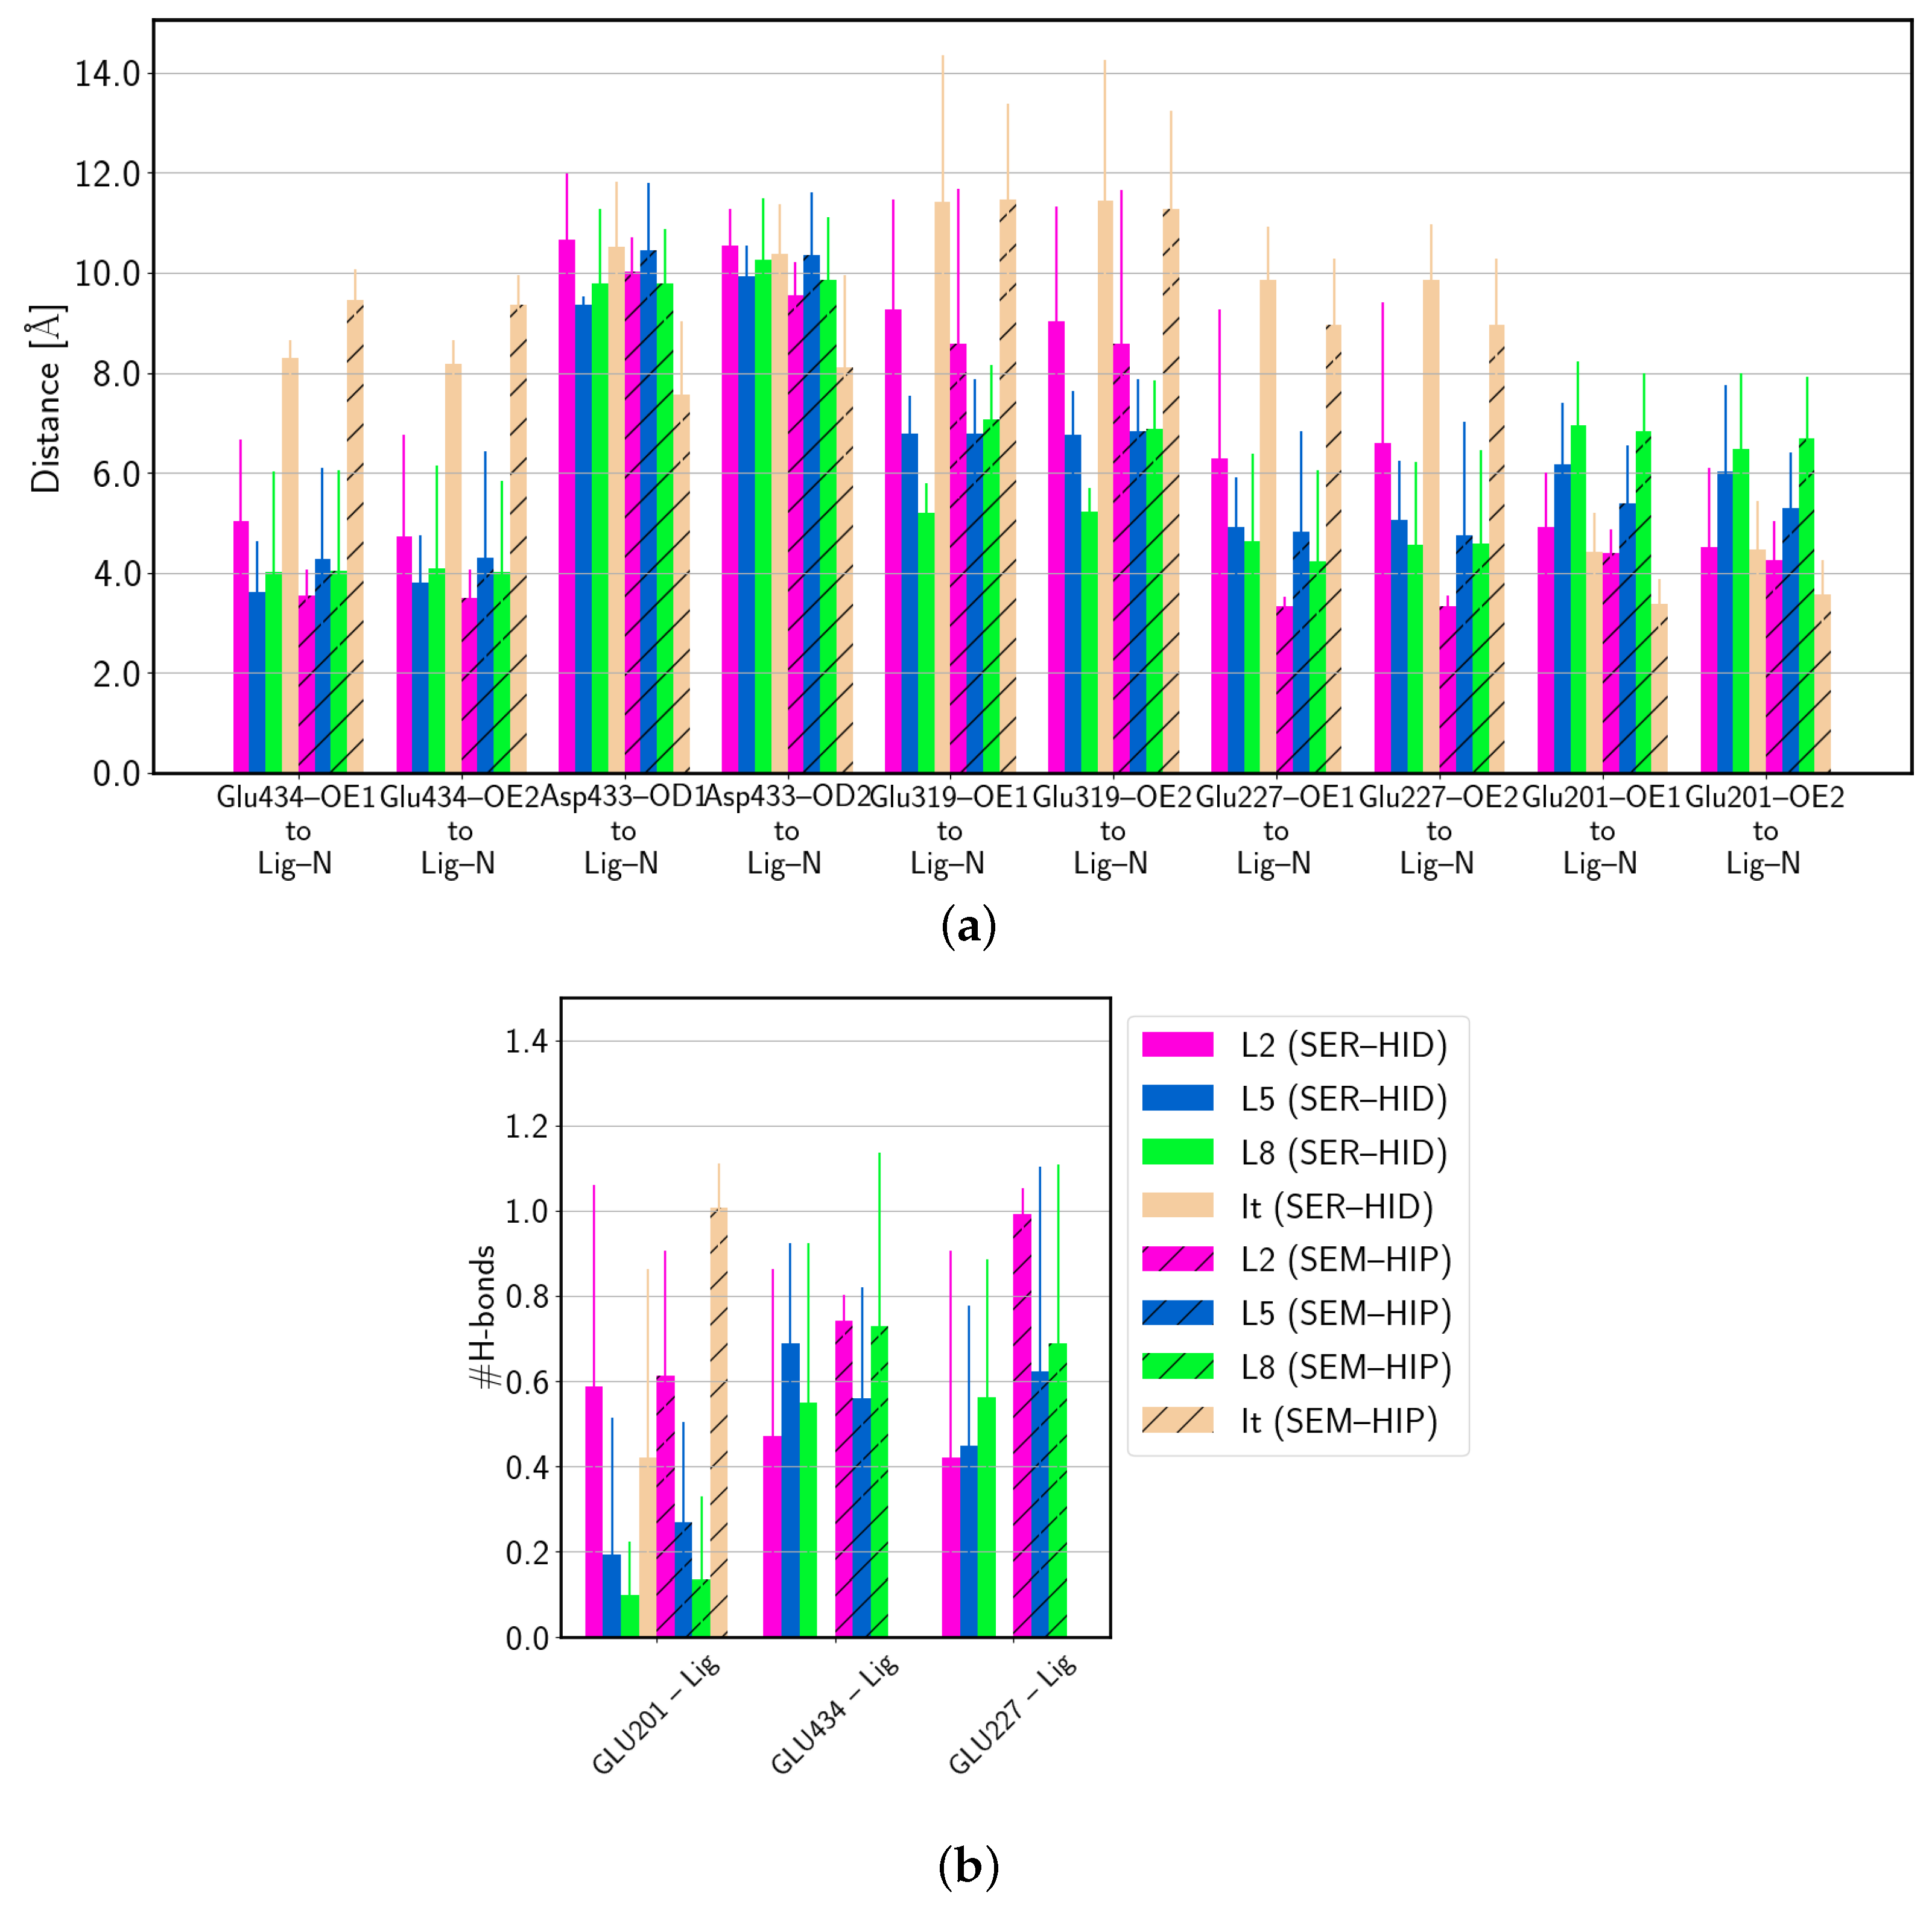
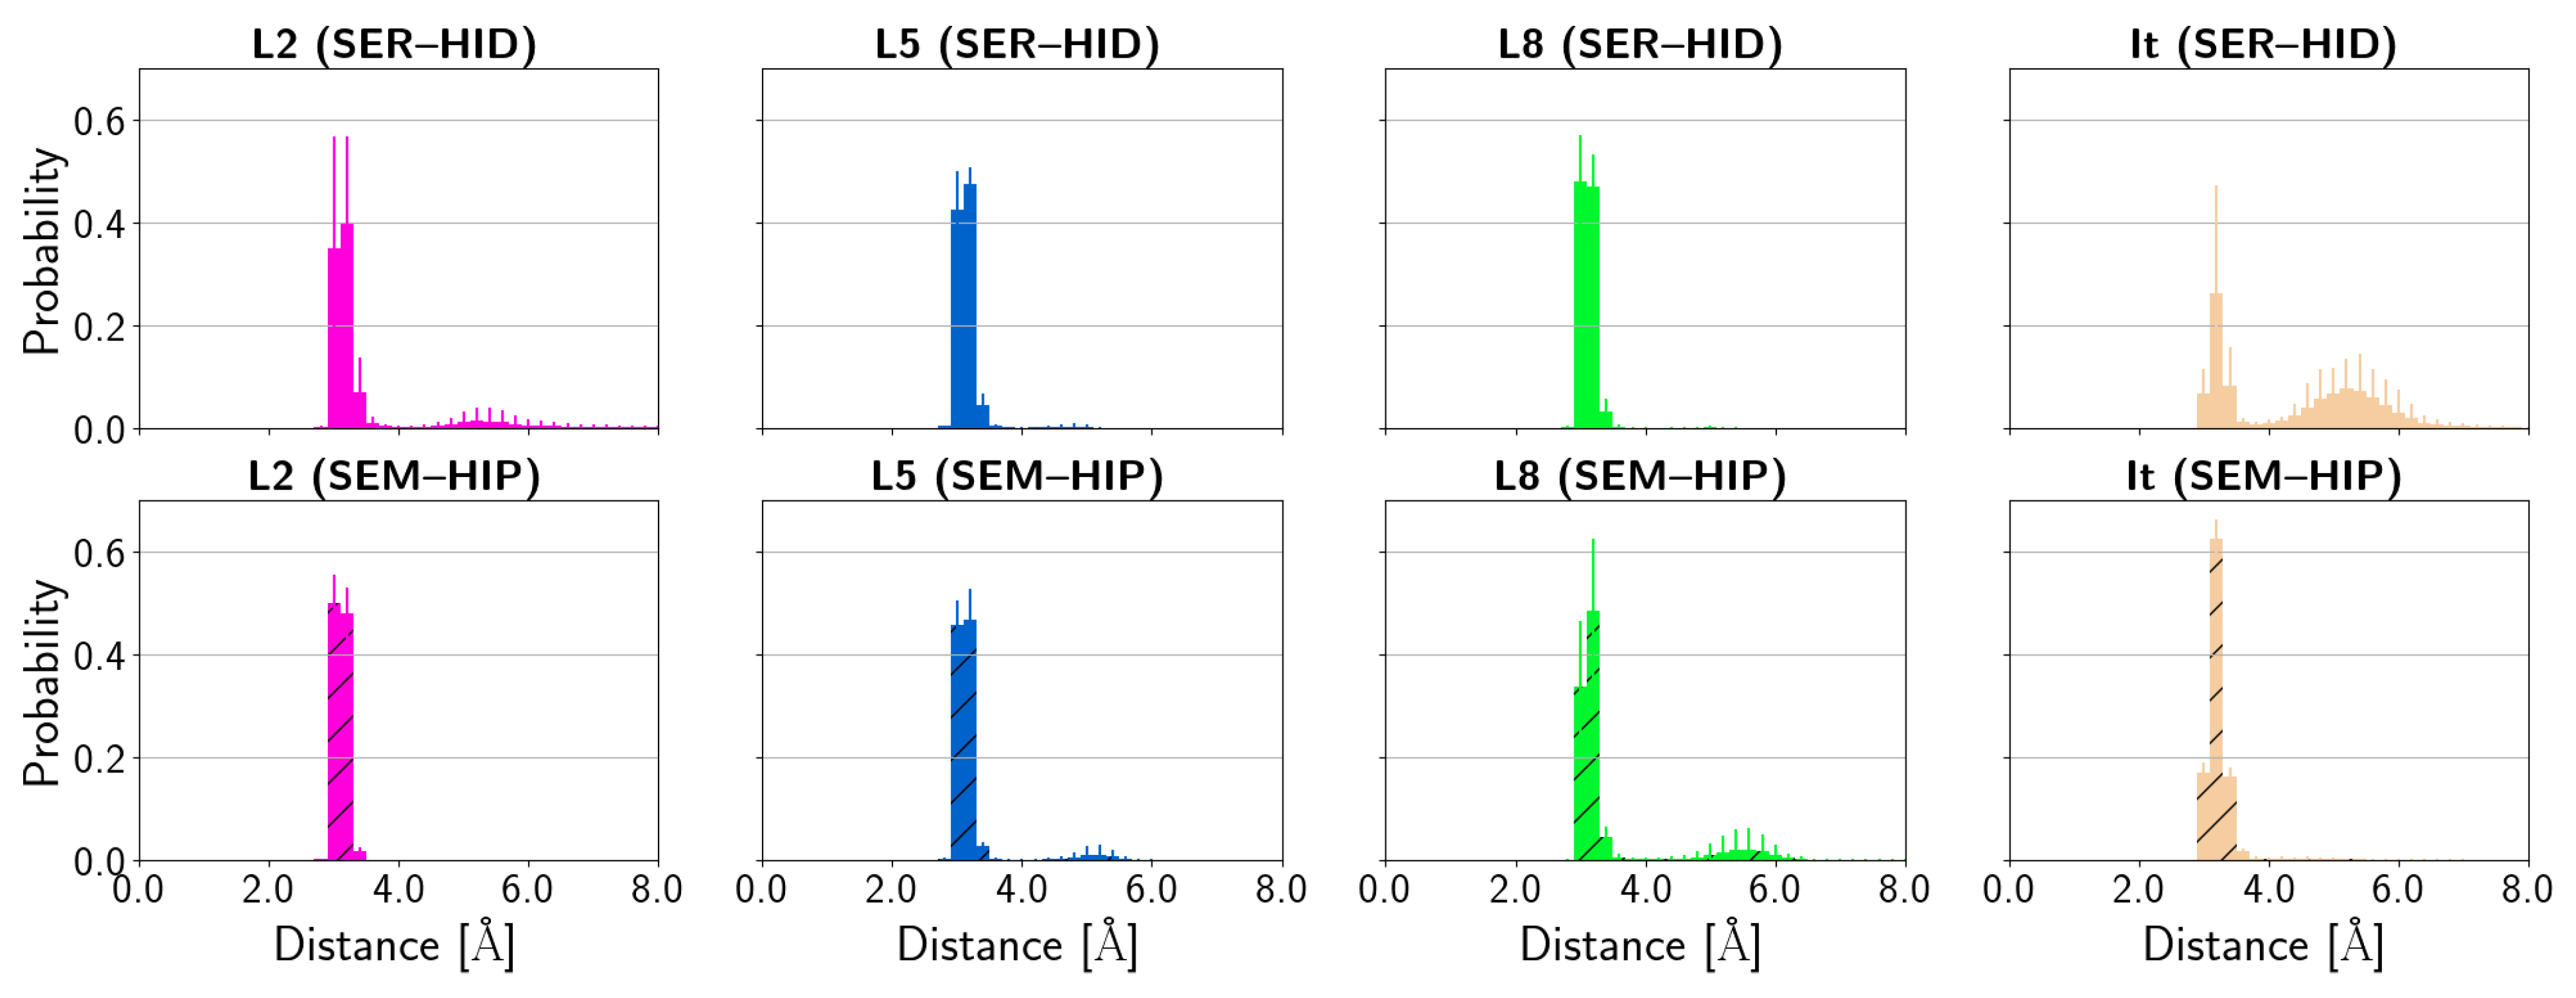
3.4. Protein–Ligand Interactions
4. Discussion
5. Conclusions
Supplementary Materials
Author Contributions
Funding
Institutional Review Board Statement
Informed Consent Statement
Data Availability Statement
Acknowledgments
Conflicts of Interest
Abbreviations
| HCE1 | Human carboxylesterase 1 |
| HCE2 | Human carboxylesterase 2 |
| MD | Molecular dynamics |
| PDB | Protein data bank |
| NMR | Nuclear magnetic resonance |
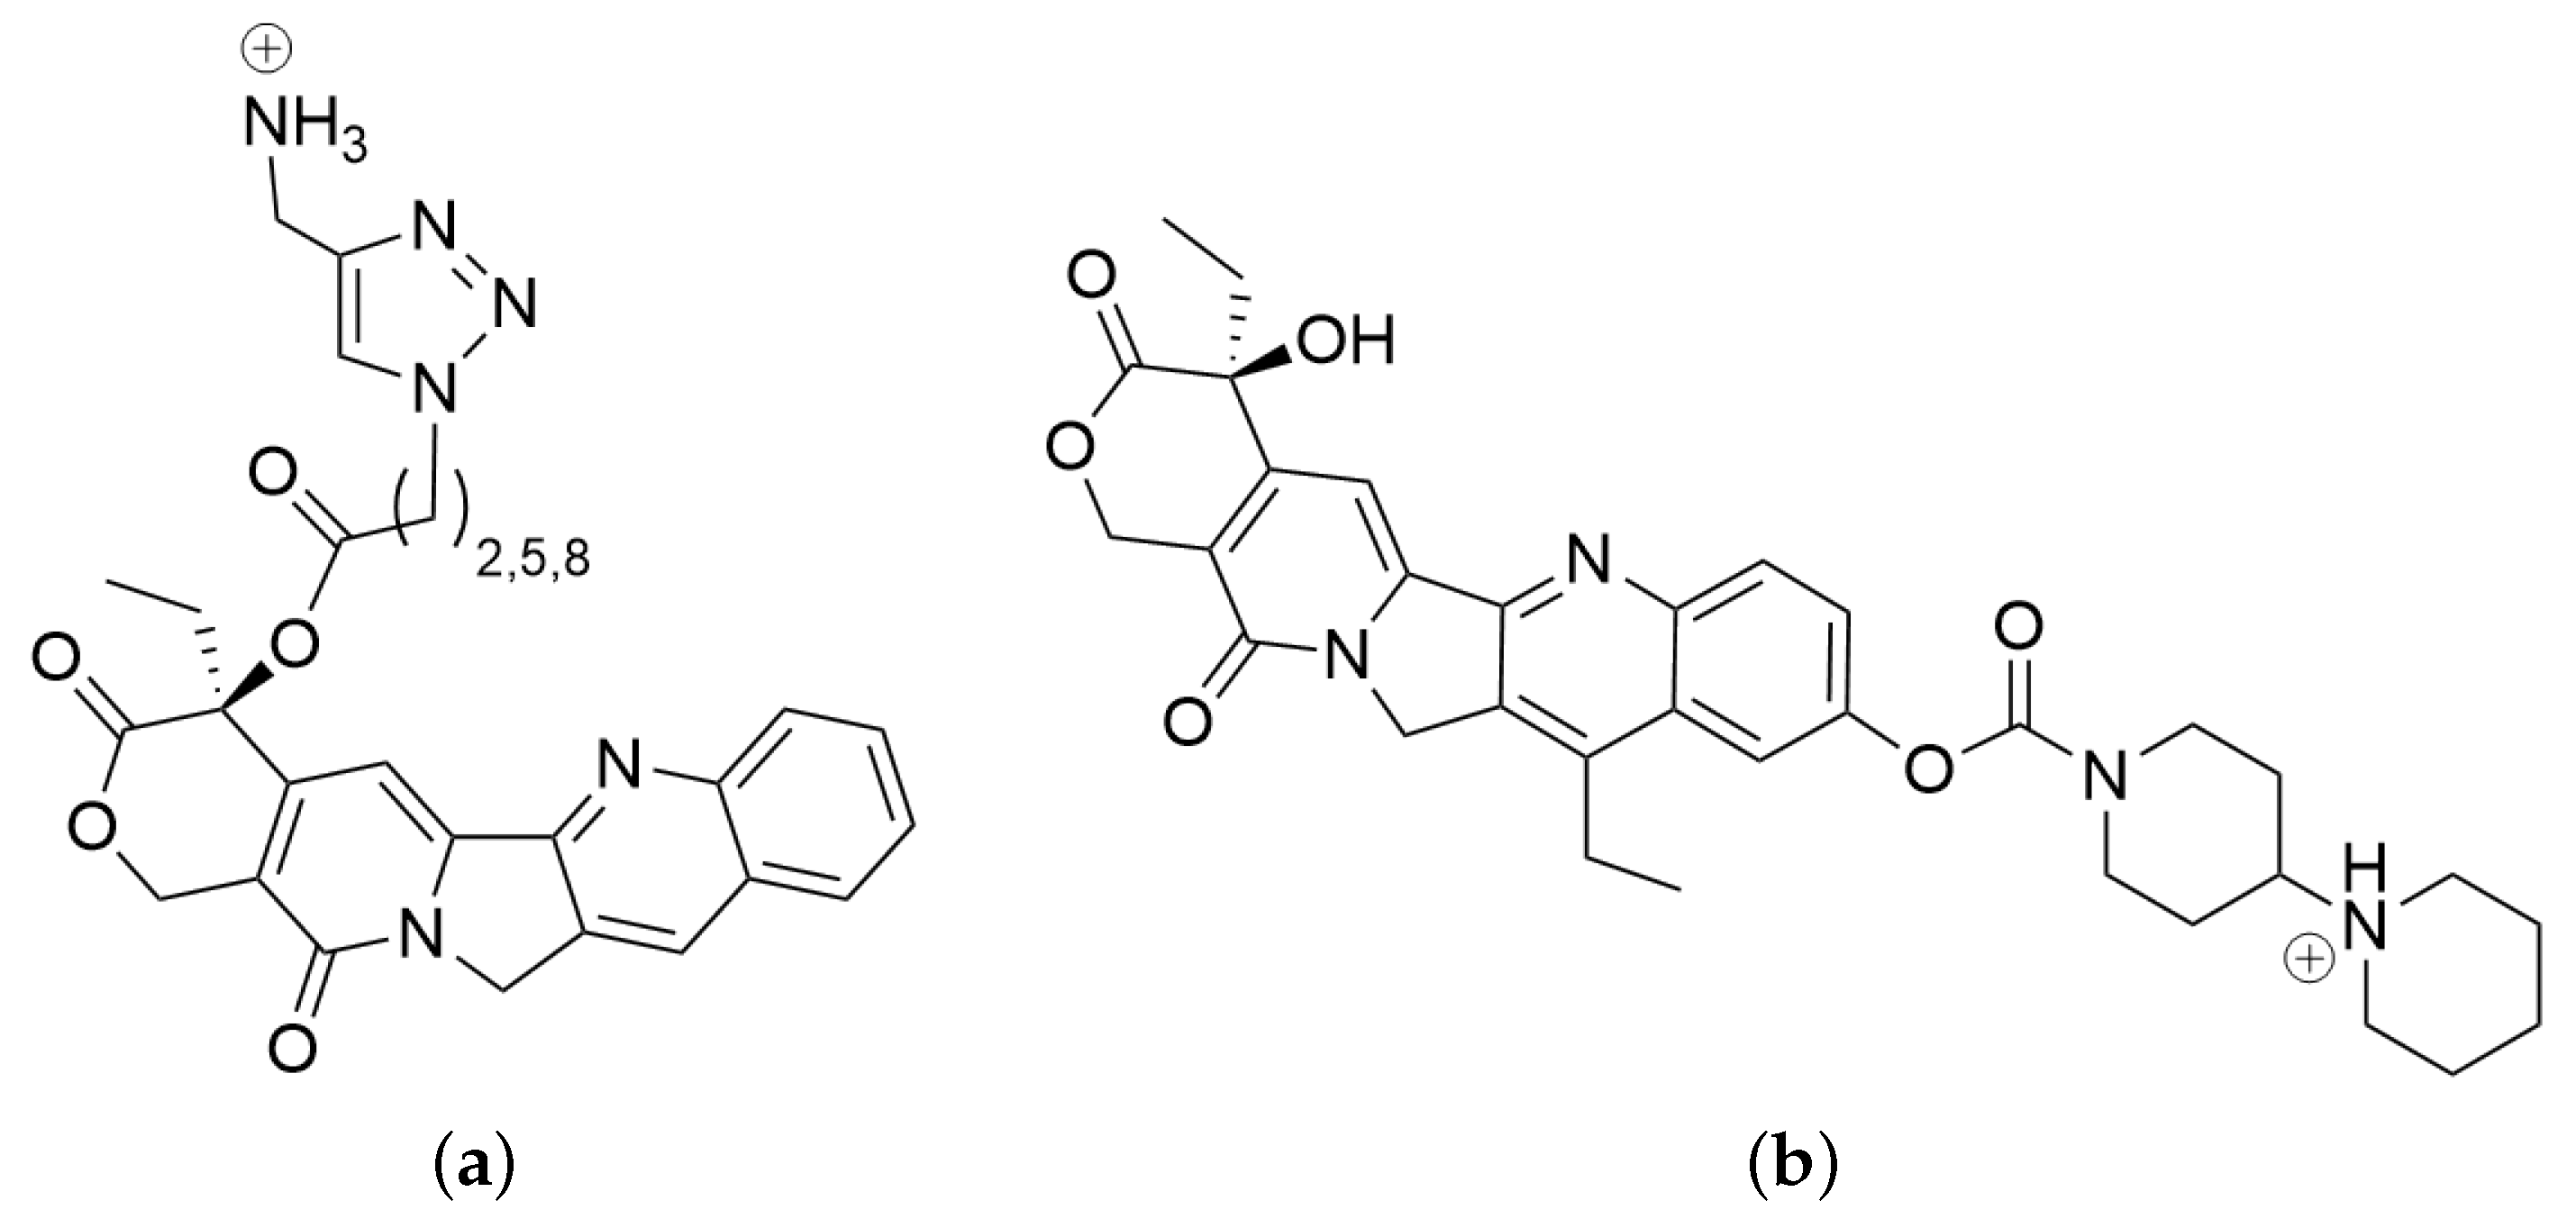
| It | Irinotecan |
| CPT | Camptothecin |
| L2 | Pro-drug ligand with alkyl linker length 2 |
| L5 | Pro-drug ligand with alkyl linker length 5 |
| L8 | Pro-drug ligand with alkyl linker length 8 |
| RMSF | Root mean square fluctuation |
| RMSD | Root mean square deviation |
| SER–HID | Model with neutral serine and histidine in the catalytic triad |
| SEM–HIP | Model with deprotonated serine and protonated histidine in the catalytic triad |
References
- Rautio, J.; Meanwell, N.A.; Di, L.; Hageman, M.J. The expanding role of prodrugs in contemporary drug design and development. Nat. Rev. Drug Discov. 2018, 17, 559–587. [Google Scholar] [CrossRef]
- Laizure, S.C.; Herring, V.; Hu, Z.; Witbrodt, K.; Parker, R.B. The Role of Human Carboxylesterases in Drug Metabolism: Have We Overlooked Their Importance? Pharmacother. J. Hum. Pharmacol. Drug Ther. 2013, 33, 210–222. [Google Scholar] [CrossRef]
- Figueiredo, P.R.; González, R.D.; Carvalho, A.T.P. Human Carboxylesterase 2 in Cocaine Metabolism. Mol. Cat. 2021, 515, 111938. [Google Scholar] [CrossRef]
- Hosokawa, M. Structure and Catalytic Properties of Carboxylesterase Isozymes Involved in Metabolic Activation of Prodrugs. Molecules 2008, 13, 412. [Google Scholar] [CrossRef]
- Klemt, I.; Reshetnikov, V.; Dutta, S.; Bila, G.; Bilyy, R.; Cuartero, I.C.; Hidalgo, A.; Wünsche, A.; Böhm, M.; Wondrak, M.; et al. A concept of dual-responsive prodrugs based on oligomerization-controlled reactivity of ester groups: An improvement of cancer cells versus neutrophils selectivity of camptothecin. RSC Med. Chem. 2023. [Google Scholar] [CrossRef]
- Senter, P.D.; Beam, K.S.; Mixan, B.; Wahl, A.F. Identification and Activities of Human Carboxylesterases for the Activation of CPT-11, a Clinically Approved Anticancer Drug. Bioconjugate Chem. 2001, 12, 1074–1080. [Google Scholar] [CrossRef]
- Imai, T.; Taketani, M.; Shii, M.; Hosokawa, M.; Chiba, K. Substrate Specificity of Carboxylesterase Isozymes and Their Contribution to Hydrolase Activity in Human Liver and Small Intestine. Drug Metab. Dispos. 2006, 34, 1734–1741. [Google Scholar] [CrossRef]
- Vistoli, G.; Pedretti, A.; Mazzolari, A.; Testa, B. Homology modeling and metabolism prediction of human carboxylesterase-2 using docking analyses by GriDock: A parallelized tool based on AutoDock 4.0. J. Comput. Aid. Mol. Des. 2010, 24, 771–787. [Google Scholar] [CrossRef]
- Charasson, V.; Bellott, R.; Meynard, D.; Longy, M.; Gorry, P.; Robert, J. Pharmacogenetics of human carboxylesterase 2, an enzyme involved in the activation of irinotecan into SN-38. Clin. Pharmacol. Ther. 2004, 76, 528–535. [Google Scholar] [CrossRef]
- Pindel, E.V.; Kedishvili, N.Y.; Abraham, T.L.; Brzezinski, M.R.; Zhang, J.; Dean, R.A.; Bosron, W.F. Purification and Cloning of a Broad Substrate Specificity Human Liver Carboxylesterase That Catalyzes the Hydrolysis of Cocaine and Heroin. J. Biol. Chem. 1997, 272, 14769–14775. [Google Scholar] [CrossRef]
- Arena de Souza, V.; Scott, D.J.; Nettleship, J.E.; Rahman, N.; Charlton, M.H.; Walsh, M.A.; Owens, R.J. Comparison of the Structure and Activity of Glycosylated and Aglycosylated Human Carboxylesterase 1. PLoS ONE 2015, 10, e0143919. [Google Scholar] [CrossRef]
- Bencharit, S.; Morton, C.L.; Howard-Williams, E.L.; Danks, M.K.; Potter, P.M.; Redinbo, M.R. Structural insights into CPT-11 activation by mammalian carboxylesterases. Nat. Struct. Mol. Biol. 2002, 9, nsb790. [Google Scholar] [CrossRef]
- Feng, L.; Liu, Z.M.; Xu, L.; Lv, X.; Ning, J.; Hou, J.; Ge, G.B.; Cui, J.N.; Yang, L. A highly selective long-wavelength fluorescent probe for the detection of human carboxylesterase 2 and its biomedical applications. Chem. Comm. 2014, 50, 14519–14522. [Google Scholar] [CrossRef]
- Tang, M.; Mukundan, M.; Yang, J.; Charpentier, N.; LeCluyse, E.L.; Black, C.; Yang, D.; Shi, D.; Yan, B. Antiplatelet Agents Aspirin and Clopidogrel Are Hydrolyzed by Distinct Carboxylesterases, and Clopidogrel Is Transesterificated in the Presence of Ethyl Alcohol. J. Pharmacol. Exp. Ther. 2006, 319, 1467–1476. [Google Scholar] [CrossRef]
- Rivory, L.P.; Bowles, M.R.; Robert, J.; Pond, S.M. Conversion of irinotecan (CPT-11) to its active metabolite, 7-ethyl-10-hydroxycamptothecin (SN-38), by Human Liver Carboxylesterase. Biochem. Pharmacol. 1996, 52, 1103–1111. [Google Scholar] [CrossRef]
- Crow, J.A.; Borazjani, A.; Potter, P.M.; Ross, M.K. Hydrolysis of pyrethroids by human and rat tissues: Examination of intestinal, liver and serum carboxylesterases. Toxicol. Appl. Pharm. 2007, 221, 1–12. [Google Scholar] [CrossRef]
- Ross, M.K.; Crow, J.A. Human carboxylesterases and their role in xenobiotic and endobiotic metabolism. J. Biochem. Mol. Toxicol. 2007, 21, 187–196. [Google Scholar] [CrossRef]
- Wang, D.; Zhao, T.; Zhao, S.; Chen, J.; Dou, T.; Ge, G.; Wang, C.; Sun, H.; Liu, K.; Meng, Q.; et al. Substrate-dependent Inhibition of Hypericin on Human Carboxylesterase 2: Implications for Herb-drug Combination. Curr. Drug Metab. 2022, 23, 38–44. [Google Scholar] [CrossRef]
- Wang, D.; Song, Y.; Zhu, Y.; Wang, Y.; Li, H.; Ge, G. Carboxylesterases mediated herb-drug interactions: A systematic review. TMR Mod. Herb. Med. 2019, 2, 147. [Google Scholar] [CrossRef]
- Humerickhouse, R.; Lohrbach, K.; Li, L.; Bosron, W.F.; Dolan, M.E. Characterization of CPT-11 Hydrolysis by Human Liver Carboxylesterase Isoforms hCE-1 and hCE-21. Cancer Res. 2000, 60, 1189–1192. [Google Scholar]
- Fleming, C.D.; Bencharit, S.; Edwards, C.C.; Hyatt, J.L.; Tsurkan, L.; Bai, F.; Fraga, C.; Morton, C.L.; Howard-Williams, E.L.; Potter, P.M.; et al. Structural Insights into Drug Processing by Human Carboxylesterase 1: Tamoxifen, Mevastatin, and Inhibition by Benzil. J. Mol. Biol. 2005, 352, 165–177. [Google Scholar] [CrossRef]
- Case, D.A.; Belfon, K.; Ben-Shalom, I.Y.; Brozell, S.R.; Cerutti, D.S.; Cheatham, T.E., III; Cruzeiro, V.W.D.; Darden, T.A.; Duke, R.E.; Giambasu, G.; Gilson, M.K.; Gohlke, H.; Goetz, A.W.; Harris, R.; Izadi, S.; Kasavajhala, K.; Kovalenko, A.; Krasny, R.; Kurtzman, T.; Lee, T.S.; LeGrand, S.; Li, P.; Lin, C.; Liu, J.; Luchko, T.; Luo, R.; Man, V.; Merz, K.M.; Miao, Y.; Mikhailovskii, O.; Monard, G.; Nguyen, H.; Onufriev, A.; Pan, F.; Pantano, S.; Qi, R.; Roe, D.R.; Roitberg, A.; Sagui, C.; Schott-Verdugo, S.; Shen, J.; Simmerling, C.L.; Skrynnikov, N.; Smith, J.; Swails, J.; Walker, R.C.; Wang, J.; Wilson, L.; Wolf, R.M.; Wu, X.; York, D.M.; Kollman, P.A. AMBER 2020; University of California: San Francisco, CA, USA, 2020. [Google Scholar]
- Wang, J.; Wolf, R.M.; Caldwell, J.W.; Kollman, P.A.; Case, D.A. Development and Testing of a General Amber Force Field. J. Comput. Chem. 2004, 25, 1157–1174. [Google Scholar] [CrossRef]
- Wang, J.; Wang, W.; Kollman, P.A.; Case, D.A. Automatic atom type and bond type perception in molecular mechanical calculations. J. Mol. Graph. Model. 2006, 25, 247–260. [Google Scholar] [CrossRef]
- Bayly, C.I.; Cieplak, P.; Cornell, W.; Kollman, P.A. A well-behaved electrostatic potential based method using charge restraints for deriving atomic charges: The RESP model. J. Phys. Chem. 1993, 97, 10269–10280. [Google Scholar] [CrossRef]
- Cieplak, P.; Cornell, W.D.; Bayly, C.; Kollman, P.A. Application of the multimolecule and multiconformational RESP methodology to biopolymers: Charge derivation for DNA, RNA, and proteins. J. Comput. Chem. 1995, 16, 1357–1377. [Google Scholar] [CrossRef]
- Frisch, M.J.; Trucks, G.W.; Schlegel, H.B.; Scuseria, G.E.; Robb, M.A.; Cheeseman, J.R.; Scalmani, G.; Barone, V.; Petersson, G.A.; Nakatsuji, H.; Li, X.; Caricato, M.; Marenich, A.V.; Bloino, J.; Janesko, B.G.; Gomperts, R.; Mennucci, B.; Hratchian, H.P.; Ortiz, J.V.; Izmaylov, A.F.; Sonnenberg, J.L.; Williams-Young, D.; Ding, F.; Lipparini, F.; Egidi, F.; Goings, J.; Peng, B.; Petrone, A.; Henderson, T.; Ranasinghe, D.; Zakrzewski, V.G.; Gao, J.; Rega, N.; Zheng, G.; Liang, W.; Hada, M.; Ehara, M.; Toyota, K.; Fukuda, R.; Hasegawa, J.; Ishida, M.; Nakajima, T.; Honda, Y.; Kitao, O.; Nakai, H.; Vreven, T.; Throssell, K.; Montgomery, J.A., Jr.; Peralta, J.E.; Ogliaro, F.; Bearpark, M.J.; Heyd, J.J.; Brothers, E.N.; Kudin, K.N.; Staroverov, V.N.; Keith, T.A.; Kobayashi, R.; Normand, J.; Raghavachari, K.; Rendell, A.P.; Burant, J.C.; Iyengar, S.S.; Tomasi, J.; Cossi, M.; Millam, J.M.; Klene, M.; Adamo, C.; Cammi, R.; Ochterski, J.W.; Martin, R.L.; Morokuma, K.; Farkas, O.; Foresman, J.B.; Fox, D.J. Gaussian 16 Rev. B.01; Gaussian, Inc.: Wallingford, CT, USA, 2016. [Google Scholar]
- Becke, A.D. Density-functional thermochemistry. III. The role of exact exchange. J. Chem. Phys. 1993, 98, 5648–5652. [Google Scholar] [CrossRef]
- Binning, R.C., Jr.; Curtiss, L.A. Compact contracted basis-sets for 3rd-row atoms: GA-KR. J. Comput. Chem. 1990, 11, 1206–1216. [Google Scholar] [CrossRef]
- Blaudeau, J.P.; McGrath, M.P.; Curtiss, L.A.; Radom, L. Extension of Gaussian-2 (G2) theory to molecules containing third-row atoms K and Ca. J. Chem. Phys. 1997, 107, 5016–5021. [Google Scholar] [CrossRef]
- Ditchfield, R.; Hehre, W.J.; Pople, J.A. Self-Consistent Molecular-Orbital Methods. IX. An Extended Gaussian-Type Basis for Molecular-Orbital Studies of Organic Molecules. J. Chem. Phys. 1971, 54, 724–728. [Google Scholar] [CrossRef]
- Francl, M.M.; Pietro, W.J.; Hehre, W.J.; Binkley, J.S.; DeFrees, D.J.; Pople, J.A.; Gordon, M.S. Self-Consistent Molecular Orbital Methods. 23. A polarization-type basis set for 2nd-row elements. J. Chem. Phys. 1982, 77, 3654–3665. [Google Scholar] [CrossRef]
- Gordon, M.S. The isomers of silacyclopropane. Chem. Phys. Lett. 1980, 76, 163–168. [Google Scholar] [CrossRef]
- Hariharan, P.C.; Pople, J.A. Influence of polarization functions on molecular-orbital hydrogenation energies. Theor. Chem. Acc. 1973, 28, 213–222. [Google Scholar] [CrossRef]
- Hariharan, P.C.; Pople, J.A. Accuracy of AH equilibrium geometries by single determinant molecular-orbital theory. Mol. Phys. 1974, 27, 209–214. [Google Scholar] [CrossRef]
- Hehre, W.J.; Ditchfield, R.; Pople, J.A. Self-Consistent Molecular Orbital Methods. XII. Further Extensions of Gaussian-Type Basis Sets for Use in Molecular Orbital Studies of Organic Molecules. J. Chem. Phys. 1972, 56, 2257–2261. [Google Scholar] [CrossRef]
- Rassolov, V.A.; Pople, J.A.; Ratner, M.A.; Windus, T.L. 6-31G* basis set for atoms K through Zn. J. Chem. Phys. 1998, 109, 1223–1229. [Google Scholar] [CrossRef]
- Rassolov, V.A.; Ratner, M.A.; Pople, J.A.; Redfern, P.C.; Curtiss, L.A. 6-31G* Basis Set for Third-Row Atoms. J. Comput. Chem. 2001, 22, 976–984. [Google Scholar] [CrossRef]
- Mennucci, B. Polarizable continuum model. Wiley Interdiscip. Rev. Comput. Mol. Sci. 2012, 2, 386–404. [Google Scholar] [CrossRef]
- Tomasi, J.; Mennucci, B.; Cammi, R. Quantum Mechanical Continuum Solvation Models. Chem. Rev. 2005, 105, 2999–3094. [Google Scholar] [CrossRef]
- Cornell, W.D.; Cieplak, P.; Bayly, C.I.; Gould, I.R.; Merz, K.M., Jr.; Ferguson, D.M.; Spellmeyer, D.C.; Fox, T.; Caldwell, J.W.; Kollman, P.A. A second generation force field for the simulation of proteins and nucleic acids. J. Am. Chem. Soc. 1995, 117, 5179–5197. [Google Scholar] [CrossRef]
- Jorgensen, W.L.; Chandrasekhar, J.; Madura, J.D.; Impey, R.W.; Klein, M.L. Comparison of simple potential functions for simulating liquid water. J. Chem. Phys. 1983, 79, 926–935. [Google Scholar] [CrossRef]
- Joung, I.S.; Cheatham III, T.E. Determination of Alkali and Halide Monovalent Ion Parameters for Use in Explicitly Solvated Biomolecular Simulations. J. Phys. Chem. B 2008, 112, 9020–9041. [Google Scholar] [CrossRef]
- Ryckaert, J.P.; Ciccotti, G.; Berendsen, H.J.C. Numerical integration of the cartesian equations of motion of a system with constraints: Molecular dynamics of n-alkanes. J. Comput. Phys. 1977, 23, 327–341. [Google Scholar] [CrossRef]
- Darden, T.; York, D.; Pedersen, L. Particle mesh Ewald: An N log(N) method for Ewald sums in large systems. J. Chem. Phys. 1993, 98, 10089–10092. [Google Scholar] [CrossRef]
- Essmann, U.; Perera, L.; Berkowitz, M.L.; Darden, T.; Lee, H.; Pedersen, L.G. A smooth particle mesh Ewald method. J. Chem. Phys. 1995, 103, 8577–8593. [Google Scholar] [CrossRef]
- Berman, H.M.; Westbrook, J.; Feng, Z.; Gilliland, G.; Bhat, T.N.; Weissig, H.; Shindyalov, I.N.; Bourne, P.E. The Protein Data Bank. Nucleic Acids Res. 2000, 28, 235–242. [Google Scholar] [CrossRef]
- Bernstein, F.C.; Koetzle, T.F.; Williams, G.J.B.; Meyer, E.F., Jr.; Brice, M.D.; Rodgers, J.R.; Kennard, O.; Shimanouchi, T.; Tasumi, M. The protein data bank: A computer-based archival file for macromolecular structures. J. Mol. Biol. 1977, 112, 535–542. [Google Scholar] [CrossRef]
- Arnold, K.; Bordoli, L.; Kopp, J.; Schwede, T. The SWISS-MODEL workspace: A web-based environment for protein structure homology modelling. Bioinformatics 2006, 22, 195–201. [Google Scholar] [CrossRef]
- Benkert, P.; Biasini, M.; Schwede, T. Toward the estimation of the absolute quality of individual protein structure models. Bioinformatics 2011, 27, 343–350. [Google Scholar] [CrossRef]
- Biasini, M.; Bienert, S.; Waterhouse, A.; Arnold, K.; Studer, G.; Schmidt, T.; Kiefer, F.; Cassarino, T.G.; Bertoni, M.; Bordoli, L.; et al. SWISS-MODEL: Modelling protein tertiary and quaternary structure using evolutionary information. Nucleic Acids Res. 2014, 42, W252–W258. [Google Scholar] [CrossRef]
- Guex, N.; Peitsch, M.C.; Schwede, T. Automated comparative protein structure modeling with SWISS-MODEL and Swiss-PdbViewer: A historical perspective. Electrophoresis 2009, 30, S162–S173. [Google Scholar] [CrossRef]
- Waterhouse, A.; Bertoni, M.; Bienert, S.; Studer, G.; Tauriello, G.; Gumienny, R.; Heer, F.T.; de Beer, T.A.; Rempfer, C.; Bordoli, L.; et al. SWISS-MODEL: Homology modelling of protein structures and complexes. Nucleic Acids Res. 2018, 46, W296–W303. [Google Scholar] [CrossRef] [PubMed]
- Consortium, T.U. UniProt: The Universal Protein Knowledgebase in 2023. Nucleic Acids Res. 2022, 51, D523–D531. [Google Scholar] [CrossRef] [PubMed]
- Altschul, S.F.; Madden, T.L.; Schäffer, A.A.; Zhang, J.; Zhang, Z.; Miller, W.; Lipman, D.J. Gapped BLAST and PSI-BLAST: A new generation of protein database search programs. Nucleic Acids Res. 1997, 25, 3389–3402. [Google Scholar] [CrossRef] [PubMed]
- Remmert, M.; Biegert, A.; Hauser, A.; Söding, J. HHblits: Lightning-fast iterative protein sequence searching by HMM-HMM alignment. Nat. Methods 2012, 9, 173–175. [Google Scholar] [CrossRef]
- Vriend, G. WHAT IF: A molecular modeling and drug design program. J. Mol. Graph. Model. 1990, 8, 52–56. [Google Scholar] [CrossRef]
- Case, D.A.; Betz, R.M.; Botello-Smith, W.; Cerutti, D.S.; Cheatham, T.E., III; Darden, T.A.; Duke, R.E.; Giese, T.J.; Gohlke, H.; Goetz, A.W.; Homeyer, N.; Izadi, S.; Janowski, P.; Kaus, J.; Kovalenko, A.; Lee, T.S.; LeGrand, S.; Li, P.; Lin, C.; Luchko, T.; Luo, R.; Madej, B.; Mermelstein, D.; Merz, K.M.; Monard, G.; Nguyen, H.; Nguyen, H.T.; Omelyan, I.; Onufriev, A.; Roe, D.R.; Roitberg, A.; Sagui, C.; Simmerling, C.L.; Swails, J.; Walker, R.C.; Wang, J.; Wolf, R.M.; Wu, X.; Xiao, L.; York, D.M.; Kollman, P.A. AMBER 2016; University of California: San Francisco, CA, USA, 2016. [Google Scholar]
- Maier, J.A.; Martinez, C.; Kasavajhala, K.; Wickstrom, L.; Hauser, K.E.; Simmerling, C. ff14SB: Improving the Accuracy of Protein Side Chain and Backbone Parameters from ff99SB. J. Chem. Theory Comput. 2015, 11, 3696–3713. [Google Scholar] [CrossRef]
- Berendsen, H.J.C.; Grigera, J.R.; Straatsma, T.P. The missing term in effective pair potentials. J. Phys. Chem. 1987, 91, 6269–6271. [Google Scholar] [CrossRef]
- Huey, R.; Morris, G.M.; Olson, A.J.; Goodsell, D.S. A semiempirical free energy force field with charge-based desolvation. J. Comput. Chem. 2007, 28, 1145–1152. [Google Scholar] [CrossRef]
- Morris, G.M.; Goodsell, D.S.; Halliday, R.S.; Huey, R.; Hart, W.E.; Belew, R.K.; Olson, A.J. Automated docking using a Lamarckian genetic algorithm and an empirical binding free energy function. J. Comput. Chem. 1998, 19, 1639–1662. [Google Scholar] [CrossRef]
- Morris, G.M.; Huey, R.; Lindstrom, W.; Sanner, M.F.; Belew, R.K.; Goodsell, D.S.; Olson, A.J. AutoDock4 and AutoDockTools4: Automated docking with selective receptor flexibility. J. Comput. Chem. 2009, 30, 2785–2791. [Google Scholar] [CrossRef]
- Gasteiger, J.; Marsili, M. Iterative partial equalization of orbital electronegativity-a rapid access to atomic charges. Tetrahedron 1980, 36, 3219–3228. [Google Scholar] [CrossRef]
- Case, D.A.; Aktulga, H.M.; Belfon, K.; Ben-Shalom, I.Y.; Berryman, J.T.; Brozell, S.R.; Cerutti, D.S.; Cheatham, T.E., III; Cisneros, G.A.; Cruzeiro, V.W.D.; Darden, T.A.; Duke, R.E.; Giambasu, G.; Gilson, M.K.; Gohlke, H.; Goetz, A.W.; Harris, R.; Izadi, S.; Izmailov, S.A.; Kasavajhala, K.; Kaymak, M.C.; King, E.; Kovalenko, A.; Kurtzman, T.; Lee, T.S.; LeGrand, S.; Li, P.; Lin, C.; Liu, J.; Luchko, T.; Luo, R.; Machado, M.; Man, V.; Manathunga, M.; Merz, K.M.; Miao, Y.; Mikhailovskii, O.; Monard, G.; Nguyen, H.; O’Hearn, K.A.; Onufriev, A.; Pan, F.; Pantano, S.; Qi, R.; Rahnamoun, A.; Roe, D.R.; Roitberg, A.; Sagui, C.; Schott-Verdugo, S.; Shajan, A.; Shen, J.; Simmerling, C.L.; Skrynnikov, N.R.; Smith, J.; Swails, J.; Walker, R.C.; Wang, J.; Wang, J.; Wei, H.; Wolf, R.M.; Wu, X.; Xiong, Y.; Xue, Y.; York, D.M.; Zhao, S.; Kollman, P.A. Amber 2022; University of California: San Francisco, CA, USA, 2022. [Google Scholar]
- Dupradeau, F.Y.; Pigache, A.; Zaffran, T.; Savineau, C.; Lelong, R.; Grivel, N.; Lelong, D.; Rosanski, W.; Cieplak, P. The R.E.D. tools: Advances in RESP and ESP charge derivation and force field library building. Phys. Chem. Chem. Phys. 2010, 12, 7821–7839. [Google Scholar] [CrossRef] [PubMed]
- Vanquelef, E.; Simon, S.; Marquant, G.; Garcia, E.; Klimerak, G.; Delepine, J.C.; Cieplak, P.; Dupradeau, F.Y. R.E.D. Server: A web service for deriving RESP and ESP charges and building force field libraries for new molecules and molecular fragments. Nucleic Acids Res. 2011, 39, W511–W517. [Google Scholar] [CrossRef] [PubMed]
- Tutorial 9.1 NMR Refinement of DNA and RNA Duplexes, Amber Web Site. Available online: http://ambermd.org/tutorials/advanced/tutorial4/index.php (accessed on 22 November 2023).
- Roe, D.R.; Cheatham, T.E. PTRAJ and CPPTRAJ: Software for Processing and Analysis of Molecular Dynamics Trajectory Data. J. Chem. Theory Comput. 2013, 9, 3084–3095. [Google Scholar] [CrossRef] [PubMed]
- Harris, C.R.; Millman, K.J.; van der Walt, S.J.; Gommers, R.; Virtanen, P.; Cournapeau, D.; Wieser, E.; Taylor, J.; Berg, S.; Smith, N.J.; et al. Array programming with NumPy. Nature 2020, 585, 357–362. [Google Scholar] [CrossRef]
- Van Rossum, G.; Drake, F.L. Python 3 Reference Manual; CreateSpace: Scotts Valley, CA, USA, 2009. [Google Scholar]
- Hunter, J.D. Matplotlib: A 2D Graphics Environment. Comput. Sci. Eng. 2007, 9, 90–95. [Google Scholar] [CrossRef]
- Humphrey, W.; Dalke, A.; Schulten, K. VMD - Visual Molecular Dynamics. J. Mol. Graph. 1996, 14, 33–38. [Google Scholar] [CrossRef]
- Sanner, M.F. Python: A Programming Language for Software Integration and Development. J. Mol. Graph. Model. 1999, 17, 57–61. [Google Scholar] [CrossRef]
- Schrödinger Suite 2022-2; Schrödinger, LLC: New York, NY, USA, 2022.
- Jumper, J.; Evans, R.; Pritzel, A.; Green, T.; Figurnov, M.; Ronneberger, O.; Tunyasuvunakool, K.; Bates, R.; Žídek, A.; Potapenko, A.; et al. Highly accurate protein structure prediction with AlphaFold. Nature 2021, 596, 583–589. [Google Scholar] [CrossRef]
- Varadi, M.; Anyango, S.; Deshpande, M.; Nair, S.; Natassia, C.; Yordanova, G.; Yuan, D.; Stroe, O.; Wood, G.; Laydon, A.; et al. AlphaFold Protein Structure Database: Massively expanding the structural coverage of protein-sequence space with high-accuracy models. Nucleic Acids Res. 2021, 50, D439–D444. [Google Scholar] [CrossRef]
- Guex, N.; Peitsch, M.C. SWISS-MODEL and the Swiss-PdbViewer: An environment for comparative protein modeling. Electrophoresis 1997, 18, 2714–2723. [Google Scholar] [CrossRef] [PubMed]
- Martin, J.R.; Mulder, F.A.; Karimi-Nejad, Y.; van der Zwan, J.; Mariani, M.; Schipper, D.; Boelens, R. The solution structure of serine protease PB92 from Bacillus alcalophilus presents a rigid fold with a flexible substrate-binding site. Structure 1997, 5, 521–532. [Google Scholar] [CrossRef] [PubMed]
- van der Laan, J.; Teplyakov, A.; Kelders, H.; Kalk, K.; Misset, O.; Mulleners, L.; Dijkstra, B. Crystal structure of the high-alkaline serine protease PB92 from Bacillus alcalophilus. Protein Eng. Des. Sel. 1992, 5, 405–411. [Google Scholar] [CrossRef]
- Harel, M.; Hyatt, J.L.; Brumshtein, B.; Morton, C.L.; Yoon, K.J.P.; Wadkins, R.M.; Silman, I.; Sussman, J.L.; Potter, P.M. The Crystal Structure of the Complex of the Anticancer Prodrug 7-Ethyl-10-[4-(1-piperidino)-1-piperidino]-carbonyloxycamptothecin (CPT-11) with Torpedo californica Acetylcholinesterase Provides a Molecular Explanation for Its Cholinergic Action. Mol. Pharm. 2005, 67, 1874–1881. [Google Scholar] [CrossRef] [PubMed]


| (SER–HID) | |||||||
| Acceptor | Donor | HCE1 Apo | HCE2 Apo | HCE2 L2 | HCE2 L5 | HCE2 L8 | HCE2 It |
| Glu201 | Ser202 | – | – | 0.64 ± 0.44 | 0.60 ± 0.54 | – | 0.67 ± 0.43 |
| Glu319 | Ser228 | – | – | – | 0.54 ± 0.35 | 0.90 ± 0.14 | – |
| Glu319 | Asn316 | 0.68 ± 0.39 | – | 0.52 ± 0.47 | 0.82 ± 0.20 | 0.88 ± 0.19 | – |
| Glu319 | Gly317 | 0.92 ± 0.19 | – | – | – | – | – |
| Glu319 | His431 | – | – | 0.54 ± 0.40 | 0.77 ± 0.25 | 0.54 ± 0.38 | – |
| Glu201 | His431 | – | – | – | – | – | – |
| Asp433 | His431 | – | – | – | – | 0.58 ± 0.32 | – |
| Glu434 | His431 | 0.60 ± 0.35 | – | – | – | – | 0.58 ± 0.45 |
| (SEM–HIP) | |||||||
| Acceptor | Donor | HCE1 Apo | HCE2 Apo | HCE2 L2 | HCE2 L5 | HCE2 L8 | HCE2 It |
| Glu201 | Ser202 | – | – | – | – | – | – |
| Glu319 | Ser228 | – | – | – | – | 0.71 ± 0.44 | 0.66 ± 0.42 |
| Glu319 | Asn316 | – | 0.56 ± 0.40 | – | 0.87 ± 0.06 | 0.74 ± 0.42 | 0.68 ± 0.39 |
| Glu319 | Gly317 | 0.72 ± 0.45 | – | – | – | – | – |
| Glu319 | His431 | 1.41 ± 0.94 | 0.64 ± 0.59 | 0.76 ± 0.42 | 0.76 ± 0.32 | 0.81 ± 0.30 | 0.66 ± 0.44 |
| Glu201 | His431 | 0.66 ± 0.39 | – | – | – | – | – |
| Asp433 | His431 | – | – | – | – | 0.58 ± 0.20 | – |
| Glu434 | His431 | – | – | – | – | – | – |
| (SER–HID) | |||||||
| Glu201 | Ser202 | Glu227 | Glu319 | His431 | Asp433 | Glu434 | |
| L2 | −69.13 ± 18.22 | 5.95 ± 2.99 | −61.17 ± 25.59 | −35.31 ± 7.51 | −2.50 ± 4.47 | −27.97 ± 2.75 | −66.86 ± 20.19 |
| L5 | −54.59 ± 17.01 | 5.87 ± 0.88 | −72.99 ± 15.48 | −51.00 ± 7.85 | −1.65 ± 3.04 | −31.43 ± 1.75 | −85.65 ± 10.24 |
| L8 | −47.70 ± 8.39 | 1.89 ± 4.26 | −77.97 ± 18.97 | −68.68 ± 13.66 | −0.26 ± 3.40 | −33.33 ± 3.89 | −83.74 ± 22.61 |
| It | −75.92 ± 12.66 | 2.50 ± 2.32 | −37.88 ± 4.77 | −34.47 ± 9.04 | −5.81 ± 3.67 | −34.18 ± 4.03 | −41.02 ± 1.63 |
| (SEM–HIP) | |||||||
| Glu201 | Ser202 | Glu227 | Glu319 | His431 | Asp433 | Glu434 | |
| L2 | −76.43 ± 6.08 | −41.47 ± 7.73 | −94.38 ± 3.10 | −34.14 ± 9.58 | 39.19 ± 6.50 | −29.85 ± 2.26 | −83.74 ± 4.91 |
| L5 | −66.40 ± 12.17 | −50.82 ± 11.61 | −78.65 ± 23.27 | −48.48 ± 14.59 | 48.46 ± 5.94 | −28.87 ± 1.74 | −78.29 ± 16.88 |
| L8 | −51.22 ± 13.39 | −42.50 ± 13.49 | −81.69 ± 23.10 | −43.23 ± 6.39 | 44.84 ± 7.17 | −30.82 ± 2.66 | −81.81 ± 21.37 |
| It | −91.58 ± 6.93 | −50.67 ± 3.95 | −39.69 ± 7.51 | −32.88 ± 7.99 | 41.18 ± 4.97 | −48.43 ± 10.31 | −37.01 ± 2.11 |
Disclaimer/Publisher’s Note: The statements, opinions and data contained in all publications are solely those of the individual author(s) and contributor(s) and not of MDPI and/or the editor(s). MDPI and/or the editor(s) disclaim responsibility for any injury to people or property resulting from any ideas, methods, instructions or products referred to in the content. |
© 2024 by the authors. Licensee MDPI, Basel, Switzerland. This article is an open access article distributed under the terms and conditions of the Creative Commons Attribution (CC BY) license (https://creativecommons.org/licenses/by/4.0/).
Share and Cite
Beierlein, F.; Horn, A.H.C.; Sticht, H.; Mokhir, A.; Imhof, P. In Silico Study of Camptothecin-Based Pro-Drugs Binding to Human Carboxylesterase 2. Biomolecules 2024, 14, 153. https://doi.org/10.3390/biom14020153
Beierlein F, Horn AHC, Sticht H, Mokhir A, Imhof P. In Silico Study of Camptothecin-Based Pro-Drugs Binding to Human Carboxylesterase 2. Biomolecules. 2024; 14(2):153. https://doi.org/10.3390/biom14020153
Chicago/Turabian StyleBeierlein, Frank, Anselm H. C. Horn, Heinrich Sticht, Andriy Mokhir, and Petra Imhof. 2024. "In Silico Study of Camptothecin-Based Pro-Drugs Binding to Human Carboxylesterase 2" Biomolecules 14, no. 2: 153. https://doi.org/10.3390/biom14020153
APA StyleBeierlein, F., Horn, A. H. C., Sticht, H., Mokhir, A., & Imhof, P. (2024). In Silico Study of Camptothecin-Based Pro-Drugs Binding to Human Carboxylesterase 2. Biomolecules, 14(2), 153. https://doi.org/10.3390/biom14020153