
Molecular Modeling Studies to Probe the Binding Hypothesis of Novel Lead Compounds against Multidrug Resistance Protein ABCB1


Abstract
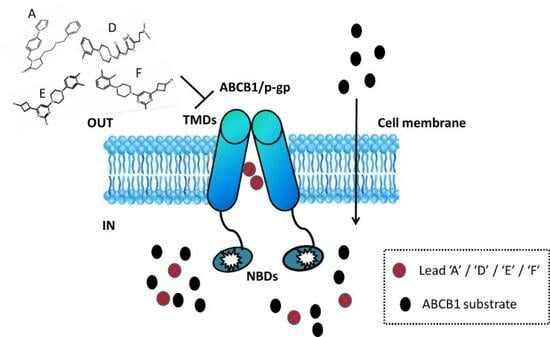
1. Introduction
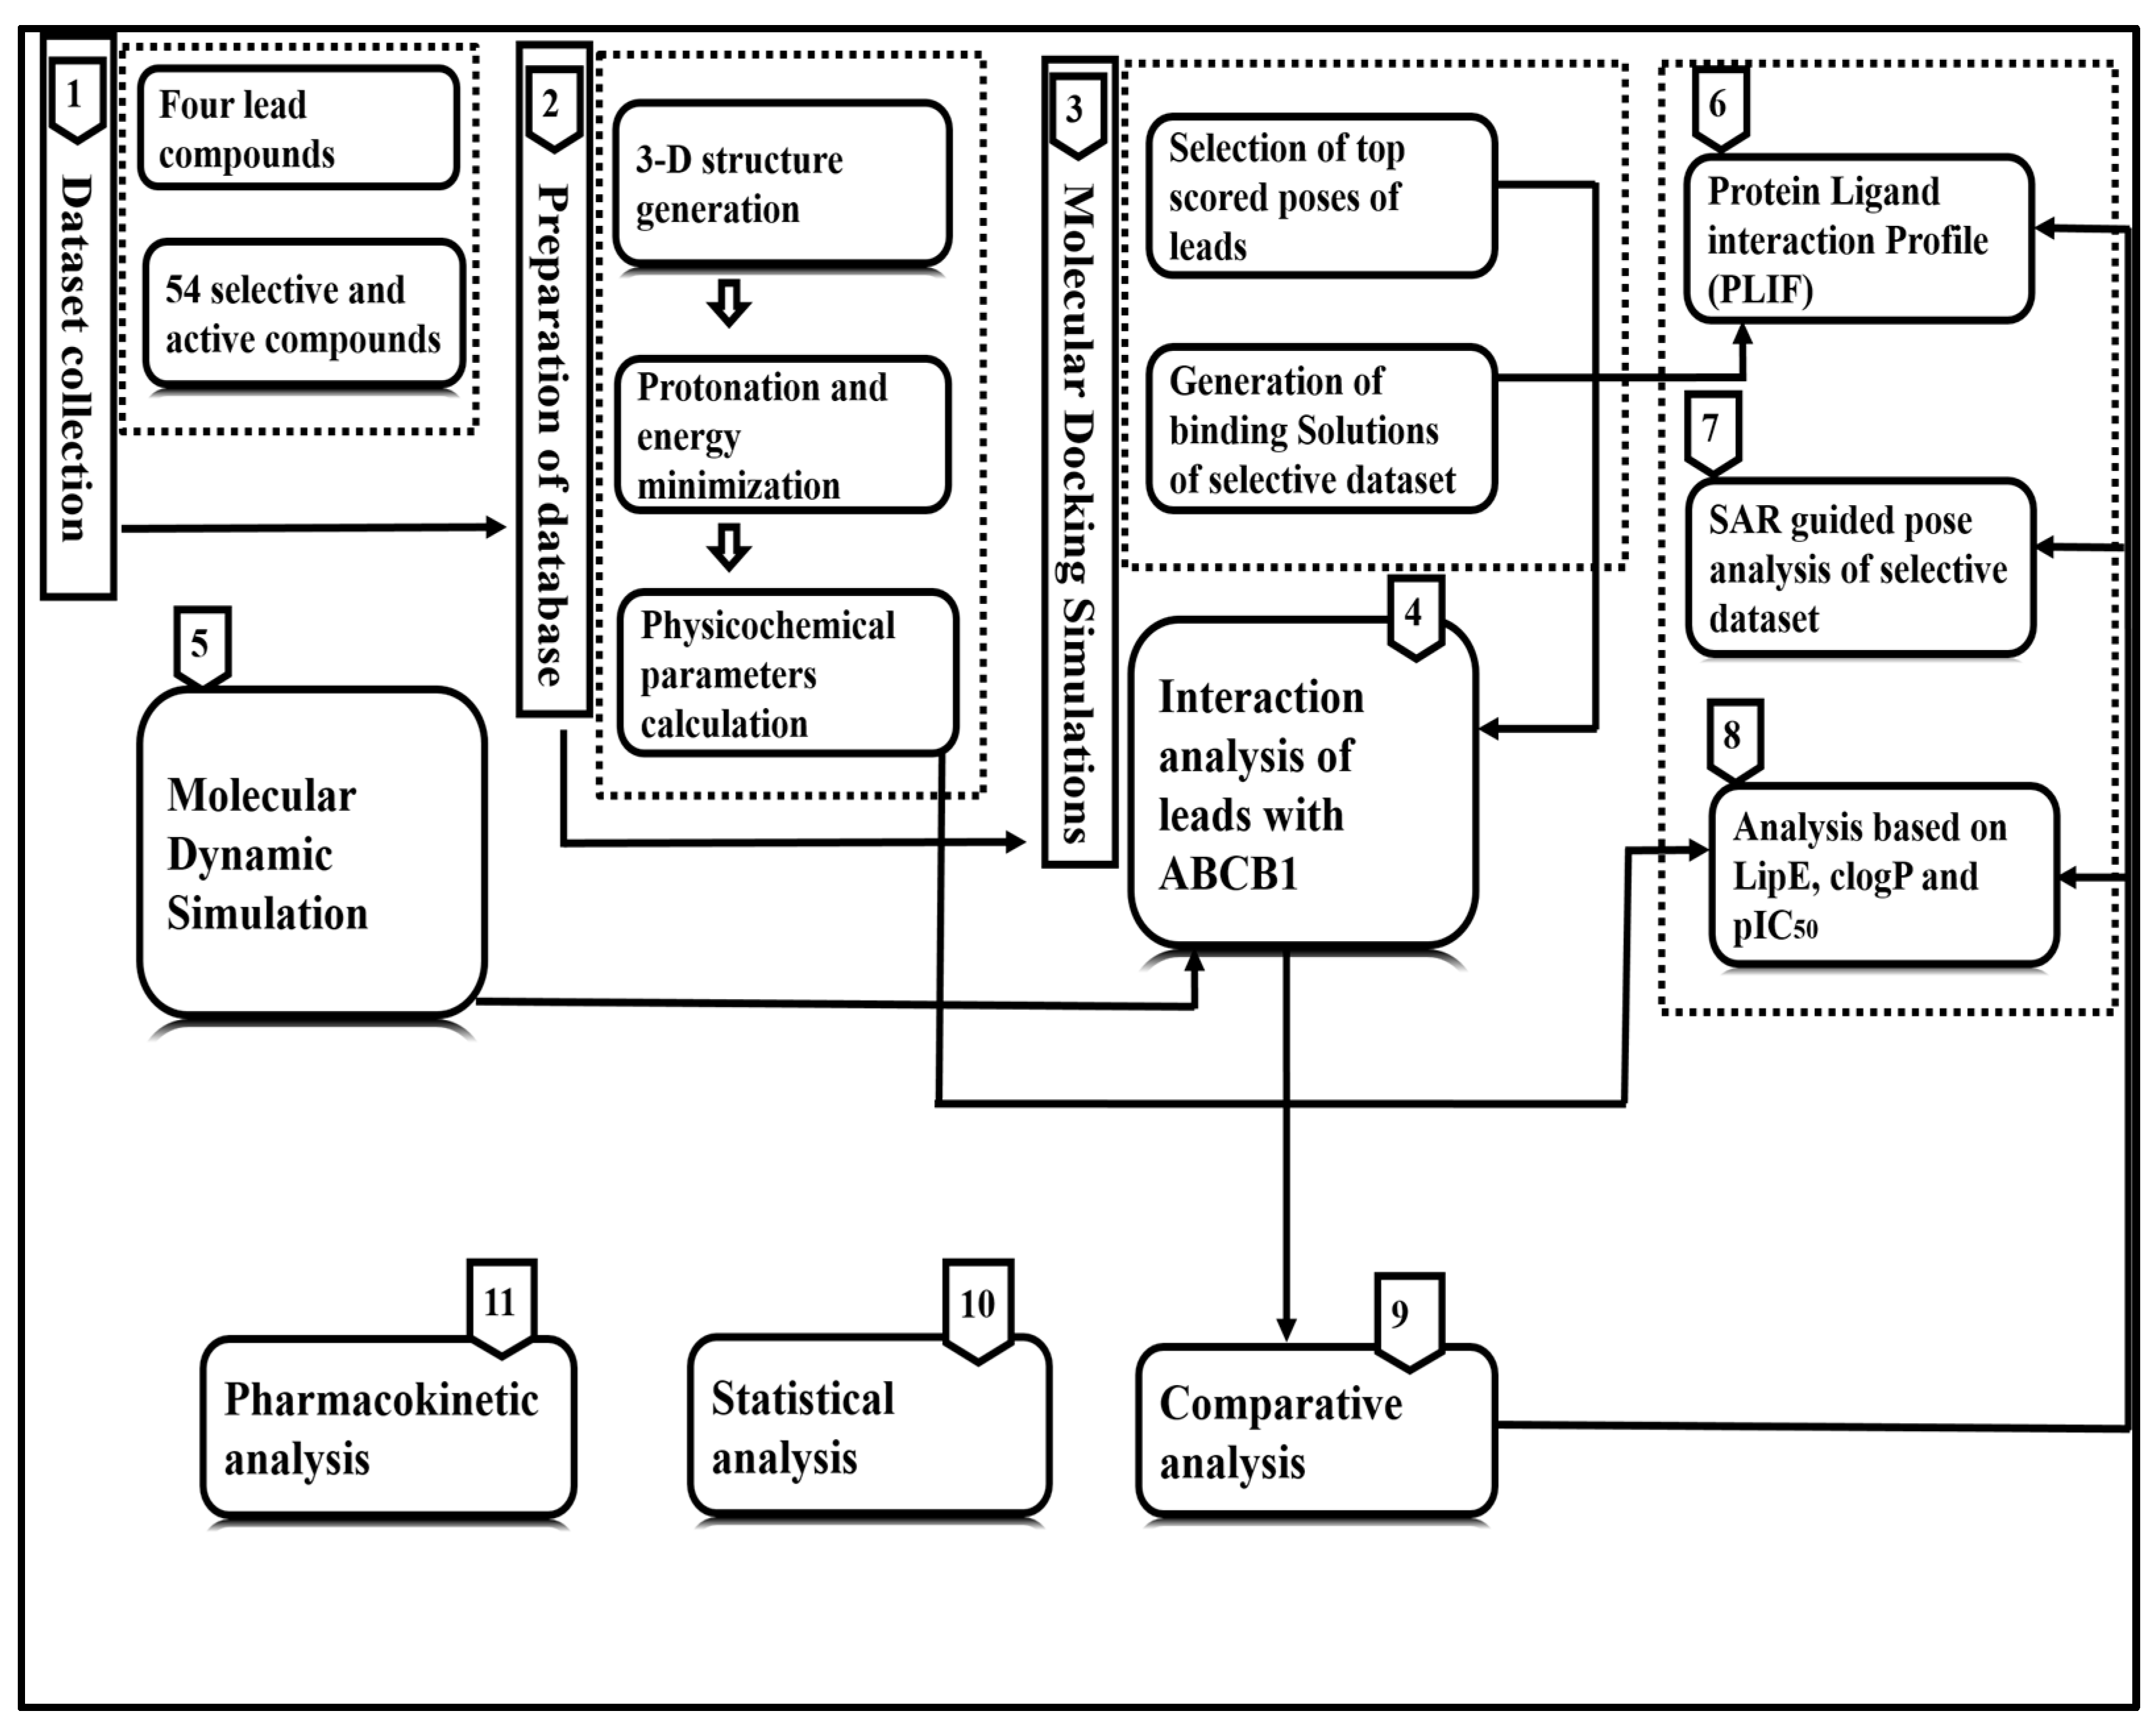
2. Materials and Methods
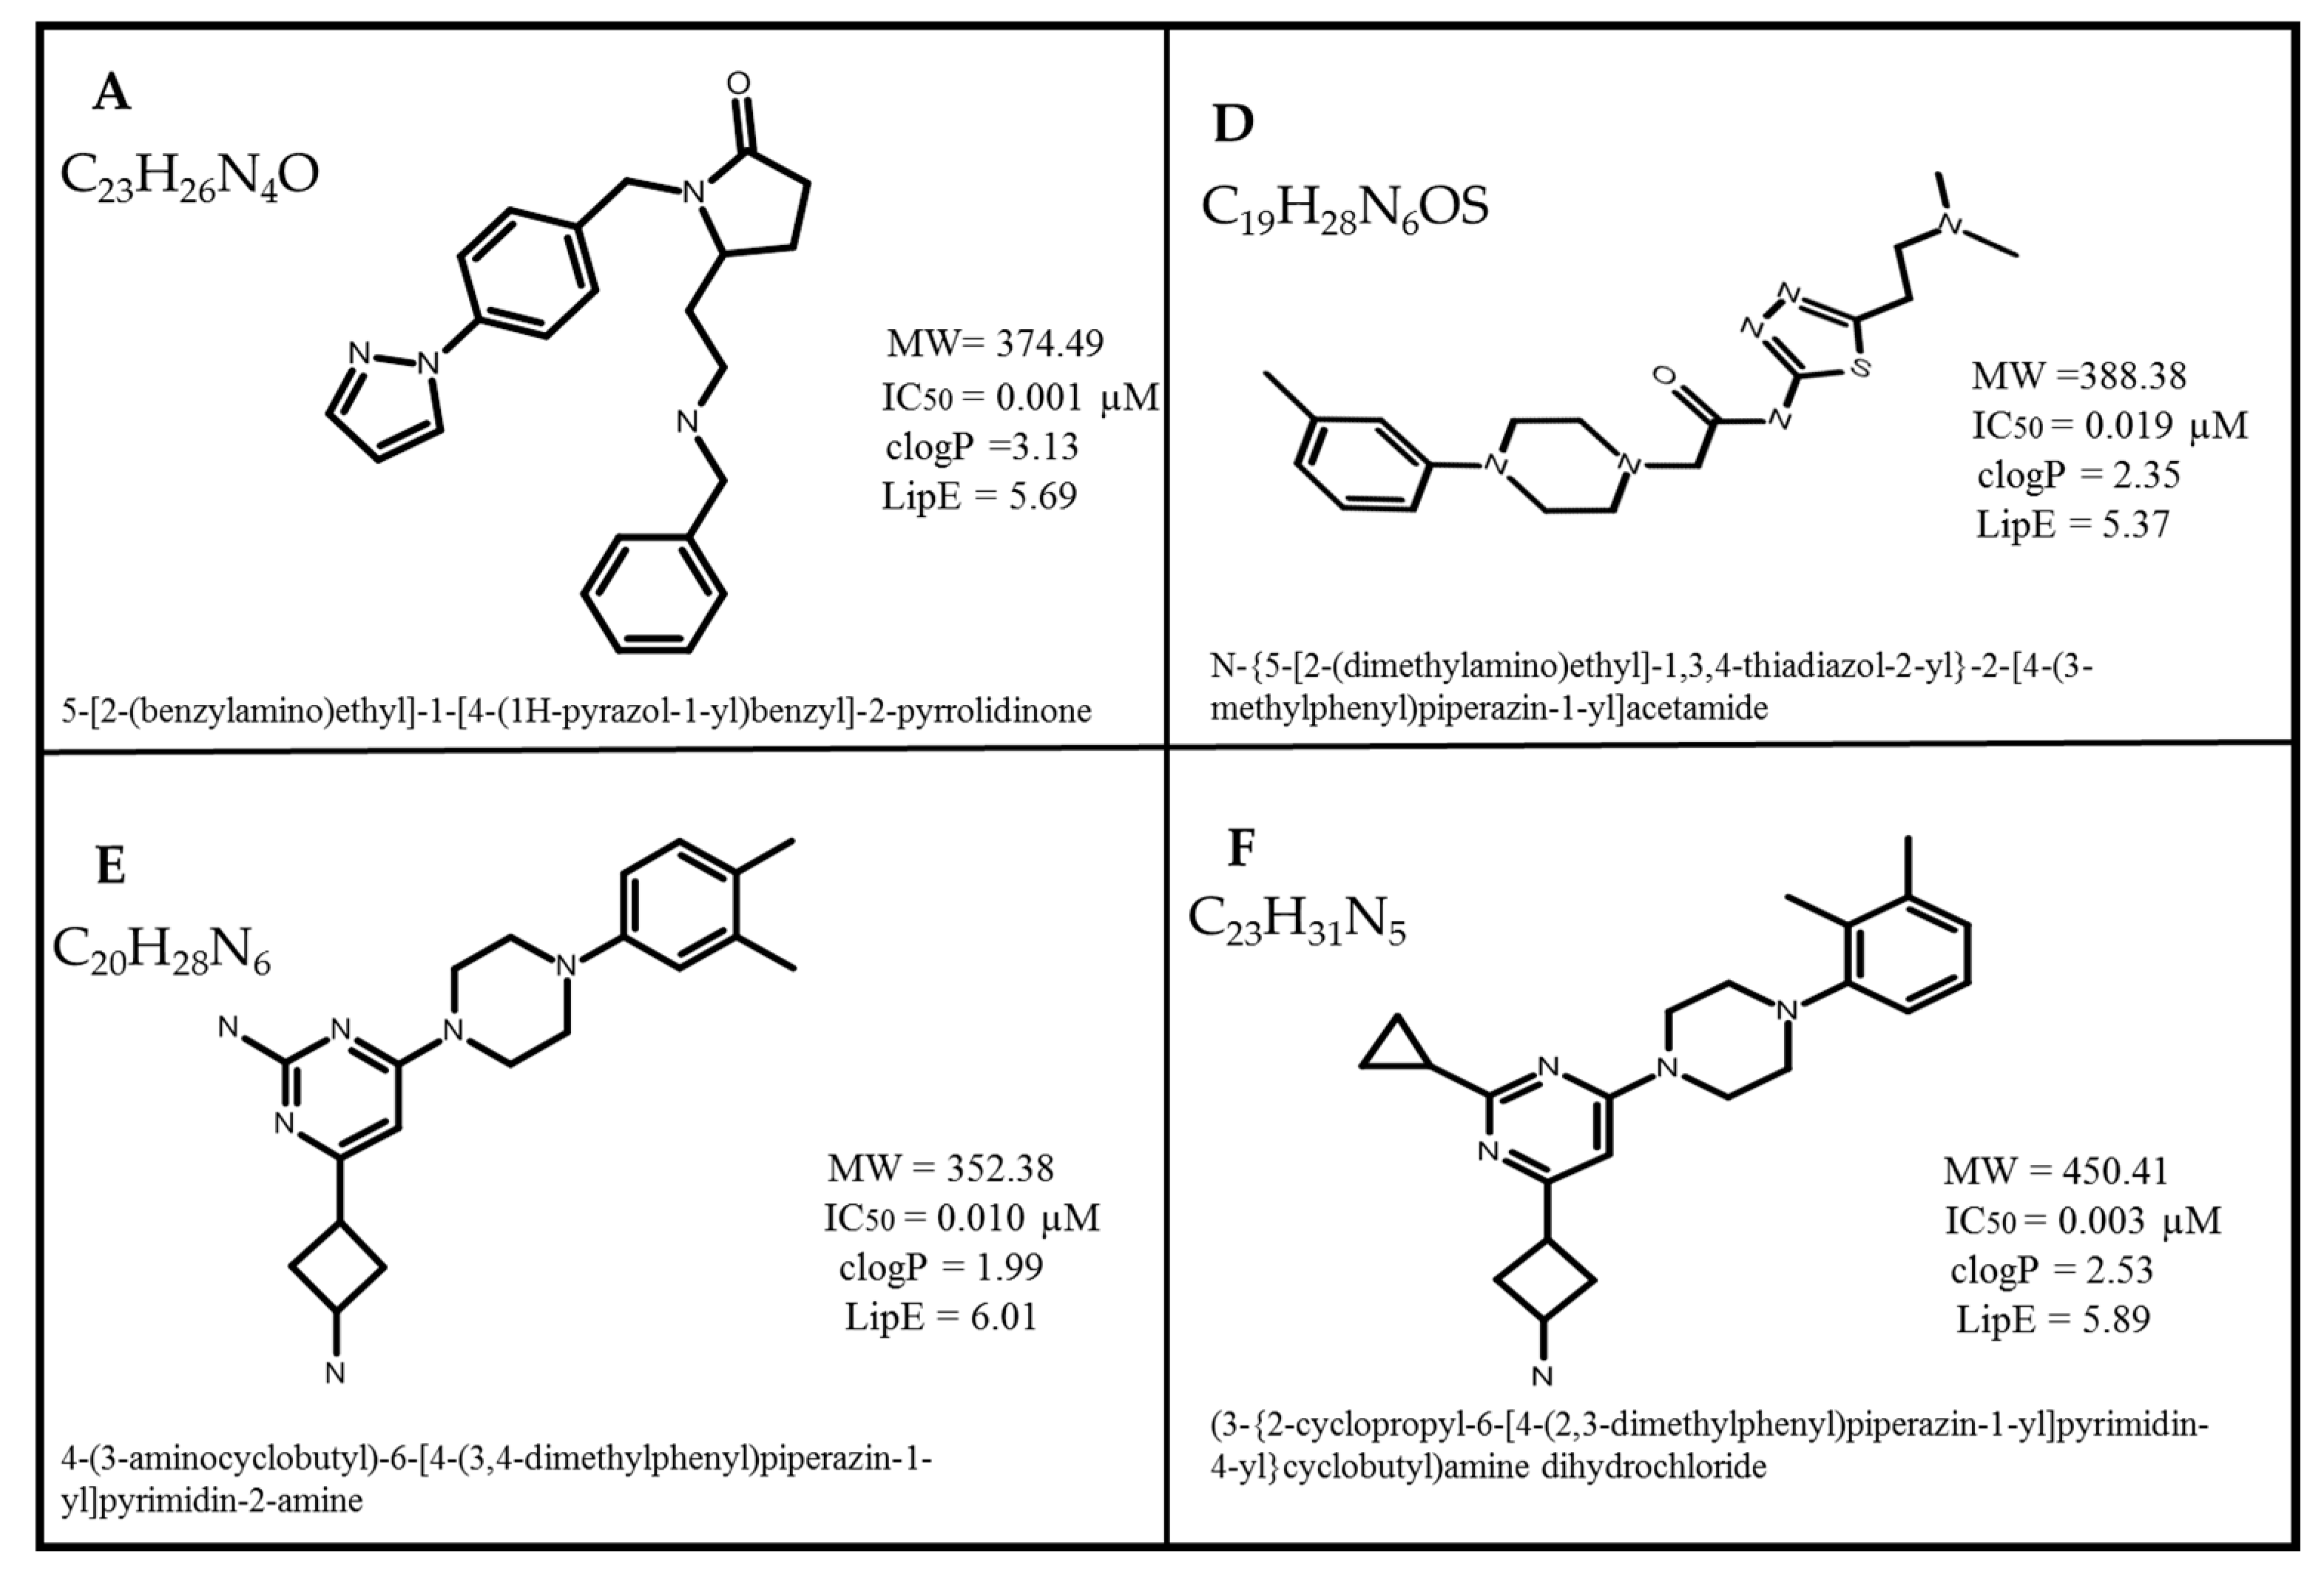
2.1. Dataset Collection
2.2. Molecular Docking Simulation, SAR and Pose Analysis
2.3. Calculation of Physicochemical Parameters and Statistical Analyses
2.4. Molecular Dynamic Simulation
- N is the number of atoms in the atom selection.
- tref is the reference time (typically the first frame is used as the reference and it is regarded as time t = 0).
- r is the position of the selected atoms in frame x after superimposing on the reference frame, where frame x is recorded at time tx.
- T is the trajectory time for the RMSF.
- tref is the reference time.
- ri is the position of residue i.
- r is the position of atoms in residue i after superposition on the reference.
2.5. Pharmacokinetic Analysis
3. Results
3.1. Molecular Docking Simulation
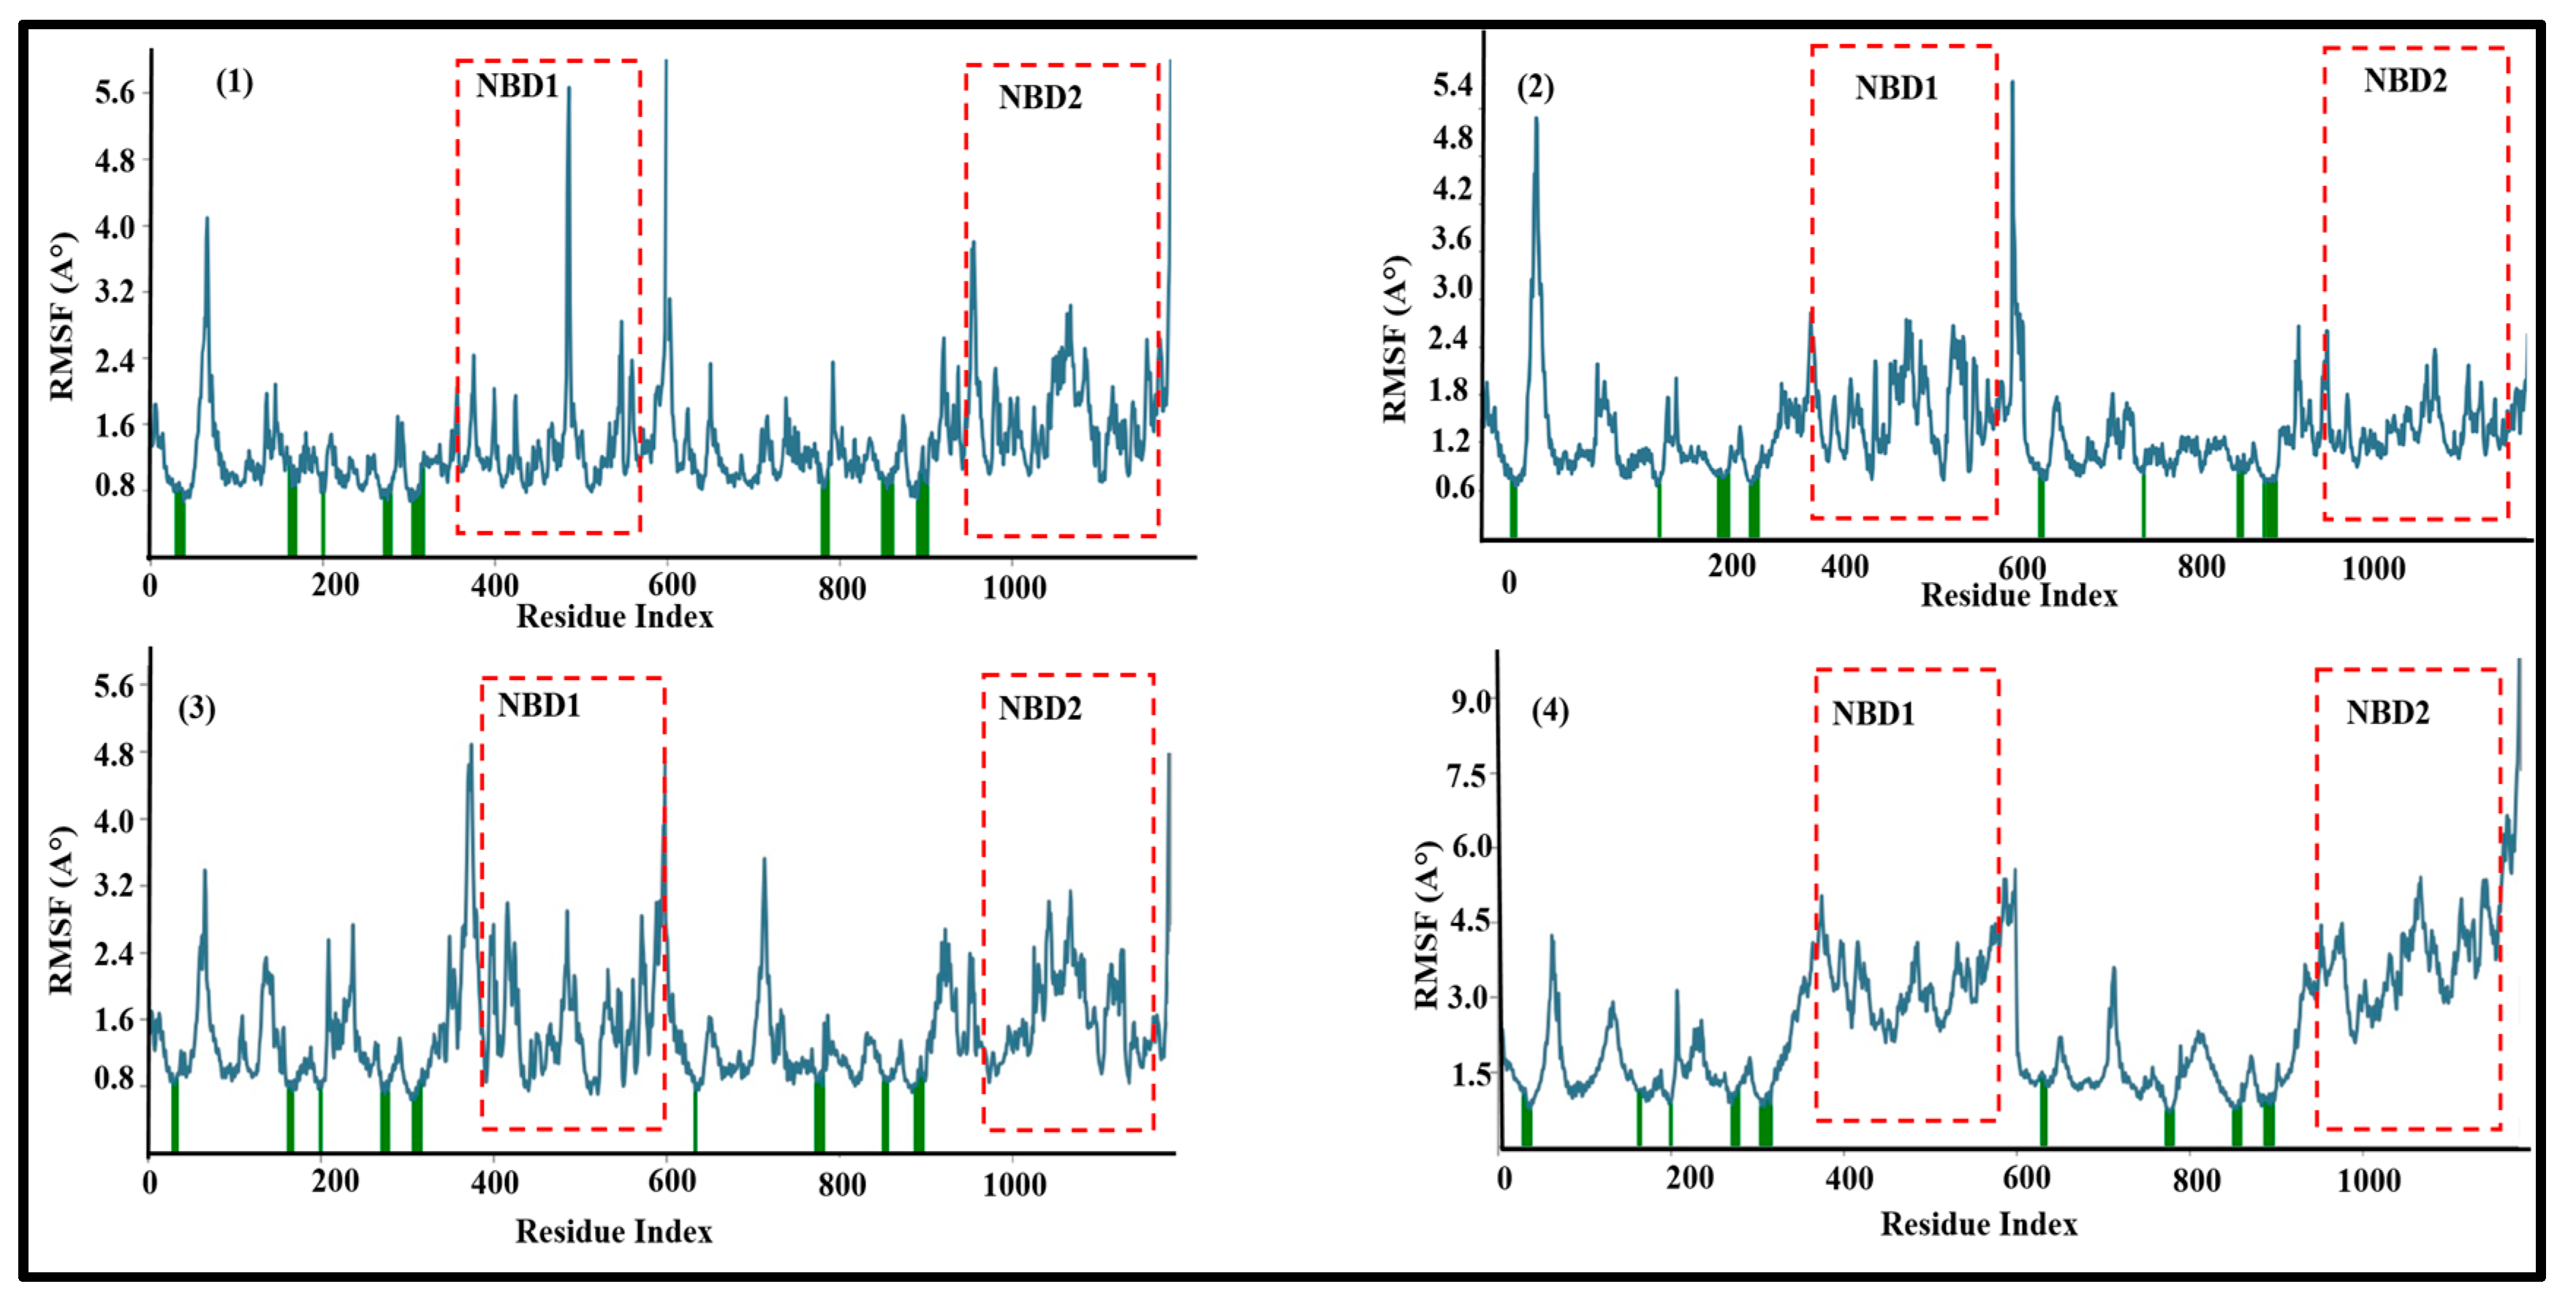
3.2. Molecular Dynamics Simulations of Leads
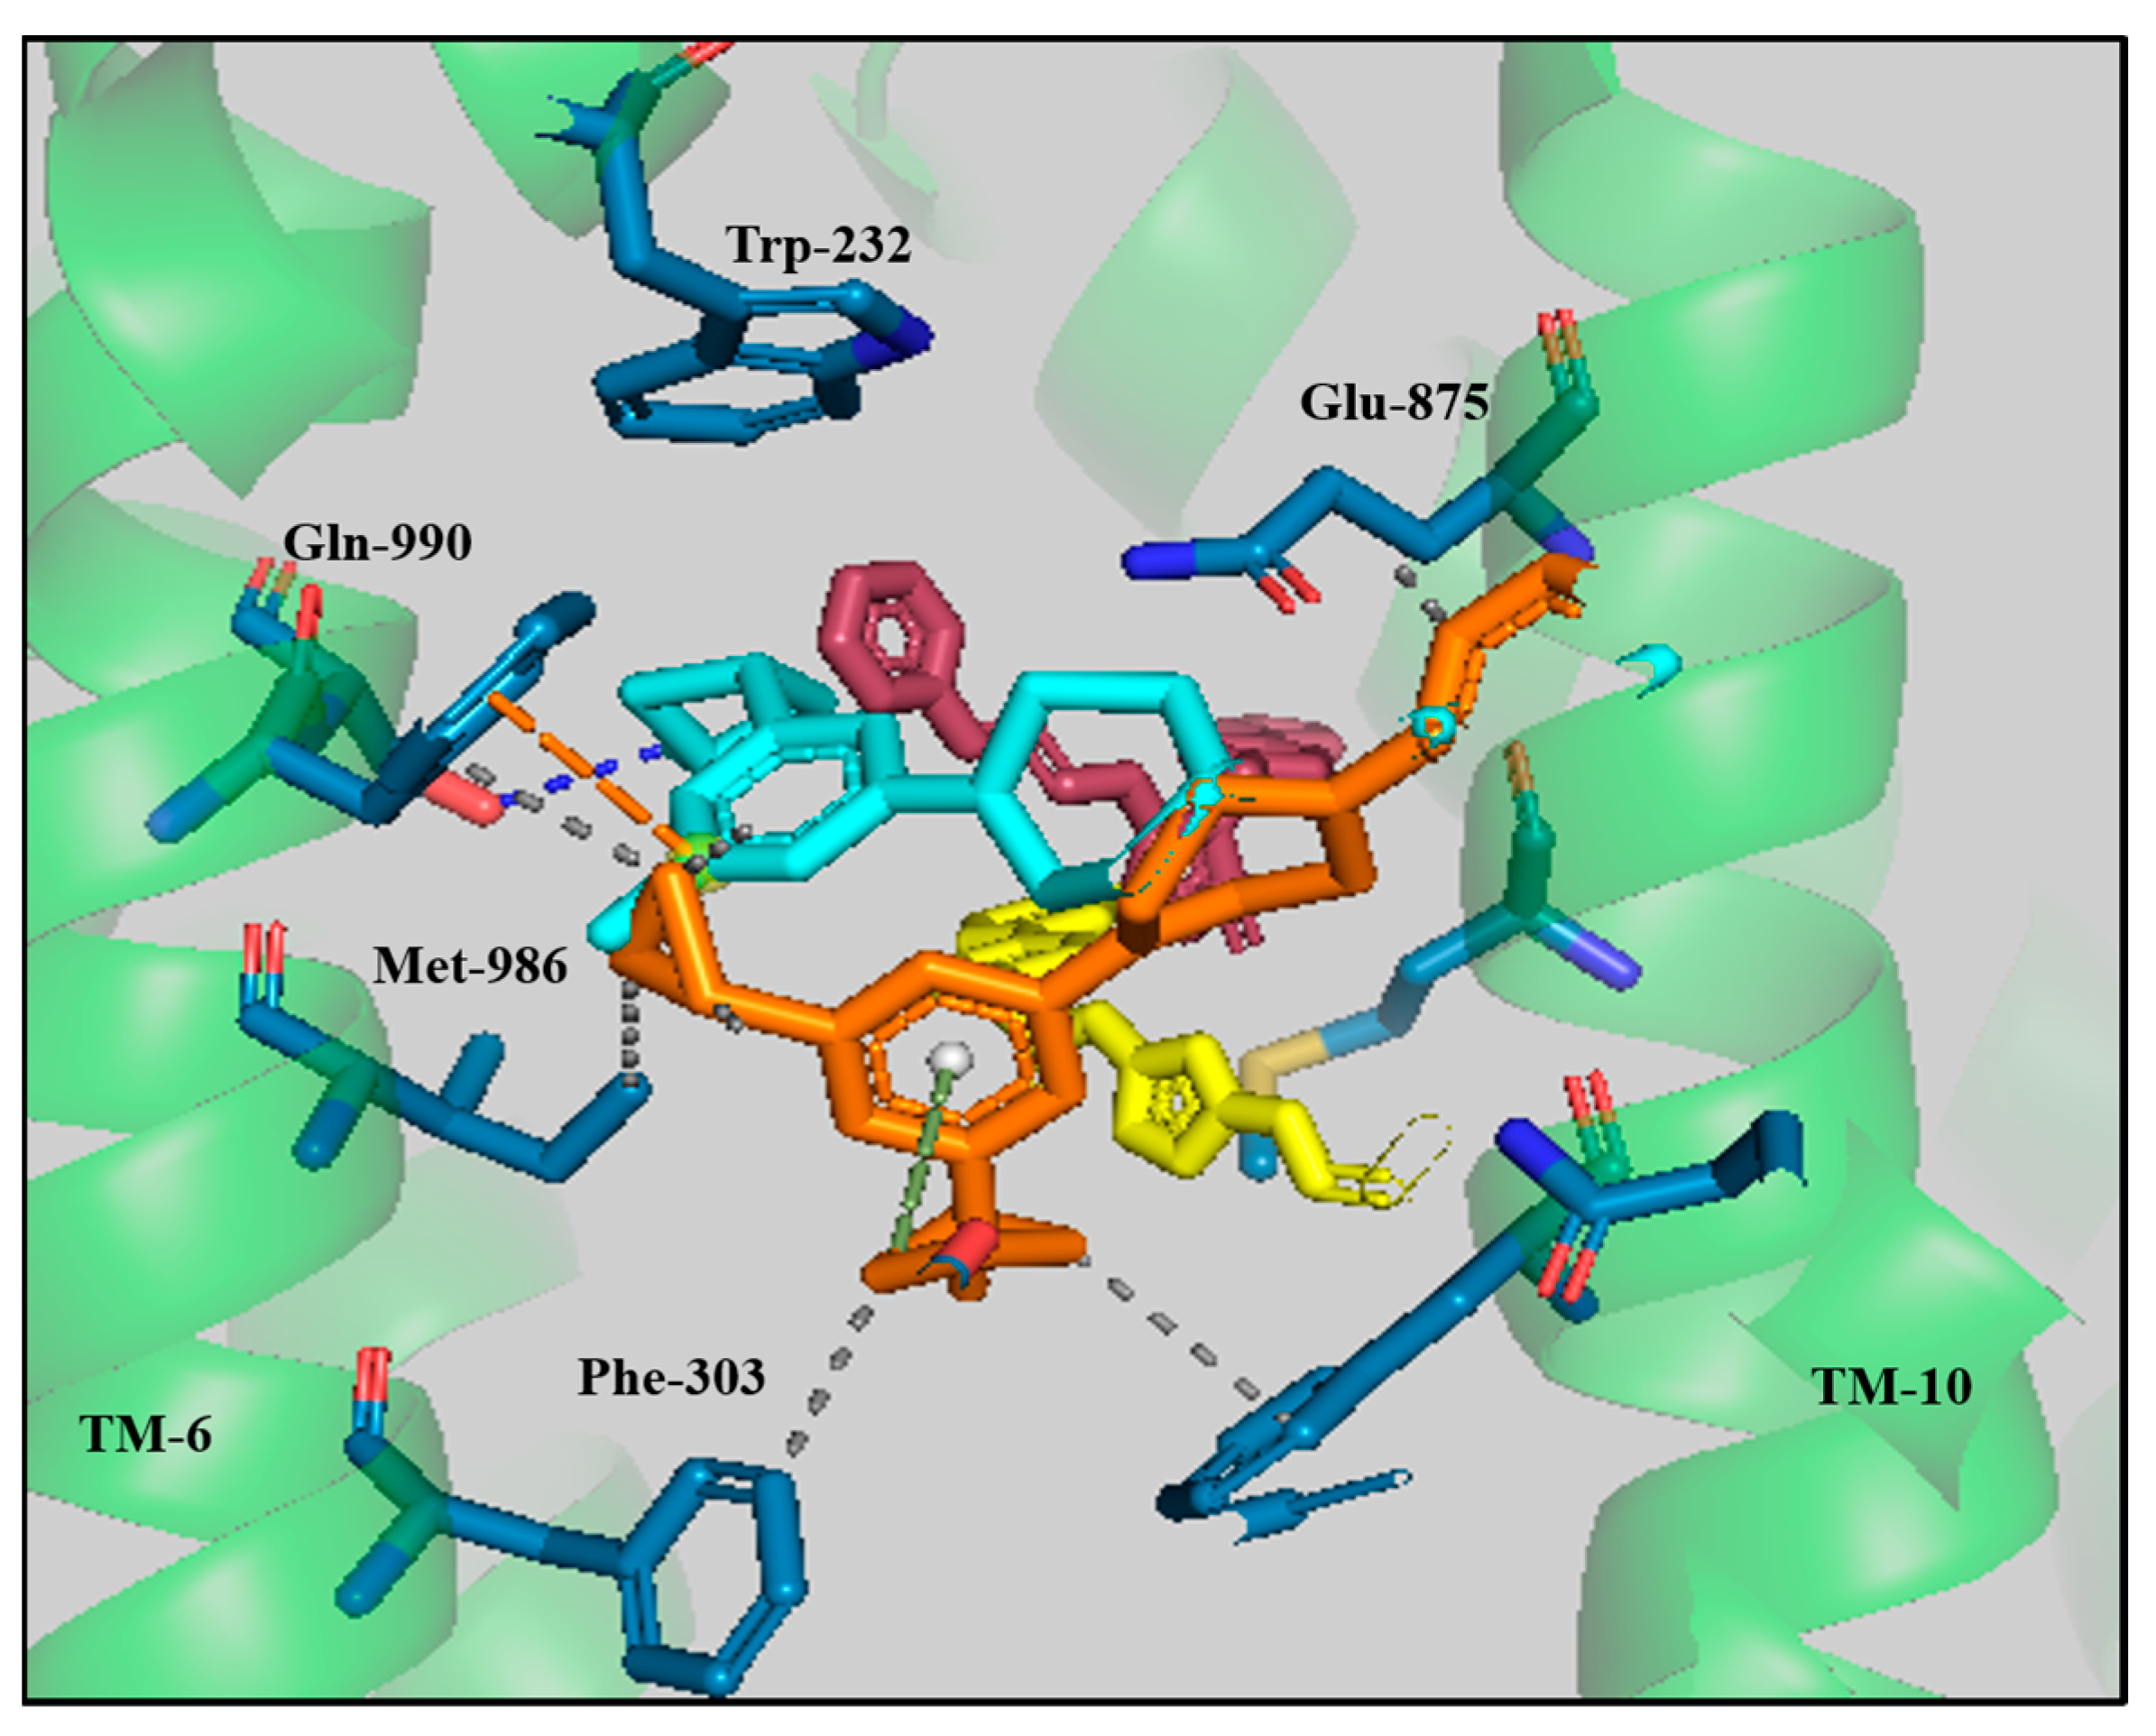
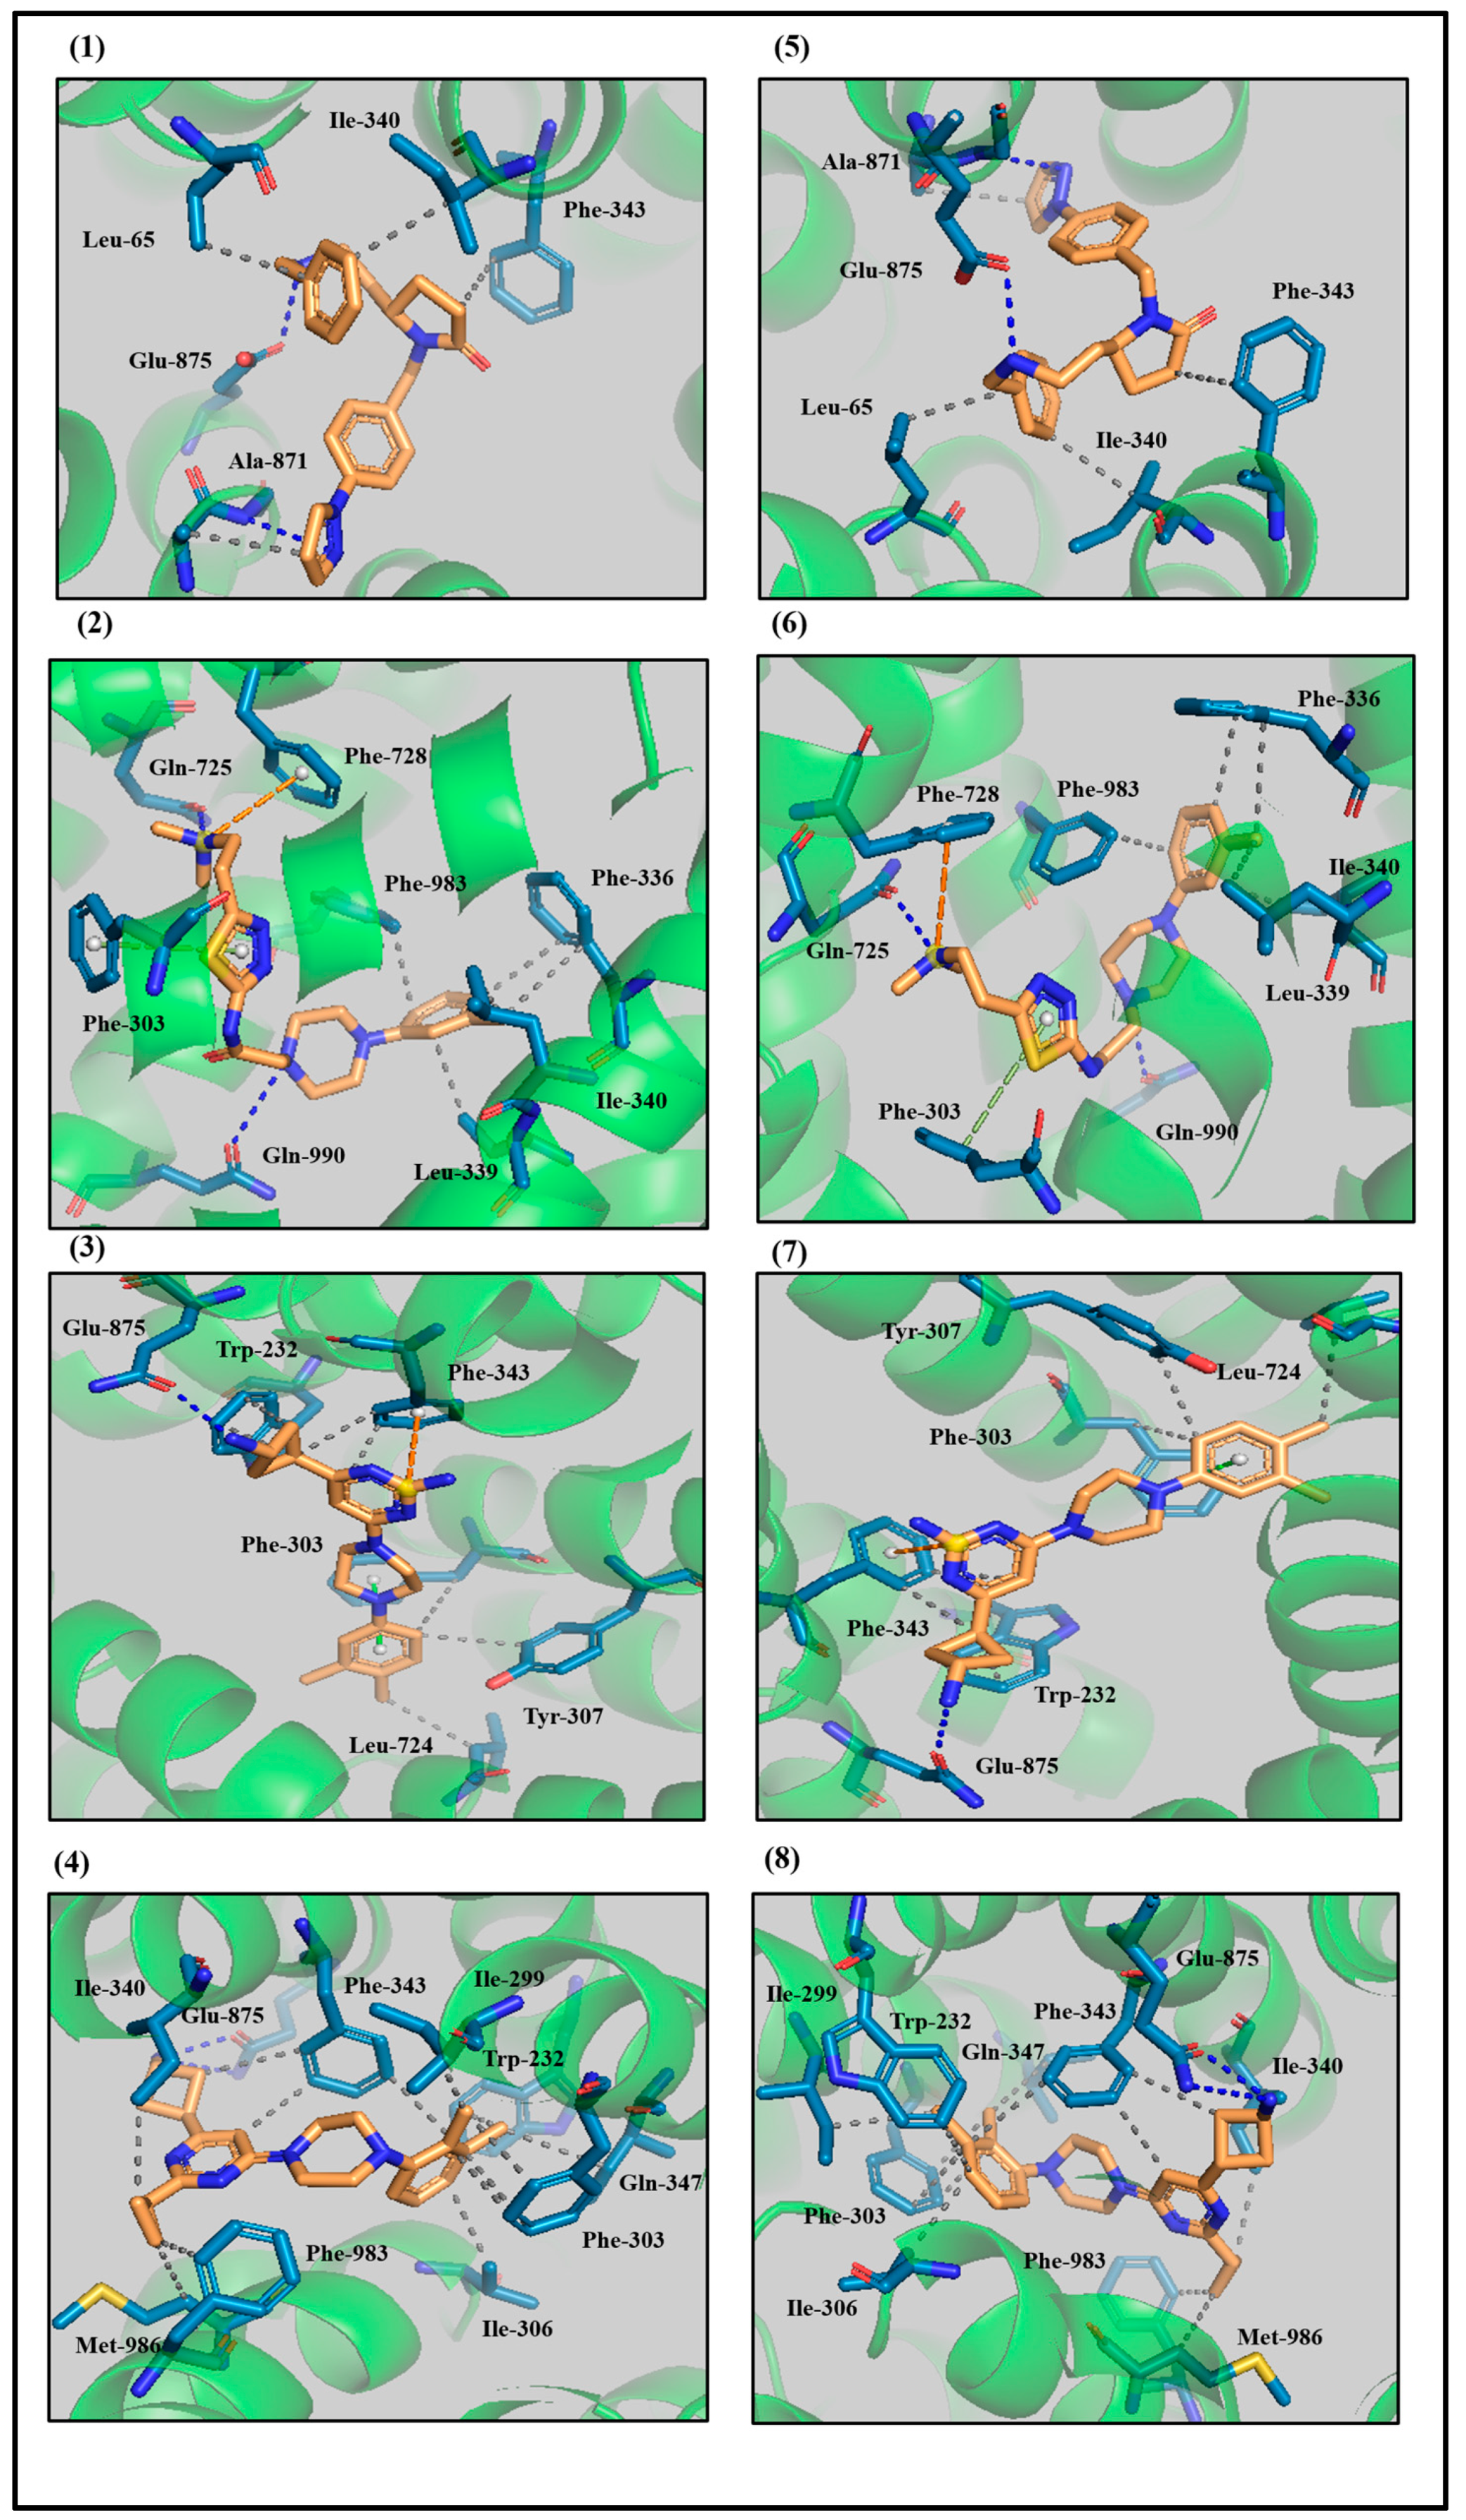
3.3. Protein–Ligand Interaction Analyses of Lead Compounds Pre- and Post-MD Simulations
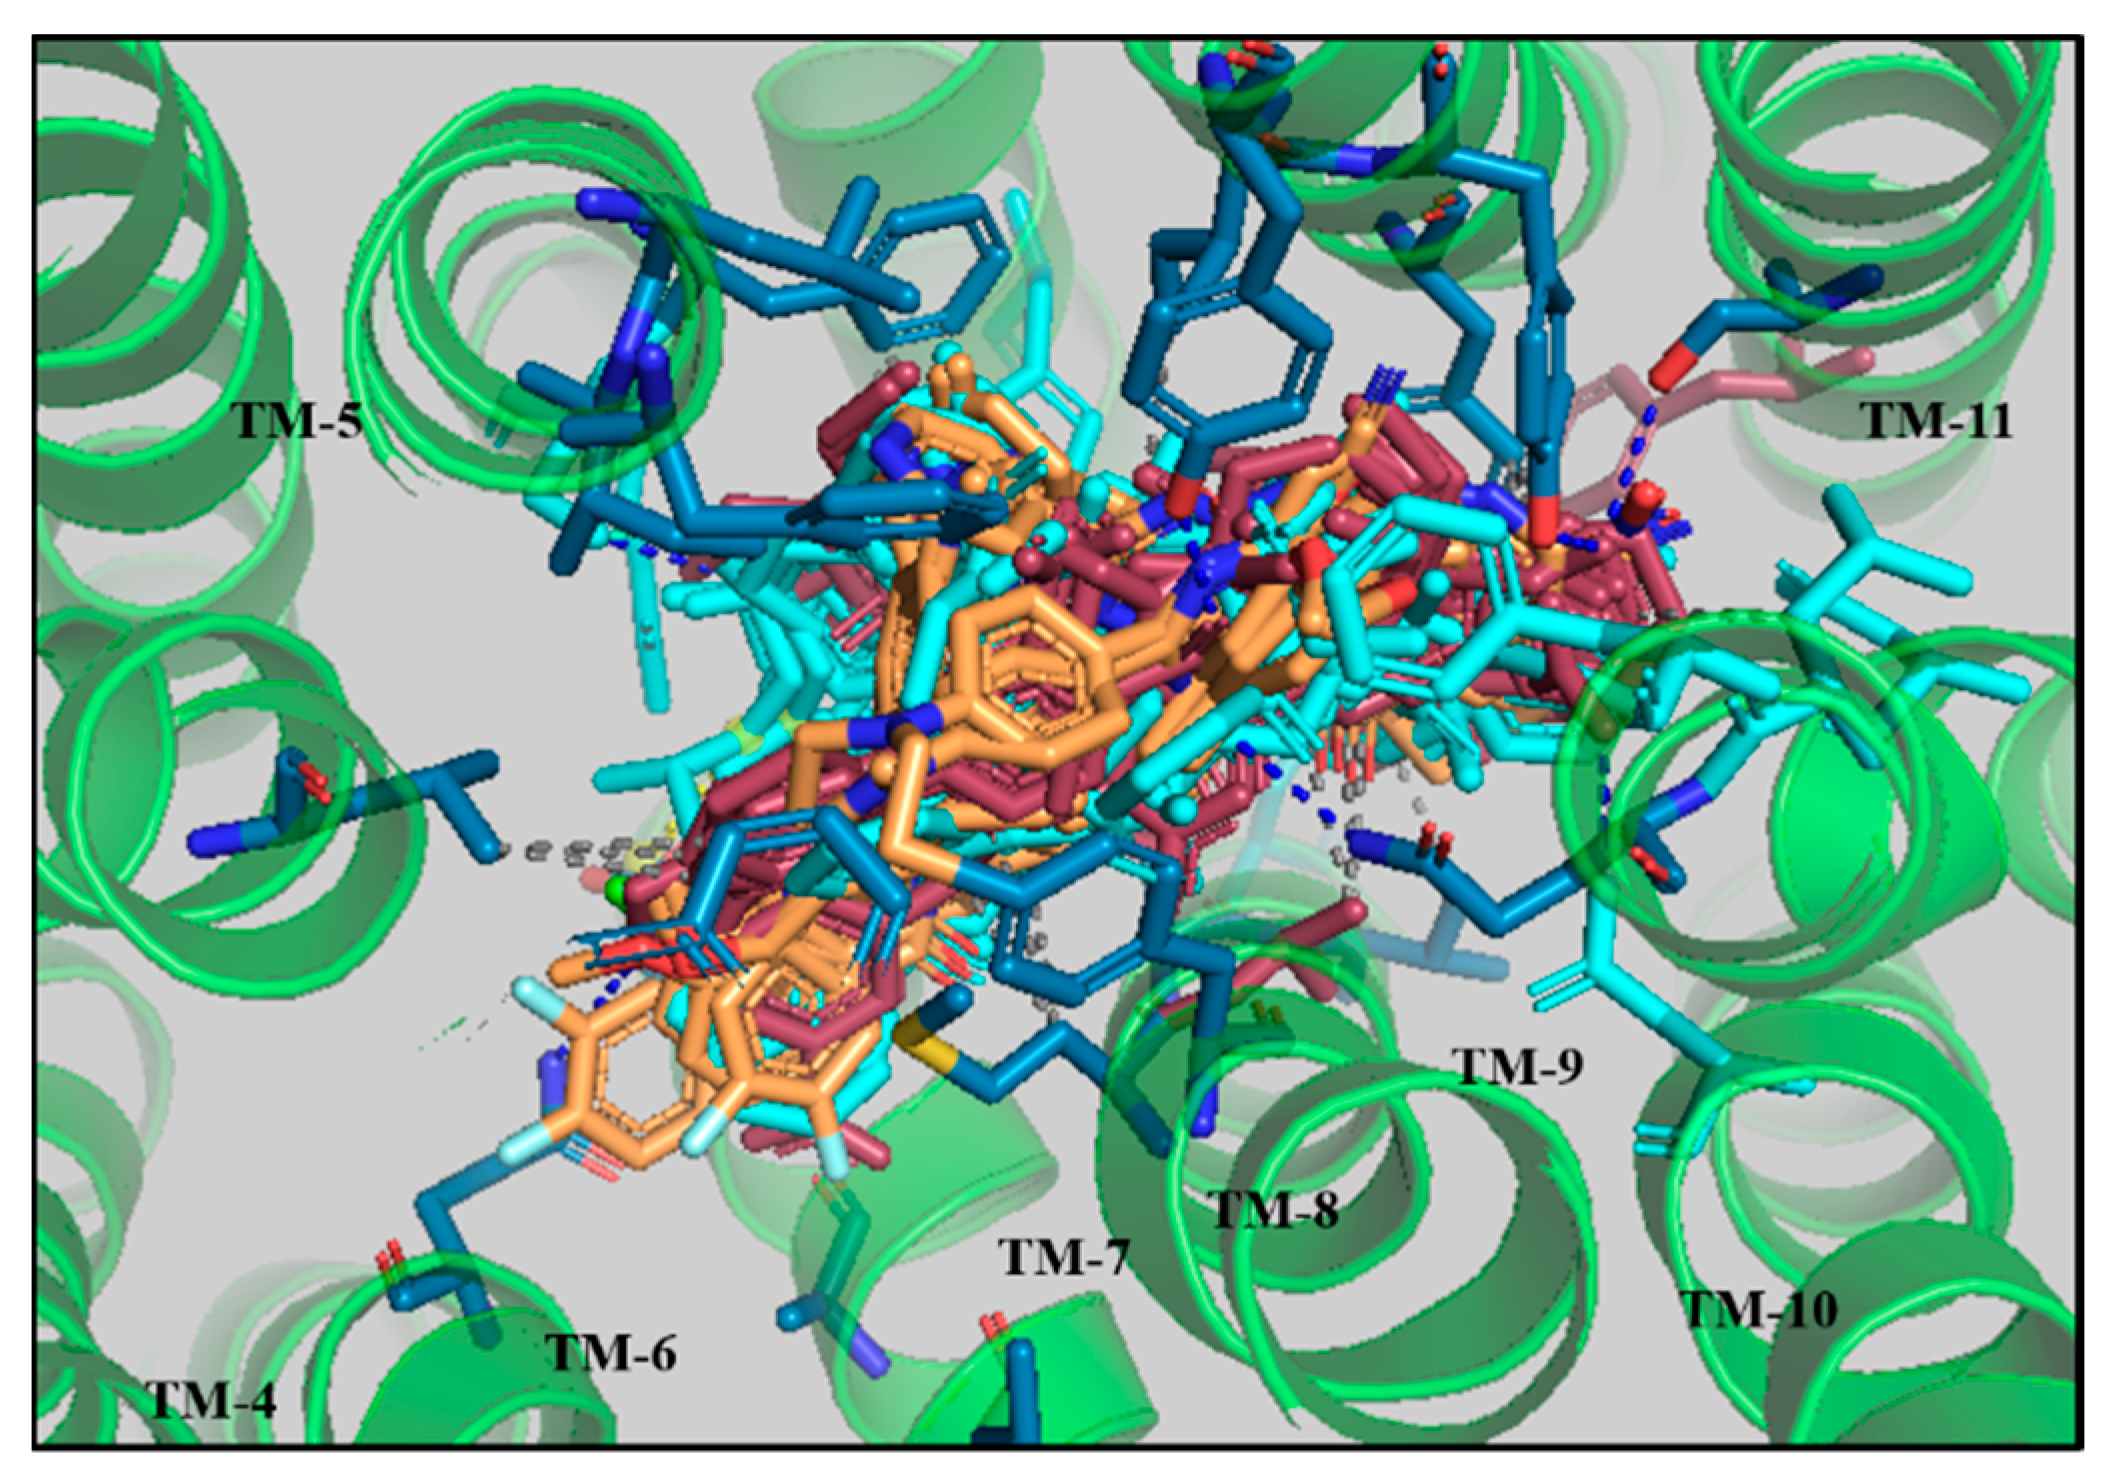
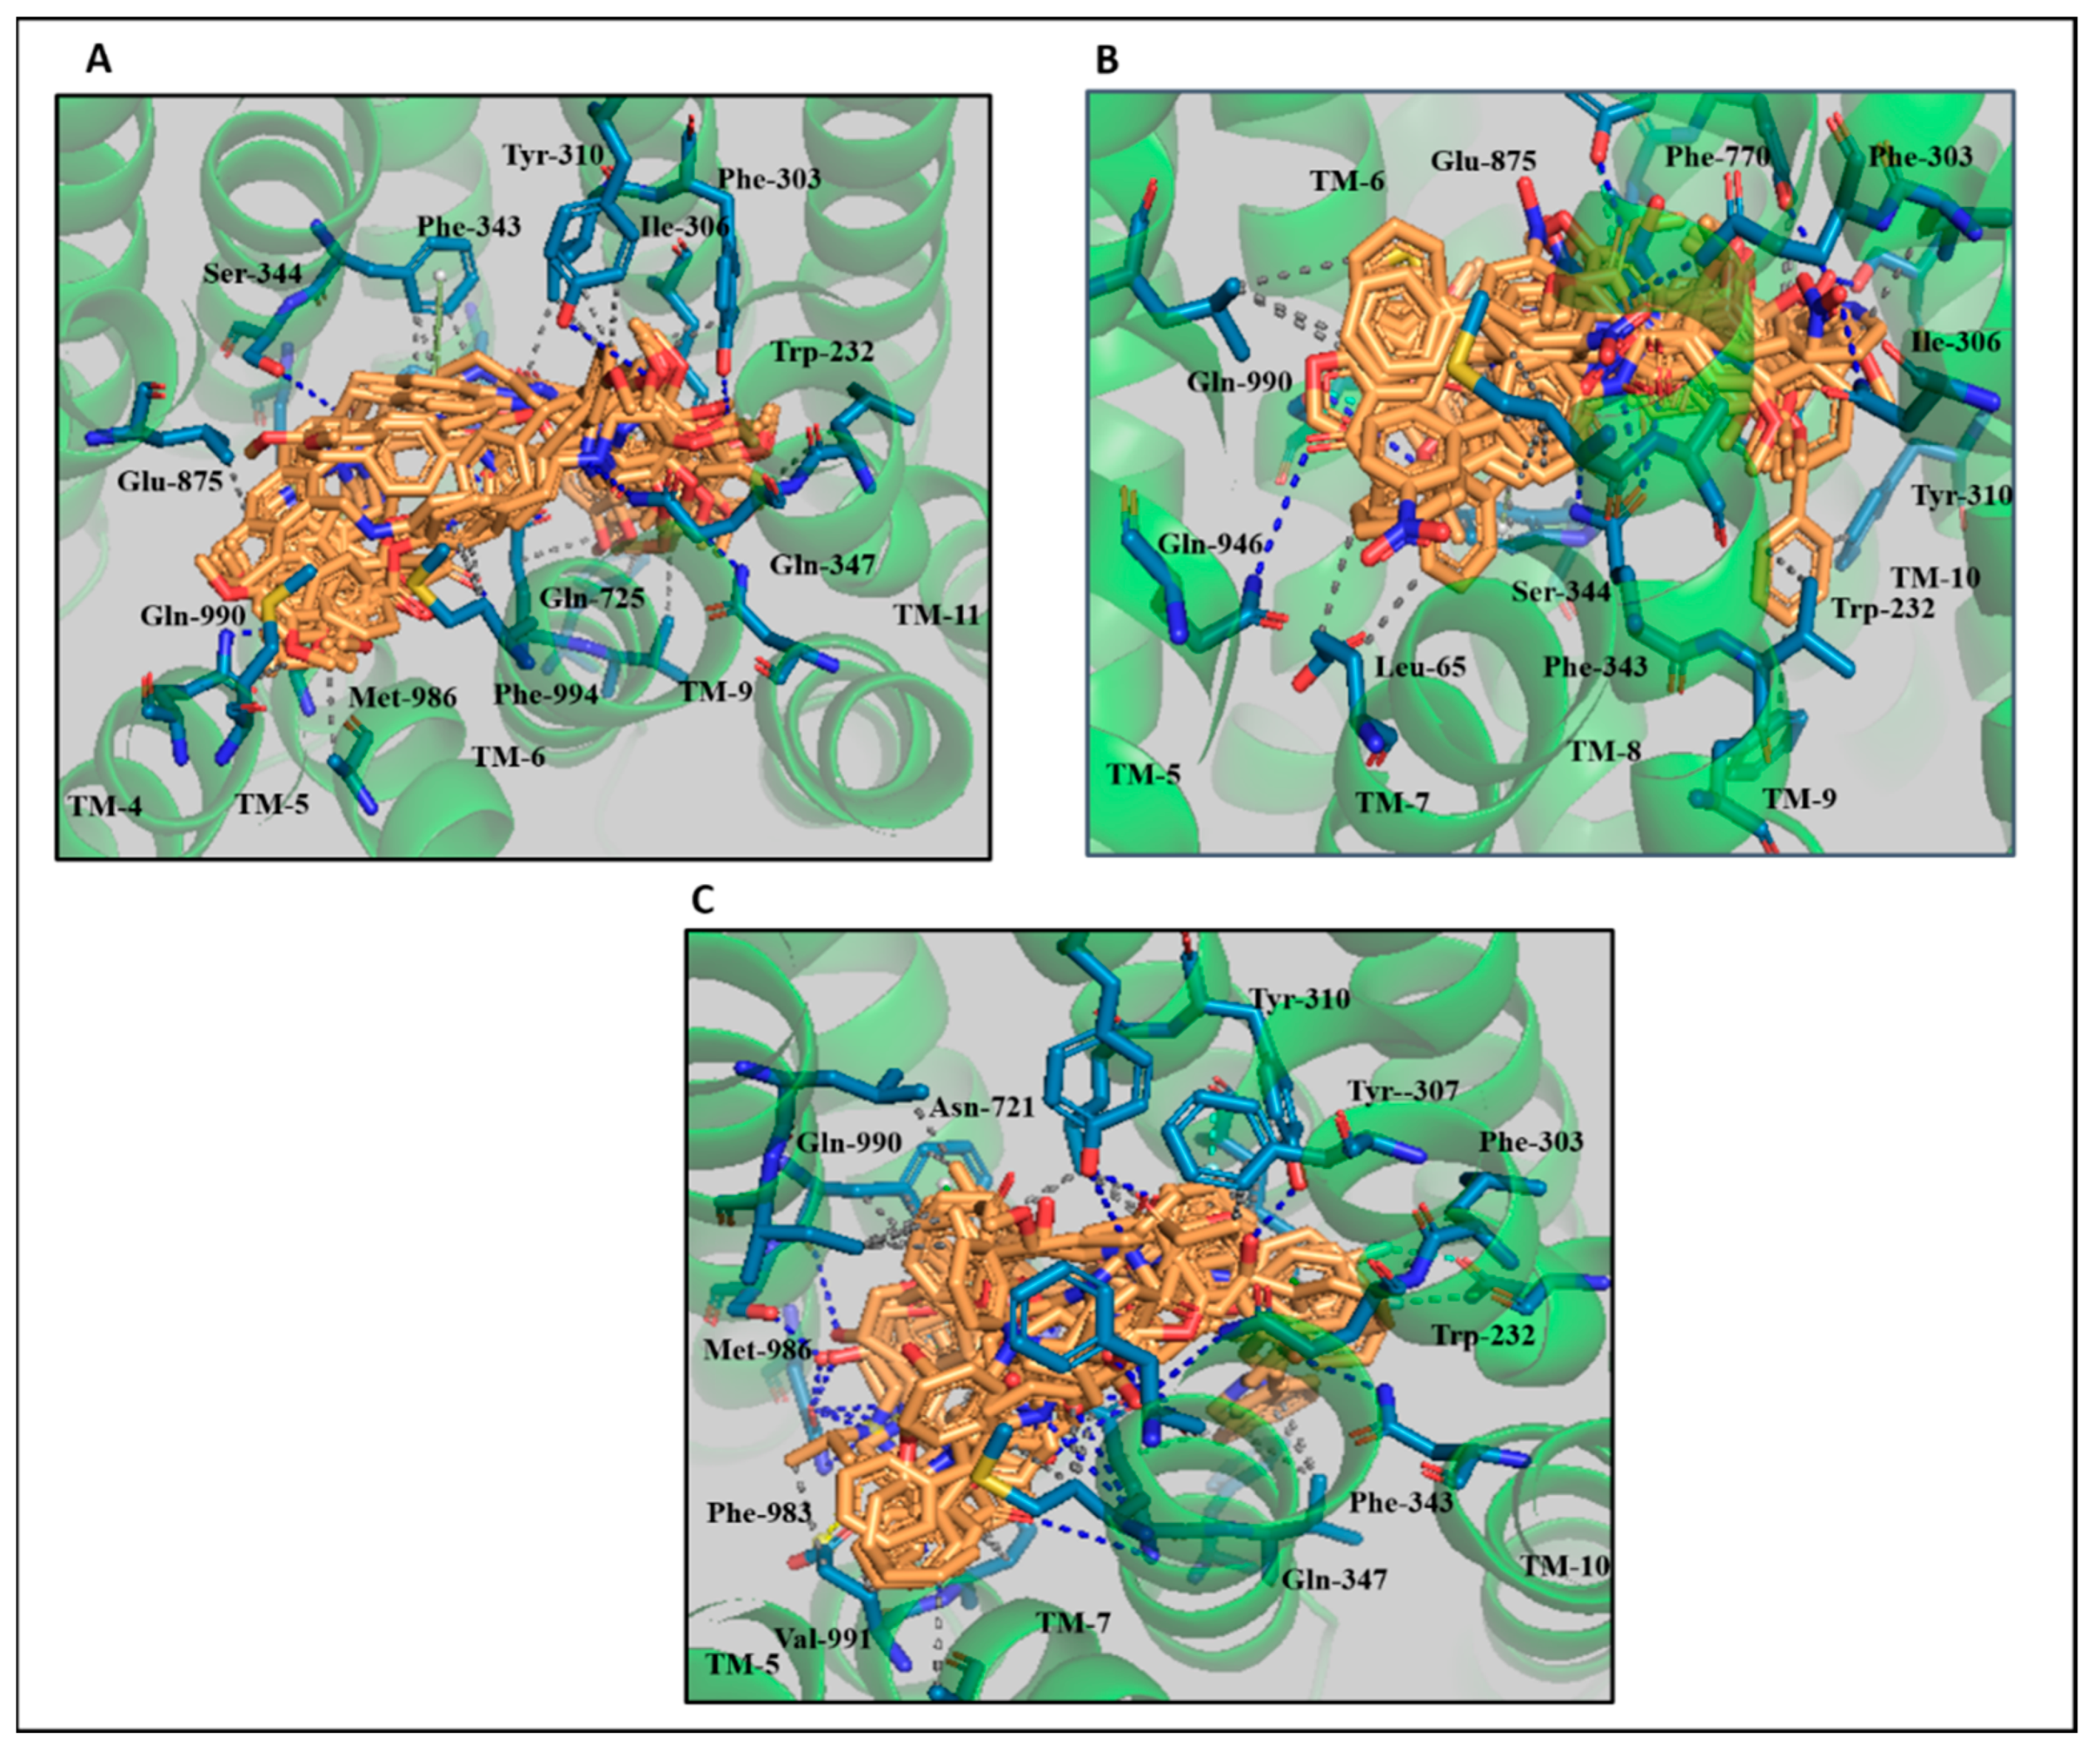
3.4. Comparative Interaction Analysis of Lead Compounds with the Selective ABCB1 Dataset
3.5. Pharmacokinetic Analysis
4. Discussion
5. Conclusions
Supplementary Materials
Author Contributions
Funding
Institutional Review Board Statement
Informed Consent Statement
Data Availability Statement
Acknowledgments
Conflicts of Interest
References
- Wu, C.-P.; Hung, C.-Y.; Hsieh, Y.-J.; Murakami, M.; Huang, Y.-H.; Su, T.-Y.; Hung, T.-H.; Yu, J.-S.; Wu, Y.-S.; Ambudkar, S.V. ABCB1 and ABCG2 Overexpression Mediates Resistance to the Phosphatidylinositol 3-Kinase Inhibitor HS-173 in Cancer Cell Lines. Cells 2023, 12, 1056. [Google Scholar] [CrossRef] [PubMed]
- da Costa, K.M.; Freire-de-Lima, L.; da Fonseca, L.M.; Previato, J.O.; Mendonça-Previato, L.; Valente, R.d.C. ABCB1 and ABCC1 Function during TGF-β-Induced Epithelial-Mesenchymal Transition: Relationship between Multidrug Resistance and Tumor Progression. Int. J. Mol. Sci. 2023, 24, 6046. [Google Scholar] [CrossRef] [PubMed]
- Yin, Y.; Xin, Y.; Zhang, F.; An, D.; Fan, H.; Qin, M.; Xia, J.; Xi, T.; Xiong, J. Overcoming ABCB1-mediated multidrug resistance by transcription factor BHLHE40. Neoplasia 2023, 39, 100891. [Google Scholar] [CrossRef] [PubMed]
- Zhang, Y.; Li, C.; Xia, C.; To, K.K.W.; Guo, Z.; Ren, C.; Wen, L.; Wang, F.; Fu, L.; Liao, N. Adagrasib Reverses Cancer Multidrug Resistance Mediated by the Transporter Protein ABCB1. Res. Sq. 2023. [Google Scholar] [CrossRef]
- Fan, Y.; Tao, T.; Guo, Z.; To, K.K.W.; Chen, D.; Wu, S.; Yang, C.; Li, J.; Luo, M.; Wang, F. Lazertinib improves the efficacy of chemotherapeutic drugs in ABCB1 or ABCG2 overexpression cancer cells in vitro, in vivo, and ex vivo. Mol. Ther.-Oncolytics 2022, 24, 636–649. [Google Scholar] [CrossRef] [PubMed]
- Wu, C.-P.; Hsiao, S.-H.; Huang, Y.-H.; Hung, L.-C.; Yu, Y.-J.; Chang, Y.-T.; Hung, T.-H.; Wu, Y.-S. Sitravatinib sensitizes ABCB1-and ABCG2-overexpressing multidrug-resistant cancer cells to chemotherapeutic drugs. Cancers 2020, 12, 195. [Google Scholar] [CrossRef] [PubMed]
- Li, H.; Zhang, S.-L.; Jia, Y.-H.; Li, Q.; Feng, Z.-W.; Zhang, S.-D.; Zheng, W.; Zhou, Y.-L.; Li, L.-L.; Liu, X.-C. Imidazo [1, 2-a] Pyridine Derivatives as Novel Dual-Target Inhibitors of ABCB1 and ABCG2 for Reversing Multidrug Resistance. J. Med. Chem. 2023, 66, 2804–2831. [Google Scholar] [CrossRef] [PubMed]
- Schäfer, J.; Klösgen, V.J.; Omer, E.A.; Kadioglu, O.; Mbaveng, A.T.; Kuete, V.; Hildebrandt, A.; Efferth, T. In Silico and In Vitro Identification of P-Glycoprotein Inhibitors from a Library of 375 Phytochemicals. Int. J. Mol. Sci. 2023, 24, 10240. [Google Scholar] [CrossRef]
- Reitberger, M. Regulation of ABCB1 Expression Is a Potential Therapeutic Target in Drug Resistant Pancreatic Cancer. Ph.D. Thesis, Combined Faculty of Natural Sciences and Mathematics of the Ruperto Carola University Heidelberg, Heidelberg, Germany, 2022. [Google Scholar]
- Lei, Z.N.; Tian, Q.; Teng, Q.X.; Wurpel, J.N.; Zeng, L.; Pan, Y.; Chen, Z.S. Understanding and targeting resistance mechanisms in cancer. MedComm 2023, 4, e265. [Google Scholar] [CrossRef]
- Narayanan, S.; Cai, C.-Y.; Assaraf, Y.G.; Guo, H.-Q.; Cui, Q.; Wei, L.; Huang, J.-J.; Ashby, C.R., Jr.; Chen, Z.-S. Targeting the ubiquitin-proteasome pathway to overcome anti-cancer drug resistance. Drug Resist. Updates 2020, 48, 100663. [Google Scholar] [CrossRef]
- Engle, K.; Kumar, G. Cancer multidrug-resistance reversal by ABCB1 inhibition: A recent update. Eur. J. Med. Chem. 2022, 239, 114542. [Google Scholar] [CrossRef] [PubMed]
- Pote, M.S.; Gacche, R.N. ATP-binding cassette efflux transporters and MDR in cancer. Drug Discov. Today 2023, 28, 103537. [Google Scholar] [CrossRef]
- Kim, Y.; Chen, J. Molecular structure of human P-glycoprotein in the ATP-bound, outward-facing conformation. Science 2018, 359, 915–919. [Google Scholar] [CrossRef] [PubMed]
- Alam, A.; Kowal, J.; Broude, E.; Roninson, I.; Locher, K.P. Structural insight into substrate and inhibitor discrimination by human P-glycoprotein. Science 2019, 363, 753–756. [Google Scholar] [CrossRef] [PubMed]
- Nosol, K.; Romane, K.; Irobalieva, R.N.; Alam, A.; Kowal, J.; Fujita, N.; Locher, K.P. Cryo-EM structures reveal distinct mechanisms of inhibition of the human multidrug transporter ABCB1. Proc. Natl. Acad. Sci. USA 2020, 117, 26245–26253. [Google Scholar] [CrossRef]
- Urgaonkar, S.; Nosol, K.; Said, A.M.; Nasief, N.N.; Bu, Y.; Locher, K.P.; Lau, J.Y.; Smolinski, M.P. Discovery and characterization of potent dual P-glycoprotein and CYP3A4 inhibitors: Design, synthesis, cryo-EM analysis, and biological evaluations. J. Med. Chem. 2021, 65, 191–216. [Google Scholar] [CrossRef]
- Robey, R.W.; Pluchino, K.M.; Hall, M.D.; Fojo, A.T.; Bates, S.E.; Gottesman, M.M. Revisiting the role of ABC transporters in multidrug-resistant cancer. Nat. Rev. Cancer 2018, 18, 452–464. [Google Scholar] [CrossRef]
- Ibrahim, M.A.; Abdeljawaad, K.A.; Abdelrahman, A.H.; Jaragh-Alhadad, L.A.; Oraby, H.F.; Elkaeed, E.B.; Mekhemer, G.A.; Gabr, G.A.; Shawky, A.M.; Sidhom, P.A. Exploring natural product activity and species source candidates for hunting ABCB1 transporter inhibitors: An in silico drug discovery study. Molecules 2022, 27, 3104. [Google Scholar] [CrossRef]
- Yang, Z.; Cai, Y.; Yang, X.; Li, Y.; Wu, Q.; Yu, Y.; Chen, Z.; Wei, B.; Tian, J.-M.; Bao, X. Novel Benzo Five-Membered Heterocycle Derivatives as P-Glycoprotein Inhibitors: Design, Synthesis, Molecular Docking, and Anti-Multidrug Resistance Activity. J. Med. Chem. 2023, 66, 5550–5566. [Google Scholar] [CrossRef]
- Cheema, Y.; Kiani, Y.S.; Linton, K.J.; Jabeen, I. Identification and Empiric Evaluation of New Inhibitors of the Multidrug Transporter P-Glycoprotein (ABCB1). Int. J. Mol. Sci. 2023, 24, 5298. [Google Scholar] [CrossRef]
- Teodori, E.; Dei, S.; Bartolucci, G.; Perrone, M.G.; Manetti, D.; Romanelli, M.N.; Contino, M.; Colabufo, N.A. Structure–Activity Relationship Studies on 6, 7-Dimethoxy-2-phenethyl-1, 2, 3, 4-tetrahydroisoquinoline Derivatives as Multidrug Resistance Reversers. ChemMedChem 2017, 12, 1369–1379. [Google Scholar] [CrossRef] [PubMed]
- Pellicani, R.Z.; Stefanachi, A.; Niso, M.; Carotti, A.; Leonetti, F.; Nicolotti, O.; Perrone, R.; Berardi, F.; Cellamare, S.; Colabufo, N.A. Potent galloyl-based selective modulators targeting multidrug resistance associated protein 1 and P-glycoprotein. J. Med. Chem. 2012, 55, 424–436. [Google Scholar] [CrossRef]
- Kühnle, M.; Egger, M.; Müller, C.; Mahringer, A.; Bernhardt, G.n.; Fricker, G.; König, B.; Buschauer, A. Potent and selective inhibitors of breast cancer resistance protein (ABCG2) derived from the p-glycoprotein (ABCB1) modulator tariquidar. J. Med. Chem. 2009, 52, 1190–1197. [Google Scholar] [CrossRef] [PubMed]
- Cramer, J.; Kopp, S.; Bates, S.E.; Chiba, P.; Ecker, G.F. Multispecificity of drug transporters: Probing inhibitor selectivity for the human drug efflux transporters ABCB1 and ABCG2. ChemMedChem Chem. Enabling Drug Discov. 2007, 2, 1783–1788. [Google Scholar] [CrossRef] [PubMed]
- Jones, G.; Willett, P.; Glen, R.C.; Leach, A.R.; Taylor, R. Development and validation of a genetic algorithm for flexible docking. J. Mol. Biol. 1997, 267, 727–748. [Google Scholar] [CrossRef] [PubMed]
- Bank, P.D. Protein data bank. Nat. New Biol. 1971, 233, 223. [Google Scholar]
- Jójárt, B.; Martinek, T.A. Performance of the general amber force field in modeling aqueous POPC membrane bilayers. J. Comput. Chem. 2007, 28, 2051–2058. [Google Scholar] [CrossRef] [PubMed]
- Cousins, K.R. Computer review of ChemDraw ultra 12.0. J. Am. Chem. Soc. 2011, 133, 8388. [Google Scholar] [CrossRef]
- Kaushik, M. A review of innovative chemical drawing and spectra prediction computer software. Mediterr. J. Chem. 2014, 3, 759–766. [Google Scholar] [CrossRef]
- Konyar, D.; Hayati, O.; Arslan, Z. Molecular docking studies of cox inhibitors on wild-type ras. J. Fac. Pharm. Ank. Univ. 2022, 46, 23–34. [Google Scholar] [CrossRef]
- Salentin, S.; Schreiber, S.; Haupt, V.J.; Adasme, M.F.; Schroeder, M. PLIP: Fully automated protein–ligand interaction profiler. Nucleic Acids Res. 2015, 43, W443–W447. [Google Scholar] [CrossRef]
- Yuan, S.; Chan, H.S.; Hu, Z. Using PyMOL as a platform for computational drug design. Wiley Interdiscip. Rev. Comput. Mol. Sci. 2017, 7, e1298. [Google Scholar] [CrossRef]
- MOE (The Molecular Operating Environment), Software, Chemical Computing Group Inc.: Montreal, QC, Canada, 2016.
- BioByte—Bio-Loom (2021). BioByte—Bio-Loom. Available online: http://biobyte.com/bb/prod/bioloom.html (accessed on 10 November 2020).
- R Core Team. RStudio: Integrated Development for R; RStudio, Inc.: Boston, MA, USA, 2018. [Google Scholar]
- Bowers, K.J.; Chow, E.; Xu, H.; Dror, R.O.; Eastwood, M.P.; Gregersen, B.A.; Klepeis, J.L.; Kolossvary, I.; Moraes, M.A.; Sacerdoti, F.D. Scalable algorithms for molecular dynamics simulations on commodity clusters. In Proceedings of the 2006 ACM/IEEE Conference on Supercomputing, Tampa, FL, USA, 11–17 November 2006; pp. 84–es. [Google Scholar]
- Daina, A.; Michielin, O.; Zoete, V. SwissADME: A free web tool to evaluate pharmacokinetics, drug-likeness and medicinal chemistry friendliness of small molecules. Sci. Rep. 2017, 7, 42717. [Google Scholar] [CrossRef]
- Banerjee, P.; Eckert, A.O.; Schrey, A.K.; Preissner, R. ProTox-II: A webserver for the prediction of toxicity of chemicals. Nucleic Acids Res. 2018, 46, W257–W263. [Google Scholar] [CrossRef]
- Srivastava, R. Theoretical studies on the molecular properties, toxicity, and biological efficacy of 21 new chemical entities. ACS Omega 2021, 6, 24891–24901. [Google Scholar] [CrossRef] [PubMed]
- Pajeva, I.K.; Globisch, C.; Wiese, M. Combined pharmacophore modeling, docking, and 3D QSAR studies of ABCB1 and ABCC1 transporter inhibitors. ChemMedChem Chem. Enabling Drug Discov. 2009, 4, 1883–1896. [Google Scholar] [CrossRef] [PubMed]
- Mali, S.N.; Chaudhari, H.K. Computational studies on imidazo [1, 2-a] pyridine-3-carboxamide analogues as antimycobacterial agents: Common pharmacophore generation, atom-based 3D-QSAR, molecular dynamics simulation, QikProp, molecular docking and prime MMGBSA approaches. Open Pharm. Sci. J. 2018, 5, 12–23. [Google Scholar] [CrossRef]
- Mora Lagares, L.; Pérez-Castillo, Y.; Minovski, N.; Novič, M. Structure–Function Relationships in the Human P-Glycoprotein (ABCB1): Insights from Molecular Dynamics Simulations. Int. J. Mol. Sci. 2021, 23, 362. [Google Scholar] [CrossRef]
- Mora Lagares, L.; Novič, M. Recent Advances on P-Glycoprotein (ABCB1) Transporter Modelling with In Silico Methods. Int. J. Mol. Sci. 2022, 23, 14804. [Google Scholar] [CrossRef]
- Altenberg, G.A. Structure of multidrug-resistance proteins of the ATP-binding cassette (ABC) superfamily. Curr. Med. Chem.-Anti-Cancer Agents 2004, 4, 53–62. [Google Scholar] [CrossRef]
- Croop, J.M.; Guild, B.C.; Gros, P.; Housman, D.E. Genetics of multidrug resistance: Relationship of a cloned gene to the complete multidrug resistant phenotype. Cancer Res. 1987, 47, 5982–5988. [Google Scholar] [PubMed]
- Gros, P.; Neriah, Y.B.; Croop, J.M.; Housman, D.E. Isolation and expression of a complementary DNA that confers multidrug resistance. Nature 1986, 323, 728–731. [Google Scholar] [CrossRef]
- Tetko, I.V.; Jaroszewicz, I.; Platts, J.A.; Kuduk-Jaworska, J. Calculation of lipophilicity for Pt (II) complexes: Experimental comparison of several methods. J. Inorg. Biochem. 2008, 102, 1424–1437. [Google Scholar] [CrossRef] [PubMed]
- Żesławska, E.; Tejchman, W.; Kincses, A.; Spengler, G.; Nitek, W.; Żuchowski, G.; Szymańska, E. 5-Arylidenerhodanines as P-gp Modulators: An Interesting Effect of the Carboxyl Group on ABCB1 Function in Multidrug-Resistant Cancer Cells. Int. J. Mol. Sci. 2022, 23, 10812. [Google Scholar] [CrossRef] [PubMed]
- Jabeen, I.; Pleban, K.; Rinner, U.; Chiba, P.; Ecker, G.F. Structure–activity relationships, ligand efficiency, and lipophilic efficiency profiles of benzophenone-type inhibitors of the multidrug transporter P-glycoprotein. J. Med. Chem. 2012, 55, 3261–3273. [Google Scholar] [CrossRef]
- Leeson, P.D.; Springthorpe, B. The influence of drug-like concepts on decision-making in medicinal chemistry. Nat. Rev. Drug Discov. 2007, 6, 881–890. [Google Scholar] [CrossRef]
- Kaczor, A.; Szemerédi, N.; Kucwaj-Brysz, K.; Dąbrowska, M.; Starek, M.; Latacz, G.; Spengler, G.; Handzlik, J. Computer-aided search for 5-arylideneimidazolone anticancer agents able to overcome ABCB1-based multidrug resistance. ChemMedChem 2021, 16, 2386–2401. [Google Scholar] [CrossRef]
- Jeevitha Priya, M.; Vidyalakshmi, S.; Rajeswari, M. Study on reversal of ABCB1 mediated multidrug resistance in Colon cancer by acetogenins: An in-silico approach. J. Biomol. Struct. Dyn. 2022, 40, 4273–4284. [Google Scholar] [CrossRef]
- Shafi, T.; Jabeen, I. Grid-independent Descriptors (GRIND) analysis and SAR guided molecular docking studies to probe selectivity profiles of inhibitors of multidrug resistance transporters ABCB1 and ABCG2. Curr. Cancer Drug Targets 2017, 17, 177–190. [Google Scholar] [CrossRef]
- Liu, F.; Hoag, H.; Wu, C.; Liu, H.; Yin, H.; Dong, J.; Qian, Z.; Miao, F.; Liu, M.; Miao, J. Experimental and Simulation Identification of Xanthohumol as an Inhibitor and Substrate of ABCB1. Appl. Sci. 2018, 8, 681. [Google Scholar] [CrossRef]
- Zhang, Y.; Li, C.; Xia, C.; Wah To, K.K.; Guo, Z.; Ren, C.; Wen, L.; Wang, F.; Fu, L.; Liao, N. Adagrasib, a KRAS G12C inhibitor, reverses the multidrug resistance mediated by ABCB1 in vitro and in vivo. Cell Commun. Signal. 2022, 20, 1–16. [Google Scholar] [CrossRef] [PubMed]
- Wang, B.; Ma, L.-Y.; Wang, J.-Q.; Lei, Z.-N.; Gupta, P.; Zhao, Y.-D.; Li, Z.-H.; Liu, Y.; Zhang, X.-H.; Li, Y.-N. Discovery of 5-cyano-6-phenylpyrimidin derivatives containing an acylurea moiety as orally bioavailable reversal agents against P-glycoprotein-mediated mutidrug resistance. J. Med. Chem. 2018, 61, 5988–6001. [Google Scholar] [CrossRef] [PubMed]
- Ferreira, R.J.; Ferreira, M.-J.U.; Dos Santos, D.J. Insights on P-glycoprotein’s efflux mechanism obtained by molecular dynamics simulations. J. Chem. Theory Comput. 2012, 8, 1853–1864. [Google Scholar] [CrossRef] [PubMed]
- Prajapati, R.; Sangamwar, A.T. Translocation mechanism of P-glycoprotein and conformational changes occurring at drug-binding site: Insights from multi-targeted molecular dynamics. Biochim. Et Biophys. Acta (BBA)-Biomembr. 2014, 1838, 2882–2898. [Google Scholar] [CrossRef]
- Mollazadeh, S.; Sahebkar, A.; Hadizadeh, F.; Behravan, J.; Arabzadeh, S. Structural and functional aspects of P-glycoprotein and its inhibitors. Life Sci. 2018, 214, 118–123. [Google Scholar] [CrossRef]
- Gu, X.; Jiang, Y.; Qu, Y.; Chen, J.; Feng, D.; Li, C.; Yin, X. Synthesis and biological evaluation of bifendate derivatives bearing 6, 7-dihydro-dibenzo [c, e] azepine scaffold as potential P-glycoprotein and tumor metastasis inhibitors. Eur. J. Med. Chem. 2018, 145, 379–388. [Google Scholar] [CrossRef]
- Hu, R.; Gao, J.; Rozimamat, R.; Aisa, H.A. Jatrophane diterpenoids from Euphorbia sororia as potent modulators against P-glycoprotein-based multidrug resistance. Eur. J. Med. Chem. 2018, 146, 157–170. [Google Scholar] [CrossRef]
- Li, Y.-S.; Zhao, D.-S.; Liu, X.-Y.; Liao, Y.-X.; Jin, H.-W.; Song, G.-P.; Cui, Z.-N. Synthesis and biological evaluation of 2, 5-disubstituted furan derivatives as P-glycoprotein inhibitors for Doxorubicin resistance in MCF-7/ADR cell. Eur. J. Med. Chem. 2018, 151, 546–556. [Google Scholar] [CrossRef]
- Makki, A.A.; Ibraheem, W.; Alzain, A.A. Cytosporone E analogues as BRD4 inhibitors for cancer treatment: Molecular docking and molecular dynamic investigations. J. Biomol. Struct. Dyn. 2023, 41, 12643–12653. [Google Scholar] [CrossRef]
- Singh, V.K.; Ahmad, I.; Patel, H.; Chaurasia, H. Molecular Modeling, Antibacterial and Antifungal Activity of Quinoline Derivatives. Antibact. Antifung. Act. Quinoline Deriv. 2023. Available online: https://papers.ssrn.com/sol3/papers.cfm?abstract_id=4377254 (accessed on 22 December 2023).
- Silbermann, K.; Li, J.; Namasivayam, V.; Baltes, F.; Bendas, G.; Stefan, S.M.; Wiese, M. Superior pyrimidine derivatives as selective ABCG2 inhibitors and broad-spectrum ABCB1, ABCC1, and ABCG2 antagonists. J. Med. Chem. 2020, 63, 10412–10432. [Google Scholar] [CrossRef]
- Xia, C.Q.; Liu, N.; Miwa, G.T.; Gan, L.-S. Interactions of cyclosporin a with breast cancer resistance protein. Drug Metab. Dispos. 2007, 35, 576–582. [Google Scholar] [CrossRef] [PubMed]

Disclaimer/Publisher’s Note: The statements, opinions and data contained in all publications are solely those of the individual author(s) and contributor(s) and not of MDPI and/or the editor(s). MDPI and/or the editor(s) disclaim responsibility for any injury to people or property resulting from any ideas, methods, instructions or products referred to in the content. |
© 2024 by the authors. Licensee MDPI, Basel, Switzerland. This article is an open access article distributed under the terms and conditions of the Creative Commons Attribution (CC BY) license (https://creativecommons.org/licenses/by/4.0/).
Share and Cite
Cheema, Y.; Linton, K.J.; Jabeen, I. Molecular Modeling Studies to Probe the Binding Hypothesis of Novel Lead Compounds against Multidrug Resistance Protein ABCB1. Biomolecules 2024, 14, 114. https://doi.org/10.3390/biom14010114
Cheema Y, Linton KJ, Jabeen I. Molecular Modeling Studies to Probe the Binding Hypothesis of Novel Lead Compounds against Multidrug Resistance Protein ABCB1. Biomolecules. 2024; 14(1):114. https://doi.org/10.3390/biom14010114
Chicago/Turabian StyleCheema, Yasmeen, Kenneth J. Linton, and Ishrat Jabeen. 2024. "Molecular Modeling Studies to Probe the Binding Hypothesis of Novel Lead Compounds against Multidrug Resistance Protein ABCB1" Biomolecules 14, no. 1: 114. https://doi.org/10.3390/biom14010114
APA StyleCheema, Y., Linton, K. J., & Jabeen, I. (2024). Molecular Modeling Studies to Probe the Binding Hypothesis of Novel Lead Compounds against Multidrug Resistance Protein ABCB1. Biomolecules, 14(1), 114. https://doi.org/10.3390/biom14010114