Abstract
Obesity is characterized by immoderate fat accumulation leading to an elevated risk of neurodegenerative disorders, along with a host of metabolic disturbances. Chronic neuroinflammation is a main factor linking obesity and the propensity for neurodegenerative disorders. To determine the cerebrometabolic effects of diet-induced obesity (DIO) in female mice fed a long-term (24 weeks) high-fat diet (HFD, 60% fat) compared to a group on a control diet (CD, 20% fat), we used in vivo PET imaging with the radiotracer [18F]FDG as a marker for brain glucose metabolism. In addition, we determined the effects of DIO on cerebral neuroinflammation using translocator protein 18 kDa (TSPO)-sensitive PET imaging with [18F]GE-180. Finally, we performed complementary post mortem histological and biochemical analyses of TSPO and further microglial (Iba1, TMEM119) and astroglial (GFAP) markers as well as cerebral expression analyses of cytokines (e.g., Interleukin (IL)-1β). We showed the development of a peripheral DIO phenotype, characterized by increased body weight, visceral fat, free triglycerides and leptin in plasma, as well as increased fasted blood glucose levels. Furthermore, we found obesity-associated hypermetabolic changes in brain glucose metabolism in the HFD group. Our main findings with respect to neuroinflammation were that neither [18F]GE-180 PET nor histological analyses of brain samples seem fit to detect the predicted cerebral inflammation response, despite clear evidence of perturbed brain metabolism along with elevated IL-1β expression. These results could be interpreted as a metabolically activated state in brain-resident immune cells due to a long-term HFD.
1. Introduction
Obesity is mainly characterized by the excessive accumulation of adipose tissue [1]. Its prevalence is steadily increasing and reaching pandemic levels, severely burdening patients and health care systems [1,2]. The main contributor inducing a detrimental increase in body weight is a permanent oversupply of food rich in calories and mostly also in fat, forming an imbalance between energy uptake and expenditure [1]. Obesity is associated with a state of chronic systemic low-grade inflammation (LGI) [3,4] affecting adipose tissue, the liver [5,6] and even the central nervous system (CNS) [7]. In this context, a decrease in cognitive abilities has been observed in patients with long-term obesity [8,9]. Additionally, obese patients have an increased risk of developing dementia [10,11,12].
The main converging mechanism of brain alterations in obesity and neurodegenerative diseases is neuroinflammation [13,14]. In obesity, neuroinflammation is predominantly found in the hypothalamus, leading to dysregulations in the hypothalamus–pituitary axis, thus promoting further disruptions in body mass and food intake regulation [15]. In addition, the literature also suggests neuroinflammatory processes in many other regions of the CNS, for example in the cortex, hippocampus and cerebellum, to be associated with neuronal loss and cognitive changes [16].
Obesity-induced neuroinflammation is thought to result from a persisting peripheral LGI characterized by changes in mediators with pro-inflammatory potential, for example leptin, saturated fatty acids and cytokines. These can affect brain myeloid cells with microglia as the most prominent CNS-resident immune cells [17] as well as astroglia by different pathways [16,18]. Various degrees of microglial and astroglial activation are also commonly observed in different neurodegenerative disorders [19,20]. The pro-inflammatory activation of microglia typically leads to a shift from a homeostatic phenotype to a pro-inflammatory state, characterized by increased expression of pro-inflammatory cytokines, such as interleukin (IL)-1β and tumor necrosis factor α (TNFα), as well as pro-inflammatory chemokines and reactive oxygen species [21]. Furthermore, the pro-inflammatory activation of microglia leads to characteristic morphological changes in which the microglia retract their fine processes, and both the cell bodies and processes become hypertrophic [22].
Besides post mortem histological analyses, neuroinflammation can be assessed in vivo using positron emission tomography (PET). The translocator protein 18 kDa (TSPO), formerly known as the peripheral benzodiazepine receptor, is a prominent biomarker for PET imaging studies [23,24]. For example, (4S)-N,N-Diethyl-9-[2-[18F]fluoroethyl]-5-methoxy-2,3,4,9-tetrahydro-1H-carbazole-4-carboxamide (flutriciclamide, [18F]GE-180 [25]) is a radiotracer with high TSPO affinity [26,27,28]. TSPO is mainly expressed in glial cells in the brain as a transmembrane protein in the outer mitochondrial membrane. While its biological functions remain largely unclear [29], several studies have shown an upregulation of TSPO expression in activated microglia, and TSPO radiotracers have been used successfully for PET imaging of neuroinflammation in various animal models as reviewed by van Camp et al. [30], including in obese mice [31].
Despite the extensive focus of research on the interconnection between obesity and neurodegeneration that is potentially mediated via neuroinflammatory processes, this is still an open field for research. In particular, publications on the effect of long-term high-caloric malnutrition on neuroinflammation are scarce. Therefore, we used a diet-induced obesity (DIO) mouse model to study the effects of a long-term high-fat diet (HFD) on brain glucose consumption and cerebral neuroinflammation as well as peripheral and cerebral markers of obesity and inflammation. We used a combination of in vivo PET analyses with 2-[18F]fluoro-2-deoxy-D-glucose ([18F]FDG) and [18F]GE-180 and ex vivo histological and biochemical evaluations of brain tissue. Our study aimed to test whether the application of [18F]GE-180 PET could detect potential chronic neuroinflammation induced by long-term HFD in the presented DIO model in vivo. Secondly, we evaluated if post mortem histological and biochemical analyses resemble cellular or humoral immune reactions induced by long-term HFD in line with the in vivo imaging results.
2. Materials and Methods
2.1. Animal Model
For the experiments, female C57BL/6J mice were purchased from Charles River (Sulzfeld, Germany) at the age of 4 weeks. Mice were kept in standard cages with 4 animals per cage in a temperature-controlled room (21 ± 3 °C) with a 12/12 h day/night cycle containing a twilight period of 30 min. After one week of acclimatization, the diet was changed to the corresponding diet. One group received a HFD (D12492; Research Diets, New Brunswick, NJ, USA), hereinafter referred to as the HFD group (16 mice) and the other group received the manufacturers’ recommended control diet (CD, D12450J; Research Diets, New Brunswick, NJ, USA), hereinafter referred to as the CD group (16 mice) over a long-term period of 24 weeks. During the experiments, mice had ad libitum access to water.
All animal experimental work was carried out with permission of the local Animal Research Committee (Landesamt für Landwirtschaft, Lebensmittelsicherheit und Fischerei (LALLF)) of the state Mecklenburg-Western Pomerania (LALLF M-V/TSD/7221.3-2-001/18) and all animals received human care according to the EU Directive 2010/63/EU.
2.2. PET/CT Imaging and Image Analysis
Imaging was performed after 24 weeks (=long-term) of the respective diet. For imaging procedures, radiotracers were injected into the tail vein in anesthetized mice (1.5–2.5% isoflurane Baxter, Unterschleißheim, Germany) with oxygen supplement (Air Liquide, Hamburg, Germany). Research conditions during PET imaging were kept identical among animals to ensure accuracy and reliability. These included anesthesia time (<90 min), anesthesia depth (constant breathing frequency, absence of movement) and body temperature (38 °C).
PET imaging using [18F]FDG was performed according to a previously published protocol [32,33]. Briefly, mice were not fasted prior PET imaging. They received 15.38 ± 0.62 MBq of [18F]FDG intravenously (i.v.). 30 min after injection of [18F]FDG, static PET imaging was performed for 30 min in the head-prone position using a small-animal PET/CT scanner (Inveon PET/CT Siemens, Knoxville, TN, USA). PET data were normalized, corrected (for attenuation, decay, scatter, randoms and deadtime) and reconstructed using 2D-ordered subset expectation maximization algorithm (2D-OSEM, 4 iterations, 16 subsets).
To investigate neuroinflammation, the radiotracer [18F]GE-180 was used. Briefly, mice received 15.80 ± 1.45 MBq [18F]GE-180 i.v. PET imaging was performed for a total of 60 min and started simultaneously with the i.v. injection of [18F]GE-180. All 60 min of data were averaged for analysis, and the same corrections and reconstruction algorithm as for [18F]FDG imaging were applied.
PET image analysis was performed with PMOD v.4.0 (PMOD Technologies, Zurich, Switzerland). Detailed procedure of PET data analysis is described by Rühlmann et al. [33]. In short, PET images were co-registered to Mirrione MRI atlas [34] using CT images and anatomical T1-weighted MRI images. The volume of interest (VOI) template of Mirrione was used to extract values in kBq/mL for the following brain regions: cortex, hippocampus and hypothalamus. Additionally, all VOIs of the template were united to obtain a whole-brain VOI. Initially, the % injected dose per mL (%ID/mL) was calculated for standardization.
To address the large difference in weight between CD and HFD mice (see Section 3, Figure 1A), we evaluated the metabolic activity of each radiotracer in the visceral fat tissue and the whole brain (see Figure 1G and Figure 2A). For this, a VOI was placed manually in the visceral fat tissue. For [18F]FDG, the visceral fat was metabolically active to some degree (Figure 1G); therefore, we did not want to overestimate the effect of weight. Thus, we calculated the standardized uptake value using metabolic weight (SUVc) according to Kleiber et al. [35]. For this, the final blood glucose measurement 24 h post PET imaging was used. Additionally, SUVc was corrected using blood glucose concentration (SUVglc,c). The following equation was used to calculate SUVglc,c for [18F]FDG:
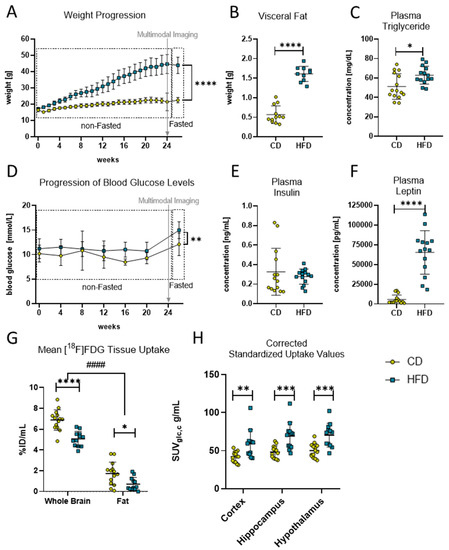
Figure 1.
Diet-induced obese phenotype in mice. (A) Weekly weight progression (in g) of mice with control diet (CD) and high-fat diet (HFD). Both groups started with n = 16 mice and ended with CD (n = 15) and HFD (n = 14) mice. Last data point was measured after a fasting period of 6–12 h. Time point of multimodal imaging is indicated by the grey arrow. Data presented as group mean ± standard deviation. Statistical analysis by mixed-effects model analysis followed by post hoc tests with Sidak’s correction for multiple comparisons, **** p < 0.0001. (B) Comparison of visceral fat deposition (in g) after 24 weeks in HFD and CD group. Statistical analysis by unpaired t-test, **** p < 0.0001. (C) Comparison of fasted plasma triglyceride concentration (in mg/dL) after 24 weeks in HFD and CD group. Statistical analysis by unpaired t-test, * p < 0.05. (D) Progression of monthly measured blood glucose concentration (in mmol/L) of mice with HFD and CD. Both groups started with n = 16 mice and ended with CD (n = 15) and HFD (n = 14) mice. Last data point measured after a fasting period of 6–12 h. Time point of multimodal imaging is indicated by the grey arrow. Data presented as group mean ± standard deviation. Statistical analysis by mixed-effects model followed by post hoc tests with Sidak’s correction for multiple comparisons, ** p < 0.01. (E) Comparison of fasted plasma insulin concentration (in mg/mL) after 24 weeks in the HFD and CD group. Statistical analysis by Mann–Whitney test, p = 0.5409. (F) Comparison of fasted plasma leptin concentration (in pg/mL) after 24 weeks in HFD and CD group. Statistical analysis by Mann–Whitney test, **** p < 0.0001. (G) Comparison of tracer uptake (%ID/mL) into brain and fat tissue in volumes of interest in mice receiving CD (n = 14) or HFD (n = 12). Statistical analysis by two-way ANOVA followed by post hoc tests with Sidak’s correction for multiple comparisons, #### p < 0.0001 brain vs. fat, * p < 0.01, **** p < 0.0001 CD vs. HFD). (H) Standardized uptake values corrected for blood glucose concentration and metabolic weight (SUVglc,c) in g/mL obtained from [18F]FDG PET imaging. Depicted are cortex, hippocampus and hypothalamus as brain regions of interest of CD (n = 14) or HFD (n = 12). Statistical analysis by repeated measures ANOVA followed by post hoc tests with Sidak’s correction for multiple comparisons, ** p < 0.01, *** p < 0.001.
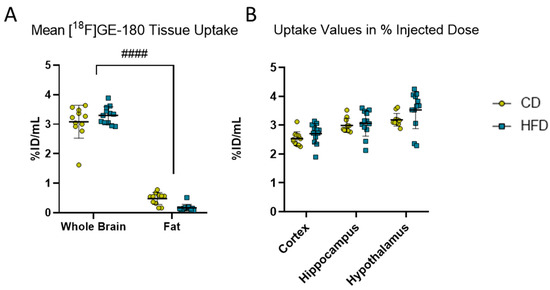
Figure 2.
[18F]GE-180 PET imaging. (A) Comparison of mean uptake (%ID/mL) into brain and fat tissues in volumes of interest in mice receiving control diet (CD, yellow, n = 12) or high-fat diet (HFD, blue, n = 12). Statistical analysis by two-way ANOVA followed by post hoc tests with Sidak’s correction for multiple comparisons, #### p < 0.0001 brain vs. fat. (B) %ID/mL obtained from [18F]GE-180 PET imaging in cortex, hippocampus and hypothalamus in CD (n = 12) or HFD (n = 12). Statistical analysis by repeated measures ANOVA followed by post hoc tests with Sidak’s correction for multiple comparisons.
As for [18F]GE-180, the visceral fat did not show relevant [18F]GE-180 uptake (Figure 2A), no correction for body weight was applied and %ID/mL was used for further analysis.
2.3. Behavioural Test: Morris Water Maze
After 24 weeks of the respective diet, the Morris water maze (MWM) test was performed according to our own previously published work [32,36] as a measure for the mice’s spatial reference memory. After four days of acclimatization, on the fifth day (test day), time spent in the north (N) zone, frequency of platform crossing, latency to first platform crossing and velocity were monitored in real time over 180 s. For this, a video camera (15E objective, Computar, CBC Europe, Düsseldorf, Germany with camera CCA1300-60gm, Basler, Ahrensburg, Germany) was used and subsequent digital analysis was applied using Ethovision XT II.5 (Noldus Information Technology, Wageningen, The Netherlands).
2.4. Weight Control, Blood Sampling, Euthanasia and Tissue Preparation
Body weight was measured weekly (Kern PCB, Lübeck, Germany) and monthly retrobulbary blood sampling for glucose measurement was performed under anesthesia (5 vol.% isoflurane (Baxter, Unterschleißheim, Germany), 0.8 L/min O2 and 1.25 L/min N2O (both from Air Liquide, Hamburg, Germany)).
After PET imaging, all animals were allowed to fully recover from anesthesia in their home cages for at least 24 h. During the last six to twelve hours, mice were fasted for insulin, glucose, leptin and triglyceride measurements in plasma, followed by final body weight measurement, blood sampling and tissue collection. For this procedure, mice were deeply anesthetized and blood was taken via retrobulbary needles to exsanguinate the mice. Blood samples were kept in EDTA tubes (Microvette® 500, Sarsted, Nümbrecht, Germany) at 4 °C until plasma preparation the same day.
Then, mice were transcardially perfused with 20–25 mL 0.9% NaCl (Braun, Melsungen, Germany) with an estimated flow rate of 2.28–2.83 mL/min. After perfusion, visceral fat and brains were dissected, weighted and naively snap-frozen for molecular analyses or paraffin-fixed for histological analyses.
2.5. Blood and Plasma Analyses
Directly after blood collection, blood glucose concentration in naïve blood samples was assessed with a glucose meter (Contour®XT, Bayer, Leverkusen, Germany). For plasma preparation, blood samples were centrifuged at 1200 rpm and 6 °C for 10 min (Centrifuge 5424, Eppendorf, Leipzig, Germany). Afterwards, the supernatant was collected and stored at −80 °C. From stored plasma samples, measurement of plasma triglycerides was performed using Triglyceride Colorimetric Assay Kit (Nr. 10010303, Cayman Chemical Company, Hamburg, Germany). Additionally, the stored plasma samples were used to perform insulin (Ultra Sensitive Mouse Insulin ELISA, Crystal Chem, Zaandam, The Netherlands) and leptin ELISAs (Mouse/Rat Leptin Quantikine ELISA, R&D Systems, Abingdon, UK) according to the manufacturer’s instructions.
2.6. Histology and Immunohistochemistry
Paraffin-embedded specimens (HFD: n = 5, CD: n = 5) were sagittally cut in 4 µm thin sections. To assess TSPO, microgliosis and astrogliosis immunohistochemical reactions were performed with primary antibodies directed against TSPO (polyclonal rabbit anti-TSPO, ab109497, Abcam, Rozenburg, The Netherlands), ionized calcium binding adapter molecule 1 (Iba1; polyclonal rabbit anti-Iba1, 019-19741, FUJIFILM Wako Pure Chemical Corporation, Neuss, Germany), transmembrane protein 119 (TMEM119; monoclonal rabbit anti-TMEM119, Abcam, Cambridge, UK) or glial fibrillary acidic protein (GFAP; monoclonal rabbit anti-GFAP, Abcam, Cambridge, UK). After deparaffination and antigen retrieval in the microwave with citrate buffer (Iba1, GFAP) or Tris-EDTA buffer (TMEM119, TSPO), blocking of endogenous peroxidases was performed with 3 % H2O2 solution. Then, slides were exposed to primary antibodies with overnight incubation at 4 °C. After incubation with secondary antibodies for 1 h at room temperature (TSPO, Iba1, GFAP: biotinylated anti-rabbit; Vector Laboratories, Biozol Di-agnostica Vertrieb GmbH, Eching, Germany; TMEM119: biotinylated anti-rabbit, EnVision, Agilent Technologies, Santa Clara, CA, USA), the avidin/biotin-based amplification kit (TSPO, Iba1, GFAP: Vectastain Elite, Biozol Diagnostica Vertrieb GmbH, Eching, Germany; TMEM119: EnVision Kit, Agilent Technologies, Santa Clara, CA, USA) was applied for one hour at room temperature. Visualization was performed with 3,3′-diaminobenzidine tetrahydro-chloride as chromogen for TSPO, Iba1 and GFAP, whereas TMEM119 antibody reactions were visualized with EnVision Kit. In the end, slides were counterstained with hematoxylin, dehydrated, mounted in DePeX (Serva Electrophoresis GmbH, Heidelberg, Germany) and coverslipped.
Recordings of immunohistochemical reactions as well as the corresponding negative controls (Supplementary Materials Figure S1) were performed with Leica DM6 B microscope equipped with a DMC6200 camera (Leica Microsystems CMS GmbH, Wetzlar, Germany). Quantitative analysis of stained cells was conducted using ImageJ (v 1.53q, Wayne Rasband, National Institutes of Health, Bethesda, MD, USA) with cell counter plugin. In addition to the cell numbers per mm2, the ramification index according to Zhan et al. [22] was calculated for Iba1-stained tissue as ratio of maximum projection area and maximum cell area, both measured manually.
2.7. Quantitative Real-Time PCR
RNA was isolated with RNeasy Mini (Qiagen, Hilden, Germany) Kit from 100 mg naïvely snap-frozen brain tissue stored at −80 °C. In addition to the manufacturer’s instructions, samples were incubated at room temperature for 5 min with 1 mL Qiazol (Qiagen, Hilden, Germany) and for 3 min with 200 µL chloroform (Sigma Aldrich, Taufkirchen, Germany) before 10 min centrifugation at 12,000× g at 4 °C (Centrifuge 5804, Eppendorf, Leipzig, Germany).
After isolation, RNA integrity was verified by agarose gel electrophoresis. RNA concentration was assessed by absorption measurement with NanoDrop (Thermo Fisher Scientific, Waltham, MA, USA). A total of 1 µg of the isolated RNA was transcribed into cDNA with added SuperScript™ (Invitrogen, Thermo Fisher Scientific, Waltham, MA, USA) and deoxyribonucleoside triphosphates (Thermo Fisher Scientific, Waltham, MA, USA). For further analysis, cDNA was diluted in a ratio of 1:2.
Analyses of il-1β, il-6 and tnfα as well as gfap were performed via quantitative real-time PCR in a BioRad iQ5 Multicolor Real-Time PCR Detection System (Conquer Scientific, San Diego, CA, USA) with iQ™ SYBR® Green Supermix (Bio-Rad, Hercules, CA, USA). Measurement results were corrected against the housekeeping gene 40S ribosomal protein S18 (rps18), and relative quantification was carried out by usage of the 2−∆∆CT method. Primer sequences are shown in Table 1.

Table 1.
Primers used for quantitative real-time PCR.
Furthermore, quantitative real-time PCR of tspo and iba1 expression was performed using TaqMan™ Universal Master Mix II with UNG (Thermo Fisher Scientific GmbH, Dreieich, Germany) with compatible probes for tspo (Assay ID: Mm00437828_m1), iba1 (Assay ID: Mm00479862_g1) and gapdh as housekeeping gene (Assay ID: Mm99999915_g1), according to manufacturer’s instructions (all from Thermo Fisher Scientific GmbH, Dreieich, Germany).
2.8. Statistical Analysis
Statistical analysis was performed using GraphPad Prism 8.0.1 (GraphPad Software Inc., San Diego, CA, USA). According to Power Guerra et al., prior tests for normal distribution were performed using Shapiro–Wilk test [37]. If necessary, outliers identified with the built-in ROUT method of GraphPad Prism with a maximum desired false discovery rate of 1% (Q = 1%) were removed from the data set. In this case, corrected animal numbers are indicated in the corresponding figure legends. For comparisons between CD and HFD groups, t-test (normally distributed data) or Mann–Whitney test (not normally distributed data) was performed. For evaluation of longitudinal or paired measurements, data were analyzed using either a repeated measure ANOVA or a linear stacked mixed-effects model (which in contrast to ANOVA is able to handle missing values) with diet and experimental time as fixed effects and individual mice as random effect. According to the GraphPad Prism preinstalled packages, the mixed-effects model uses a compound symmetry covariance matrix and is fit using restricted maximum likelihood (REML). Post hoc tests were performed to correct for multiple comparisons using Sidak’s method. In general, data are presented as mean ± standard deviation. Differences were deemed statistically significant at p < 0.05. For further details, please see figure legends.
3. Results
3.1. Long-Term High-Fat Diet Induces an Obese Phenotype with Brain Glucose Hypermetabolism
To confirm the effects of the HFD and to verify the DIO in the mice, the progression in the mice’s body weight was monitored continuously during the experimental time. The linear mixed-effects model analysis revealed a statistically significant effect of experimental time (F(2.30, 66.98) = 313.0, p < 0.0001), diet (F(1.00, 30.00) = 196.4, p < 0.0001) and their interaction (F(25.00, 726.00) = 120.1, p < 0.0001) with statistically significant differences after 24 weeks of the respective diets (Figure 1A, CD: 22.5 ± 1.7 g vs. HFD: 43.9 ± 5.0 g, p < 0.0001). Additionally, after 24 weeks post mortem, quantifications of the dissected fat revealed a statistically significant higher mass of visceral fat (Figure 1B, CD: 0.6 ± 0.2 g vs. HFD: 1.6 ± 0.2 g, p < 0.0001) and plasma triglyceride concentrations (Figure 1C, CD: 51.2 ± 12.1 mg/dL vs. HFD: 62.9 ± 9.2 mg/dL, p = 0.013) in the HFD group compared to the CD group, confirming a DIO phenotype in this group.
Moreover, DIO led to observable derailments in metabolic pathways in the HFD group (Figure 1D–F). The linear mixed-effects model analysis revealed a statistically significant effect of diet (F(1.00, 30.00) = 20.84, p < 0.0001) but not of experimental time or an interaction effect of both in the non-fasted blood glucose levels of the mice, with a higher average concentration in the HFD group throughout the whole experimental time compared to the CD group (Figure 1D, CD: 9.7 ± 0.8 mmol/L vs. HFD: 11.1 ± 0.3 mmol/L, p = 0.0026). Additionally, statistically significant elevated fasting blood glucose levels (Figure 1D, CD: 12.1 ± 2.3 mmol/L vs. HFD: 15.0 ± 1.2 mmol/L, p = 0.0049) but not plasma insulin levels (Figure 1E) were measured in the HFD group compared to the CD group after 24 weeks of the diets. Furthermore, the post mortem plasma analyses revealed that the HFD group had statistically significantly elevated plasma concentrations of leptin (Figure 1F, CD: 5714 ± 5596 pg/mL vs. HFD: 65,247 ± 27,496 pg/mL, p < 0.0001).
To determine the effects of the DIO phenotype on CNS metabolism in vivo, we performed an [18F]FDG-PET imaging analysis. The analysis of tracer uptake (%ID/mL) in brain tissue and visceral fat for [18F]FDG revealed a statistically significant effect of tissue (F(1, 24) = 403.1, p < 0.0001) and diet (F(1, 24) = 29.46, p < 0.0001) but no interaction effect, and post hoc tests showed a statistically significant difference between the CD and HFD in the whole-brain (p < 0.0001) and fat VOIs (p = 0.0119). Because of the measured differences between the CD and HFD in fat tissue (see methods, Figure 1G), we present SUVs corrected for the metabolic weight according to Kleiber [35] and corrected for blood glucose concentration SUVglc,c when comparing glucose metabolism in the brain VOIs (Figure 1H). In doing so, after 24 weeks, we found a statistically significant effect in SUVglc,c between the two diets (F(1, 24) = 14.5, p = 0.0009) and significant differences in the cortex (CD: 42.0 ± 7.1 g/mL vs. HFD: 59.3 ± 18.4 g/mL, p = 0.0042), hippocampus (CD: 48.3 ± 8.1 g/mL vs. HFD: 69.1 ± 18.1 g/mL, p = 0.0004) and hypothalamus (CD: 50.1 ± 9.1 g/mL vs. HFD: 70.5 ± 15.6 g/mL, p = 0.0006).
3.2. Long-Term High-Fat Diet Causes Only a Change in Pro-Inflammatory Cytokine Profile
To observe the effects of the DIO phenotype on inflammation in the CNS in vivo, we performed [18F]GE-180 PET imaging. Comparing the activity in whole brain versus fat, the diet did not show a statistically significant effect (F(1, 21) = 0.1887, p = 0.6685) in the mixed-effects model. However, statistically significant effects of tissue (F(1, 21) = 1199.0, p < 0.0001) and tissue with diet interaction (F(1, 21) = 10.240, p = 0.0043) were found, but the post hoc test did not show a statistically significant difference between the CD and HFD in the whole brain (p = 0.2351) or fat (p = 0.0572). Therefore, we refrained from further normalization steps and presented the results as %ID/mL. We analyzed the VOIs for the cortex, hippocampus and hypothalamus. Although the values of %ID tended to be higher in the HFD group (3.3 ± 0.3 %ID/mL) compared to the CD (3.1 ± 0.6 %ID/mL) group, the repeated measures ANOVA revealed a tissue-dependent (F(1.219, 25.61) = 80.38, p < 0.0001) effect but no effect of the corresponding diet between the CD and the HFD (F(1, 21) = 1.691, p = 0.2075).
To further evaluate a pro-inflammatory cellular immune response in the brain, we used post mortem analyses of histological samples with immunohistochemical reactions to three commonly used markers for microglia: TSPO (Figure 3A–H), Iba1 (Figure 4A–H) and TMEM119 (Figure 5A–H). Furthermore, for tspo (Figure 3I) and iba1 (Figure 4I), an mRNA expression analysis was performed to complement these immunohistochemical reactions. In all three reactions of the cortex, hippocampus and hypothalamus, the total number of microglia was counted as TSPO+cells/mm2 (Figure 3J), Iba1+cells/mm2 (Figure 4J) and TMEM+cells/mm2 (Figure 5I), respectively. In the Iba1-reacted tissue, the morphological activation of microglia was further assessed as the ramification index, which is the ratio between the maximum projection area and the maximum cell area (Figure 4K). Neither of the described analyses showed any statistically significant difference between the HFD and CD groups in the TSPO, Iba1 or TMEM119 reactions.
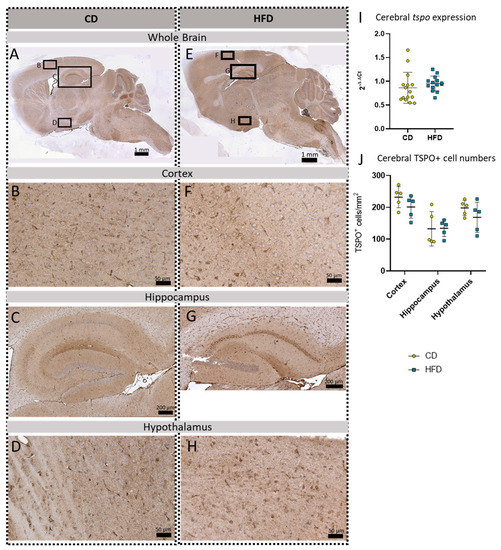
Figure 3.
Immunohistochemical TSPO reactions in sagittal brain sections of mice after long-term (24 weeks) control diet (CD, n = 5) or high-fat diet (HFD, n = 5) within designated regions of interest (Figure B–D,F–H) defined by black rectangles in overview images (Figure A,E). (A) Overview of a representative sagittal TSPO-reacted brain slice of the CD group with indicated regions for detailed images; scale bar: 1 mm. (B) Detailed image of TSPO-reacted cortex of the CD group; scale bar: 50 µm. (C) Detailed image of the TSPO-reacted hippocampus of the CD group; scale bar: 200 µm. (D) Detailed image of the TSPO-reacted hypothalamus of the CD group; scale bar: 50 µm. (E) Overview of a representative sagittal TSPO-reacted brain slice of the HFD group with indicated regions for detailed images; scale bar: 1 mm. (F) Detailed image of the TSPO-reacted cortex of the HFD group; scale bar: 50 µm. (G) Detailed image of the TSPO-reacted hippocampus of the HFD group; scale bar: 200 µm. (H) Detailed image of the TSPO-stained hypothalamus of the HFD group; scale bar: 50 µm. (I) 2−ΔΔCT values representing relative mRNA expression of tspo in the brains of CD (n = 15) vs. HFD (n = 14) group. Data presented as group mean ± standard deviation. Statistical analysis by Mann–Whitney test, p = 0.267. (J) Mean cell numbers of TSPO+ cells/mm2 in the cortex, hippocampus and hypothalamus of CD vs. HFD groups. Data presented as group mean ± standard deviation. Statistical analysis by repeated measures ANOVA with post hoc tests without corrections for multiple comparisons; cortex: p = 0.1905, hippocampus: p = 0.9546, hypothalamus: p = 0.2638.
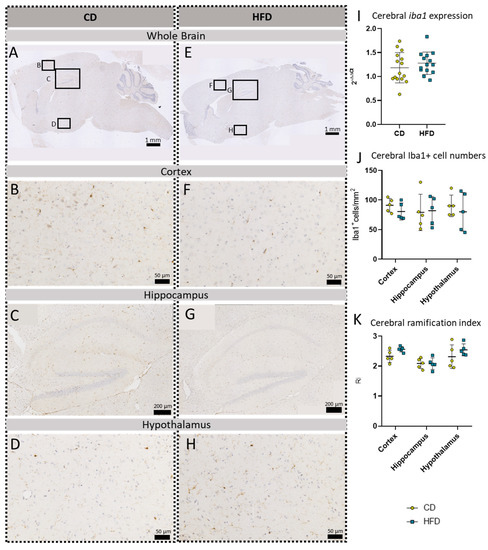
Figure 4.
Immunohistochemical Iba1 reactions in sagittal brain sections of mice after long-term (24 weeks) control diet (CD, n = 5) or high-fat diet (HFD, n = 5) within designated regions of interest (Figure B–D,F–H) defined by black rectangles in overview images (Figure A,E). (A) Overview of a representative sagittal Iba1-reacted brain slice of CD group with indicated regions for detailed images; scale bar: 1 mm. (B) Detailed image of the Iba1-reacted cortex of the CD group; scale bar: 50 µm. (C) Detailed image of the Iba1-reacted hippocampus of the CD group; scale bar: 200 µm. (D) Detailed image of the Iba1-reacted hypothalamus of the CD group; scale bar: 50 µm. (E) Overview of a representative sagittal Iba1-reacted brain slice of the HFD group with indicated regions for detailed images; scale bar: 1 mm. (F) Detailed image of the Iba1-reacted cortex of the HFD group; scale bar: 50 µm. (G) Detailed image of the Iba1-reacted hippocampus of the HFD group; scale bar: 200 µm. (H) Detailed image of the Iba1-reacted hypothalamus of the HFD group; scale bar: 50 µm. (I) 2−ΔΔCT values representing relative mRNA expression of iba1 in the brains of CD (n = 15) vs. HFD (n = 14) groups. Data presented as group mean ± standard deviation. Statistical analysis by unpaired t-test, p = 0.9162. (J) Cerebral cell numbers of Iba1+ cells/mm2 in the cortex, hippocampus and hypothalamus of CD vs. HFD groups. Data presented as group mean ± standard deviation. Statistical analysis by repeated measures ANOVA, with post hoc tests, without corrections for multiple comparisons; cortex: p = 0.5699, hippocampus: p = 0.9981, hypothalamus: p = 0.9210. (K) Cerebral mean ramification index of Iba1+ cells in the cortex, hippocampus and hypothalamus of CD vs. HFD groups. Data presented as group mean ± standard deviation. Statistical analysis by repeated measures ANOVA with post hoc tests, without corrections for multiple comparisons; cortex: p = 0.0611, hippocampus: p = 0.9575, hypothalamus: p = 0.2951.
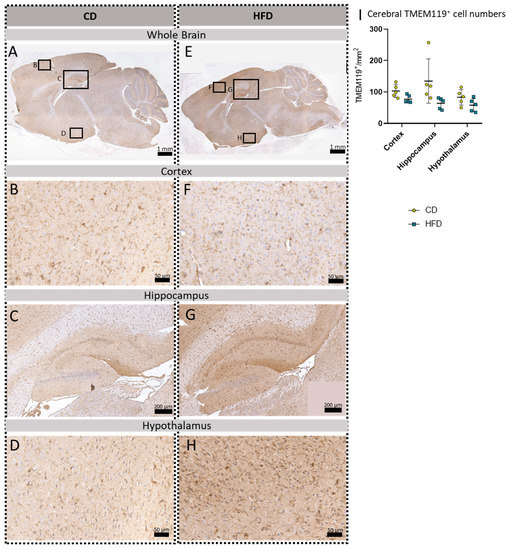
Figure 5.
Immunohistochemical TMEM119 reactions in sagittal brain sections of mice after long-term (24 weeks) control diet (CD, n = 5) or high-fat diet (HFD, n = 5) within designated regions of interest (Figure B–D,F–H) defined by black rectangles in overview images (Figure A,E). (A) Overview of a representative sagittal TMEM119-reacted brain slice of the CD group with indicated regions for detailed images; scale bar: 1 mm. (B) Detailed image of the TMEM119-reacted cortex of the CD group; scale bar: 50 µm. (C) Detailed image of the TMEM119-reacted hippocampus of the CD group; scale bar: 200 µm. (D) Detailed image of the TMEM119-reacted hypothalamus of the CD group; scale bar: 50 µm. (E) Overview of a representative sagittal TMEM119-reacted brain slice of the HFD group with indicated regions for detailed images; scale bar: 1 mm. (F) Detailed image of the TMEM119-reacted cortex of the HFD group; scale bar: 50 µm. (G) Detailed image of the TMEM119-reacted hippocampus of the HFD group; scale bar: 200 µm. (H) Detailed image of the TMEM119-reacted hypothalamus of the HFD group; scale bar: 50 µm. (I) Cerebral mean cell numbers of TMEM119+ cells/mm2 in the cortex, hippocampus and hypothalamus of CD vs. HFD groups. Data presented as group mean ± standard deviation. Statistical analysis by repeated measures ANOVA with post hoc tests, without corrections for multiple comparisons; cortex: p = 0.0511, hippocampus: p = 0.0878, hypothalamus: p = 0.1223.
In addition to the three microglia-related immunohistochemical reactions, we also performed a gfap mRNA expression analysis and GFAP immunohistochemical reactions to analyze the astroglial cell numbers in the brain tissue (Figure 6). No statistically significantly increased gfap expression (Figure 6I) or cell numbers of GFAP+cells/mm2 (Figure 6J) in either of the presented brain regions, namely the cortex (Figure 6B,F), hippocampus (Figure 6C,G), and hypothalamus (Figure 6D,H), were observed comparing the CD and HFD groups.
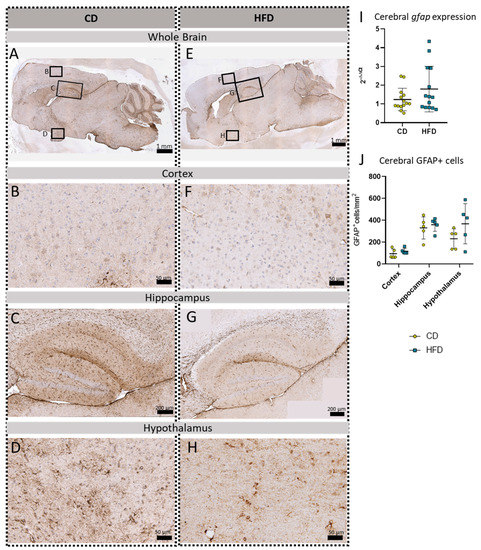
Figure 6.
Immunohistochemical GFAP reactions in sagittal brain sections of mice after long-term (24 weeks) control diet (CD, n = 5) or high-fat diet (HFD, n = 5) within designated regions of interest (Figure B–D,F–H) defined by black rectangles in overview images (Figure A,E). (A) Overview of a representative sagittal GFAP-reacted brain slice of the CD group with indicated regions for detailed images; scale bar: 1 mm. (B) Detailed image of the GFAP-reacted cortex of the CD group; scale bar: 50 µm. (C) Detailed image of the GFAP-reacted hippocampus of the CD group; scale bar: 200 µm. (D) Detailed image of the GFAP-reacted hypothalamus of the CD group; scale bar: 50 µm. (E) Overview of a representative sagittal GFAP-reacted brain slice of the HFD group with indicated regions for detailed images; scale bar: 1 mm. (F) Detailed image of the GFAP-reacted cortex of the HFD group; scale bar: 50 µm. (G) Detailed image of the GFAP-reacted hippocampus of the HFD group; scale bar: 200 µm. (H) Detailed image of the GFAP-reacted hypothalamus of the HFD group; scale bar: 50 µm. (I) 2−ΔΔCT values representing relative mRNA expression of gfap in the brains of CD (n = 15) vs. HFD (n = 14) groups. Data presented as group mean ± standard deviation. Statistical analysis by Mann–Whitney test, p = 0.4472. (J) Mean cell numbers of GFAP+ cells/mm2 in the cortex, hippocampus and hypothalamus of CD vs. HFD groups. Data presented as group mean ± standard deviation. Statistical analysis by repeated measures ANOVA with post hoc tests, without corrections for multiple comparisons; cortex: p = 0.3384, hippocampus: p = 0.5936, hypothalamus: p = 0.1874.
Besides cellular immune responses, we also analyzed cytokine expression as an indicator for the DIO-derived humoral reaction of neuroinflammation in long-term HFD mice. The PCR analysis of brain tissue revealed statistically significantly elevated levels of pro-inflammatory il-1β (Figure 7A, CD: 0.7 ± 0.5 vs. HFD: 1.3 ± 0.7, p = 0.0224) as well as a tendency of increased il-6 (Figure 7B, CD: 7.3 ± 5.3 vs. HFD: 11.0 ± 7.0, p = 0.0763) but no statistically significant difference in tnfα expression (Figure 7C).
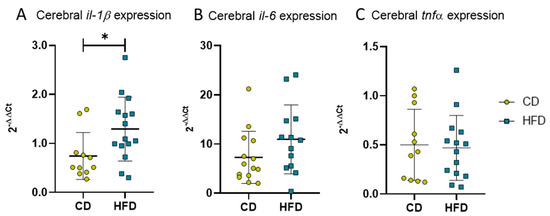
Figure 7.
2−ΔΔCT values representing relative mRNA expression of pro-inflammatory cytokines in brains of mice receiving control diet (CD) or high-fat diet (HFD) for 24 weeks. (A) Relative expression of il-1β. Statistical analysis by unpaired t-test, * p < 0.05. (B) Relative expression of il-6. Statistical analysis by Mann–Whitney test, p = 0.0763. (C) Relative expression of tnfα. Statistical analysis by unpaired t-test, p = 0.8261.
3.3. Spatial Memory Function Is Unaffected by Long-Term High-Fat Diet-Derived Changes in the Brain
After 24 weeks of the respective diet, the MWM test was performed as a measure for spatial reference memory. There was no difference in the time the mice spent in the target N zone of the maze (Figure 8A), number of platform crossings (Figure 8B) or latency to the first crossing of the platform area (Figure 8C). Only a difference in the mean velocity was observable between the two groups (Figure 8D, CD: 17.4 ± 1.5 cm/s vs. HFD: 15.5 ± 1.8 cm/s, p = 0.0042).
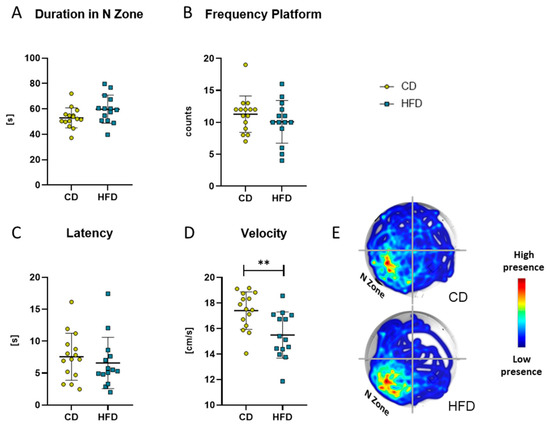
Figure 8.
Results obtained with the Morris Water Maze test in the group receiving control diet (CD) and the group receiving the high-fat diet (HFD). (A) Time (in seconds (s)) spent in the N Zone, defined as quadrant containing the platform. (B) Frequency (counts) of platform crosses during 120 s. (C) Latency (s) to first platform crossing. (D) Velocity (cm/s) of the mice. Values are given as mean ± SD. Significance of differences between the groups was tested by unpaired Student’s t-test (A,D) or Mann–Whitney test (B,C), ** p < 0.005. (E) Representative heat map of the performance of mice of CD and HFD groups.
4. Discussion
In the present study, we used in vivo PET imaging with the radiotracers [18F]FDG and [18F]GE-180, a TSPO ligand, to determine the effects of DIO in a long-term female HFD model on glucose metabolism and inflammatory processes in the brain, respectively. Complementarily, we performed histological and biochemical post mortem analyses of TSPO and further microglial (Iba1, TMEM119) as well as astroglial (GFAP) markers. Our main finding was a statistically significant elevation in pro-inflammatory il-1β mRNA expression without statistically significant changes in [18F]GE-180 uptake and histological correlates of induced glial proliferation and activation.
In the present study, we used female mice receiving a 60% HFD for 24 weeks (long-term). This DIO model was chosen to reflect the development of overweight and obesity due to the high-caloric diets common in Western industrialized countries. Although a high caloric proportion of Western diets also consists of sucrose, which has been shown to induce neuroinflammatory processes even in non-obese rodents [38], a high caloric intake due to an elevated fat content and its described potential to induce neuroinflammatory processes is the focus of current research approaches [39,40]. Such DIO models are generally more representative of human obesity than genetic models of obesity [41,42]. However, it should be noted that currently there are several different experimental protocols published describing the establishment of DIO using a HFD. For example, some studies describe a HFD with ~20% fat content [43], while others use the term HFD for chow containing ~50% [44,45] or ~60% fat [46,47,48]. Furthermore, the administration of HFDs to study neuroinflammation in mice has ranged from a few days [47,48,49] to several weeks [46,47,50] or a few months [31,47,50]. This underlines the need for a clear definition and a higher standardization of the different compositions and lengths of HFD administration for better comparability and reproducibility of results, even if the present study cannot achieve this either. Moreover, there is a known sexual dimorphism in the development of concomitant morbidities [51] with differences in neuroinflammatory processes between female and male DIO mice [52,53]. As there is already abundant literature regarding the effects of DIO and the interplay between metabolic syndrome and neuronal function in male animals [54], we used female C57BL/6J mice to further investigate the effect of DIO on females. Despite the possible sexual dimorphism, in line with the above-mentioned studies in male mice, we were able to show a generalized HFD-derived obese phenotype after 24 weeks of a HFD in our female model. This obese phenotype was mainly characterized by increased body weight, visceral fat, free triglycerides and leptin in plasma, as well as increased fasted blood glucose levels. Furthermore, our in vivo approach using [18F]FDG PET imaging showed cerebral glucose hypermetabolism in the female HFD mice compared to the CD mice. This pathological condition has already been described in male mice receiving HFD [55] and morbidly obese male and female patients [56].
In humans, obesity often has a slow onset, and the exact orchestration of the transition from an obesity-induced state of peripheral LGI to neuroinflammation is a process that is little understood and takes a long time, sometimes even decades [57]. Regarding the investigation into neuroinflammation, the literature provides plenty of insights on male mice receiving the same HFD that was used in this work with different experimental times of a few days up to a few weeks [47]. Findings from the current literature describe acute neuroinflammation after short-term HFD administration for a few days, which transiently subsides with prolonged HFD exposure; however, with chronic HFD exposure over 20 weeks (=long-term HFDs), renewed neuroinflammation becomes apparent [47]. In female mice, the available literature also describes a pro-inflammatory phenotype after 12 weeks of a HFD with ~60% fat content, albeit in a less severe manifestation compared to that of male mice [52]. In line with this, the working group of Lainez et al. suggests a protective role of ovarian hormones in this DIO model [52]. Though we cannot provide data on the estrus cycle of our mouse model, inconsistent estrogen levels might have impacted the current PET study.
Data on long-term HFDs (6 months and more), which would be a more valid representation of the long pathologic span in human obesity, and comorbidities in female mice are not yet available. This emphasizes the relevance of the present study. To observe neuroinflammation in our long-term HFD approach, we performed in vivo PET imaging with [18F]GE-180, a well-established marker for microglial activation in preclinical studies [26,27,28]. In our model, the results suggest a tendency for the elevated uptake of [18F]GE-180 in the HFD group compared to the CD group; however, these did not reach statistical significance. To further elucidate the [18F]GE-180 PET imaging results of the mice after 24 weeks, their brains were analyzed post mortem using molecular biology as well as histological methods. Here, we measured relative tspo mRNA expression in the whole brain as well as TSPO-positive cells in our three main target regions: the cortex, hippocampus and hypothalamus. None of these analyses showed any difference between the HFD and CD groups.
In general, large differences in bodyweight are an obstacle to properly analyzing [18F]GE-180 uptake. As we saw no relevant [18F]GE-180 uptake into fat tissue, we reported our results as %ID/mL. This is in line with another working group that reported good agreement between in vivo TSPO signals and immunoreactivity and suggested the use of %ID/g for quantifying TSPO in living brains [31]. Interestingly, Barron et al. found similar results to our study when using %ID/g and immunoreactivity for TSPO [31]. Barron et al. used a 12-week HFD (60% fat) model and were able to show that obesity alone did not increase TSPO inflammatory signals [31]. A possible explanation for the PET findings could be the use of the semi-quantitative measure %ID/mL for the quantification of [18F]GE-180. Kinetic modelling using dynamic PET data and metabolite-corrected plasma input functions are the gold standards for the quantification of radiotracers [58,59]. Nevertheless, in rodents, blood sampling can impact the physiological homeostasis [58]. The evaluation of time–activity curves in different brain regions, similar to previous work by Barron et al. [31] or Zatcepin et al. [60], can be more sensitive compared to the averaged data we used. We are aware that our averaged PET data contain perfusion and distribution phases that are not contributing to a TSPO-specific signal. However, we were not able to perform an additional dynamic reconstruction of the raw PET listmode data due to missing normalization and quantification files. Nevertheless, we obtained similar results compared to the dynamically and statically analyzed data from Barron et al. [31]. For future studies, dynamic PET data should be evaluated to increase the sensitivity of the outcome measure. A further approach for the analysis of TSPO tracer binding is the use of the cerebellum as a pseudo-reference region which has been successfully applied in humans [61]. For our model, we also applied this approach (Supplementary Material Figure S2); however, we obtained nearly the same insights that were already presented in the Section 3. A biological reason for the slightly elevated [18F]GE-180 uptake in the HFD group without histological signs of neuroinflammation could be a blood–brain barrier (BBB) injury induced by the HFD [62] leading to increased BBB permeability and thus to the increased uptake of [18F]GE-180, similar to results obtained in human multiple sclerosis patients [63,64].
To further evaluate HFD-induced neuroinflammation on a cellular level, we focused on TMEM119, a specific microglial marker [65] lacking sexual dimorphism [66], and GFAP, a marker for astroglia and reactive astrogliosis [67] that is generally more expressed in males than females [68]. Immunohistochemical reactions did not show an increase in the respective cell numbers in our HFD mice. Additionally, we observed Iba1, a marker for brain myeloid cells, with microglia as the most prominent cells [69,70]. We measured the relative iba1 mRNA expression in the whole brain as well as Iba1-positive cells in our three main designated brain regions: the cortex, hippocampus and hypothalamus. In line with the other histological quantifications, we also found no significant differences between the CD and HFD groups. Additionally, we measured the mean ramification index of Iba1-positive microglial cells as an indicator for their activation [22] which also showed no difference between the HFD and CD groups. Nevertheless, the results in our female model are in line with the current results in other female mice, showing no increase in microglial measures after the HFD [53].
In the context of neuroinflammation, we were not able to show a cognitive decline after 24 weeks of the HFD. This is contrary to findings of de Paula et al. [62] who showed cognitive changes in male mice after a few days of a HFD. However, recent findings from a rat model using a HFD point to a sex effect on spatial memory in the MWM test, for which only male and not female rats showed a HFD-derived cognitive decline [71]. Furthermore, it is possible that our long-term HFD of 24 weeks lead to a transient state of the mitigation of neuroinflammation in female mice, which has already been described for male mice by Thaler et al. [47]. This mitigation may be mediated by a transition of brain-resident immune cells from a pro-inflammatory (in macrophages, typically characterized as M1-like) state, lately reviewed by Yunna et al. [72], to a metabolically activated phenotype, as already described for peripheral macrophages [73,74]. This metabolically activated phenotype overexpresses pro-inflammatory cytokines via the signaling pathways typically observed in M1-like macrophages, but they cannot be identified using classical cell surface markers of activation [74]. As this is in line with the presented histological analyses, we further measured cerebral cytokine expression profiles. In the CNS, we observed no increase in tnfα or il-6 expression, as these cytokines seem to have a prominent role in the peripheral mediation of HFD-derived inflammation [37,75,76]. Interestingly, our analyses revealed a statistically significant increased expression of pro-inflammatory il-1β, which is described as a key feature of the metabolically activated phenotype of macrophages [77] and is reported as a key mediator in neuroinflammation [78,79]. Therefore, IL-1β could be an indicator for a chronic metabolically activated state of neuroinflammation derived from the long-term HFD in the present experiment.
5. Conclusions
From these results, we conclude that in our female DIO mouse model of a long-term (24-week) HFD, cytokine signaling via IL-1β is the predominant mediator of chronic neuroinflammation as there was no observable cellular inflammation using [18F]GE-180 PET imaging or immunohistochemical reactions. Further experiments are needed to evaluate the exact orchestration of the phenotype changes in the brain-resident immune cells exposed to chronic long-term HFD-induced changes and possible adaption processes.
Supplementary Materials
The following supporting information can be downloaded at: https://www.mdpi.com/article/10.3390/biom13050769/s1, Figure S1: Corresponding negative controls of the immunohistochemical reactions of (A) TSPO, (B) Iba1, (C) TMEM119 and (D) GFAP. Scale bar representing 1000 µm; Figure S2: [18F]GE-180 PET imaging. (A) Comparison of mean uptake (%ID/mL) cerebellum of control diet (CD, yellow, n = 12) or high-fat diet (HFD, blue, n = 12). Statistical analysis was performed by unpaired student-t test. (B) Ratios of cortex, hippocampus and hypothalamus to cerebellum as pseudo-reference region in CD (n = 12) or HFD (n = 12). Statistical analysis was performed by repeated measures ANOVA followed by post hoc tests with Sidak’s correction for multiple comparisons.
Author Contributions
Conceptualization, A.K.; methodology, A.K., A.S., T.L., J.S., N.P.G., L.M., N.B., C.B. and T.A.; validation, N.P.G., L.M., A.S., S.T., A.K. and B.V.; formal analysis, L.M., N.P.G. and A.S.; investigation, N.P.G., L.M. and D.B.; resources, A.K., D.J., B.J.K., J.K. and B.V.; data curation, N.P.G., L.M. and A.K.; writing—original draft preparation, L.M. and N.P.G.; writing—review and editing, A.K., A.S., T.L., S.T., B.V., C.B. and J.K.; visualization, L.M. and N.P.G.; supervision, A.K., B.V. and D.J.; project administration, A.K. and D.J.; funding acquisition, A.K. and D.J. All authors have read and agreed to the published version of the manuscript.
Funding
This research was funded by grant from the Deutsche Forschungsgemeinschaft, Bonn, Germany (KU3280/1-2 and JA 2872/1-2).
Institutional Review Board Statement
The animal study protocol was approved by the local Animal Research Committee (Landesamt für Landwirtschaft, Lebensmittelsicherheit und Fischerei (LALLF)) of the state Mecklenburg-Western Pomerania (LALLF M-V/TSD/7221.3-2-001/18, approved on 1 March 2018) and all animals received human care according to the EU Directive 2010/63/EU.
Informed Consent Statement
Not applicable.
Data Availability Statement
The data presented in this study are available on request from the corresponding author.
Acknowledgments
We wholeheartedly thank all the animal attendants Mareike Degner, Ilona Klamfuß, Chantal von Hörsten, Karin Gerber, Petra Klafke, Petra Wolff, Andrea Wilhelm, Roland Gerber and Klaus-Dieter Russow for their excellent assistance in animal care. Furthermore, we would like to thank Berit Blendow, Maren Nerowski, Eva Lorbeer, Sabine Glaubitz, Dorothea Frenz, Christin Schlie, Joanna Förster, Anne Rupp and Daniel Wolter for their invaluable technical assistance in the laboratory.
Conflicts of Interest
The authors declare no conflict of interest.
References
- WHO. Obesity and Overweight. 2021. Available online: https://www.who.int/news-room/fact-sheets/detail/obesity-and-overweight (accessed on 29 November 2021).
- Blüher, M. Obesity: Global epidemiology and pathogenesis. Nat. Rev. Endocrinol. 2019, 15, 288–298. [Google Scholar] [CrossRef] [PubMed]
- Gregor, M.F.; Hotamisligil, G.S. Inflammatory mechanisms in obesity. Annu. Rev. Immunol. 2011, 29, 415–445. [Google Scholar] [CrossRef] [PubMed]
- Lumeng, C.N.; Saltiel, A.R. Inflammatory links between obesity and metabolic disease. J. Clin. Investig. 2011, 121, 2111–2117. [Google Scholar] [CrossRef] [PubMed]
- Marchesini, G.; Moscatiello, S.; Di Domizio, S.; Forlani, G. Obesity-associated liver disease. J. Clin. Endocrinol. Metab. 2008, 93 (Suppl. 1), S74–S80. [Google Scholar] [CrossRef] [PubMed]
- Saltiel, A.R.; Olefsky, J.M. Inflammatory mechanisms linking obesity and metabolic disease. J. Clin. Investig. 2017, 127, 1–4. [Google Scholar] [CrossRef]
- Alford, S.; Patel, D.; Perakakis, N.; Mantzoros, C.S. Obesity as a risk factor for Alzheimer’s disease: Weighing the evidence. Obes. Rev. 2018, 19, 269–280. [Google Scholar] [CrossRef]
- Olivo, G.; Gour, S.; Schiöth, H.B. Low neuroticism and cognitive performance are differently associated to overweight and obesity: A cross-sectional and longitudinal UK Biobank study. Psychoneuroendocrinology 2019, 101, 167–174. [Google Scholar] [CrossRef]
- Singh-Manoux, A.; Czernichow, S.; Elbaz, A.; Dugravot, A.; Sabia, S.; Hagger-Johnson, G.; Kaffashian, S.; Zins, M.; Brunner, E.J.; Nabi, H.; et al. Obesity phenotypes in midlife and cognition in early old age: The Whitehall II cohort study. Neurology 2012, 79, 755–762. [Google Scholar] [CrossRef]
- Chuang, Y.-F.; An, Y.; Bilgel, M.; Wong, D.F.; Troncoso, J.C.; O’Brien, R.J.; Breitner, J.C.; Ferruci, L.; Resnick, S.M.; Thambisetty, M. Midlife adiposity predicts earlier onset of Alzheimer’s dementia, neuropathology and presymptomatic cerebral amyloid accumulation. Mol. Psychiatry 2016, 21, 910–915. [Google Scholar] [CrossRef]
- Xu, W.L.; Atti, A.R.; Gatz, M.; Pedersen, N.L.; Johansson, B.; Fratiglioni, L. Midlife overweight and obesity increase late-life dementia risk: A population-based twin study. Neurology 2011, 76, 1568–1574. [Google Scholar] [CrossRef]
- Yang, Y.; Shields, G.S.; Guo, C.; Liu, Y. Executive function performance in obesity and overweight individuals: A meta-analysis and review. Neurosci. Biobehav. Rev. 2018, 84, 225–244. [Google Scholar] [CrossRef] [PubMed]
- de Bem, A.F.; Krolow, R.; Farias, H.R.; Linden de Rezende, V.; Pens Gelain, D.; Fonseca Moreira, J.C.; das Neves Duarte, J.M.; de Oliveira, J. Animal Models of Metabolic Disorders in the Study of Neurodegenerative Diseases: An Overview. Front. Neurosci. 2020, 14, 604150. [Google Scholar] [CrossRef] [PubMed]
- Marques, C.G.; Dos Santos Quaresma, M.V.L.; Nakamoto, F.P.; Magalhães, A.C.O.; Lucin, G.A.; Thomatieli-Santos, R.V. Does Modern Lifestyle Favor Neuroimmunometabolic Changes? A Path to Obesity. Front. Nutr. 2021, 8, 705545. [Google Scholar] [CrossRef]
- Thaler, J.P.; Guyenet, S.J.; Dorfman, M.D.; Wisse, B.E.; Schwartz, M.W. Hypothalamic inflammation: Marker or mechanism of obesity pathogenesis? Diabetes 2013, 62, 2629–2634. [Google Scholar] [CrossRef] [PubMed]
- Guillemot-Legris, O.; Muccioli, G.G. Obesity-Induced Neuroinflammation: Beyond the Hypothalamus. Trends Neurosci. 2017, 40, 237–253. [Google Scholar] [CrossRef] [PubMed]
- Prinz, M.; Erny, D.; Hagemeyer, N. Ontogeny and homeostasis of CNS myeloid cells. Nat. Immunol. 2017, 18, 385–392. [Google Scholar] [CrossRef]
- Kälin, S.; Heppner, F.L.; Bechmann, I.; Prinz, M.; Tschöp, M.H.; Yi, C.-X. Hypothalamic innate immune reaction in obesity. Nat. Rev. Endocrinol. 2015, 11, 339–351. [Google Scholar] [CrossRef]
- Bachiller, S.; Jiménez-Ferrer, I.; Paulus, A.; Yang, Y.; Swanberg, M.; Deierborg, T.; Boza-Serrano, A. Microglia in Neurological Diseases: A Road Map to Brain-Disease Dependent-Inflammatory Response. Front. Cell. Neurosci. 2018, 12, 488. [Google Scholar] [CrossRef]
- Kwon, H.S.; Koh, S.-H. Neuroinflammation in neurodegenerative disorders: The roles of microglia and astrocytes. Transl. Neurodegener. 2020, 9, 42. [Google Scholar] [CrossRef]
- Geloso, M.C.; Corvino, V.; Marchese, E.; Serrano, A.; Michetti, F.; D’Ambrosi, N. The Dual Role of Microglia in ALS: Mechanisms and Therapeutic Approaches. Front. Aging Neurosci. 2017, 9, 242. [Google Scholar] [CrossRef]
- Zhan, J.; Mann, T.; Joost, S.; Behrangi, N.; Frank, M.; Kipp, M. The Cuprizone Model: Dos and Do Nots. Cells 2020, 9, 843. [Google Scholar] [CrossRef] [PubMed]
- Betlazar, C.; Middleton, R.J.; Banati, R.; Liu, G.-J. The Translocator Protein (TSPO) in Mitochondrial Bioenergetics and Immune Processes. Cells 2020, 9, 512. [Google Scholar] [CrossRef]
- Werry, E.L.; Bright, F.M.; Piguet, O.; Ittner, L.M.; Halliday, G.M.; Hodges, J.R.; Kiernan, M.C.; Loy, C.L.; Kril, J.J.; Kassiou, M. Recent Developments in TSPO PET Imaging as A Biomarker of Neuroinflammation in Neurodegenerative Disorders. Int. J. Mol. Sci. 2019, 20, 3161. [Google Scholar] [CrossRef] [PubMed]
- Coenen, H.H.; Gee, A.D.; Adam, M.; Antoni, G.; Cutler, C.S.; Fujibayashi, Y.; Min Jeong, J.; Mach, R.H.; Mindt, T.L.; Pike, V.W.; et al. Consensus nomenclature rules for radiopharmaceutical chemistry—Setting the record straight. Nucl. Med. Biol. 2017, 55, v–xi. [Google Scholar] [CrossRef] [PubMed]
- Chen, M.-K.; Guilarte, T.R. Translocator protein 18 kDa (TSPO): Molecular sensor of brain injury and repair. Pharmacol. Ther. 2008, 118, 1–17. [Google Scholar] [CrossRef]
- Deussing, M.; Blume, T.; Vomacka, L.; Mahler, C.; Focke, C.; Todica, A.; Unterrainer, M.; Albert, N.L.; Lindner, S.; von Ungern-Sternberg, B.; et al. Coupling between physiological TSPO expression in brain and myocardium allows stabilization of late-phase cerebral 18FGE180 PET quantification. Neuroimage 2018, 165, 83–91. [Google Scholar] [CrossRef]
- Rominger, A.; Brendel, M.; Burgold, S.; Keppler, K.; Baumann, K.; Xiong, G.; Mille, E.; Gildehaus, F.-J.; Carlsen, J.; Schlichtinger, J.; et al. Longitudinal assessment of cerebral β-amyloid deposition in mice overexpressing Swedish mutant β-amyloid precursor protein using 18F-florbetaben PET. J. Nucl. Med. 2013, 54, 1127–1134. [Google Scholar] [CrossRef]
- Lee, Y.; Park, Y.; Nam, H.; Lee, J.-W.; Yu, S.-W. Translocator protein (TSPO): The new story of the old protein in neuroinflammation. BMB Rep. 2020, 53, 20–27. [Google Scholar] [CrossRef]
- van Camp, N.; Lavisse, S.; Roost, P.; Gubinelli, F.; Hillmer, A.; Boutin, H. TSPO imaging in animal models of brain diseases. Eur. J. Nucl. Med. Mol. Imaging 2021, 49, 77–109. [Google Scholar] [CrossRef]
- Barron, A.M.; Tokunaga, M.; Zhang, M.-R.; Ji, B.; Suhara, T.; Higuchi, M. Assessment of neuroinflammation in a mouse model of obesity and β-amyloidosis using PET. J. Neuroinflamm. 2016, 13, 221. [Google Scholar] [CrossRef]
- Müller, L.; Power Guerra, N.; Stenzel, J.; Rühlmann, C.; Lindner, T.; Krause, B.J.; Vollmar, B.; Teipel, S.; Kuhla, A. Long-Term Caloric Restriction Attenuates β-Amyloid Neuropathology and Is Accompanied by Autophagy in APPswe/PS1delta9 Mice. Nutrients 2021, 13, 985. [Google Scholar] [CrossRef]
- Rühlmann, C.; Dannehl, D.; Brodtrück, M.; Adams, A.C.; Stenzel, J.; Lindner, T.; Krause, B.J.; Vollmar, B.; Kuhla, A. Neuroprotective Effects of the FGF21 Analogue LY2405319. J. Alzheimers Dis. 2021, 80, 357–369. [Google Scholar] [CrossRef] [PubMed]
- Mirrione, M.M.; Schiffer, W.K.; Fowler, J.S.; Alexoff, D.L.; Dewey, S.L.; Tsirka, S.E. A novel approach for imaging brain-behavior relationships in mice reveals unexpected metabolic patterns during seizures in the absence of tissue plasminogen activator. Neuroimage 2007, 38, 34–42. [Google Scholar] [CrossRef]
- Kleiber, M. Body size and metabolic rate. Physiol. Rev. 1947, 27, 511–541. [Google Scholar] [CrossRef] [PubMed]
- Kuhla, A.; Lange, S.; Holzmann, C.; Maass, F.; Petersen, J.; Vollmar, B.; Wree, A. Lifelong caloric restriction increases working memory in mice. PLoS ONE 2013, 8, e68778. [Google Scholar] [CrossRef] [PubMed]
- Power Guerra, N.; Müller, L.; Pilz, K.; Glatzel, A.; Jenderny, D.; Janowitz, D.; Vollmar, B.; Kuhla, A. Dietary-Induced Low-Grade Inflammation in the Liver. Biomedicines 2020, 8, 587. [Google Scholar] [CrossRef]
- Patkar, O.L.; Mohamed, A.Z.; Narayanan, A.; Mardon, K.; Cowin, G.; Bhalla, R.; Stimson, D.H.R.; Kassiou, M.; Beecher, K.; Belmer, A.; et al. A binge high sucrose diet provokes systemic and cerebral inflammation in rats without inducing obesity. Sci. Rep. 2021, 11, 11252. [Google Scholar] [CrossRef]
- Cavaliere, G.; Trinchese, G.; Penna, E.; Cimmino, F.; Pirozzi, C.; Lama, A.; Annunziata, C.; Catapano, A.; Mattace Raso, G.; Meli, R.; et al. High-Fat Diet Induces Neuroinflammation and Mitochondrial Impairment in Mice Cerebral Cortex and Synaptic Fraction. Front. Cell. Neurosci. 2019, 13, 509. [Google Scholar] [CrossRef] [PubMed]
- Dutheil, S.; Ota, K.T.; Wohleb, E.S.; Rasmussen, K.; Duman, R.S. High-Fat Diet Induced Anxiety and Anhedonia: Impact on Brain Homeostasis and Inflammation. Neuropsychopharmacology 2016, 41, 1874–1887. [Google Scholar] [CrossRef]
- Kennedy, A.J.; Ellacott, K.L.J.; King, V.L.; Hasty, A.H. Mouse models of the metabolic syndrome. Dis. Models Mech. 2010, 3, 156–166. [Google Scholar] [CrossRef]
- Tschöp, M.; Heiman, M.L. Rodent obesity models: An overview. Exp. Clin. Endocrinol. Diabetes 2001, 109, 307–319. [Google Scholar] [CrossRef]
- Kim, M.S.; Choi, M.-S.; Han, S.N. High fat diet-induced obesity leads to proinflammatory response associated with higher expression of NOD2 protein. Nutr. Res. Pract. 2011, 5, 219–223. [Google Scholar] [CrossRef] [PubMed]
- Kim, J.D.; Yoon, N.A.; Jin, S.; Diano, S. Microglial UCP2 Mediates Inflammation and Obesity Induced by High-Fat Feeding. Cell Metab. 2019, 30, 952–962.e5. [Google Scholar] [CrossRef] [PubMed]
- Li, J.; Wu, H.; Liu, Y.; Yang, L. High fat diet induced obesity model using four strainsof mice: Kunming, C57BL/6, BALB/c and ICR. Exp. Anim. 2020, 69, 326–335. [Google Scholar] [CrossRef] [PubMed]
- de Bona Schraiber, R.; de Mello, A.H.; Garcez, M.L.; de Bem Silveira, R.; Pereira Zacaron, R.; Pereira de Souza Goldim, M.; Budni, J.; Lock Silveira, P.C.; Petronilho, F.; Kozuchovski Ferreira, G.; et al. Diet-induced obesity causes hypothalamic neurochemistry alterations in Swiss mice. Metab. Brain Dis. 2019, 34, 565–573. [Google Scholar] [CrossRef] [PubMed]
- Thaler, J.P.; Yi, C.-X.; Schur, E.A.; Guyenet, S.J.; Hwang, B.H.; Dietrich, M.O.; Zhao, X.; Sarruf, D.A.; Izgur, V.; Maravilla, K.R.; et al. Obesity is associated with hypothalamic injury in rodents and humans. J. Clin. Investig. 2012, 122, 153–162. [Google Scholar] [CrossRef]
- Waise, T.M.Z.; Toshinai, K.; Naznin, F.; NamKoong, C.; Moin, A.S.M.; Sakoda, H.; Nakazato, M. One-day high-fat diet induces inflammation in the nodose ganglion and hypothalamus of mice. Biochem. Biophys. Res. Commun. 2015, 464, 1157–1162. [Google Scholar] [CrossRef] [PubMed]
- Nakandakari, S.C.B.R.; Muñoz, V.R.; Kuga, G.K.; Calais Gaspar, R.; Ramos Sant’Ana, M.; Betim Pavan, I.C.; Salvino da Silva, L.G.; Morelli, A.P.; Moreira Simabuco, F.; Sanchez Ramos da Silva, A.; et al. Short-term high-fat diet modulates several inflammatory, ER stress, and apoptosis markers in the hippocampus of young mice. Brain Behav. Immun. 2019, 79, 284–293. [Google Scholar] [CrossRef] [PubMed]
- Hao, S.; Dey, A.; Yu, X.; Stranahan, A.M. Dietary obesity reversibly induces synaptic stripping by microglia and impairs hippocampal plasticity. Brain Behav. Immun. 2016, 51, 230–239. [Google Scholar] [CrossRef]
- Ávalos, Y.; Kerr, B.; Maliqueo, M.; Dorfman, M. Cell and molecular mechanisms behind diet-induced hypothalamic inflammation and obesity. J. Neuroendocrinol. 2018, 30, e12598. [Google Scholar] [CrossRef]
- Lainez, N.M.; Jonak, C.R.; Nair, M.G.; Ethell, I.M.; Wilson, E.H.; Carson, M.J.; Coss, D. Diet-Induced Obesity Elicits Macrophage Infiltration and Reduction in Spine Density in the Hypothalami of Male but Not Female Mice. Front. Immunol. 2018, 9, 1992. [Google Scholar] [CrossRef]
- Robison, L.S.; Albert, N.M.; Camargo, L.A.; Anderson, B.M.; Salinero, A.E.; Riccio, D.A.; Abi-Ghanem, C.; Gannon, O.J.; Zuloaga, K.L. High-Fat Diet-Induced Obesity Causes Sex-Specific Deficits in Adult Hippocampal Neurogenesis in Mice. eNeuro 2020, 7, ENEURO.0391-19.2019. [Google Scholar] [CrossRef]
- Leonardi, B.F.; Gosmann, G.; Zimmer, A.R. Modeling Diet-Induced Metabolic Syndrome in Rodents. Mol. Nutr. Food Res. 2020, 64, e2000249. [Google Scholar] [CrossRef] [PubMed]
- Sanguinetti, E.; Guzzardi, M.A.; Panetta, D.; Tripodi, M.; de Sena, V.; Quaglierini, M.; Burchielli, S.; Salvadori, P.A.; Iozzo, P. Combined Effect of Fatty Diet and Cognitive Decline on Brain Metabolism, Food Intake, Body Weight, and Counteraction by Intranasal Insulin Therapy in 3×Tg Mice. Front. Cell. Neurosci. 2019, 13, 188. [Google Scholar] [CrossRef] [PubMed]
- Tuulari, J.J.; Karlsson, H.K.; Hirvonen, J.; Hannukainen, J.C.; Bucci, M.; Helmiö, M.; Ovaska, J.; Soinio, M.; Salminen, P.; Savisto, N.; et al. Weight loss after bariatric surgery reverses insulin-induced increases in brain glucose metabolism of the morbidly obese. Diabetes 2013, 62, 2747–2751. [Google Scholar] [CrossRef] [PubMed]
- Miller, A.A.; Spencer, S.J. Obesity and neuroinflammation: A pathway to cognitive impairment. Brain Behav. Immun. 2014, 42, 10–21. [Google Scholar] [CrossRef]
- Herfert, K.; Mannheim, J.G.; Kuebler, L.; Marciano, S.; Amend, M.; Parl, C.; Napieczynska, H.; Maier, F.M.; Castaneda Vega, S.; Pichler, B.J. Quantitative Rodent Brain Receptor Imaging. Mol. Imaging Biol. 2020, 22, 223–244. [Google Scholar] [CrossRef]
- Lammertsma, A.A. Forward to the Past: The Case for Quantitative PET Imaging. J. Nucl. Med. 2017, 58, 1019–1024. [Google Scholar] [CrossRef]
- Zatcepin, A.; Heindl, S.; Schillinger, U.; Kaiser, L.; Lindner, S.; Bartenstein, P.; Kopczak, A.; Liesz, A.; Brendel, M.; Ziegler, S.I. Reduced Acquisition Time 18FGE-180 PET Scanning Protocol Replaces Gold-Standard Dynamic Acquisition in a Mouse Ischemic Stroke Model. Front. Med. 2022, 9, 830020. [Google Scholar] [CrossRef]
- Lyoo, C.H.; Ikawa, M.; Liow, J.-S.; Zoghbi, S.Z.; Morse, C.L.; Pike, V.W.; Fujita, M.; Innis, R.B.; Kreisl, W.C. Cerebellum Can Serve As a Pseudo-Reference Region in Alzheimer Disease to Detect Neuroinflammation Measured with PET Radioligand Binding to Translocator Protein. J. Nucl. Med. 2015, 56, 701–706. [Google Scholar] [CrossRef]
- de Paula, G.C.; Brunetta, H.S.; Engel, D.F.; Gaspar, J.M.; Velloso, L.A.; Engblom, D.; de Oliveira, J.; de Bem, A.F. Hippocampal Function Is Impaired by a Short-Term High-Fat Diet in Mice: Increased Blood-Brain Barrier Permeability and Neuroinflammation as Triggering Events. Front. Neurosci. 2021, 15, 734158. [Google Scholar] [CrossRef] [PubMed]
- Unterrainer, M.; Fleischmann, D.F.; Diekmann, C.; Vomacka, L.; Lindner, S.; Vettermann, F.; Brendel, M.; Wenter, V.; Ertl-Wagner, B.; Herms, J.; et al. Comparison of 18F-GE-180 and dynamic 18F-FET PET in high grade glioma: A double-tracer pilot study. Eur. J. Nucl. Med. Mol. Imaging 2019, 46, 580–590. [Google Scholar] [CrossRef]
- Zanotti-Fregonara, P.; Veronese, M.; Pascual, B.; Rostomily, R.C.; Turkheimer, F.; Masdeu, J.C. The validity of 18F-GE180 as a TSPO imaging agent. Eur. J. Nucl. Med. Mol. Imaging 2019, 46, 1205–1207. [Google Scholar] [CrossRef] [PubMed]
- Satoh, J.; Kino, Y.; Asahina, N.; Takitani, M.; Miyoshi, J.; Ishida, T.; Saito, Y. TMEM119 marks a subset of microglia in the human brain. Neuropathology 2016, 36, 39–49. [Google Scholar] [CrossRef]
- Young, K.F.; Gardner, R.; Sariana, V.; Whitman, S.A.; Bartlett, M.J.; Falk, T.; Morrison, H.W. Can quantifying morphology and TMEM119 expression distinguish between microglia and infiltrating macrophages after ischemic stroke and reperfusion in male and female mice? J. Neuroinflamm. 2021, 18, 58. [Google Scholar] [CrossRef] [PubMed]
- Hol, E.M.; Pekny, M. Glial fibrillary acidic protein (GFAP) and the astrocyte intermediate filament system in diseases of the central nervous system. Curr. Opin. Cell Biol. 2015, 32, 121–130. [Google Scholar] [CrossRef] [PubMed]
- Boorman, D.C.; Keay, K.A. Sex differences in morphine sensitivity are associated with differential glial expression in the brainstem of rats with neuropathic pain. J. Neurosci. Res. 2022, 100, 1890–1907. [Google Scholar] [CrossRef]
- Imai, Y.; Ibata, I.; Ito, D.; Ohsawa, K.; Kohsaka, S. A novel gene iba1 in the major histocompatibility complex class III region encoding an EF hand protein expressed in a monocytic lineage. Biochem. Biophys. Res. Commun. 1996, 224, 855–862. [Google Scholar] [CrossRef]
- Ito, D.; Imai, Y.; Ohsawa, K.; Nakajima, K.; Fukuuchi, Y.; Kohsaka, S. Microglia-specific localisation of a novel calcium binding protein, Iba1. Mol. Brain Res. 1998, 57, 1–9. [Google Scholar] [CrossRef]
- Abedi, A.; Foroutan, T.; Mohaghegh Shalmani, L.; Dargahi, L. Sex-specific effects of high-fat diet on rat brain glucose metabolism and early-onset dementia symptoms. Mech. Ageing Dev. 2023, 211, 111795. [Google Scholar] [CrossRef]
- Yunna, C.; Mengru, H.; Lei, W.; Weidong, C. Macrophage M1/M2 polarization. Eur. J. Pharmacol. 2020, 877, 173090. [Google Scholar] [CrossRef] [PubMed]
- Coats, B.R.; Schoenfelt, K.Q.; Barbosa-Lorenzi, V.C.; Peris, E.; Cui, C.; Hoffman, A.; Zhou, G.; Fernandez, S.; Zhai, L.; Hall, B.A.; et al. Metabolically Activated Adipose Tissue Macrophages Perform Detrimental and Beneficial Functions during Diet-Induced Obesity. Cell Rep. 2017, 20, 3149–3161. [Google Scholar] [CrossRef] [PubMed]
- Kratz, M.; Coats, B.R.; Hisert, K.B.; Hagman, D.; Mutskov, V.; Peris, E.; Schoenfelt, K.Q.; Kuzma, J.N.; Larson, I.; Billing, P.S.; et al. Metabolic dysfunction drives a mechanistically distinct proinflammatory phenotype in adipose tissue macrophages. Cell Metab. 2014, 20, 614–625. [Google Scholar] [CrossRef] [PubMed]
- Kim, K.-A.; Gu, W.; Lee, I.-A.; Joh, E.-H.; Kim, D.-H. High fat diet-induced gut microbiota exacerbates inflammation and obesity in mice via the TLR4 signaling pathway. PLoS ONE 2012, 7, e47713. [Google Scholar] [CrossRef] [PubMed]
- van der Heijden, R.A.; Sheedfar, F.; Morrison, M.C.; Hommelberg, P.P.H.; Kor, D.; Kloosterhuis, N.J.; Gruben, N.; Youssef, S.A.; de Bruin, A.; Hofker, M.H.; et al. High-fat diet induced obesity primes inflammation in adipose tissue prior to liver in C57BL/6j mice. Aging 2015, 7, 256–268. [Google Scholar] [CrossRef] [PubMed]
- Robblee, M.M.; Kim, C.C.; Porter Abate, J.; Valdearcos, M.; Sandlund, K.L.M.; Shenoy, M.K.; Volmer, R.; Iwawaki, T.; Koliwad, S.K. Saturated Fatty Acids Engage an IRE1α-Dependent Pathway to Activate the NLRP3 Inflammasome in Myeloid Cells. Cell Rep. 2016, 14, 2611–2623. [Google Scholar] [CrossRef]
- Mendiola, A.S.; Cardona, A.E. The IL-1β phenomena in neuroinflammatory diseases. J. Neural Transm. 2017, 125, 781–795. [Google Scholar] [CrossRef]
- Sobesky, J.L.; Barrientos, R.M.; de May, H.S.; Thompson, B.M.; Weber, M.D.; Watkins, L.R.; Maier, S.F. High-fat diet consumption disrupts memory and primes elevations in hippocampal IL-1β, an effect that can be prevented with dietary reversal or IL-1 receptor antagonism. Brain Behav. Immun. 2014, 42, 22–32. [Google Scholar] [CrossRef]


Disclaimer/Publisher’s Note: The statements, opinions and data contained in all publications are solely those of the individual author(s) and contributor(s) and not of MDPI and/or the editor(s). MDPI and/or the editor(s) disclaim responsibility for any injury to people or property resulting from any ideas, methods, instructions or products referred to in the content. |
© 2023 by the authors. Licensee MDPI, Basel, Switzerland. This article is an open access article distributed under the terms and conditions of the Creative Commons Attribution (CC BY) license (https://creativecommons.org/licenses/by/4.0/).