Abstract
USA300, a dominant clone of community-acquired methicillin-resistant Staphylococcus aureus (CA-MRSA), is circulating globally and can cause necrotizing pneumonia with high morbidity and mortality. To further reveal the host anti-MRSA infection immune response, we established a mouse model of acute primary MRSA pneumonia challenged with aerosols of the USA300 clone. A time-course transcriptome analysis of the lungs collected at 0, 12, 24, 48 and 96 h post-infection (hpi) was conducted using RNA sequencing (RNA-seq) and multiple bioinformatic analysis methods. The change trend of histopathology and five innate immune cell (neutrophils, mononuclear cells, eosinophils, macrophages, DC cells) proportions in the lungs after infection was also examined. We observed a distinct acute pulmonary recovery process. A rapid initiation period of inflammation was present at 12 hpi, during which the IL-17 pathway dominantly mediated inflammation and immune defense. The main stages of host inflammatory response occurred at 24 and 48 hpi, and the regulation of interferon activation and macrophage polarization played an important role in the control of inflammatory balance at this stage. At 96 hpi, cellular proliferation processes associated with host repair were observed, as well as adaptive immunity and complement system responses involving C1q molecules. More importantly, the data provide new insight into and identify potential functional genes involved in the checks and balances occurring between host anti-inflammatory and proinflammatory responses. To the best of our knowledge, this is the first study to investigate transcriptional responses throughout the inflammatory recovery process in the lungs after MRSA infection. Our study uncovers valuable research targets for key regulatory mechanisms underlying the pathogenesis of MRSA lung infections, which may help to develop novel treatment strategies for MRSA pneumonia.
1. Introduction
Staphylococcus aureus (SA) is the most frequent cause of lower respiratory tract infection. Over the last three decades, the morbidity and mortality of SA pneumonia have increased dramatically because of the emergence of methicillin-resistant Staphylococcus aureus (MRSA) [1,2,3]. MRSA, a superbug that accounts for 50% of SA pneumonia and results in mortality as high as 56% [4,5], is on the rise globally and has become one of the biggest public health threats since the development of antibiotic treatment [6,7]. Compared with hospital-acquired MRSA (HA-MRSA), community-acquired MRSA (CA-MRSA) can occur in healthy individuals unrelated to the medical environment [8], indicating that CA-MRSA strains possess greater virulence and transmissibility than traditional HA-MRSA strains. MRSA has been divided into 12 distinct genetic clusters, named USA100 to USA1200 [8]. The USA300 and USA400 clone are the main strains of CA-MRSA [9], but USA300 is the dominant causative pathogen, spreading more widely and accounting for 97% of all CA-MRSA infections [3,8,10]. Vancomycin and linezolid are currently the only antibiotics for treatment of MRSA pneumonia, but both are limited by side effects [11,12] and may aggravate the antimicrobial resistance. Even with these treatments, there is a high mortality rate [13]. In consequence, the increased antibiotic resistance situation has heightened research efforts in developing new and alternative control strategies for MRSA pneumonia.
The different outcomes of confrontations between the host immune system and infectious bacteria determine the course and outcome of a disease. Hence, understanding the host’s immune response is critical to developing new intervention strategies. The first line of defense during infection is regulated by the host’s innate immune response. As the key cells of the innate immune system, macrophages and neutrophils can effectively control the infection of MRSA. Neutrophils have been extensively studied because of their strong bactericidal ability in the defense against MRSA infection [14,15,16]. The loss of alveolar macrophages can inhibit the killing of lung bacteria and significantly increase the mortality rate [17,18]. However, MRSA secretes a variety of virulence factors, including but not limited to hemolysins, extracellular proteases, and leuko-cytochromes that help it evade host immune defenses [19]. Moreover, growing evidence indicates that SA has evolved to utilize host innate immune molecules to evade eradication. The absence of certain immune molecules can surprisingly improve survival in mice [20]. Therefore, in the battle between the host and MRSA, the key mechanism determining the final outcome remains unclear.
Based on the above, we used a highly virulent and multidrug-resistant strain that belongs to the MRSA USA300 clone to develop a mouse model of primary MRSA pneumonia, and then performed time-course RNA sequencing of lung tissues from the mice to reveal dynamic changes in the host lung immune system. This work can provide a deeper understanding of the interaction mechanisms of MRSA with the host immune system and provide a new target for nonantibiotic treatment of MRSA pneumonia.
2. Materials and Methods
2.1. Bacterial Strain and Growth Conditions
The ATCC BAA-1556 strain, which belongs to the USA300 clone and is resistant to a variety of antibiotics such as methicillin and tetracycline, is maintained in our laboratory. The strain was inoculated in brain heart infusion (BHI) broth (BD Biosciences, Lawrence, KS) and grown overnight at 37 °C in a shaking incubator at 220 rpm for 12–14 h. The overnight culture was diluted at 1:200 with BHI and maintained at 37 °C for 3.5 h at 220 rpm. Then, the culture was further diluted and incubated for another 3.5–4 h to achieve OD600 1.8–2.0. After that, the culture was adjusted to OD600 1.8 for subsequent use, a concentration of approximately 6 × 10⁸ CFU/mL.
2.2. Animal Infection and Sample Acquisition
Six-week-old female C57BL/6Cnc mice were purchased from Vital River Laboratories (Beijing, China) for use in experiments. The mice were housed under pathogen-free conditions with free access to food and water under a 12:12 h light:dark cycle. Before the experiment, all the mice were divided into five groups (0 h control group and 12 h, 24 h, 48 h and 96 h postinfection groups). Each group included six mice, three of which were used for pathological detection and RNA sequencing, and three of which were used for flow cytometry. Control group mice were administered 50 μL saline, and mice in the four infection groups were challenged with 50 μL USA300 (1 × 10⁸ CFU) via aerosolized intratracheal inoculation, as described before [21]. Briefly, mice were anesthetized by intraperitoneal injection of pentobarbital sodium at a weight of 70 mg/kg. The mice were then immobilized, and the bacterial suspension or saline was aerosolized by a Micro Sprayer (Huironghe Company, Beijing, China) and delivered into the lungs through the tracheal branch of the mice. Control group mice were euthanized immediately after inoculation as 0 h samples. Other groups of mice were euthanized at 12, 24, 48 and 96 h after lung infection. The lung tissues of three mice in each group were divided into two parts for pathological examination and RNA extraction and sequencing.
2.3. Histopathological Validation
The lung tissue specimens of mice were placed in 4% paraformaldehyde fixative solution, then the fixed tissues were sectioned, embedded in paraffin, and stained with hematoxylin–eosin (HE). A slice scanner, PANNORAMIC DESK/MIDI/250/1000 (3DHISTECH, BP, HU) was used for panoramic scanning and the supporting software CaseViewer 2.4 for browsing and screenshots.
2.4. RNA Extraction, Library Preparation, and Sequencing
Collected lungs were soaked in RNAlater stabilization solution (Invitrogen, Carlsbad, CA, USA), and total RNA was extracted using the purification kit RNAprep pure tissue kit (Tiangen, DP431, Beijing, China). For the RNA samples extracted, purity was determined by NanoPhotometer® (IMPLEN, Westlake Village, CA, USA). At the same time, the assay kit 2100 RNA Nano 6000 (Agilent Technologies, Santa Clara, CA, USA) was used to measure concentration and integrity.
After purity and integrity tests were passed, the samples were sent to Easyresearch Company (Beijing, China) for sequencing and library construction. Different index tags were selected following the Illumina® kit operation instructions to generate sequencing libraries. Then, V1.5 reagent was used to perform clustering and double-ended sequencing on the NovaSeq 6000 S4 platform to obtain 150 bp double-ended sequencing reads. To ensure data quality, the raw sequence must be filtered (removing excessive sequences containing sequenced connectors and low quality bases) to obtain a high-quality sequence (CleanData) that is then compared to the reference genome (mice) using HISAT2 (version 2.1.0). Finally, HTSeq (version 0.6.0) was used to calculate gene expression levels of all samples and to generate gene expression profile data in FPKM (fragments per kilobase million mapped reads) [22]. FPKM eliminates the effects of gene length and sequencing differences on gene expression [23].
2.5. Screening and Functional Analysis of DEGs
First, the distribution and repeatability of samples were examined by principal component analysis (PCA). Then, the edgeR package in R was used to standardize the gene expression levels of all samples and to screen for differential genes [24]. Triplicates of the RNA-seq experiments were analyzed separately and resulting p-values adjusted using the Benjamini–Hochberg method for controlling the false-discovery rate (FDR). Differentially expressed genes (DEGs) were defined based on a false-discovery rate (FDR) < 0.05 and log2|fold change| ≥ 1. Finally, the Clusterprofiler package in R was used for GO and KEGG enrichment analysis [25], with Benjamini–Hochberg again used to adjust the p-values. If the Padj value were less than 0.05, gene expression was considered significantly enriched.
2.6. Time-Series Gene Clustering
The Mfuzz R package [26] was used for cluster analysis of gene dynamic expression patterns based on a fuzzy C-means algorithm [27]. The cluster number was set to 6 and the fuzzy coefficient M was set to 2.
2.7. Construction of WGCNA and Core Gene Extraction
Weighted gene coexpression network analysis (WGCNA) was performed on 15 mouse lung samples using the WGCNA package in R [28]. Modules with a high correlation with sample characteristics were selected for further analysis (GO and KEGG enrichment). At the same time, Cytoscape (version 3.9.1) was used to visualize the gene interaction network and detect core genes in the network [29].
2.8. Flow Cytometric Analysis
For a better understanding of the pathological mechanisms of disease, we used flow cytometry to detect immune cell changes at corresponding time points. Single cells of lung tissue were obtained by digestion, removal of erythrocytes with a red blood cell lysis buffer and washing in phosphate-buffered saline (PBS) with 2% bovine serum albumin. Cells were then counted with a Countess II FL automated counter (Thermo Fisher Scientific, Waltham, MA, USA). Approximately 2 × 10⁶ cells per mouse were incubated in blocking solution containing 0.25% FcBlock (catalog number 553141, BD Biosciences, San Jose, CA, USA) in PBS for 15 min and then stained with fluorochrome conjugating antibodies for 30 min at 4 °C. After staining, cells were washed and fixed with 1% paraformaldehyde in PBS for 30 min, and then washed and resuspended in PBS with 2% bovine serum albumin. Flow cytometry was conducted with a BD FACSymphony A5 flow cytometer using BD FACSDiva software (BD Biosciences, San Jose, CA, USA). The antibodies used were: fixable viability stain 510 (mouse, BD Biosciences, 564,406); anti-CD45 (mouse, BD Biosciences, 564,279); anti-Ly6c (mouse, BioLegend, 128,011; San Diego, CA, USA) anti-Ly6G (mouse, BioLegend, 127,641); anti-CD11b (mouse, BioLegend, 101,237); anti-CD11c (mouse, BioLegend, 117,308); anti-CD64 (mouse, BioLegend, 139,305); anti-CD206 (mouse, BioLegend, 141,727); anti-CD86 (mouse, BioLegend, 105,014); anti-mouse F4/80 (mouse, BioLegend, 123,116); anti-Siglec-F (mouse, BioLegend, 155,507); and anti-I-A/I-E (mouse, BioLegend, 107,602). Data were analyzed by FlowJo Version 10 (BD Biosciences, San Jose, CA, USA). Experiments were performed in three replicates. The specific flow cytometric classification methods are shown in Figure S1.
2.9. Protein Interaction Network Analysis
The STRING (search tool for the retrieval of interacting genes/proteins) database was used to reveal functional protein–protein interactions (PPIs) among the genes in each module clustered by WGCNA.
2.10. Contrast qRT-PCR with RNA-Seq
To verify the results of RNA-seq data, the expression patterns of 16 DEGs at five time points were randomly selected for qRT-PCR verification. qRT-PCR was performed using a 7500 real-time PCR instrument (Life Technologies Holdings Pte Ltd., Singapore) and a total volume of 20 μL per reaction, including 10 μL TransStart Tip Green qPCR SuperMix, 2.4 μL of upstream and downstream primers (5 μM), and 7.6 μL of cDNA template. The reaction conditions were set as: 95 °C for 180 s, followed by 40 cycles at 95 °C for 15 s and 60 °C for 30 s, followed by 72 °C for 30 s. Each reaction was set up in triplicate.
We used Primer Express (version 3.0.1) to design primers, shown in Table S1. The β-actin gene was used as the reference gene for data normalization, and the relative expression values of selected genes were calculated by the 2−ΔΔCt. method. Correlations between RNA-seq and qRT-PCR data are given as Pearson correlation coefficients.
2.11. Statistical Analysis
Data are represented as means ± SEM. Flow analysis data were analyzed using a one-way ANOVA with Bonferroni’s multiple comparison test. All p values less than 0.05 were considered significant. Statistical analysis was performed using Prism 8.0 (GraphPad Software, La Jolla, CA, USA).
3. Results
3.1. Observations of Symptoms and Histopathology
All mice in the control group were healthy and energetic, but mice infected with USA300 deteriorated over time and showed severe hemorrhagic pulmonary inflammation. At 12 h post-infection (hpi), the behavior of infected mice changed, including slowness of movement and shortness of breath. At 24 hpi, all infected mice exhibited depression, polypnea and disordered fur, indicating that the disease had worsened over time. At 48 hpi, the symptoms of tachypnea and slowness of movement had improved. At 96 hpi, the mice were mostly recovered, with no depression, and normal breathing.
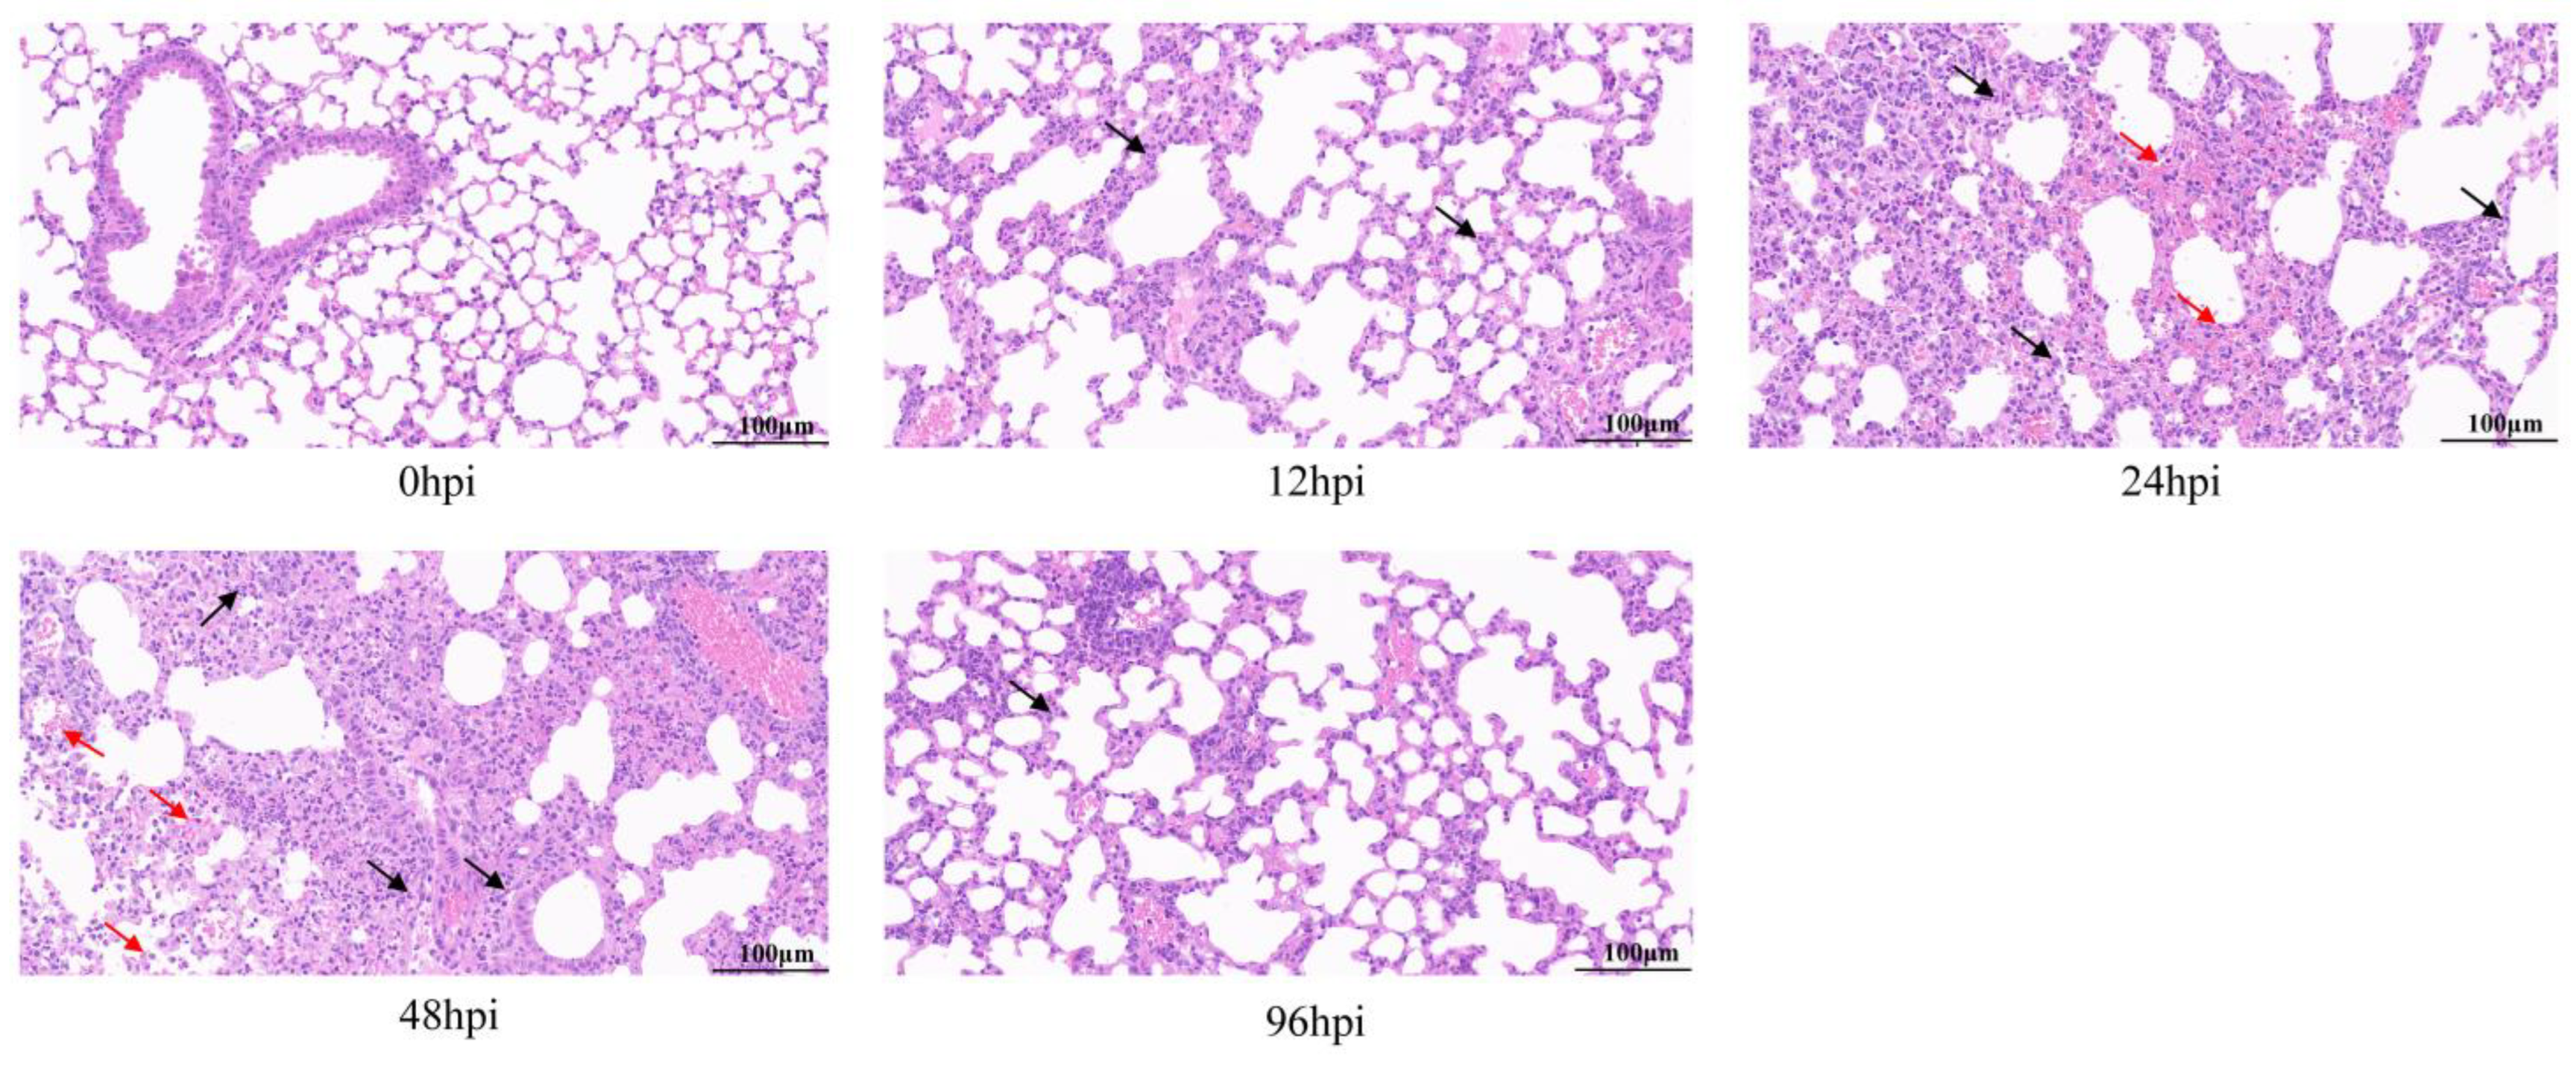
Histopathological analysis of the lungs by HE staining showed that all infected lung tissues had inflammatory symptoms (Figure 1). At 12 hpi, lymphocyte and neutrophil infiltration, partial alveolar wall thickening, and mild pulmonary edema were observed in lung tissues. At 24 and 48 hpi, lesions became worse, accompanied by more inflammatory cell infiltration, tissue bleeding and necrosis of epithelial cells. However, at 96 hpi, the degree of tissue lesion was reduced, bleeding and necrosis disappeared, inflammatory infiltration resolved, and most tissue structure had recovered.
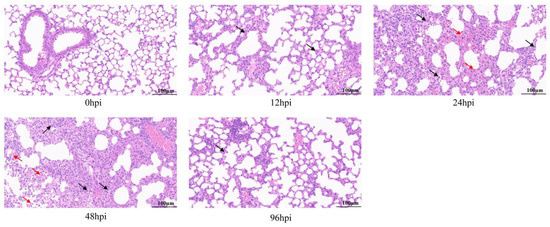
Figure 1.
Pathological analysis of lung tissue infected with MRSA by hematoxylin and eosin (H&E) staining. Mice were challenged with USA300 strain (ATCC BAA-1556) of 1 × 10⁸ CFU, and lung pathological changes were observed at 12, 24, 48 and 96 h after infection. Arrows show lesions: inflammatory cell infiltration is shown in black and bleeding is shown in red (original magnification = 40×; scale bar = 100 μm). hpi = hours post-infection.
Thus, lung inflammation and resolution occurred in mice within 96 hpi, suggesting a homeostasis repair process. In summary, we successfully established a mouse model of lung inflammation with USA300 infection and used it to obtain RNA-seq samples.
3.2. Identifications of Differential Genes and Enrichment Pathways
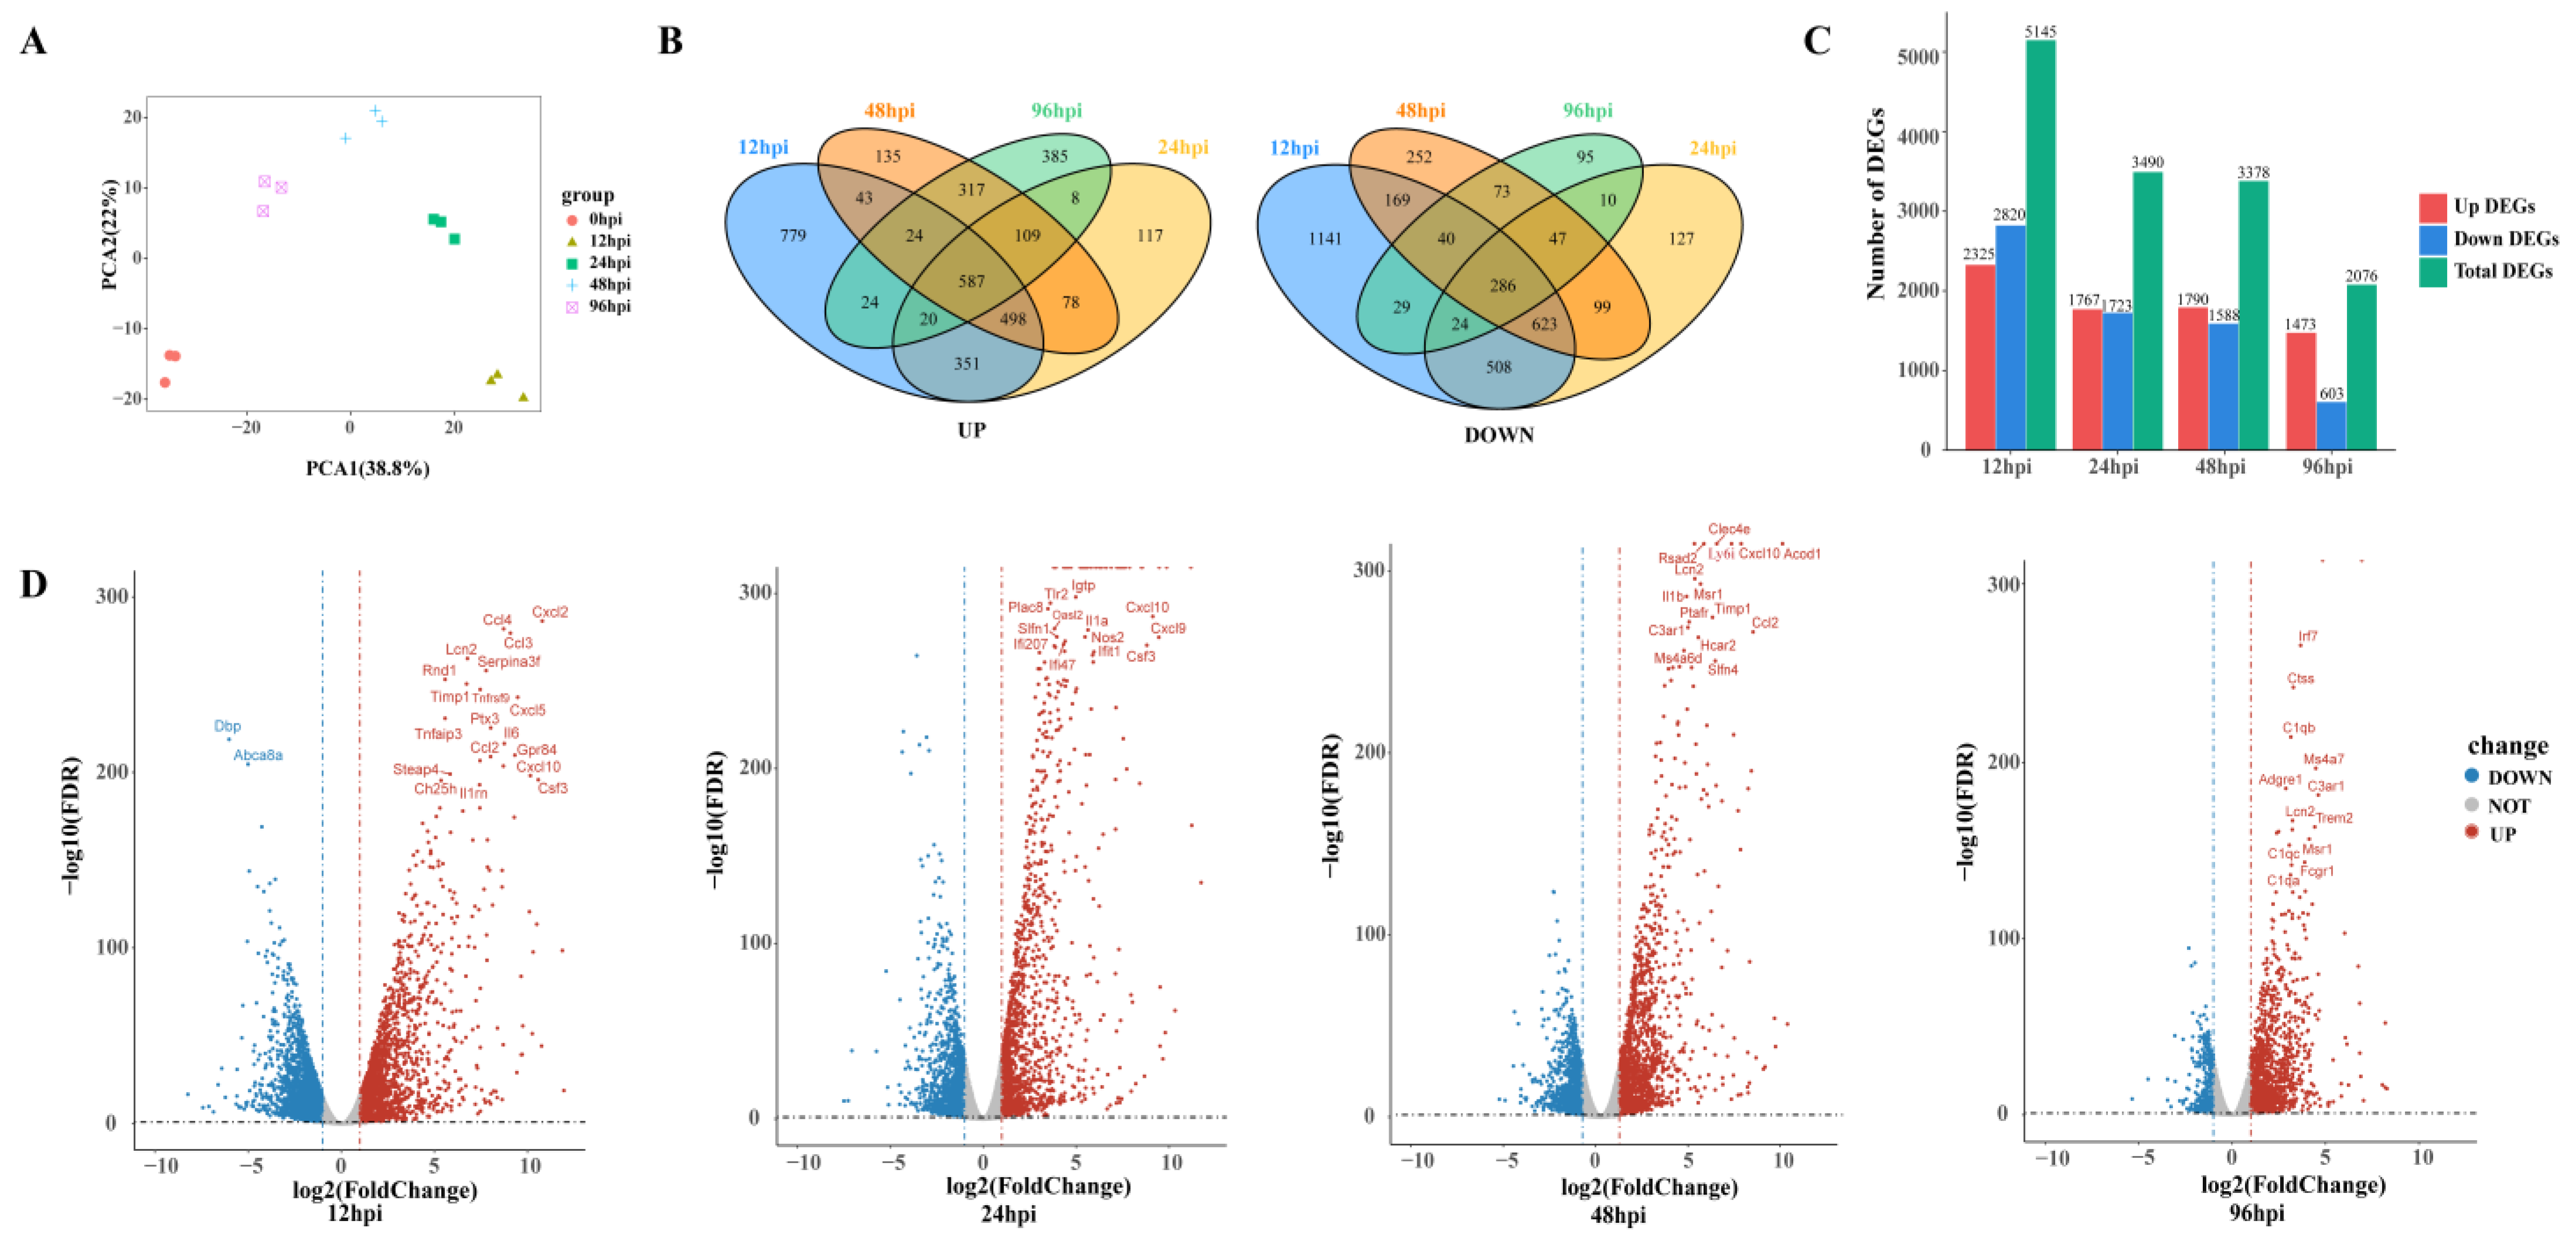
To detect transcriptional changes, we isolated and sequenced RNA from USA300-infected lung tissue to record gene expression profiles in a time-series fashion. Principal component analysis was used to assess the quality of data and the distribution of samples (Figure 2A). The first principal component (PCA1) accounted for 38.8% of the total expression differences in the first 1000 genes, and the second principal component (PCA2) accounted for 22%. Figure 2A reveals not only good reproducibility of replicate samples from the same time point, but also distinct transcriptional characteristics for samples from different time points.
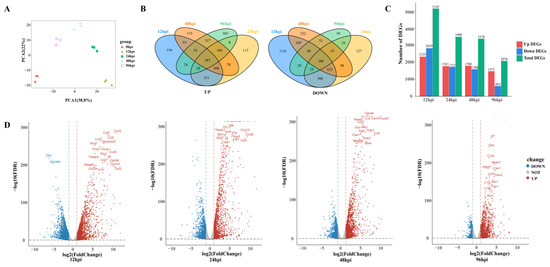
Figure 2.
An overview of transcriptome analysis. (A) Principal component analysis (PCA) results of lung tissue RNA-seq data after SA infection. The same color represents replicates of the same stage. (B) Venn diagram comparing the upregulation and downregulation differentially expressed genes (DEGs). (C) Histograms show different genes at different time points. (D) Volcano plot of RNA-seq transcriptome data displaying the pattern of gene expression. Significant DEGs (FDR p ≤ 0.05) are highlighted in red (upregulated) or blue (downregulated). Curatorial genes with specific biological functions are labeled.
A total of 6882 DEGs were identified across four MRSA infection time points. Compared with the control group, 695 and 265 genes were upregulated and downregulated, respectively, in all groups combined (Figure 2B). There were 5145 DEGs at 12 hpi, including 2325 upregulated genes and 2820 downregulated genes. By 96 hpi, the upregulated and downregulated genes had decreased to 1473 and 603, respectively (Figure 2C). The number of DEGs decreased over time, suggesting that the host has a repair process after lung infection.
At 12 hpi, most of the genes upregulated were related to promoting inflammatory response, such as chemokines (Cxcl2, Ccl4, Cxcl5, Ccl2, Cxcl10) and proinflammatory factors (Il6, Tnfrsf9, Tnfaip3, Lcn2), and genes related to the regulation of glucose metabolism and lipid metabolism (Steap4, Ch25h) were also upregulated at 24 hpi and 48 hpi, upregulated genes were mostly those involved in immune regulation, such as the activation and maturation of immune cells (Slfn4, Cd274, Rsad2, Ms4a6d, Clec4e). Complement-related genes (C1qb, C3a1, C1qc, C1qa) were significantly upregulated at 96 hpi (Figure 2D).
3.3. Analysis of Expression Patterns of DEGs
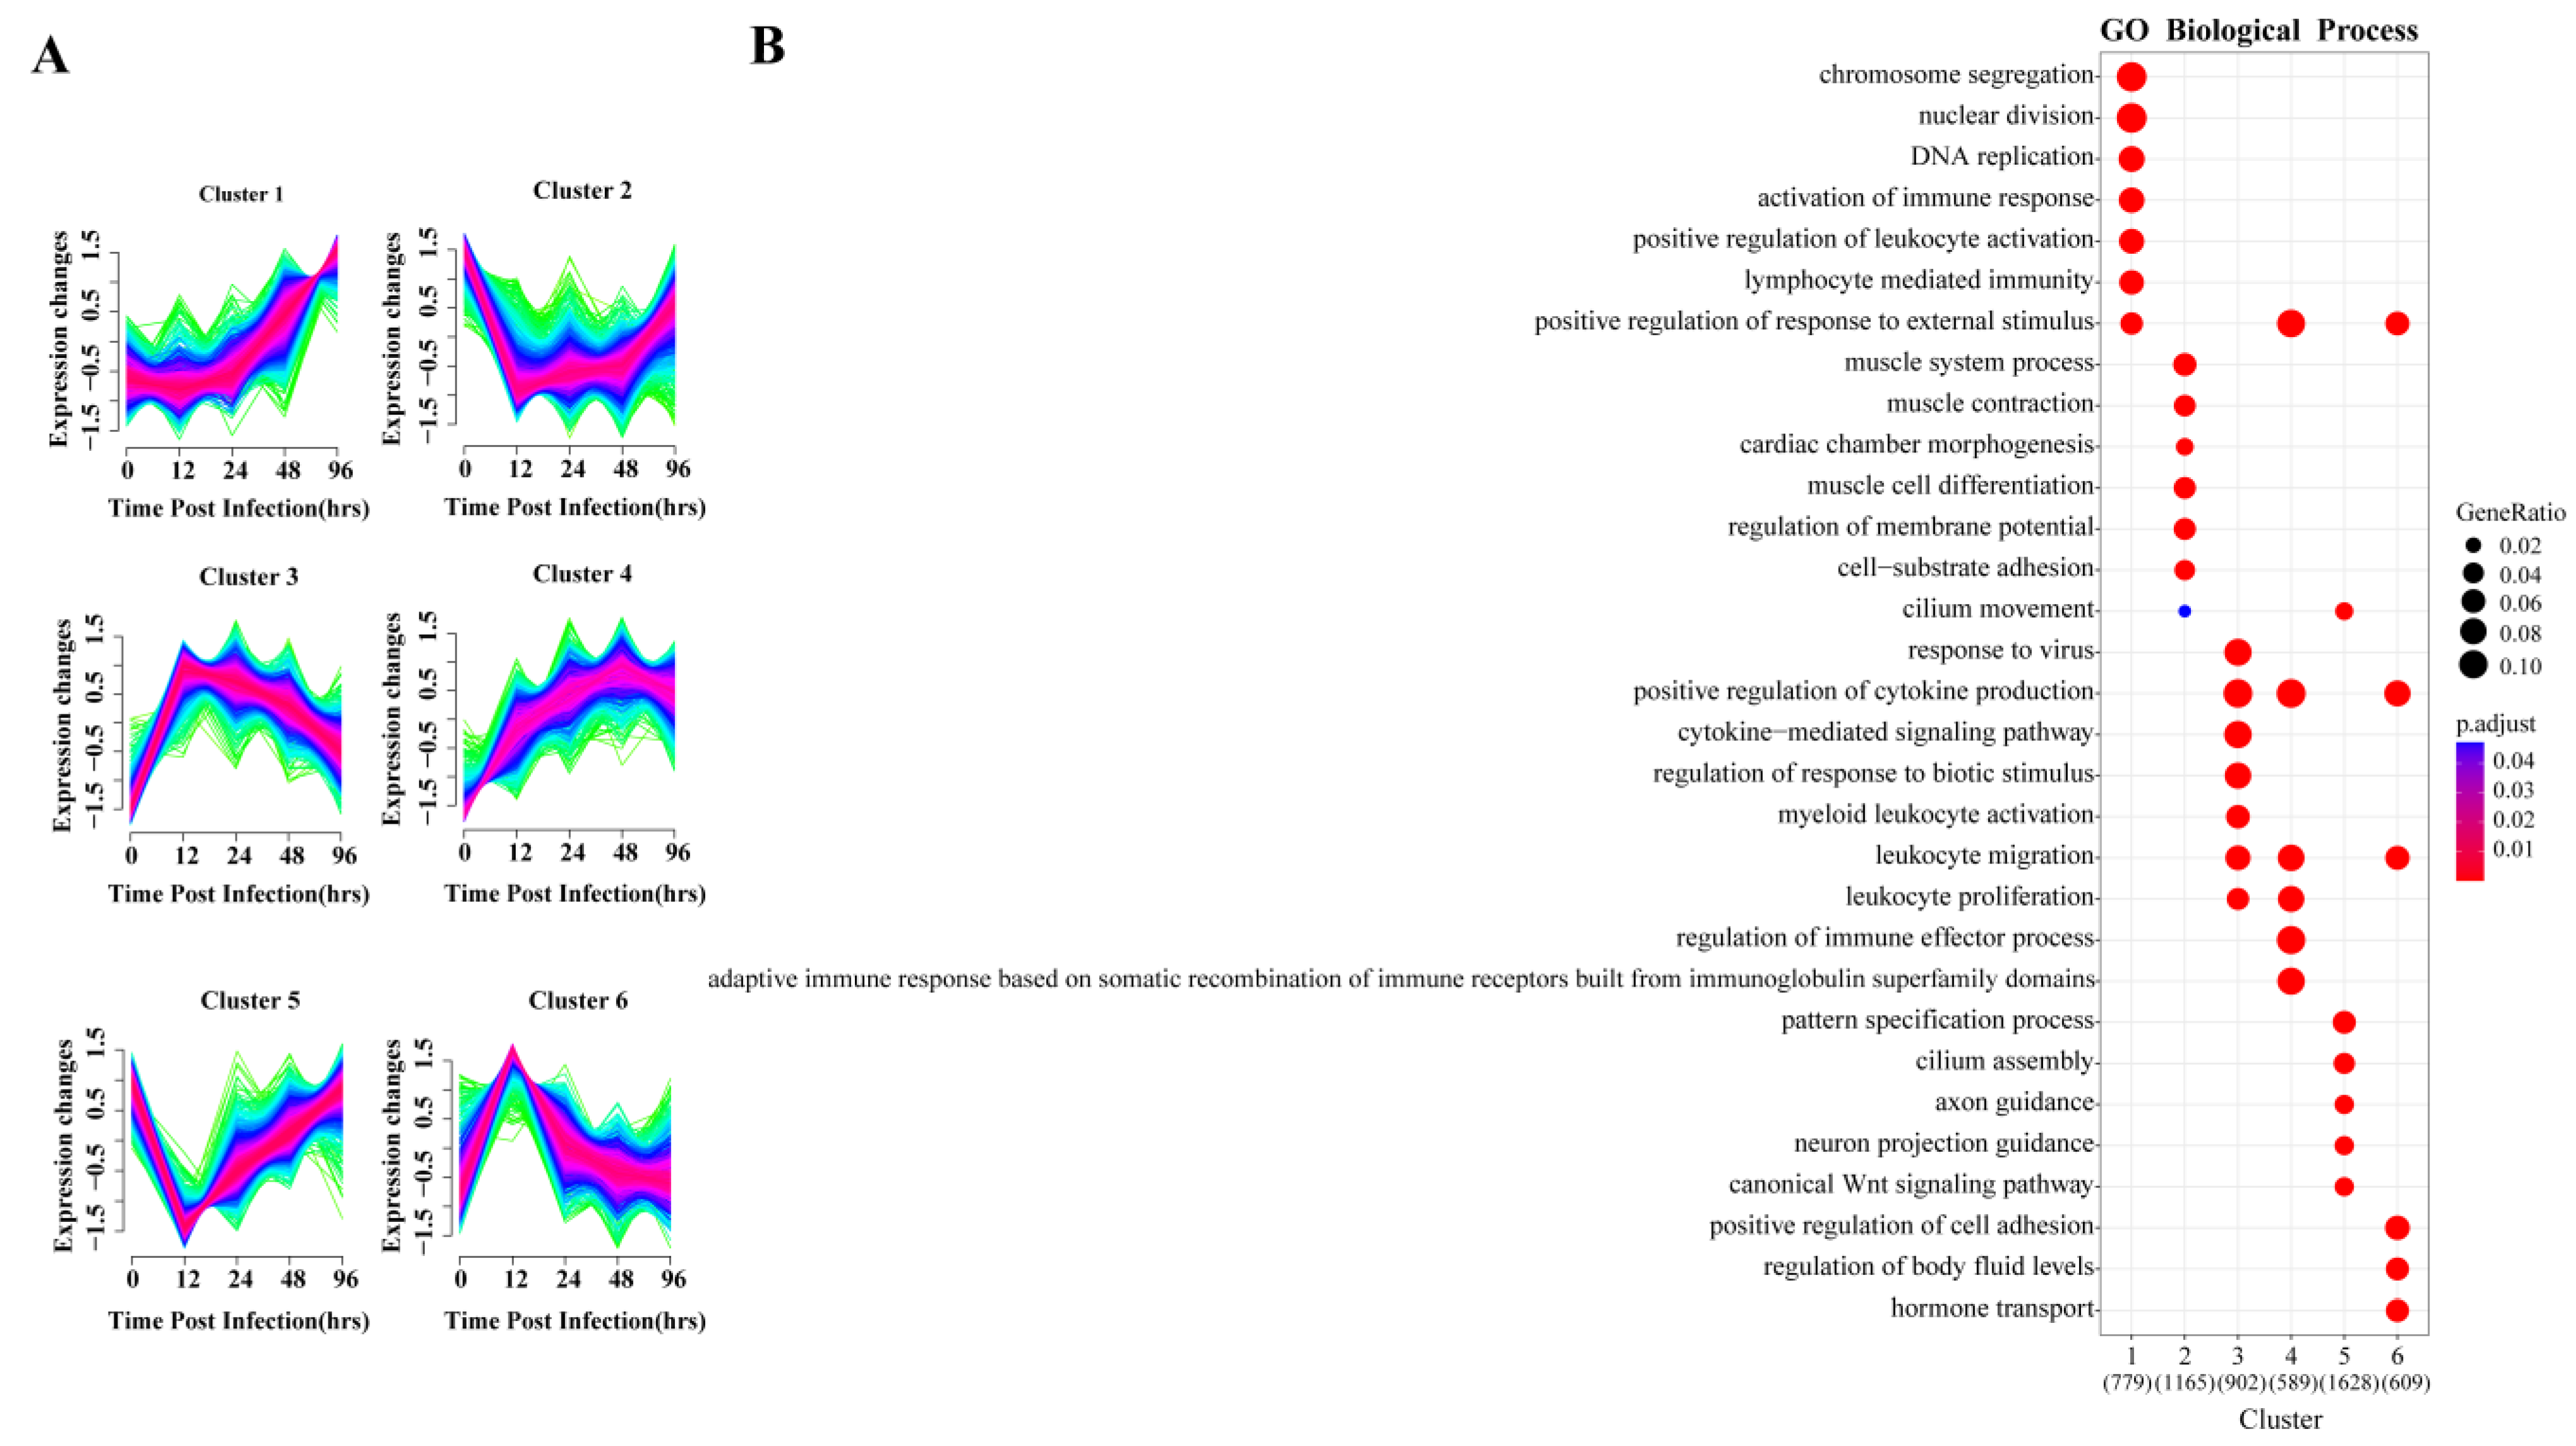
To explore the dynamic changes in gene expression levels over time, the DEGs were divided into six gene clusters according to different expression patterns using Mfuzz, and the functional processes associated with each gene cluster were evaluated in a GO enrichment analysis (Figure 3). The identified processes were consistent with the molecular pathophysiology of disease progression.
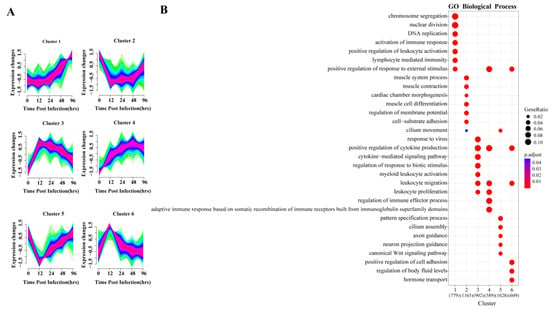
Figure 3.
Cluster analysis of expression patterns of DEGS and related biological functions. (A) Mfuzz cluster analysis identified six different gene expression time patterns. The color varying gradually from green to red represents that the trends of genes become more suitable to the changes of the cluster. (B) Heat map showing the significance of the gene ontology (GO) terms in the biological processes describing each of the six clusters. The number of enriched genes belonging to each cluster is shown in parentheses.
The gene expression of clusters 2 and 5 decreased directly after infection and reached their lowest point by 12 hpi, and then slowly increased again. GO analysis indicated that the 1165 genes in cluster 2 were mainly involved in muscle metabolism, such as muscular system processes, muscle contraction and muscle cell differentiation. The 1628 genes of cluster 5 were enriched for normal physiological processes, including cilium assembly, WNT signaling pathway and pattern specification process. Studies have shown that the Wnt/β-catenin pathway plays an important role in alveolar development [30], indicating that the lung is damaged and normal development is inhibited at 12 hpi.
Gene expression levels in clusters 3, 4 and 6 began to increase immediately after infection. GO analysis revealed that 902 and 589 genes in clusters 3 and 4, respectively, were enriched in biological processes related to the regulation of immune response, including leukocyte activation and migration, positive regulation of cytokine production, cytokine-mediated signaling and cytokine secretion, respectively. In cluster 6, 609 genes were enriched for biological processes, including regulation of cell adhesion and body fluid levels, and hormone transport.
The gene expression of cluster 1 held steady initially, beginning to increase continuously after 24 hpi. GO enrichment indicated its 779 genes were mainly involved in two biological processes related to tissue repair and immune response. In the enrichment results, chromosome separation, nuclear division and DNA replication were all related to cell proliferation, which was closely related to tissue repair. Importantly, lymphocyte-mediated immunity was only enriched in this cluster, and lymphocytes are mostly associated with adaptive immune response.
Each gene cluster above had unique expression patterns and functions, but at the same time, gene clusters with similar early expression patterns had common enrichment pathways. The four upregulated gene clusters were mainly involved in the biological processes of immune and inflammatory responses, and two of them peaked at 12 hpi. The two downregulated gene clusters were related to biological processes of normal cell activities, and both decreased to lowest value at 12 hpi. In summary, 12 hpi is an important node of host transcriptional changes.
3.4. Network Analysis Identifies Functional Modules
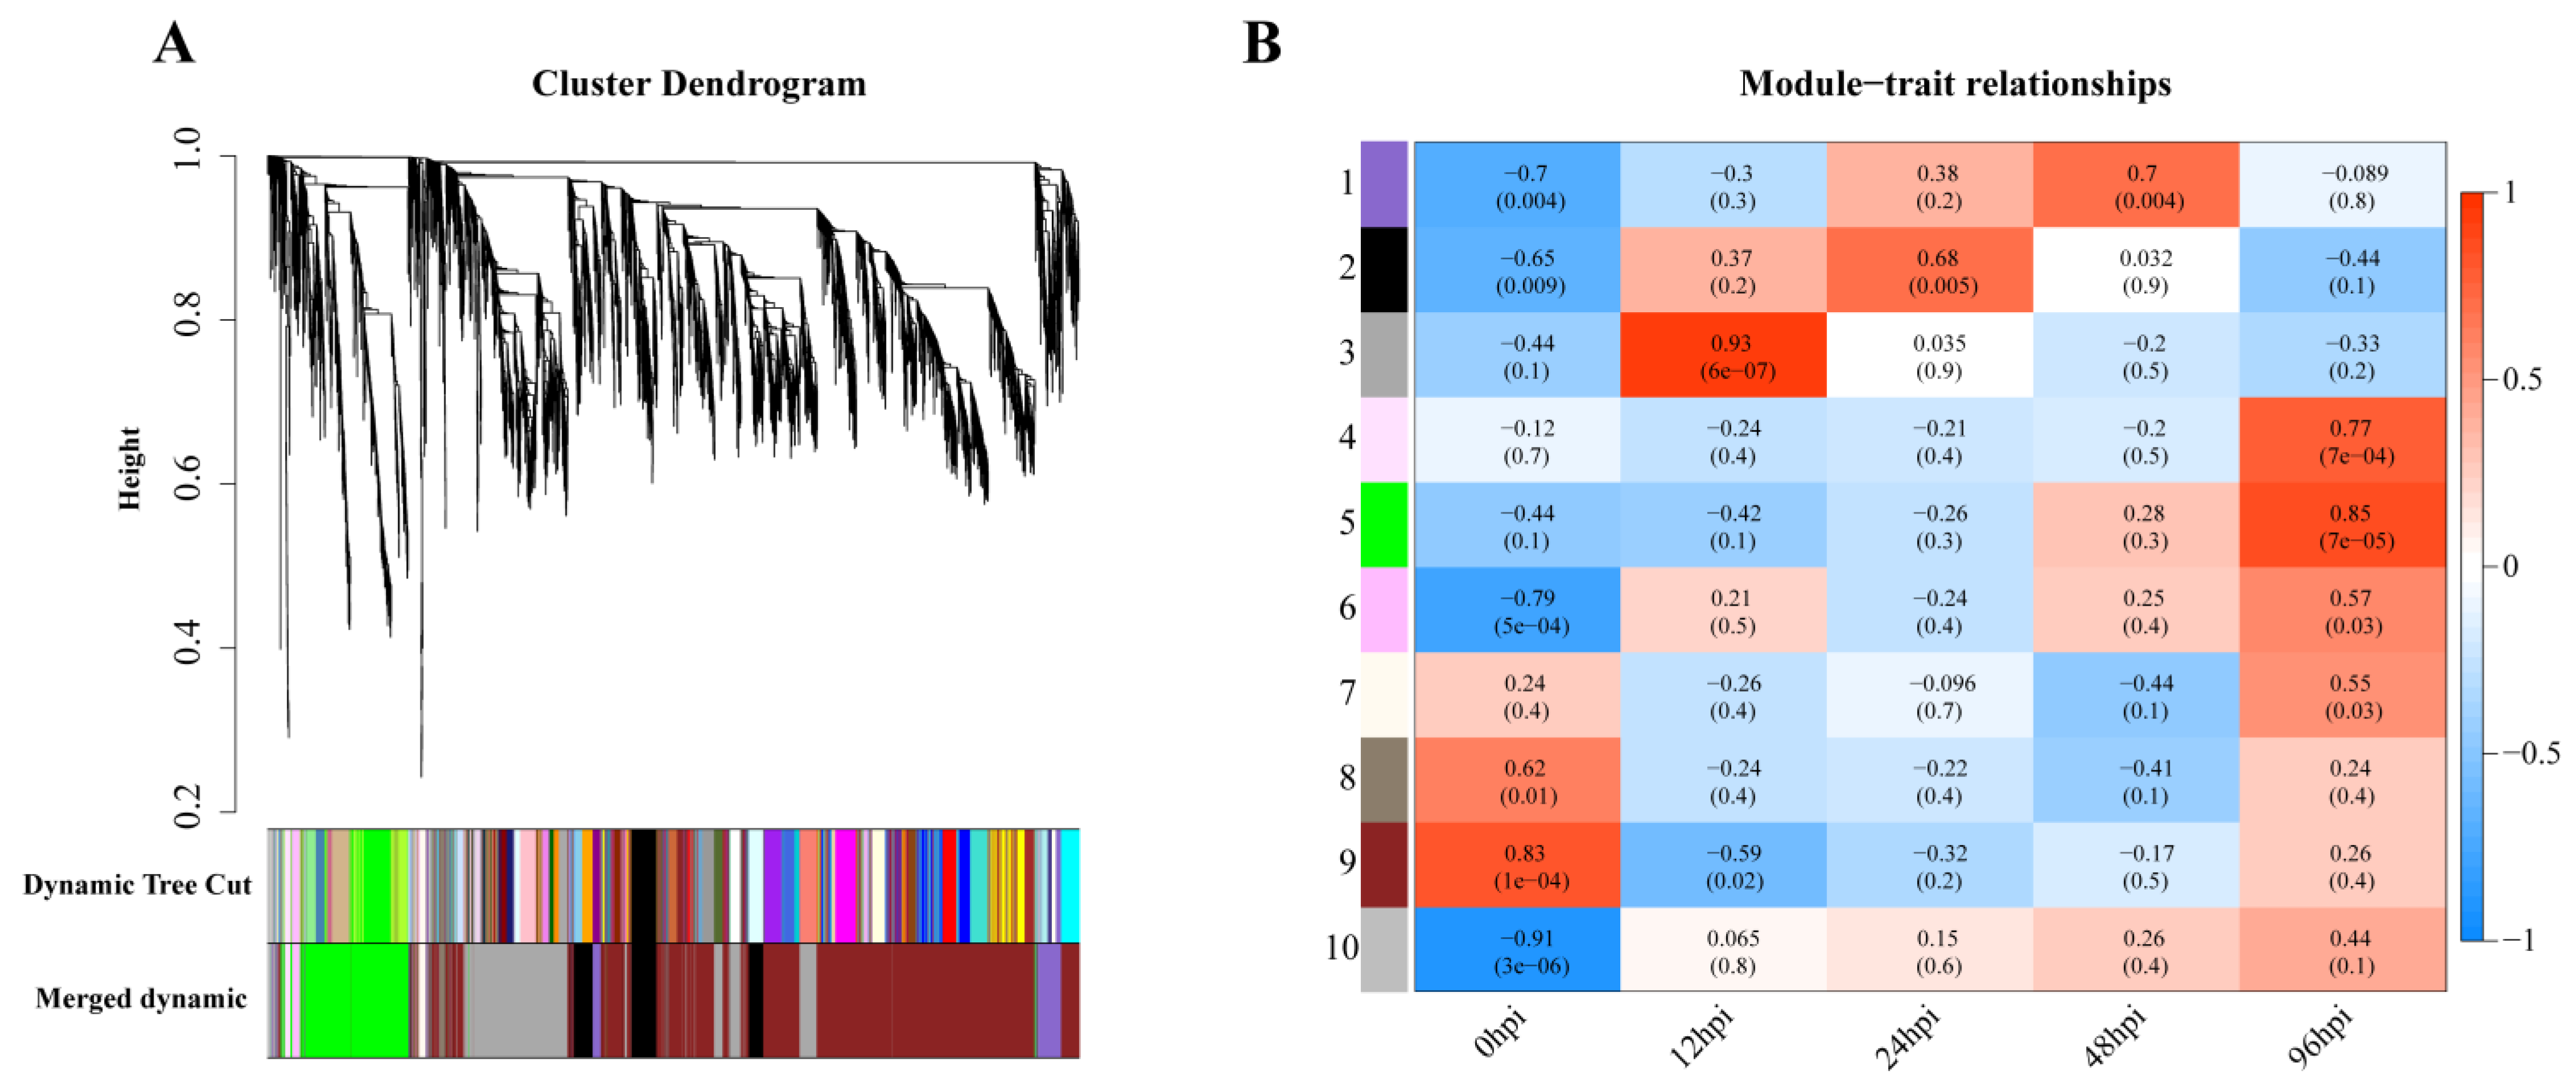
Weighted gene coexpression analysis was carried out for the observed DEGs, and the dynamic tree-cutting algorithm in the WGCNA R package was used to process the hierarchical clustering tree. A total of 10 different modules were obtained. Different colors represent different modules (Figure 4A). Next, we calculated the correlation between the infection process (hpi) and modules, assigning modules random numbers from 1 to 10 (Figure 4B). Module 10 is the default module and includes discarded genes that cannot be aggregated. To evaluate the main function of each module’s genes, enrichment analysis was performed for modules with correlation coefficients greater than 0.5.
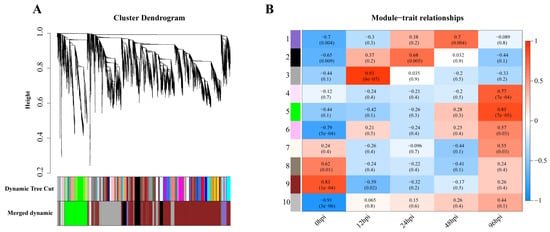
Figure 4.
Gene modules in a weighted gene coexpression network analysis (WGCNA). (A) Hierarchical cluster trees (cluster trees) represent identified coexpressed gene modules at different stages of infection. Height (Y-axis) represents coexpression distance, and the X-axis corresponds to genes. In WGCNA convention, genes within different modules are labeled with different colors. (B). Heat map showing the relationship between modules and traits. Red indicates a positive correlation (0 < r < 1) between modules and infection stages, while blue indicates a negative correlation (−1 < r < 0).
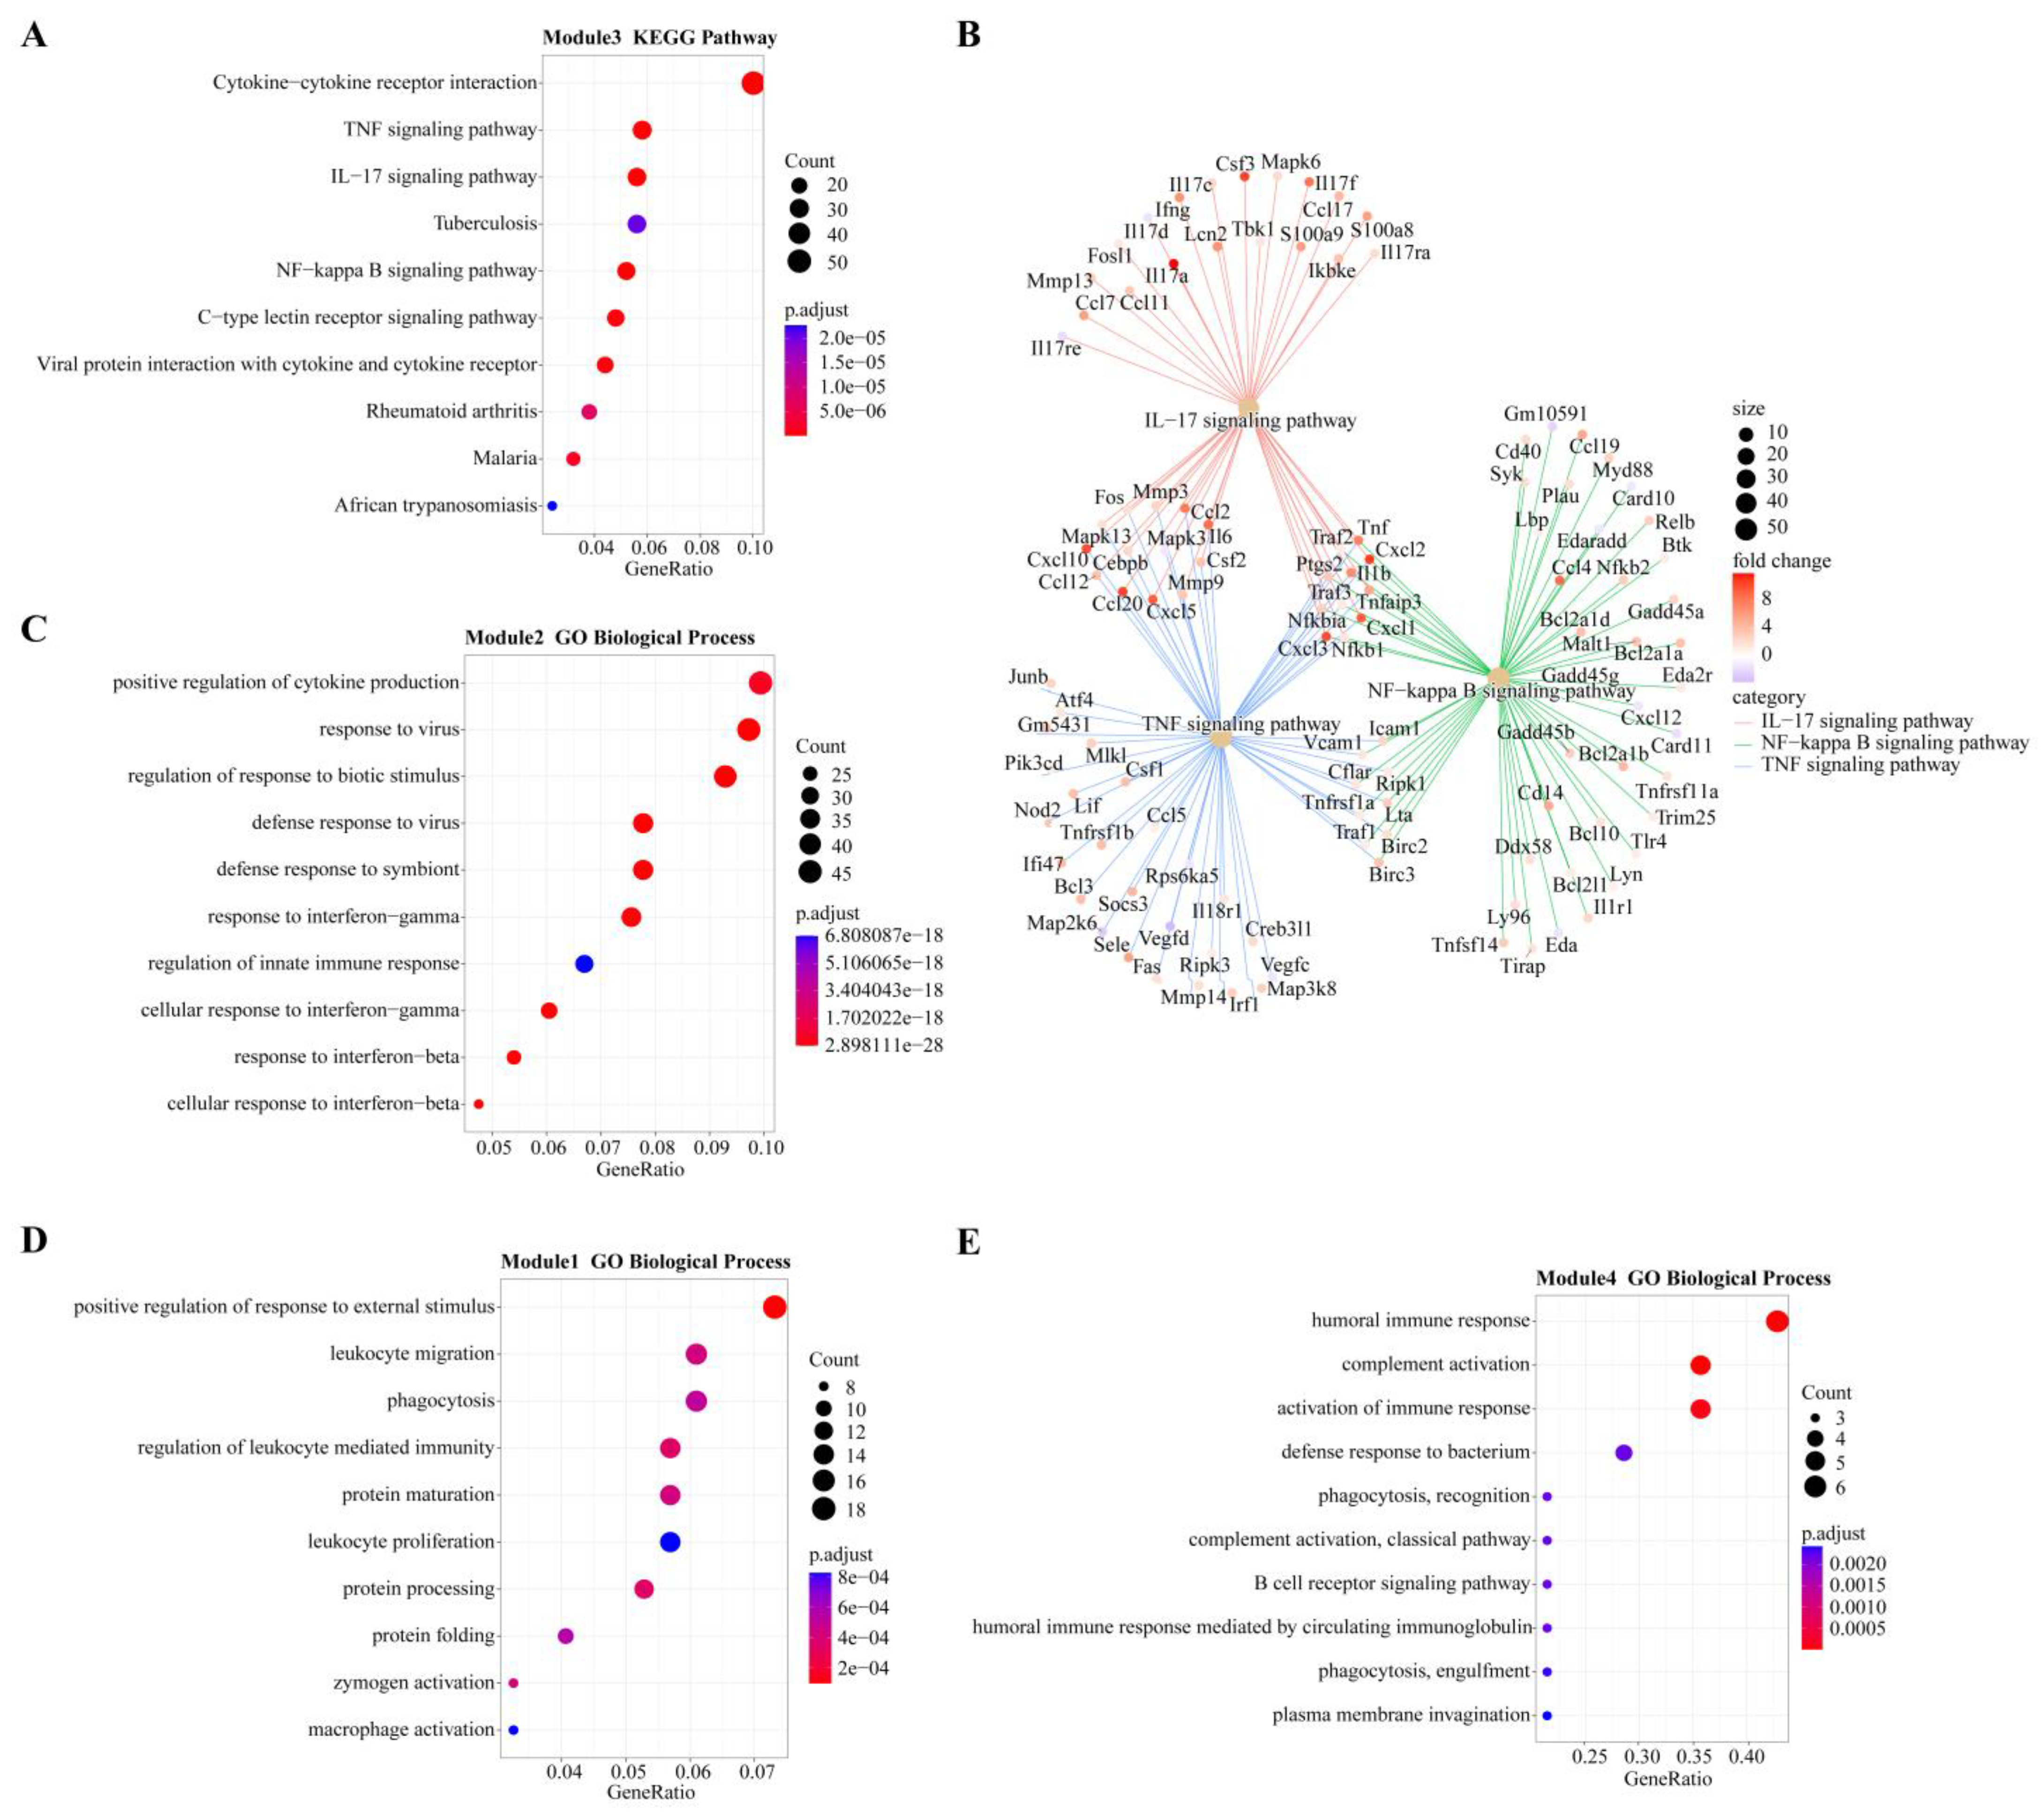
In module-trait analysis, module 3 was highly positively correlated with 12 hpi. GO analysis revealed that the module was mainly enriched in host immune-related biological processes, including cytokine production and mediated signaling pathways, and leukocyte migration and activation (Figure S2). KEGG analysis revealed that this module was mainly involved in immune-related and proinflammatory signaling pathways, such as the TNF, IL-17 and NF-κB signaling pathways and the C-type lectin receptor signaling pathway (Figure 5A). We also found that while the number of genes associated with the IL-17 pathway was fewer than that of the TNF and NF-κB pathways, the average upregulation multiple for the IL-17 pathway (4.9 times) was higher than that for the TNF and NF-κB pathways (3.4 and 2.6 times, respectively; Figure 5B).
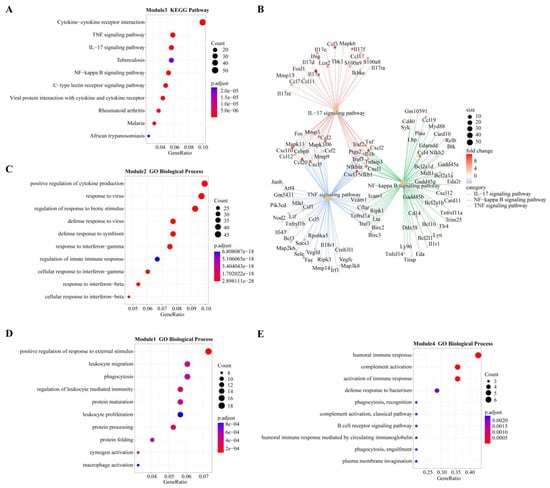
Figure 5.
Overview of GO terms (biological process) or KEGG pathways within modules highly positively correlated with different infection stages. (A) KEGG pathways of module 3 (highly correlated with 12 hpi). (B) Genes involved in three important pathways and their expression levels at 12 hpi. Different colors represent different pathways: red for IL-17, green for NF-κB, and blue for TNF. Fold change represents the change in gene expression level compared to 0 hpi (control group). (C) GO terms of module 2 (highly correlated with 24 hpi). (D) GO terms of module 1 (highly correlated with 48 hpi). (E). GO terms of Module 5 (highly correlated with 96 hpi).
Module 2 was positively correlated with 24 hpi, and GO analysis revealed it was enriched in biological processes related to the response of cytokines, including IFN-γ and IFN-β, as well as the regulation of innate immune responses to pathogens (Figure 5C). KEGG analysis revealed that the main enrichment pathways were associated with pattern recognition receptors (PRRs) (NOD-like receptors) and cytokine receptors (Figure S2).
Module 1 had the highest positive correlation with 48 hpi. According to GO analysis, this module is mainly involved in the biological process of leukocyte-related immunity and is related to the metabolic processing of protein, including protein synthesis, processing and maturation (Figure 5D). KEGG analysis also showed that pathways related to protein metabolism were enriched, including amino acid metabolism. Immune-related enrichment results included antigen processing and presentation, as well as complement and coagulation cascade pathways (Figure S2).
Modules 4, 5 and 6 were all strongly positively correlated with 96 hpi. GO analysis revealed that module 4 was enriched in biological processes related to B cells and the complement system, while module 6 was enriched in biological processes related to T cells (Figure 5E and Figure S2). Both B cell-mediated humoral immunity and T cell-mediated cellular immunity belong to adaptive immunity. The biological processes enriched in module 5 are mostly related to cell division, such as chromosome separation and DNA replication (Figure S2). KEGG analysis showed that module 5 genes were mainly involved in the pathway of the cell cycle and in T cell subset differentiation (Figure S2).
3.5. Cytoscape Extracts Core Genes
To further explore the key regulatory centers, we selected the gene networks with the top 200 connectivity values according to weight values from the modules (1, 2, 3, 5) with the highest positive correlation at each time point and analyzed their interactions using Cytoscape. Table 1 shows the top 20 central nodes (hub genes) in each module.

Table 1.
Top 20 hub nodes in the progression-related modules were identified by the gene modules in the weighted gene coexpression network analysis (WGCNA).
At 12 hpi, most of the genes in the top node of module 3 are closely related to the inflammatory process (Ambp, Mcolon2, Cyp27b1) and immune response (Ptx3, plscr1, Dbn1). At 24 and 48 hpi, most of the important node genes in modules 2 and 1 are related to the functional regulation of macrophages (Rab20, Smpdl3b, Mpeg1, Tmem106a, Ccr5, Ms4a6d), some of which can be stimulated by IFN (Rab20, Smpdl3b, Mpeg1, Tmem106a). This suggests that macrophages should be associated with IFN and play an indispensable role in the anti-infection process. At 96 hpi, the genes in module 5 mostly play a role in cell proliferation and cell cycle regulation (Birc5, Iqgap3, Mbly2, FoxM1, Parpbp).
3.6. Analysis of Immune Cells and PPI Network
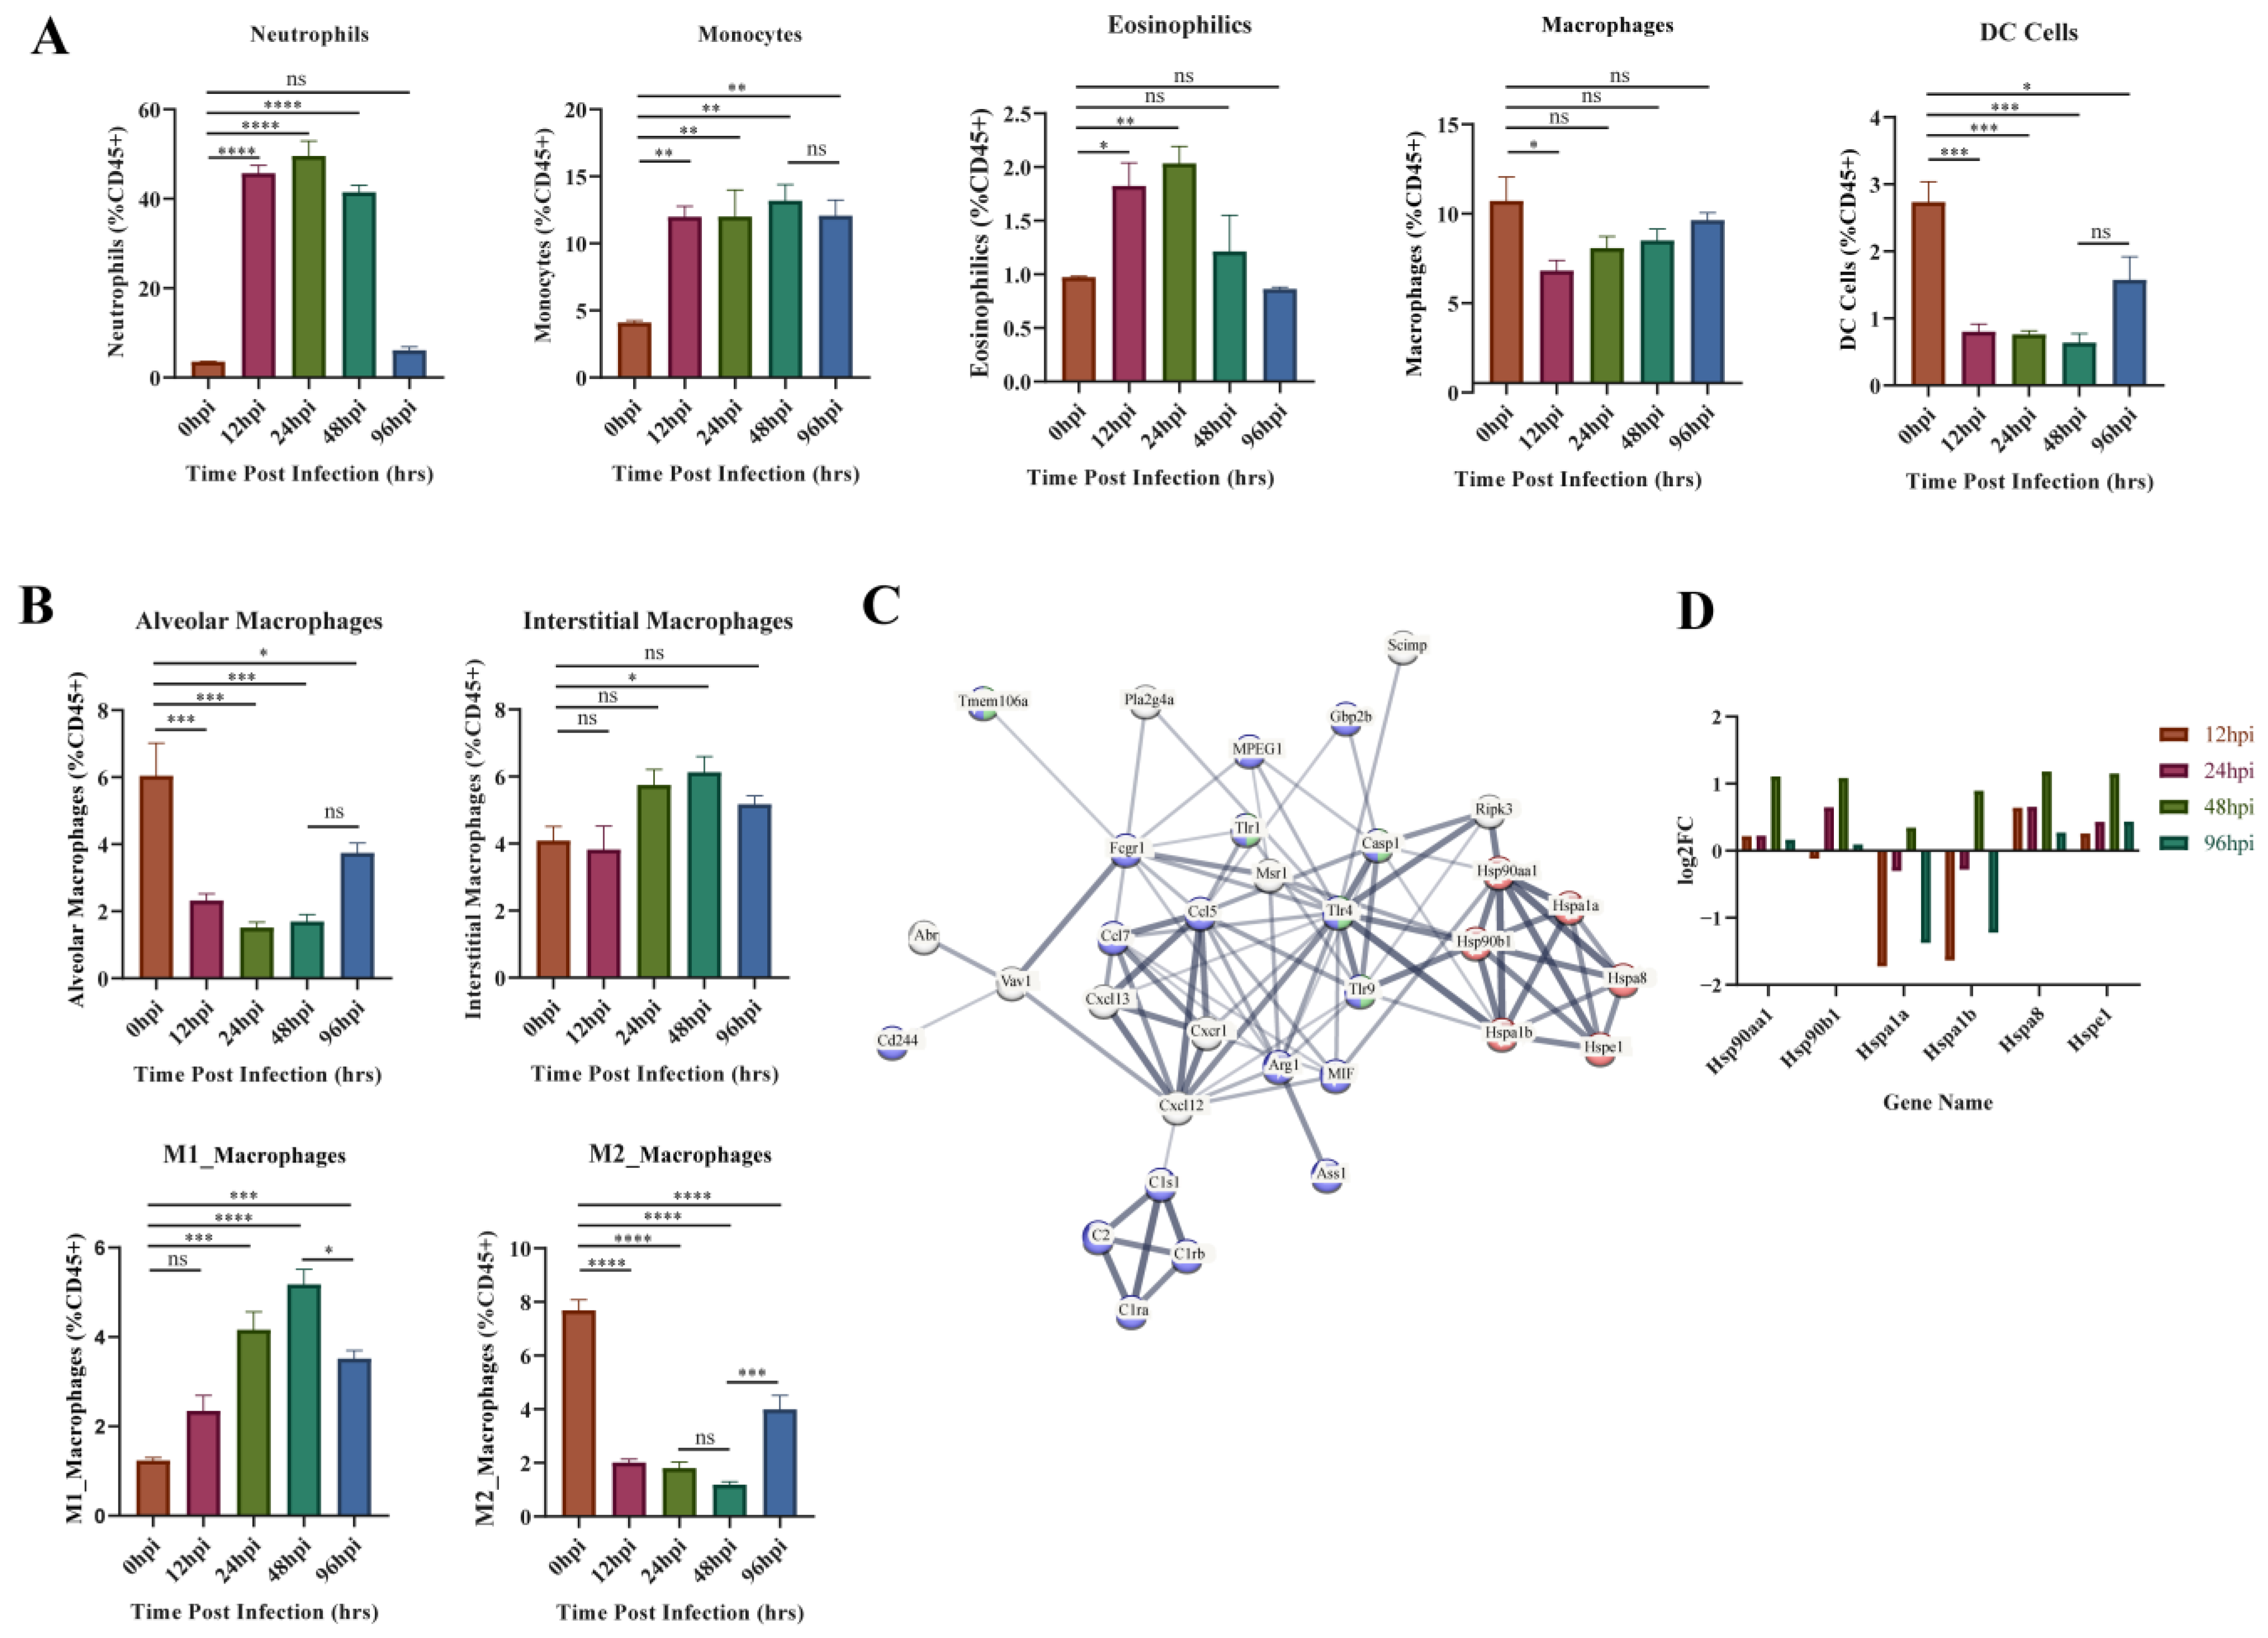
GO enrichment results of the upregulated gene clusters (1, 3, 4, 6) in Mfuzz identified the obvious biological processes related to cellular immunity (positive regulation of leukocyte activation, migration, and proliferation). Therefore, variation in the composition of the five types of innate immune cells throughout the infection process was investigated using flow cytometry (Figure 6A). The proportion of neutrophils, monocytes and eosinophils increased immediately after infection. Neutrophils and eosinophils peaked at 24 hpi, then fell back to the level of the control group at 96 hpi. Monocytes remained at a high level throughout the infection period. The proportion of macrophages and DC cells both decreased at 12 hpi, and DC level remained low at 12–48 hpi, while macrophages started to recover soon after 12 hpi.
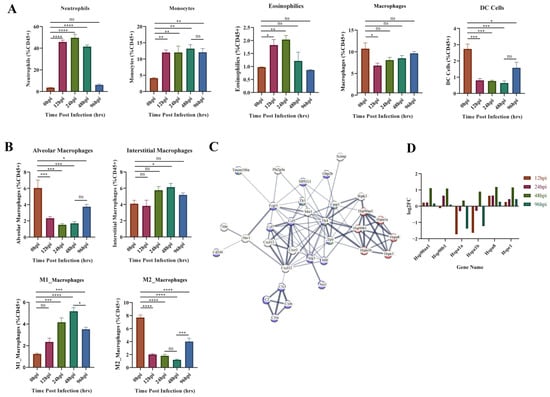
Figure 6.
Flow cytometry and module 1 PPI network results. (A) Flow cytometric analysis of five major innate immune cells. (B) Flow cytometric analysis of four subtypes of macrophages. (C). Protein–protein interaction (PPI) network analysis results for module 1 genes, most associated with 48 hpi. The important genes relating to protein synthesis, macrophage activation, and innate immunity are presented. Red represents genes related to protein synthesis, blue represents genes related to innate immunity, and green represents genes related to macrophage activation. (D). Expression of heat shock protein genes at different time points. The ordinate indicates the number of upregulated or downregulated genes. * p < 0.05, ** p < 0.01, *** p < 0.001, **** p < 0.0001.
Macrophage activation and protein synthesis pathways were identified from the GO enrichment results of module 1 (most associated with 48 hpi) in WGCNA analysis (Figure 5D). Therefore, we further evaluated the changes of macrophages in different subpopulations (Figure 6B). Alveolar macrophages (AM) decreased dramatically at 12–48 hpi and partially recovered at 96 hpi. Interstitial macrophages (IM) only showed a significant increase at 48 hpi. The proinflammatory M1 type rose continuously after infection until 48 hpi, after which it began to decline. In contrast, the anti-inflammatory M2-type decreases at 12–48 hpi and then begins to recover at 96 hpi. This suggests 48 hpi is a critical time point for changes in M1 versus M2 subtypes. Subsequently, all identified genes from module 1 were entered into the STRING database (https://string-db.org/, accessed on 18 November 2022) to obtain the functional protein association network. Heat shock protein (HSP)-related genes are central to the network and linked to macrophage function and innate immunity through TLRs (Figure 6C). We analyzed the expression of these HSP genes (Figure 6D) and found that HSP90aa1, HSP90b1, HSPa8 and HSPe1 kept upregulated at each hpi, and reached the peak at 48 hpi. In contrast, Hspa1a and Hspa1b were inhibited throughout infection but increased suddenly at 48 hpi. These phenomena indicate that the HSP family has different functions on macrophages, but that the key time point of its role is 48 hpi.
3.7. Quantitative RT-PCR Verification
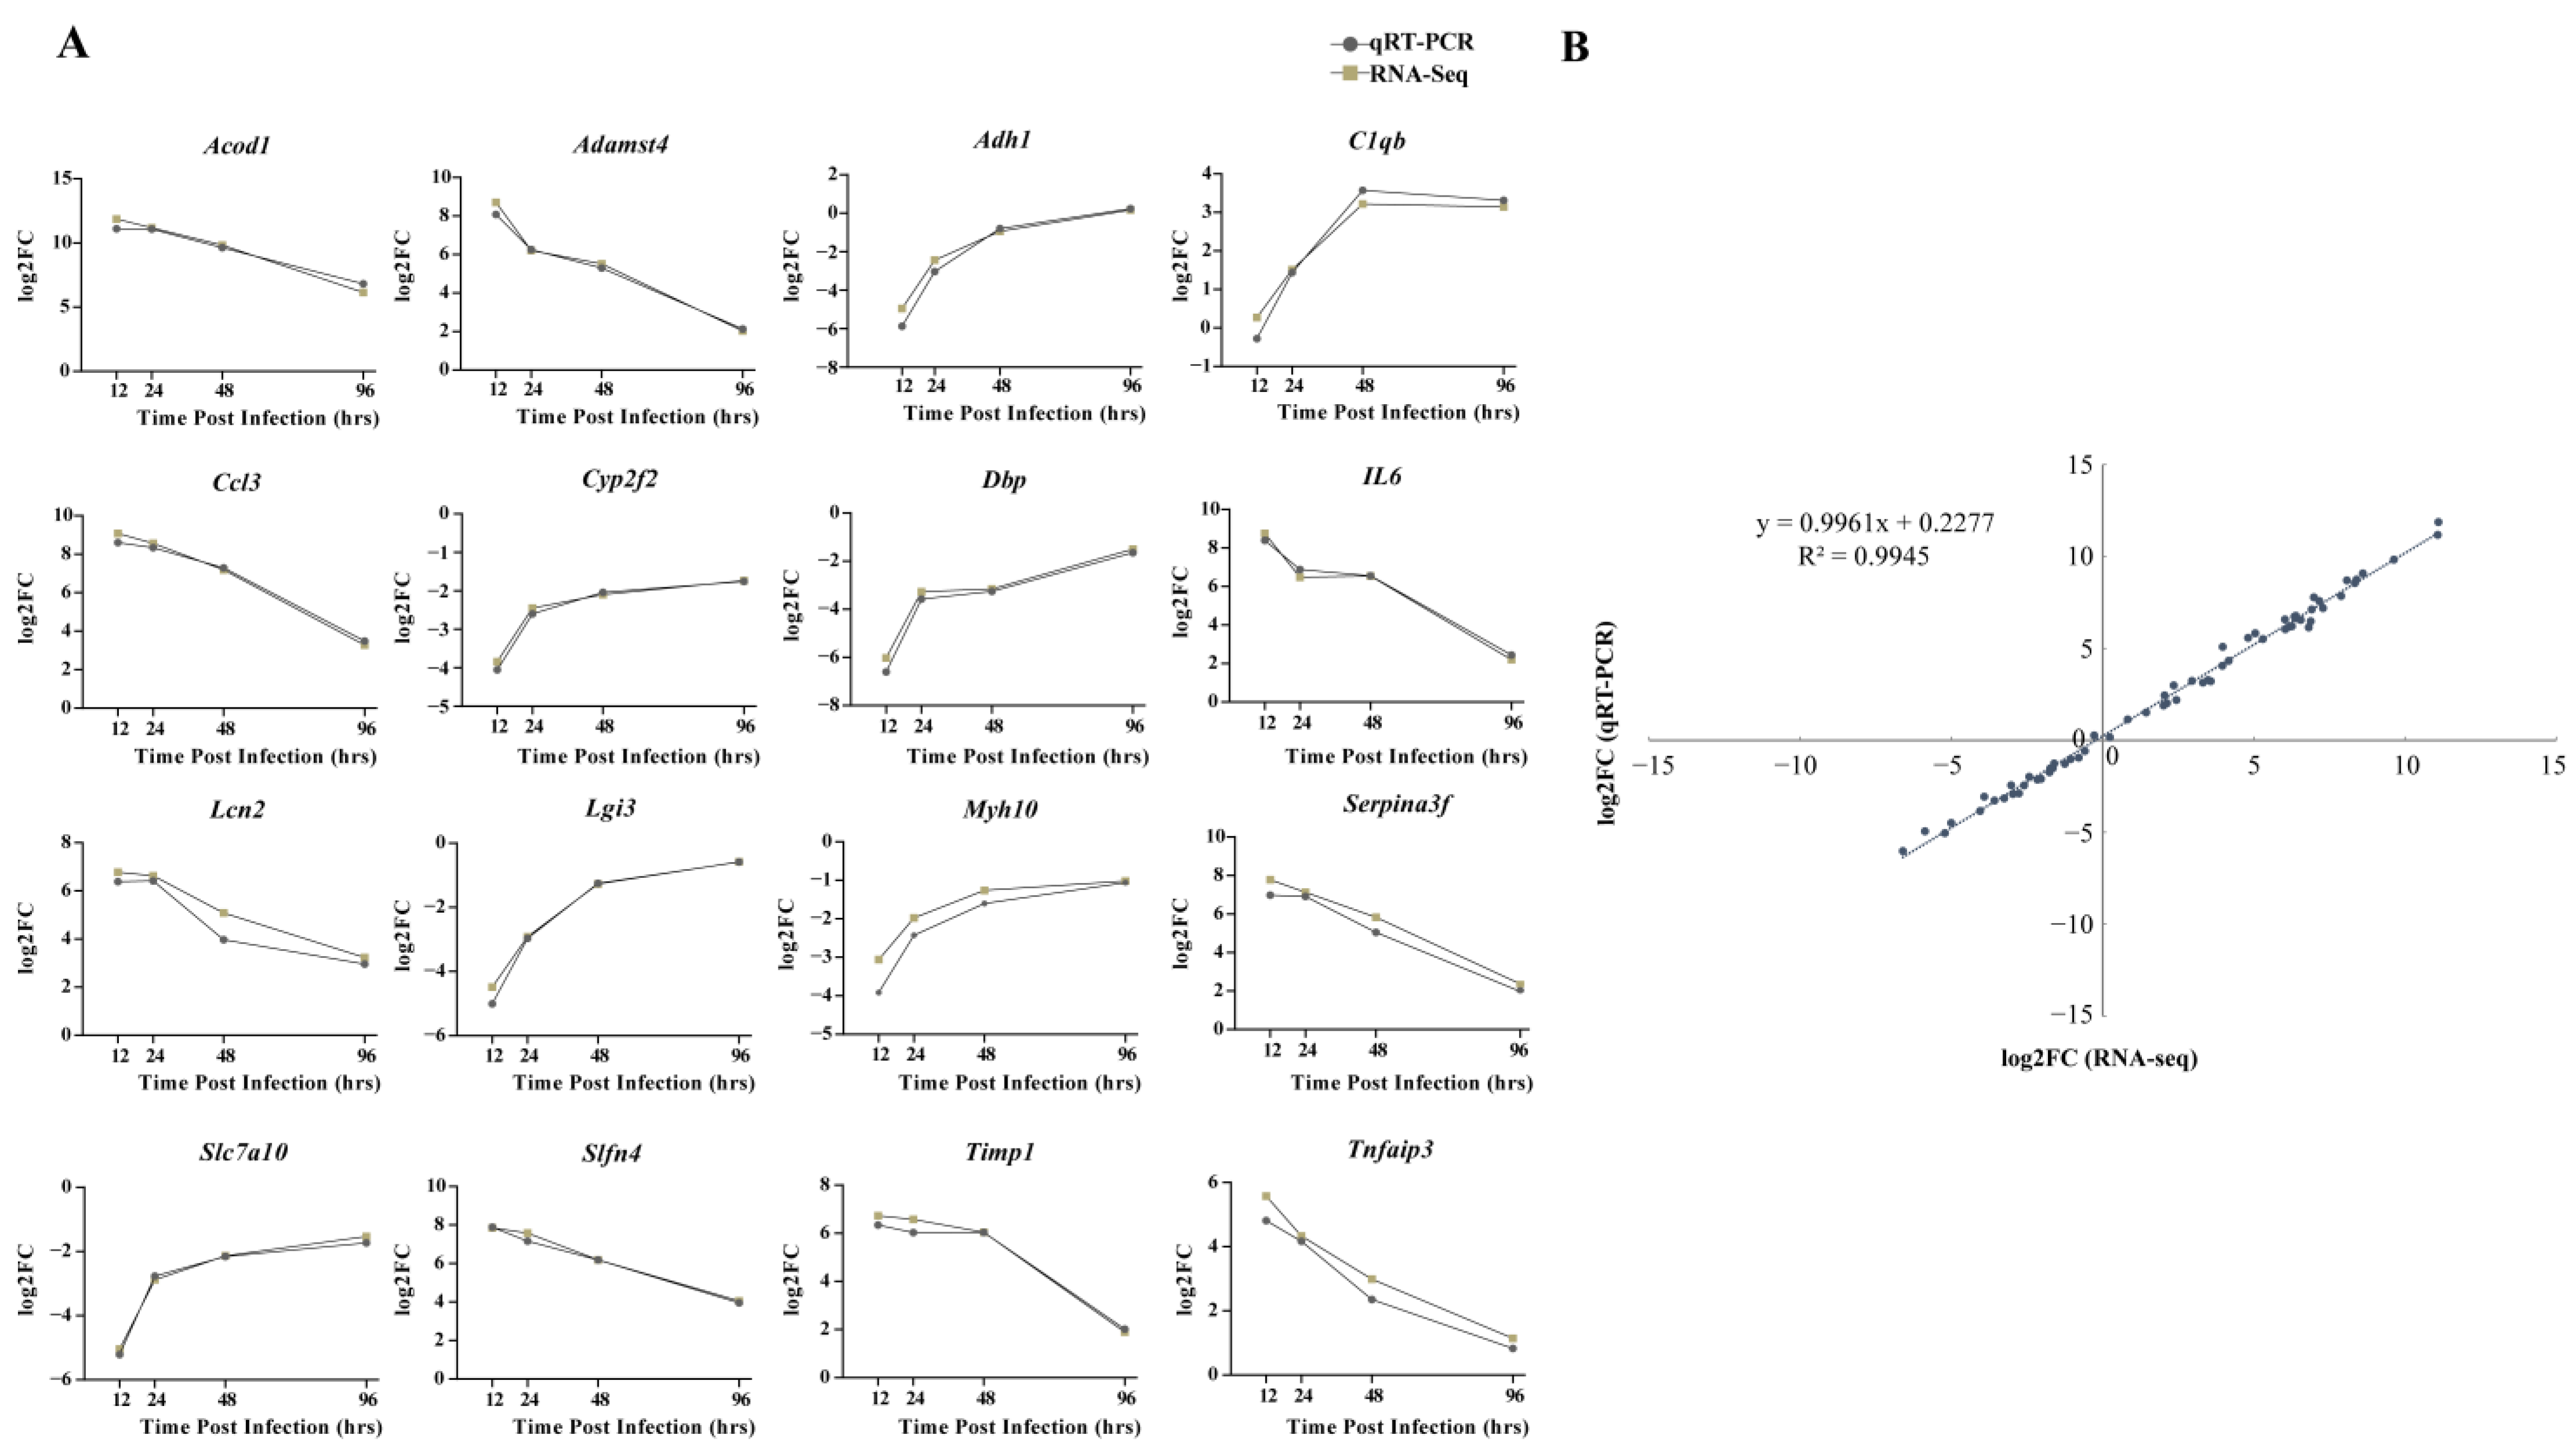
From the discovered DEGs, the following 16 genes were randomly selected for qRT-PCR detection: Acod1, Adamst4, Adh1, C1qb, Ccl3, Cyp2f2, Dbp, IL6, Lcn2, Lgi3, Myh10, Serpina3f, Slc7a10, Slfn4, Timp1, and Tnfaip3. The expression patterns of RNA-seq and qRT-PCR at four time points after infection were similar, with consistent upregulation or downregulation (Figure 7A). Moreover, a high correlation coefficient (R2) of 0.9945 confirmed the reliability of transcriptome sequencing data (Figure 7B).
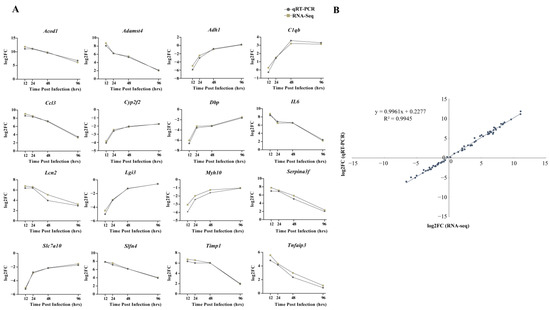
Figure 7.
Comparison of relative expression levels measured by RNA-seq and qRT-PCR. (A) Sixteen differentially expressed genes (DEGs) were selected for verification. The relative expression of each gene was calculated by the 2-ΔΔCt method (fold change). The Y-axis shows the fold changes compared to the starting point in different stages of infection, with positive values indicating upregulation and negative values indicating downregulation. (B) Correlation between fold changes obtained by qRT-PCR (X-axis) and RNA-seq platform (Y-axis). Each data point was obtained from three biological replicates. Graphpad 8.0 was used to process and plot the data.
4. Discussion
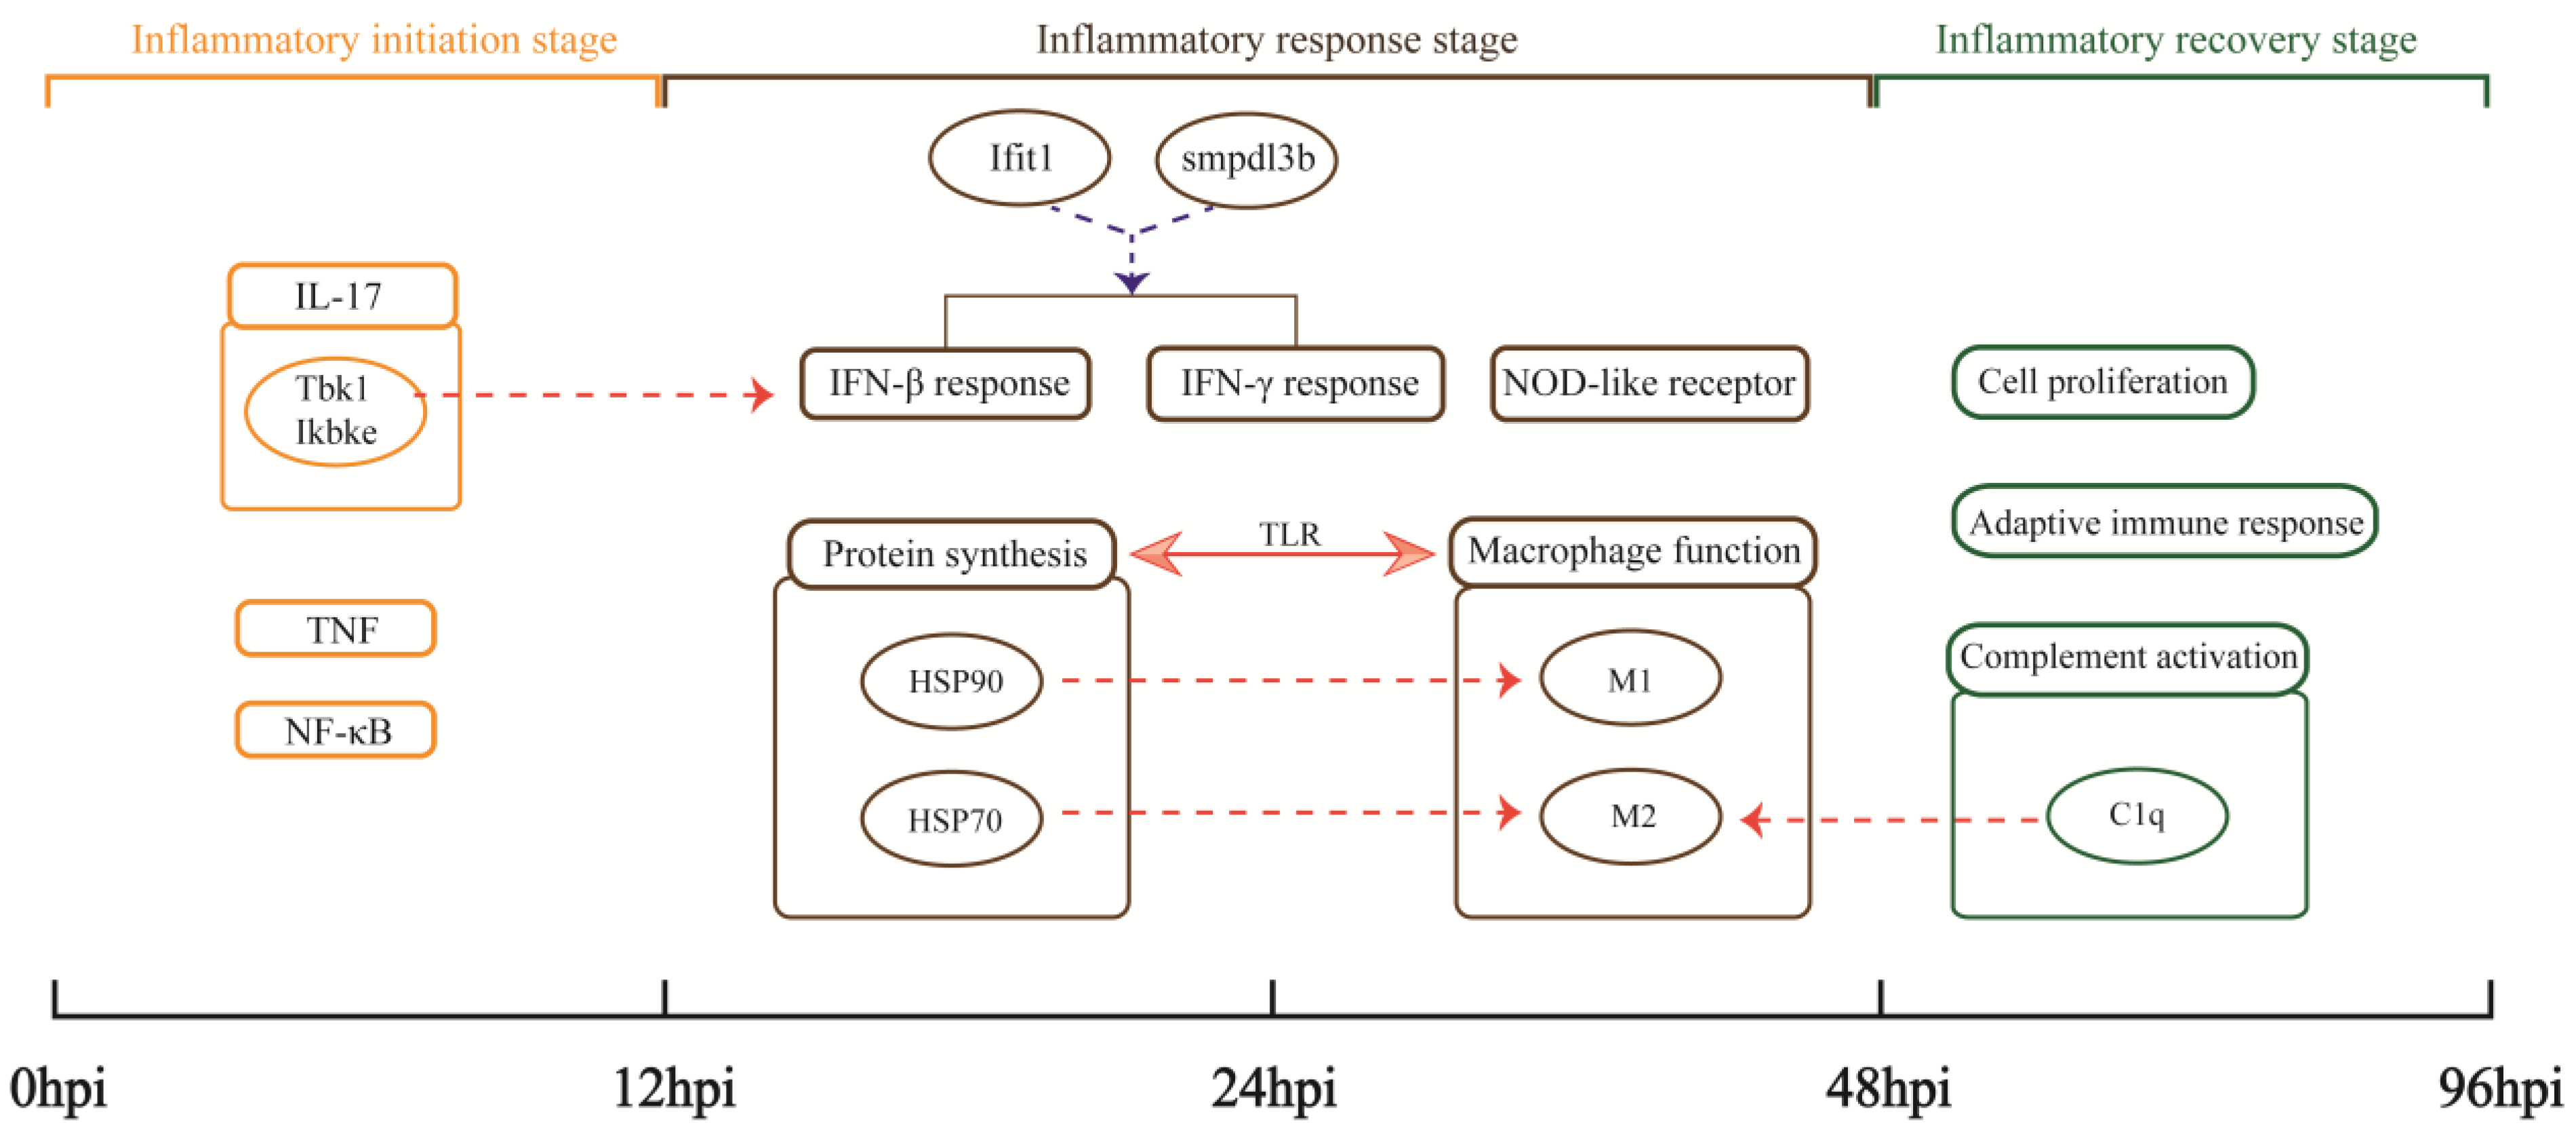
Pneumonia is a cause of death globally. In this study, the MRSA USA300 clone, which causes the hallmark clinical feature of human necrotizing pneumonia [31], was used to successfully construct a recovery model of severe aspiration pneumonia in mice. High-throughput RNA-seq data based on the MRSA pneumonia model to elucidate the host anti-infective process from the perspective of gene transcription were analyzed. The expression trend of DEGs and the pathological states of lungs indicate the physiological processes in mouse lungs after MRSA infection can be divided into three parts: 0–12 hpi is the inflammatory initiation stage, 12–48 hpi is the inflammatory response stage, and 48–96 hpi is the inflammatory recovery stage (Figure 8).
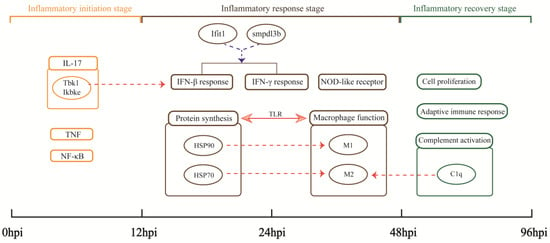
Figure 8.
Important findings. Rectangles represent important biological processes or pathways. Circles represent important genes or the proteins they encode. Arrows indicate the existence of some relationship: the solid line shows the relationship directly discovered by the analysis in this study; the dashed lines indicate hypothesized relationships suggested by our analysis, with red indicating upregulation and blue indicating downregulation.
4.1. Inflammatory Initiation Stage
The number of upregulated genes was the largest at 12 hpi. This dramatic increase in expression indicates a rapid initiation of the inflammatory transcriptional response, accompanied by recruitment of innate immune cells (neutrophils, monocytes, eosinophils).
According to Mfuzz analysis, the genes (clusters 3 and 6) upregulated to peak at 12 hpi are involved in important inflammatory pathways (Figure 3). These genes enriched the biological processes of positive regulation of cytokine production and leukocyte migration. Many cytokines and chemokines (IL-6, CCL2, CCL3, CCL4, CXCL2, CXCL5, CXCL10) are significantly upregulated at 12 hpi, which can promote the recruitment of neutrophils and monocytes. Correspondingly, neutrophils and monocytes also increased significantly at 12 hpi. In contrast, the proportion of macrophages, especially alveolar macrophages, decreased at 12 hpi. This is likely due to necrotizing apoptosis induced by the USA300 toxin [32]. Studies have shown that necrotizing depletion of macrophages induced by a variety of toxins in SA amplifies the inflammatory response and is a major mechanism leading to lung injury [20]. Therefore, the absence of macrophages at the early stage indicates exacerbation of inflammation. Hence, most of the 12 hpi core genes and highly upregulated genes are involved in proinflammatory responses. Gpr84 encodes receptor 84, the proinflammatory receptor G protein, and enhances the inflammation conducted by macrophages [33]. Mcoln2 can encode the endolysosomal cation channel TRPML2 and play a direct role in the transport and secretion of chemokines in mouse macrophages [34]. These genes promote the further development of inflammation. The host also upregulates genes encoding antimicrobial proteins for nutrient deprivation in the inflammatory environment. Lcn2 encodes lipocalin 2, a key antimicrobial protein that binds and sequesters bacterial siderophores [35]. Steap4 encodes six-transmembrane epithelial antigen of the prostate 4, which has increased responsiveness to inflammatory cytokines and may increase iron and copper entry into cells and decrease circulating iron [36]. These genes work together to promote immune and inflammatory responses in MRSA pneumonia, but have not been specifically studied in MRSA pneumonia.
KEGG analysis of module 3, highly associated with 12 hpi, showed that its genes were enriched in the important inflammatory pathways IL-17, TNF, and NF-κB (Figure 5A). These pathways play important roles in host defense and disease mechanisms [37,38,39]. Moreover, we found a leading proinflammatory and immune regulatory role of the IL-17 pathway. The IL-17 family interacts with its corresponding receptors to activate downstream pathways such as NF-κB and induce the secretion of proinflammatory mediators, including IL-6, TNF-α, and IL-1β [40,41]. The IL-17a gene was significantly upregulated, which not only turns on inflammation, but also acts synergistically with calprotectin (encoded by S100A8 and S100A9) and lipocalin 2 to protect the host during acute microbial invasion [41]. The deletion of IL-17a results in significant neutrophilic inflammation and increased mortality in mice with USA300 pneumonia [42]. In addition, the Tbk1 and Ikbke genes in the IL-17 pathway respectively encode two closely related kinases: the TANK binding kinase 1 (TBK1) and the noncanonical IκB kinase (IKK-related kinase, IKKε) [43], and IFN-β can be induced by SA through the TBK1/IKKε pathway [44]. Coincidentally, IFN-β is an important result of the KEGG enrichment at 24 hpi. Therefore, we suggest that the upregulation of Tbk1 and Ikbke genes may be related to upstream initiation of host interferon mechanisms in MRSA pneumonia.
4.2. Inflammatory Response Stage
A strong immune inflammatory response period followed at 24 and 48 hpi. At this stage, the lesions were the most severe, while neutrophils and monocytes were continuously recruited. Moreover, IFN and macrophage mediated immune and inflammatory responses were mainly observed and potential balancing mechanisms further investigated.
SA can invade various types of nonprofessional and professional phagocytes and can survive engulfment by professional phagocytes such as macrophages [45,46]. IFN response is an important component of innate immunity to viruses and intracellular bacteria. The GO and KEGG analyses of module 2 genes, most related to 24 hpi, indicate that IFN (IFN-γ and IFN-β) response and the NOD-like receptor pathway were significantly enriched (Figure 5C). When bacteria are recognized by PRRs, including NOD-like receptors, IFN production is induced through the NF-κB pathway [47]. The secretion and mechanism of IFN in MRSA pneumonia is complex and not fully understood. IFN-γ can be secreted by NK cells and recruited neutrophils after SA lung infection, and it can promote the effective killing of MRSA by macrophages and monocytes [48,49]. However, IFN-γ also drives fatal lung inflammation during MRSA pneumonia by promoting the overproduction of inflammatory cytokines, such as TNF-α [50]. IFN-β can directly kill SA [51], but the inflammatory cascade caused by IFN-β production can also aggravate the lung damage caused by USA300 pneumonia, and the high induction of IFN-β makes it more difficult for the host to clear the bacteria in the lung [47]. Therefore, we suggest that a balanced regulation of IFN response is essential for successful defense against MRSA pneumonia. The Ifit1 gene (significantly upregulated at 24 hpi; Figure 2D) negatively regulates the expression of TNF and many other inflammatory cytokines in macrophages stimulated by lipopolysaccharide (LPS) [52]. Smpdl3b (a 24 hpi core gene; Table 1) is strongly upregulated by IFN-γ stimulation and encodes a lipid-modifying enzyme, Smpdl3b, that is expressed in macrophages and acts as a negative regulator of TLR signaling at the inflammatory signaling interface [53]. The role of ifit1 and smpdl3b in host immune mechanisms against MRSA pneumonia has not been investigated. We hypothesize that these genes regulate the balance between inflammation and IFN bactericidal action to promote optimal innate immunity.
Transcriptome analysis showed that macrophage activation is associated with pathways involved in protein synthesis and is highly correlated with HSP70 and HSP90 genes (Figure 5D and Figure 6C). These results are similar to those found in proteomic analysis of macrophages after LPS stimulation [54]. Macrophages are plastic immune cells necessary to maintain homeostasis and control inflammation [55]. M1-type (proinflammatory) macrophages began to rise immediately after infection and remain at a high level until 24–48 hpi (Figure 6B). Hsp90aa1 and Hsp90b1 genes are increased in the inflammatory environment (Figure 6D), and the encoded HSP90 can promote macrophage-mediated inflammation [56]. More recently, it has been shown that HSP90 binds to SA peptides to ward off the deadly infection of SA bacteremia, possibly in connection with a faster or stronger innate immune response to SA infections [57]. Taken together with our study results, we propose that HSP90 may promote the polarization of M1-type macrophages and play a positive role in defense against MRSA pneumonia. Interestingly, HSP70s genes showed two trends: HSPa8 expression increased at 12–48 hpi, while Hspa1a and Hspa1b expression decreased at 12–24 hpi and increased only at 48 hpi (Figure 6D). HSP70s have anti-inflammatory effects. In macrophages, high expression of both HSC70 (HSPa8 encoding) and HSP70 (Hspa1a and Hspa1b encoding) inhibits the expression of LPS-induced inflammatory factors by inactivating NF-κB [58,59]. Meanwhile, the proportion of M2-type macrophages (anti-inflammatory) decreased at 12–48 hpi and partially recovered after that (Figure 6B). Therefore, we speculate that the increased expression of HSP70 may be a mechanism to prevent the decrease of M2-type macrophages and inhibit excessive inflammation. Likewise, Tmem106a (core gene at 48 hpi) plays a negative regulatory role in macrophage-mediated inflammation, and deletion of this gene may lead to enhanced M1-type polarization of macrophages [60]. Together, these results indicate that although the proinflammatory response was still dominant in the inflammatory response stage, the anti-inflammatory response also began to be enhanced at this stage.
4.3. Inflammatory Recovery Stage
The fewest DEGs were present at 96 hpi, when most of the lesions in the lungs had recovered. Cluster 1 genes, enriched in the biological processes of cell division and adaptive immune response in the GO enrichment results, whose expression was still upregulated at 96 hpi (Figure 3). Cluster 3, 4 and 6 genes, significantly enriched in the biological processes of cytokine production and leukocyte migration, mostly returned to expression levels close to those at 0 hpi (Figure 3). This suggests that transcription of lung genes was no longer predisposed to recruit large numbers of cells, making the proportion of neutrophils and eosinophils similar to that at 0 hpi. Interestingly, the proportion of monocytes remained at a high level (Figure 6A). Monocytes can transform and supplement the consumption of macrophages to ensure the normal immune function of the body [61]. M1-type macrophages began to decline and return toward values observed at 0 hpi. M2-type macrophages increased at 96 hpi compared to 12–48 hpi (Figure 6B). Changes in cell composition validated reversal of host inflammatory tendencies.
There are many related gene modules of 96 hpi, which indicates the diversity of genes in the recovery state. The process of cell proliferation, complement activation and adaptive immune response can be found from the GO and KEGG analysis results (Figure 5E and Figure S2), respectively. The complement system is an essential component of immunity. C1qb, C1qc and C1qa, which correlate with complement factor C1q, were observed in significantly upregulated genes of 96 hpi (Figure 2D). C1q is important for initiating the classical complement pathway. Its importance in the defense against Streptococcus pneumoniae infection has been well established [62,63,64]. Moreover, C1q is mainly produced by macrophages and can induce the M2 polarization of macrophages [65]. Therefore, it may be another cause of subtype differentiation of macrophages in MRSA pneumonia. In addition, it is now widely believed that the complement system controls T cell and B cell responses, cross-linking innate and adaptive immunity [66,67]. However, the mechanism of the complement system including C1q in resisting MRSA pneumonia has not been clarified, which is worth further exploration.
5. Conclusions
In this study, the resolution of pulmonary MRSA infection and the restoration of homeostasis involved finely regulated behavior between proinflammatory and anti-inflammatory responses. Given the correlation between cell transformation and key proteins in immune mechanisms illustrated in this study, further exploration using single-cell transcriptomics and proteomic techniques is warranted. This study provides new insights into the immune mechanisms underlying MRSA pneumonia, indicating new directions for research to find a nonantibiotic treatment.
Supplementary Materials
The following supporting information can be downloaded at https://www.mdpi.com/article/10.3390/biom13020347/s1. Figure S1: The specific cell classification scheme is shown in the sample flow cytometry results of 0 hpi; Figure S2: Overview of GO terms (biological process) or KEGG pathways within modules 1–6; Table S1: Primer sequences used for qRT-PCR in this study.
Author Contributions
Thanks to all authors for their contributions to this article. D.Z., M.L. and W.Y. conceived and designed the study. L.H., L.Z. (Lina Zhai), Z.Z. and L.Z. (Lili Zhang) performed animal experiments. Y.Z., T.Q., J.W. and C.S. performed other experiments. Y.Z. contributed to data analysis and interpretation. Y.Z. and L.Z. (Lina Zhai) wrote the first draft of the manuscript. D.Z., W.Y. and M.L. revised the manuscript. All authors have read and agreed to the published version of the manuscript.
Funding
This research received no external funding.
Institutional Review Board Statement
All animal experiments were conducted at the Experimental Animal Center of the Academy of Military Medical Sciences and approved and supervised by the Animal Care and Use Committee (IACUC) of AMMS (approval IACUC-IME-2022-031).
Informed Consent Statement
Not applicable.
Data Availability Statement
Raw reads were deposited in the Gene Expression Omnibus (GEO) repository (accession number GSE220943). The original contributions presented in the study are publicly available. These data can be found at https://www.ncbi.nlm.nih.gov/geo/query/acc.cgi?acc=GSE220943, accessed on 15 April 2023.
Acknowledgments
The authors thank Xiancai Rao for providing the strain in this study.
Conflicts of Interest
The authors declare no conflict of interest.
References
- David, M.Z.; Daum, R.S. Community-Associated Methicillin-Resistant Staphylococcus Aureus: Epidemiology and Clinical Consequences of an Emerging Epidemic. Clin. Microbiol. Rev. 2010, 23, 616–687. [Google Scholar] [CrossRef] [PubMed]
- He, H.; Wunderink, R.G. Staphylococcus Aureus Pneumonia in the Community. Semin. Respir. Crit. Care Med. 2020, 41, 470–479. [Google Scholar] [CrossRef]
- DeLeo, F.R.; Otto, M. An Antidote for Staphylococcus Aureus Pneumonia? J. Exp. Med. 2008, 205, 271–274. [Google Scholar] [CrossRef] [PubMed]
- Athanassa, Z.; Siempos, I.I.; Falagas, M.E. Impact of Methicillin Resistance on Mortality in Staphylococcus Aureus Vap: A Systematic Review. Eur. Respir. J. 2008, 31, 625–632. [Google Scholar] [CrossRef] [PubMed]
- Kuehnert, M.J.; Hill, H.A.; Kupronis, B.A.; Tokars, J.I.; Solomon, S.L.; Jernigan, D.B. Methicillin-Resistant-Staphylococcus Aureus Hospitalizations, United States. Emerg. Infect. Dis. 2005, 11, 868–872. [Google Scholar] [CrossRef] [PubMed]
- Lee, A.S.; de Lencastre, H.; Garau, J.; Kluytmans, J.; Malhotra-Kumar, S.; Peschel, A.; Harbarth, S. Methicillin-Resistant Staphylococcus Aureus. Nat. Rev. Dis. Primers 2018, 4, 18033. [Google Scholar] [CrossRef]
- Gajdács, M. The Continuing Threat of Methicillin-Resistant. Antibiotics 2019, 8, 52. [Google Scholar] [CrossRef]
- Thurlow, L.R.; Joshi, G.S.; Richardson, A.R. Virulence Strategies of the Dominant Usa300 Lineage of Community-Associated Methicillin-Resistant Staphylococcus Aureus (Ca-Mrsa). FEMS Immunol. Med. Microbiol. 2012, 65, 5–22. [Google Scholar] [CrossRef]
- Chen, J.; Luo, Y.; Zhang, S.; Liang, Z.; Wang, Y.; Zhang, Y.; Zhou, G.; Jia, Y.; Chen, L.; She, D. Community-Acquired Necrotizing Pneumonia Caused by Methicillin-Resistant Staphylococcus Aureus Producing Panton-Valentine Leukocidin in a Chinese Teenager: Case Report and Literature Review. Int. J. Infect. Dis. IJID Off. Publ. Int. Soc. Infect. Dis. 2014, 26, 17–21. [Google Scholar] [CrossRef]
- Nimmo, G.R. Usa300 Abroad: Global Spread of a Virulent Strain of Community-Associated Methicillin-Resistant Staphylococcus Aureus. Clin. Microbiol. Infect. Off. Publ. Eur. Soc. Clin. Microbiol. Infect. Dis. 2012, 18, 725–734. [Google Scholar] [CrossRef] [PubMed]
- Masuta, K.; Oba, Y.; Iwata, K. Linezolid Versus Vancomycin for Methicillin-Resistant Staphylococcus Aureus Nosocomial Pneumonia: Controversy Continues. Clin. Infect. Dis. Off. Publ. Infect. Dis. Soc. Am. 2012, 55, 161. [Google Scholar] [CrossRef]
- Wunderink, R.G.; Niederman, M.S.; Kollef, M.H.; Shorr, A.F.; Kunkel, M.J.; Baruch, A.; McGee, W.T.; Reisman, A.; Chastre, J. Linezolid in Methicillin-Resistant Staphylococcus Aureus Nosocomial Pneumonia: A Randomized, Controlled Study. Clin. Infect. Dis. Off. Publ. Infect. Dis. Soc. Am. 2012, 54, 621–629. [Google Scholar] [CrossRef] [PubMed]
- Mandell, L.A.; Wunderink, R. Methicillin-Resistant Staphylococcus Aureus and Community-Acquired Pneumonia: An Evolving Relationship. Clin. Infect. Dis. Off. Publ. Infect. Dis. Soc. Am. 2012, 54, 1134–1136. [Google Scholar] [CrossRef] [PubMed]
- Anwar, S.; Prince, L.R.; Foster, S.J.; Whyte, M.K.B.; Sabroe, I. The Rise and Rise of Staphylococcus Aureus: Laughing in the Face of Granulocytes. Clin. Exp. Immunol. 2009, 157, 216–224. [Google Scholar] [CrossRef] [PubMed]
- Kobayashi, S.D.; Braughton, K.R.; Palazzolo-Ballance, A.M.; Kennedy, A.D.; Sampaio, E.; Kristosturyan, E.; Whitney, A.R.; Sturdevant, D.E.; Dorward, D.W.; Holland, S.M.; et al. Rapid Neutrophil Destruction Following Phagocytosis of Staphylococcus Aureus. J. Innate Immun. 2010, 2, 560–575. [Google Scholar] [CrossRef] [PubMed]
- Graves, S.F.; Kobayashi, S.D.; DeLeo, F.R. Community-Associated Methicillin-Resistant Staphylococcus Aureus Immune Evasion and Virulence. J. Mol. Med. 2010, 88, 109–114. [Google Scholar] [CrossRef]
- Yajjala, V.K.; Thomas, V.C.; Bauer, C.; Scherr, T.D.; Fischer, K.J.; Fey, P.D.; Bayles, K.W.; Kielian, T.; Sun, K. Resistance to Acute Macrophage Killing Promotes Airway Fitness of Prevalent Community-Acquired Staphylococcus Aureus Strains. J. Immunol. 2016, 196, 4196–4203. [Google Scholar] [CrossRef]
- Martin, F.J.; Parker, D.; Harfenist, B.S.; Soong, G.; Prince, A. Participation of Cd11c(+) Leukocytes in Methicillin-Resistant Staphylococcus Aureus Clearance from the Lung. Infect. Immun. 2011, 79, 1898–1904. [Google Scholar] [CrossRef]
- Oliveira, D.; Borges, A.; Simões, M. Toxins and Their Molecular Activity in Infectious Diseases. Toxins 2018, 10, 252. [Google Scholar] [CrossRef]
- Liu, Z.-Z.; Yang, Y.-J.; Zhou, C.-K.; Yan, S.-Q.; Ma, K.; Gao, Y.; Chen, W. Sting Contributes to Host Defense against Pneumonia through Suppressing Necroptosis. Front. Immunol. 2021, 12, 636861. [Google Scholar] [CrossRef]
- Feng, J.; Hu, X.; Fu, M.; Dai, L.; Yu, Y.; Luo, W.; Zhao, Z.; Lu, Z.; Du, Z.; Zhou, D.; et al. Enhanced Protection against Q Fever in Balb/C Mice Elicited by Immunization of Chloroform-Methanol Residue of Coxiella Burnetii Via Intratracheal Inoculation. Vaccine 2019, 37, 6076–6084. [Google Scholar] [CrossRef] [PubMed]
- Kim, D.; Langmead, B.; Salzberg, S.L. Hisat: A Fast Spliced Aligner with Low Memory Requirements. Nat. Methods 2015, 12, 357–360. [Google Scholar] [CrossRef] [PubMed]
- Mortazavi, A.; Williams, B.A.; McCue, K.; Schaeffer, L.; Wold, B. Mapping and Quantifying Mammalian Transcriptomes by Rna-Seq. Nat. Methods 2008, 5, 621–628. [Google Scholar] [CrossRef] [PubMed]
- Robinson, M.D.; McCarthy, D.J.; Smyth, G.K. Edger: A Bioconductor Package for Differential Expression Analysis of Digital Gene Expression Data. Bioinformatics 2010, 26, 139–140. [Google Scholar] [CrossRef]
- Wu, T.; Hu, E.; Xu, S.; Chen, M.; Guo, P.; Dai, Z.; Feng, T.; Zhou, L.; Tang, W.; Zhan, L.; et al. Clusterprofiler 4.0: A Universal Enrichment Tool for Interpreting Omics Data. Innovation 2021, 2, 100141. [Google Scholar] [CrossRef]
- Kumar, L.; Futschik, M. Mfuzz: A Software Package for Soft Clustering of Microarray Data. Bioinformation 2007, 2, 5–7. [Google Scholar] [CrossRef]
- Futschik, M.E. and Carlisle, B. Noise-Robust Soft Clustering of Gene Expression Time-Course Data. J. Bioinform. Comput. Biol. 2005, 3, 965–988. [Google Scholar] [CrossRef]
- Langfelder, P.; Horvath, S. Wgcna: An R Package for Weighted Correlation Network Analysis. BMC Bioinform. 2008, 9, 559. [Google Scholar] [CrossRef]
- Shannon, P.; Markiel, A.; Ozier, O.; Baliga, N.S.; Wang, J.T.; Ramage, D.; Amin, N.; Schwikowski, B.; Ideker, T. Cytoscape: A Software Environment for Integrated Models of Biomolecular Interaction Networks. Genome Res. 2003, 13, 2498–2504. [Google Scholar] [CrossRef]
- Beauchemin, K.J.; Wells, J.M.; Kho, A.T.; Philip, V.M.; Kamir, D.; Kohane, I.S.; Graber, J.H.; Bult, C.J. Temporal Dynamics of the Developing Lung Transcriptome in Three Common Inbred Strains of Laboratory Mice Reveals Multiple Stages of Postnatal Alveolar Development. PeerJ 2016, 4, e2318. [Google Scholar] [CrossRef]
- Diep, B.A.; Chan, L.; Tattevin, P.; Kajikawa, O.; Martin, T.R.; Basuino, L.; Mai, T.T.; Marbach, H.; Braughton, K.R.; Whitney, A.R.; et al. Polymorphonuclear Leukocytes Mediate Staphylococcus Aureus Panton-Valentine Leukocidin-Induced Lung Inflammation and Injury. Proc. Natl. Acad. Sci. USA 2010, 107, 5587–5592. [Google Scholar] [CrossRef] [PubMed]
- Kitur, K.; Parker, D.; Nieto, P.; Ahn, D.S.; Cohen, T.S.; Chung, S.; Wachtel, S.; Bueno, S.; Prince, A. Toxin-Induced Necroptosis Is a Major Mechanism of Staphylococcus Aureus Lung Damage. PLoS Pathog. 2015, 11, e1004820. [Google Scholar] [CrossRef] [PubMed]
- Zhang, Q.; Chen, L.-H.; Yang, H.; Fang, Y.-C.; Wang, S.-W.; Wang, M.; Yuan, Q.-T.; Wu, W.; Zhang, Y.-M.; Liu, Z.-J.; et al. Gpr84 Signaling Promotes Intestinal Mucosal Inflammation Via Enhancing Nlrp3 Inflammasome Activation in Macrophages. Acta Pharmacol. Sin. 2022, 43, 2042–2054. [Google Scholar] [CrossRef]
- Plesch, E.; Chen, C.-C.; Butz, E.; Rosato, A.S.; Krogsaeter, E.K.; Yinan, H.; Bartel, K.; Keller, M.; Robaa, D.; Teupser, D.; et al. Selective Agonist of Trpml2 Reveals Direct Role in Chemokine Release from Innate Immune Cells. ELife 2018, 7, e39720. [Google Scholar] [CrossRef]
- Goetz, D.H.; Holmes, M.A.; Borregaard, N.; Bluhm, M.E.; Raymond, K.N.; Strong, R.K. The Neutrophil Lipocalin Ngal Is a Bacteriostatic Agent That Interferes with Siderophore-Mediated Iron Acquisition. Mol. Cell 2002, 10, 1033–1043. [Google Scholar] [CrossRef]
- Scarl, R.T.; Lawrence, C.M.; Gordon, H.M.; Nunemaker, C.S. Steap4: Its Emerging Role in Metabolism and Homeostasis of Cellular Iron and Copper. J. Endocrinol. 2017, 234, R123–R134. [Google Scholar] [CrossRef]
- Kalliolias, G.D.; Ivashkiv, L.B. Tnf Biology, Pathogenic Mechanisms and Emerging Therapeutic Strategies. Nat. Rev. Rheumatol. 2016, 12, 49–62. [Google Scholar] [CrossRef] [PubMed]
- Gaffen, S.L. Structure and Signalling in the Il-17 Receptor Family. Nat. Rev. Immunol. 2009, 9, 556–567. [Google Scholar] [CrossRef] [PubMed]
- Han, W.; Fessel, J.P.; Sherrill, T.; Kocurek, E.G.; Yull, F.E.; Blackwell, T.S. Enhanced Expression of Catalase in Mitochondria Modulates Nf-Κb-Dependent Lung Inflammation through Alteration of Metabolic Activity in Macrophages. J. Immunol. 2020, 205, 1125–1134. [Google Scholar] [CrossRef] [PubMed]
- Li, L.-L.; Dai, B.; Sun, Y.-H.; Zhang, T.-T. The Activation of Il-17 Signaling Pathway Promotes Pyroptosis in Pneumonia-Induced Sepsis. Ann. Transl. Med. 2020, 8, 674. [Google Scholar] [CrossRef]
- McGeachy, M.J.; Cua, D.J.; Gaffen, S.L. The Il-17 Family of Cytokines in Health and Disease. Immunity 2019, 50, 892–906. [Google Scholar] [CrossRef] [PubMed]
- Shibue, Y.; Kimura, S.; Kajiwara, C.; Iwakura, Y.; Yamaguchi, K.; Tateda, K. Role of Interleukin-17 in a Murine Community-Associated Methicillin-Resistant Staphylococcus Aureus Pneumonia Model. Microbes Infect. 2019, 21, 33–39. [Google Scholar] [CrossRef] [PubMed]
- Tojima, Y.; Fujimoto, A.; Delhase, M.; Chen, Y.; Hatakeyama, S.; Nakayama, K.; Kaneko, Y.; Nimura, Y.; Motoyama, N.; Ikeda, K.; et al. Nak Is an Ikappab Kinase-Activating Kinase. Nature 2000, 404, 778–782. [Google Scholar] [CrossRef] [PubMed]
- Bergstrøm, B.; Aune, M.H.; Awuh, J.A.; Kojen, J.F.; Blix, K.J.; Ryan, L.; Flo, T.H.; Mollnes, T.E.; Espevik, T.; Stenvik, J. Tlr8 Senses Staphylococcus Aureus Rna in Human Primary Monocytes and Macrophages and Induces Ifn-Β Production Via a Tak1-Ikkβ-Irf5 Signaling Pathway. J. Immunol. 2015, 195, 1100–1111. [Google Scholar] [CrossRef] [PubMed]
- Hébert, A.; Sayasith, K.; Sénéchal, S.; Dubreuil, P.; Lagacé, J. Demonstration of Intracellular Staphylococcus Aureus in Bovine Mastitis Alveolar Cells and Macrophages Isolated from Naturally Infected Cow Milk. FEMS Microbiol. Lett. 2000, 193, 57–62. [Google Scholar] [CrossRef] [PubMed]
- Kubica, M.; Guzik, K.; Koziel, J.; Zarebski, M.; Richter, W.; Gajkowska, B.; Golda, A.; Maciag-Gudowska, A.; Brix, K.; Shaw, L.; et al. A Potential New Pathway for Staphylococcus Aureus Dissemination: The Silent Survival of S. Aureus Phagocytosed by Human Monocyte-Derived Macrophages. PLoS ONE 2008, 3, e1409. [Google Scholar] [CrossRef]
- Peignier, A.; Parker, D. Impact of Type I Interferons on Susceptibility to Bacterial Pathogens. Trends Microbiol. 2021, 29, 823–835. [Google Scholar] [CrossRef]
- Yamada, M.; JGomez, C.; Chugh, P.E.; Lowell, C.A.; Dinauer, M.C.; Dittmer, D.P.; Doerschuk, C.M. Interferon-Γ Production by Neutrophils During Bacterial Pneumonia in Mice. Am. J. Respir. Crit. Care Med. 2011, 183, 1391–1401. [Google Scholar] [CrossRef]
- Nguyen, Q.-T.; Furuya, Y.; Roberts, S.; Metzger, D.W. Role of Interleukin-12 in Protection against Pulmonary Infection with Methicillin-Resistant Staphylococcus Aureus. Antimicrob. Agents Chemother. 2015, 59, 6308–6316. [Google Scholar] [CrossRef]
- Verma, A.K.; Bauer, C.; Palani, S.; Metzger, D.W.; Sun, K. Ifn-Γ Drives Tnf-A Hyperproduction and Lethal Lung Inflammation During Antibiotic Treatment of Postinfluenza Pneumonia. J. Immunol. 2021, 207, 1371–1376. [Google Scholar] [CrossRef]
- Kaplan, A.; Lee, M.W.; Wolf, A.J.; Limon, J.J.; Becker, C.A.; Ding, M.; Murali, R.; Lee, E.Y.; Liu, G.Y.; Wong, G.C.L.; et al. Direct Antimicrobial Activity of Ifn-Β. J. Immunol. 2017, 198, 4036–4045. [Google Scholar] [CrossRef] [PubMed]
- John, S.P.; Sun, J.; Carlson, R.J.; Cao, B.; Bradfield, C.J.; Song, J.; Smelkinson, M.; Fraser, I.D.C. Ifit1 Exerts Opposing Regulatory Effects on the Inflammatory and Interferon Gene Programs in Lps-Activated Human Macrophages. Cell Rep. 2018, 25, 1. [Google Scholar] [CrossRef] [PubMed]
- Heinz, L.X.; Baumann, C.L.; Köberlin, M.S.; Snijder, B.; Gawish, R.; Shui, G.; Sharif, O.; Aspalter, I.M.; Müller, A.C.; Kandasamy, R.K.; et al. The Lipid-Modifying Enzyme Smpdl3b Negatively Regulates Innate Immunity. Cell Rep. 2015, 11, 1919–1928. [Google Scholar] [CrossRef]
- Zhang, W.; Wei, Y.; Zhang, H.; Liu, J.; Zong, Z.; Liu, Z.; Zhu, S.; Hou, W.; Chen, Y.; Deng, H. Structural Alternation in Heat Shock Proteins of Activated Macrophages. Cells 2021, 10, 3507. [Google Scholar] [CrossRef]
- Hamidzadeh, K.; Christensen, S.M.; Dalby, E.; Chandrasekaran, P.; Mosser, D.M. Macrophages and the Recovery from Acute and Chronic Inflammation. Annu. Rev. Physiol. 2017, 79, 567–592. [Google Scholar] [CrossRef] [PubMed]
- Shimp, S.K.; Parson, C.D.; Regna, N.L.; Thomas, A.N.; Chafin, C.B.; Reilly, C.M.; Rylander, M.N. Hsp90 Inhibition by 17-Dmag Reduces Inflammation in J774 Macrophages through Suppression of Akt and Nuclear Factor-Κb Pathways. Inflamm. Res. Off. J. Eur. Histamine Res. Soc. 2012, 61, 521–533. [Google Scholar] [CrossRef] [PubMed]
- Ammanath, A.V.; Jarneborn, A.; Nguyen, M.-T.; Wessling, L.; Tribelli, P.; Nega, M.; Beck, C.; Luqman, A.; Selim, K.; Kalbacher, H.; et al. From a Hsp90-Binding Protein to a Peptide Drug. microLife 2022, 4, uqac023. [Google Scholar] [CrossRef]
- Jan, R.-L.; Yang, S.-C.; Liu, Y.-C.; Yang, R.-C.; Tsai, S.-P.; Huang, S.-E.; Yeh, J.-L.; Hsu, J.-H. Extracellular Heat Shock Protein Hsc70 Protects against Lipopolysaccharide-Induced Hypertrophic Responses in Rat Cardiomyocytes. Biomed. Pharmacother. Biomed. Pharmacother. 2020, 128, 110370. [Google Scholar] [CrossRef]
- Shi, Y.; Tu, Z.; Tang, D.; Zhang, H.; Liu, M.; Wang, K.; Calderwood, S.K.; Xiao, X. The Inhibition of Lps-Induced Production of Inflammatory Cytokines by Hsp70 Involves Inactivation of the Nf-Kappab Pathway but Not the Mapk Pathways. Shock 2006, 26, 277–284. [Google Scholar] [CrossRef]
- Zhang, X.; Feng, T.; Zhou, X.; Sullivan, P.M.; Hu, F.; Lou, Y.; Yu, J.; Feng, J.; Liu, H.; Chen, Y. Inactivation of Tmem106a Promotes Lipopolysaccharide-Induced Inflammation Via the Mapk and Nf-Κb Signaling Pathways in Macrophages. Clin. Exp. Immunol. 2021, 203, 125–136. [Google Scholar] [CrossRef]
- Wynn, T.A.; Vannella, K.M. Macrophages in Tissue Repair, Regeneration, and Fibrosis. Immunity 2016, 44, 450–462. [Google Scholar] [CrossRef] [PubMed]
- Rupprecht, T.A.; Angele, B.; Klein, M.; Heesemann, J.; Pfister, H.-W.; Botto, M.; Koedel, U. Complement C1q and C3 Are Critical for the Innate Immune Response to Streptococcus Pneumoniae in the Central Nervous System. J. Immunol. 2007, 178, 1861–1869. [Google Scholar] [CrossRef] [PubMed]
- Kang, Y.-S.; Do, Y.; Lee, H.-K.; Park, S.H.; Cheong, C.; Lynch, R.M.; Loeffler, J.M.; Steinman, R.M.; Park, C.G. A Dominant Complement Fixation Pathway for Pneumococcal Polysaccharides Initiated by Sign-R1 Interacting with C1q. Cell 2006, 125, 47–58. [Google Scholar] [CrossRef] [PubMed]
- Sharif, O.; Gawish, R.; Warszawska, J.M.; Martins, R.; Lakovits, K.; Hladik, A.; Doninger, B.; Brunner, J.; Korosec, A.; Schwarzenbacher, R.E.; et al. The Triggering Receptor Expressed on Myeloid Cells 2 Inhibits Complement Component 1q Effector Mechanisms and Exerts Detrimental Effects During Pneumococcal Pneumonia. PLoS Pathog. 2014, 10, e1004167. [Google Scholar] [CrossRef] [PubMed]
- Bohlson, S.S.; Sean, D.O.; Hulsebus, H.J.; Ho, M.-M.; Fraser, D.A. Complement, C1q, and C1q-Related Molecules Regulate Macrophage Polarization. Front. Immunol. 2014, 5, 402. [Google Scholar] [CrossRef]
- West, E.E.; Kolev, M.; Kemper, C. Complement and the Regulation of T Cell Responses. Annu. Rev. Immunol. 2018, 36, 309–338. [Google Scholar] [CrossRef]
- Killick, J.; Morisse, G.; Sieger, D.; Astier, A.L. Complement as a Regulator of Adaptive Immunity. Semin. Immunopathol. 2018, 40, 37–48. [Google Scholar] [CrossRef]
Disclaimer/Publisher’s Note: The statements, opinions and data contained in all publications are solely those of the individual author(s) and contributor(s) and not of MDPI and/or the editor(s). MDPI and/or the editor(s) disclaim responsibility for any injury to people or property resulting from any ideas, methods, instructions or products referred to in the content. |
© 2023 by the authors. Licensee MDPI, Basel, Switzerland. This article is an open access article distributed under the terms and conditions of the Creative Commons Attribution (CC BY) license (https://creativecommons.org/licenses/by/4.0/).

