Article

Newborns with Favourable Outcomes after Perinatal Asphyxia Have Upregulated Glucose Metabolism-Related Proteins in Plasma

1
Centre for Neuroscience, Surgery and Trauma, Blizard Institute, Barts and The London School of Medicine and Dentistry, Queen Mary University of London, London E1 2AT, UK
2
Proteome Sciences PLC, Coveham House, Surrey KT11 3EP, UK
3
St. Peter’s Hospital (Ashford and St. Peter’s Hospitals NHS Foundation Trust), Chertsey KT16 0PZ, UK
4
Neonatal Unit, Royal London Hospital, Barts Health NHS Trust, London E1 1FR, UK
*
Author to whom correspondence should be addressed.
Biomolecules 2023, 13(10), 1471; https://doi.org/10.3390/biom13101471
Submission received: 23 July 2023 / Revised: 17 September 2023 / Accepted: 23 September 2023 / Published: 30 September 2023
(This article belongs to the Collection Feature Papers in 'Biomacromolecules: Proteins')

Abstract

:
Hypoxic-ischaemic encephalopathy (HIE) is an important cause of morbidity and mortality globally. Although mild therapeutic hypothermia (TH) may improve outcomes in selected babies, the mechanism of action is not fully understood. A proteomics discovery study was carried out to analyse proteins in the plasma of newborns with HIE. Proteomic analysis of plasma from 22 newborns with moderate-severe HIE that had initially undergone TH, and relative controls including 10 newborns with mild HIE who did not warrant TH and also cord blood from 10 normal births (non-HIE) were carried out using the isobaric Tandem Mass Tag (TMT®) 10plexTM labelling with tandem mass spectrometry. A total of 7818 unique peptides were identified in all TMT10plexTM samples, translating to 3457 peptides representing 405 proteins, after applying stringent filter criteria. Apart from the unique protein signature from normal cord blood, unsupervised analysis revealed several significantly regulated proteins in the TH-treated moderate-severe HIE group. GO annotation and functional clustering revealed various proteins associated with glucose metabolism: the enzymes fructose-bisphosphate aldolase A, glyceraldehyde-3-phosphate dehydrogenase, phosphoglycerate mutase 1, phosphoglycerate kinase 1, and pyruvate kinase PKM were upregulated in newborns with favourable (sHIE+) outcomes compared to newborns with unfavourable (sHIE−) outcomes. Those with favourable outcomes had normal MR imaging or mild abnormalities not predictive of adverse outcomes. However, in comparison to mild HIE and the sHIE− groups, the sHIE+ group had the additional glucose metabolism-related enzymes upregulated, including triosephosphate isomerase, α-enolase, 6-phosphogluconate dehydrogenase, transaldolase, and mitochondrial glutathione reductase. In conclusion, our plasma proteomic study demonstrates that TH-treated newborns with favourable outcomes have an upregulation in glucose metabolism. These findings may open new avenues for more effective neuroprotective therapy.

1. Introduction

Hypoxic-ischaemic encephalopathy (HIE) remains a devastating problem in term infants, that causes significant morbidity and mortality in newborns after perinatal asphyxia. It has been estimated that up to 3.8 per 1000 live births are affected in industrialised nations [1] and those newborns that survive often suffer from cerebral palsy, cognitive impairments, and epilepsy. Currently, the only available treatment is therapeutic hypothermia (TH), with numbers needed to treat of 9 for reduced death and severe disability [2]. Therefore, there is a need to further understand the pathology of the disease processes and/or the mechanisms of action of TH at the molecular level, so that more infants can be successfully treated.
Plasma has been successfully used to study newborns with HIE, and predetermined protein targets are studied using the technique of immunoassay [3,4,5,6]. Studies have frequently focused on markers related to neurones [7,8], astrocytes [8,9], and inflammatory markers [8,10] using a single-plex enzyme-linked immunosorbent assay (ELISA). Several independent groups using this technique have identified specific protein markers related to brain injury in the blood samples of newborns with HIE [11]. For example, increased levels of S100β [11], NSE [11], UCH-L1 [12], GFAP [8] and NfL [13,14] was identified. However, conventional ELISA can only test a single known analyte at a time due to analyte-antibody specificity. Although improvements have resulted in multiplex immunoassays testing multiple analytes in a single run, they cannot test multiple patient samples within the single run, giving rise to potential measurement variation between patients [15]. Furthermore, the analytes chosen are often restricted by current knowledge and understanding.
Improvements in mass spectrometry proteomic analysis have enabled more effective detection of low-abundance proteins and an unbiased analysis of samples [16]. The commercially available multiplexed proteomics technique involving the Tandem Mass Tag (TMT) 10plex™ labelled mass spectrometry can avoid all these issues by the ability to analyse complex protein mixtures from up to 10 patients simultaneously, with high resolution, specificity, and reproducibility, to enable the identification of selective protein targets from thousands of proteins in an unbiased format [16,17].
This study using the TMT10plexTM labelled liquid chromatography-tandem mass spectrometry aimed to identify a protein signature that would distinguish newborns at risk of adverse outcomes after perinatal hypoxia-ischemia.

2. Materials and Methods

2.1. Recruitment

Recruitment of newborns was carried out at four centers in the United Kingdom (The Royal London Hospital, Homerton University Hospital, University Hospital Southampton, and Norfolk and Norwich University Hospital) during the period of January 2014 to January 2016, with Research Ethics Committee approval (Bromley REC ref: 13/LO/17380), as part of the Brain Injury Biomarkers in NewbornS (BIBiNS) study. Blood from newborns with moderate-severe HIE treated with mild therapeutic hypothermia (TH), based on the standard cooling criteria (UK TOBY Cooling Register Clinician’s Handbook) [18], as per local clinical practice was collected. Furthermore, the mild HIE group comprised of newborns admitted to the neonatal unit for treatment with intravenous fluids. These infants had grade 1 encephalopathy and/or had required resuscitation and/or had low cord pH and/or had a metabolic acidosis or raised lactate but did not fulfil standard cooling criteria, hence were not treated with TH (mHIE group). The “normal” group (ncord group) consisted of cord blood from babies born after 36 weeks gestation either vaginally or after elective caesarean section with normal Apgars who required no resuscitation or admission to the neonatal unit. Pregnancies affected by pre-eclampsia, diabetes and congenital malformations or co-morbidities were excluded.
Newborns who had suffered moderate-severe HIE and had undergone TH were subdivided into those who had cerebral magnetic resonance imaging (MRI) predictive of favorable outcomes (sHIE+ group) and those who had cerebral MRI predictive of unfavorable outcomes (sHIE− group). Cerebral MR images were rated independently by a neuroradiologist and a neonatologist with expertise, in a blinded fashion as previously described [19], using a system validated for use in this group of babies [20]. “Cerebral MRIs predictive of an unfavourable outcome had reversed or abnormal signal bilaterally on T1/T2 weighted sequences in the posterior limb of the internal capsule (PLIC), multifocal or widespread abnormal signal intensity in the basal ganglia and thalami (BGT), and/or severe widespread white matter (WM) lesions including infarction, haemorrhage and long T1 and T2 (sHIE− group). Infants with images predictive of favourable outcome had normal images or less severe patterns of injury than those described above (sHIE+ group)” [19,20]. Consensus was reached in cases of disagreement. Furthermore, we have demonstrated in this cohort of newborns that cerebral MRI has been shown to be highly predictive of later neurodevelopmental outcomes [19].

2.2. Plasma Sample Preparation and TMT10plex™ Labelling

All blood samples were collected in spray-coated K2EDTA tubes, centrifuged at 1000× g for 10 min, and then the plasma was aliquoted into fresh tubes and stored at −80 °C until further processed. Sixty-eight plasma samples were initially provided to Proteome Sciences Ltd. Plasma samples with substantial haemolysis scores of 4–5 (Figure 1A,B) were excluded for further processing as haemolysis can affect protein expression levels [21]. Depletion of albumin and IgG from each 10 μL plasma sample was carried out using the Pierce™ Top 2 Abundant Protein Depletion Spin Columns (Pierce Biotechnology, Rockford, IL, USA) according to the manufacturer’s instruction, to enable broader proteome profiling. The protein concentration was determined using the Bradford assay according to the manufacturer’s instructions and the samples were visualized on Coomassie stained (Imperial Stain, Pierce) SDS-PAGE 4–20% gradient gels (Criterion, Bio-Rad Laboratories Ltd., Watford, UK) (Figure 1C,D). A final number of 44 samples was selected for LC-MS/MS analysis, with the samples chosen consisted of 12 ncord, 10 mHIE, 12 sHIE+ and 10 sHIE− specimens.
Forty-four albumin and IgG-depleted plasma samples and a reference sample created from a pooling of 37 plasma samples from all patient groups were prepared as previously described [22]. Briefly, plasma samples were reduced with 1 mM tris(2-carboxyethyl)phosphine (TCEP, 1 h in 55 °C), alkylated with 7.5 mM iodoacetamide (1 h at room temperature (RTP)), and digested with trypsin (1:25 weight ratio, approx. 18 h in 37 °C) to generate peptides. Peptides from each sample were labelled with one of a 15 mM TMT10plex™ set of isobaric mass tags (1 h at RTP), then the reaction was quenched with 0.25% hydroxylamine (15 min at RTP). The samples were desalted and purified using RP18 columns and SCX purification, respectively.

2.3. Liquid Chromatography Tandem Mass Spectrometry (LC-MS/MS)

Quantitative analysis using LC-MS/MS was carried out as described previously [22]. Briefly, samples were randomly distributed over TMT10plex™ experiments regarding proteomic category, haemolysis rating, and albumin rating. Each TMT10plex™ experiment (n = 5) was separated into 8 fractions by HPLC-assisted high pH reverse phase chromatography (EC 250/4.6 NUCLEODUR C18 Gravity (Macherey-Nagel) and HPLC system (Waters Alliance 2695)). All fractions were lyophilised to completion. In each TMT-MS3 experiment, an aliquot of reference sample was treated as the 10th sample. Individual samples were divided into a labelling design in which 9 experimental samples were combined with a single reference. All 10-labelled digests were then mixed in equal amounts to form a TMT10plex™ experiment sample. Fractions were analysed in duplicate by LC-MS/MS using the EASY-nLC 1000 system (Thermo Scientific, Loughborough, UK) coupled to an Orbitrap Velos Pro Mass Spectrometer (Thermo Scientific, Loughborough, UK). Re-suspended peptides were loaded onto a nanoViper C18 Acclaim PepMap 100 pre-column (Thermo Scientific, Loughborough, UK) and resolved using an increasing gradient of 0.1% formic acid in acetonitrile through a 50 cm PepMap RSLC analytical column (Thermo Scientific, Loughborough, UK), at a flow rate of 250 nl/min. Peptide mass spectra were acquired throughout the entire chromatographic run (180 min), using the TOP 10 collision-induced dissociation (CID) method, enabling higher collision-induced dissociation (HCD) MS3 scans for accurate quantitation of TMT reporter ions.

2.4. Proteomics Data Analysis

Raw data files were submitted to Proteome Discoverer v1.4 (Thermo Scientific, Loughborough, UK) using the Spectrum Files and Spectrum selector node. The SEQUEST HT node was suitably set up to search data against the human UniProtKB database, allowing for variable modification of methionine oxidation. The reporter ions quantifier node was set up to measure the raw intensity values for TMT10plex™ monoisotopic ions (126, 127N, 127C, 128N, 128C, 129N, 129C, 130N, 130C, 131). All raw intensity values were exported for later processing and filtering using in-house software which included options for filtering, normalization, exploratory analysis, biostatistics, and functional analysis. Individual peptide spectrum matches (PSM) were filtered for isolation interference values <50% and TMT® intensity values were median-scaled. Ratios of reporter ion intensities were calculated for each sample relative to the reference sample within each plex and log2-transformed. PSMs belonging to identical peptide sequences were then summarised (median). Subsequently, peptides with ≥35% missing values per patient were removed, and the remaining missing values were replaced using an iterative principal component analysis (PCA)-based approach [23,24]. A Linear Models for Microarray data (LIMMA)-based approach was used to correct batch effects, due to the different TMT® experiments, and the data matrix was median-normalised. Protein values were determined as the trimmed mean of unique, unmodified peptides. Functional analysis was performed using in-house software, calculating the significance of enrichment for GOBP terms.

2.5. Western Blot Analysis

To validate the mass spectrometry data, the western blotting technique was carried out on a selected number of protein targets as previously described [25,26]. Fifteen μg of total plasma protein samples, determined with the bicinchoninic acid assay, diluted 1 in 25 with ice-cold lysis buffer (containing 20 mM HEPES, 100 nM NaCl, 100 mM NaF, 1 mM Na3VO4, 5 mM EDTA, 1% Nonidet P-40 substitute, and 1x protease inhibitor cocktail (Roche cOmpleteTM)) were loaded onto 12% sodium dodecyl-sulfate polyacrylamide gel then subjected to electrophoresis. Each blot contained mHIE (n = 4), sHIE+ (n = 5–6), and sHIE− (n = 4–5). Furthermore, 1 of 8 (12.5%), 6 of 11 (54.5%), and 5 of 9 (55.6%) of the samples used in the western blotting were not used in the proteomic study to carry out in- and out-of- sample validation for mild, sHIE+ and sHIE− groups, respectively. Thereafter, the protein bands in the gel were transferred onto Hybond™ P nitrocellulose membrane using wet western blot transfer. The quality and quantity of protein bands on the blots were determined using 0.1% Ponceau in 1% (v/v) acetic acid solution and the images were captured using the Bio-Rad ChemiDoc™ gel system. After washing with PBS-Tween 20 and blocking for 30 min in 5% skimmed milk, incubation of the blot with the antibodies was carried out overnight at room temperature (Table 1). Next day, blots were washed with phosphate-buffered saline (PBS), then incubated with goat anti-mouse and -rabbit horseradish peroxidase for 1 h at RTP (Table 1).
The blot was washed with PBS twice and then once with distilled water, before incubation with ECL™ Prime Western blotting detection reagent (RPN2232) for 5 min and imaged using the Bio-Rad ChemiDoc™ gel system.
Western blots were analysed using the ImageJ software to determine the protein of interest based on specific antibody expression and then normalised against the total protein loaded per lane, determined from the Ponceau S staining. It has been shown for human biosamples that total protein is an effective loading control compared to using a specific endogenous protein control related to a housekeeping gene [27].

2.6. Statistical Analysis

Statistical analysis for clinical data was carried out using SPSS (version 28). Continuous variables between groups were compared using ANOVA and proportions were compared using Pearson’s chi-square statistic. Statistical analysis for western blot was carried out in the GraphPad Prism v8 software with either one-way ANOVA followed by post hoc Tukey test or Kruskal-Wallis one-way ANOVA with post hoc Dunn’s test if the data was parametric or non-parametric, respectively. A p value of <0.05 was set as significance.

3. Results

3.1. Plasma Sample Quality

Sixty-eight plasma samples submitted for analysis were initially visually assessed for haemolysis based on a 1–5 scale (5 highest) (Figure 1A,B). The average protein concentration (±SD) of the 68 plasma samples was 50.3 ± 6.8 mg/mL, with a range of 36.3–68.5 mg/mL. Three samples were slightly outside of the range mean ± two-fold SD. The majority of the plasma samples showed a homogenous band pattern that is typical for plasma samples (Figure 1C). The albumin and IgG were successfully depleted in all but six samples, where a significant band at the molecular weight of albumin and IgG was present (Figure 1D). A final number of 44 samples was selected for LC-MS/MS analysis, with low haemolysis based on haemolytic appearance, patient group, protein quantity and sample volume, with an average protein concentration of 48.9 ± 5.7 mg/mL.

3.2. Demographic Characteristics

The perinatal characteristics of the newborns used in the study are described in Table 2. As would be anticipated in comparison to the controls or mHIE groups, the newborns with moderate—severe HIE (containing sHIE + and sHIE−) group had a significantly lower Apgar score at 10 min, increased need for need for chest compressions during resuscitation, worse base deficit in the first hour, higher grade of encephalopathy, more inotropic support during the neonatal period, and increased seizure burden. In comparison to the sHIE+, more infants in the sHIE− group had meconium aspiration, seizures, and required inotropic support. TH was commenced within 6 h after birth and time of commencement was not significantly different between the two groups (median age 2.5 h (sHIE+) and 2 h (SHIE−)).
Of the 12 babies in the sHIE+ group, 6 had normal cerebral MRI scans, three had mild white matter (WM) abnormalities, one had moderate WM abnormality, one had combined mild basal ganglia and thalami (BGT) and mild WM abnormalities, and one had isolated mild BGT abnormalities. In the sHIE− group, 7 newborns had global brain injury (a combination of moderate to severe posterior limb of the internal capsule (PLIC), BGT and WM abnormalities), two had predominantly BGT involvement and one had predominantly WM involvement. Of these 10 sHIE− newborns, six children developed cerebral palsy, one child had severe communication difficulties with normal gross motor function, one had normal outcome, and follow up outcomes were not available for two. Cerebral MR imaging and later outcomes for the mHIE and the ncord groups were not available.

3.3. Cord Blood from Normal Pregnancies Exhibits a Different Protein Profile to the Blood of HIE Newborns

From the 44 samples analysed, 3456 peptides were detected after applying stringent filter criteria, which represented 401 proteins. PCA and heatmap plots using a protein matrix defined by regulated proteins with p value < 0.05, exhibited a very clear separation of protein expression in ncord plasma in comparison to the HIE groups, that all had overlapping protein profiles (Figure 2A,B). On comparing the mHIE to ncord samples, there were 2 down-regulated and 2 up-regulated proteins (Table 3). The top 2 most down-regulated proteins (UniProt ID, log2 fold change) in the mHIE group were hepatocyte growth factor-like protein (P26927, 0.71 FC) and cholinesterase (P06276, 0.76 FC). In contrast, the top 2 most up-regulated proteins (UniProt ID) affected by mild HIE were isoform 2 of glutathione S-transferase omega-1 (P78417-2, 1.58 FC) and transaldolase (P37837, 1.87 FC).
On comparing the sHIE samples (n = 22) with the ncord samples (n = 12), only up-regulated proteins were detected (Table 4 and Table 5). The top 2 most up-regulated proteins (UniProt ID, log2 fold change) affected in the sHIE+ group were profilin-1 (P07737, 4.08 FC) and moesin (P26038, 3.67 FC) (Table 4). Meanwhile, the top 2 most up-regulated proteins (UniProt ID, log2 fold change) in the sHIE− outcome were heat shock cognate 71 kDa protein (P11142, 2.41 FC) and insulin-like growth factor-binding protein-2 (P18065, 2.04 FC) (Table 5).

3.4. mHIE Plasma Exhibit a Different Protein Profile to Plasma from sHIE+ and sHIE− Groups

Analysis of the HIE groups using the PCA plot showed there was no distinct cluster separation between the mHIE, sHIE+ and sHIE− groups (Figure 3A). The mHIE group exhibited greater cluster separation from the sHIE+ group compared to the sHIE− group, based on the PCA plot (Figure 3A). The loading plot and heatmap confirmed that the mHIE group was in the opposite pole to sHIE+ group, while the sHIE− group was more skewed towards the mHIE group (Figure 3B,C).
Comparison between sHIE+ and mHIE groups revealed 61 proteins that were significantly regulated, with 8 proteins down-regulated and 53 proteins up-regulated (Table 6 and Figure 4A). The top 2 most down-regulated proteins (UniProt ID, log2 fold change) were immunoglobulin heavy constant gamma 4 (P01861, −1.46 FC) and haptoglobin (P00738, −1.44 FC). The top 2 most up-regulated proteins (UniProt ID, log2 fold change) were haemoglobin subunit delta (P02042, 1.91 FC) and heat shock 10 kDa protein, mitochondrial (P61604, −1.57 FC).
Comparing sHIE− and mHIE revealed 10 proteins that were significantly regulated, with 5 proteins down-regulated and 5 proteins up-regulated (Table 7 and Figure 4B). The top 2 most down-regulated proteins (UniProt ID, log2 fold change) affected by sHIE− outcome were immunoglobulin heavy constant gamma 4 (P01861, −1.65 FC) and immunoglobulin heavy constant gamma 3 (P01860, −1.05 FC). In comparison, the top 2 most up-regulated proteins (UniProt ID, log2 fold change) affected by sHIE− outcome were hemoglobulin subunit delta (P02042, 1.42 FC) and mitochondrial heat shock protein 10 kDa (P61604, 1.21 FC).

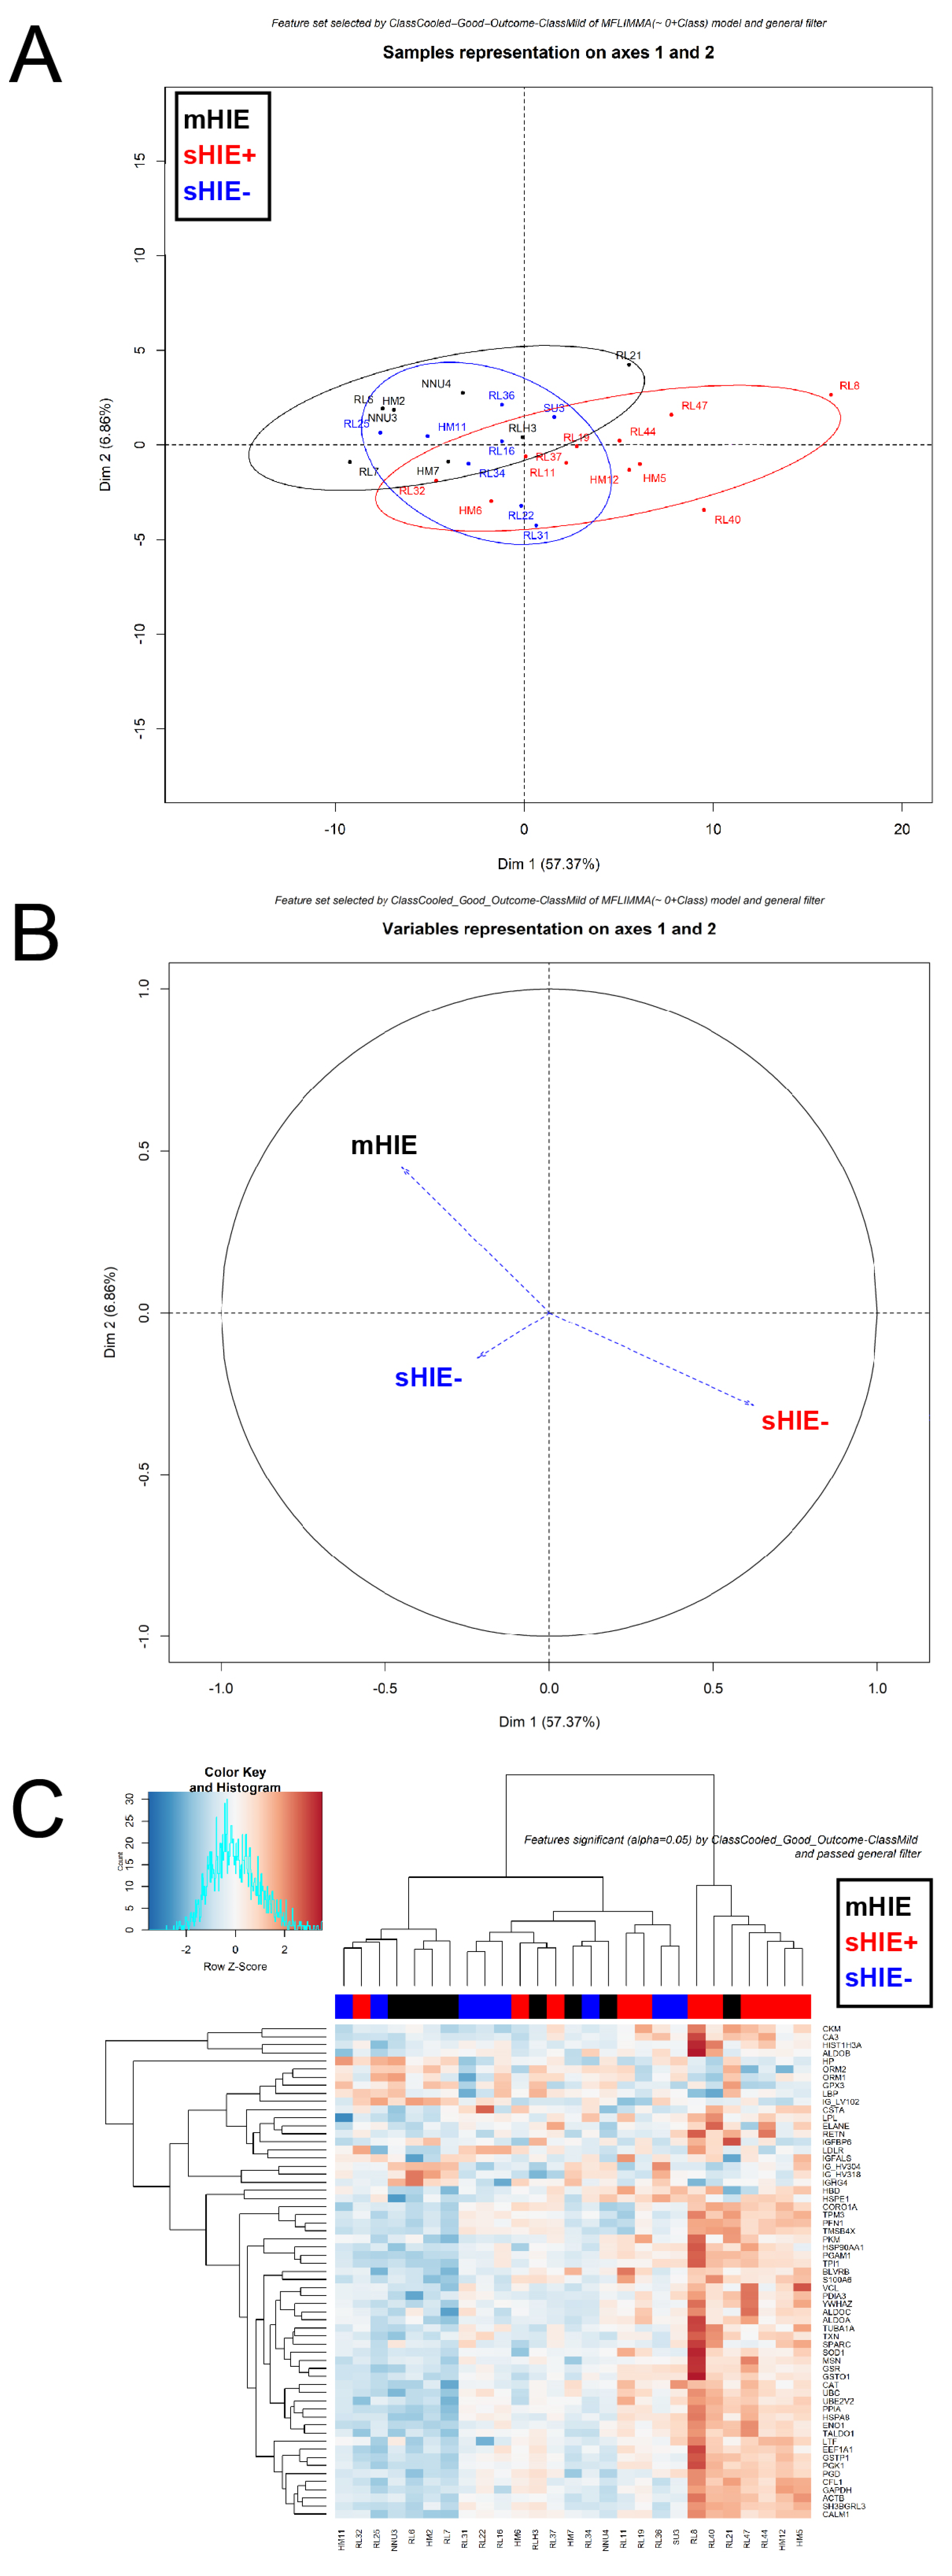
3.5. Comparison between sHIE+ and sHIE− Groups

Comparison within the moderate-severe HIE group who were treated with hypothermia (sHIE+ and sHIE− groups) revealed 31 proteins that were significantly regulated, with 1 protein down-regulated and 30 proteins up-regulated (Table 8 and Figure 4C). The only down-regulated protein (UniProt ID, log2 fold change) affected by sHIE+ outcome was bone marrow proteoglycan (P13727, −0.72 FC). The top 2 most up-regulated proteins (UniProt ID, log2 fold change) linked to sHIE+ outcomes were creatine kinase M-type (P06732, 2.11 FC) and histone H3.1 (P68431, 1.45 FC). Six of these 31 proteins (19%) are related to the glucose metabolism pathway.

3.6. Validation of Selected Protein Targets with Western Blotting

Western blot was carried out to validate some randomly selected targets identified in several group comparisons observed from the proteomic analysis, to validate the result in newborn samples. The proteins glyceraldehyde-3-phosphate dehydrogenase (GAPDH), lactotransferrin, β-actin, and phosphoglycerate kinase 1 (PGK1) were all significantly increased in the plasma of sHIE+ infants compared with sHIE− outcomes (Table 8 and Figure 5A–D). Similarly, the following proteins, GAPDH and namely upper band of lactotransferrin were also significantly upregulated in the sHIE+ group compared to the mHIE group (Figure 5A,B). The total protein values (means +/− SD) based on the Ponceau staining for the groups were mHIE, 28,828 +/− 8097 AU; sHIE+, 26,878 +/− 6395 AU; sHIE−, 32,494 +/− 8049 AU.

3.7. Biological Processes and Pathways

Enrichment gene ontology for cell component and functional analysis were compared between the sHIE+ and mHIE (Figure 6A,B) or sHIE− groups (Figure 6C,D). In the cell component analysis for the sHIE+ compared to mHIE groups, cytosol, nucleus and cytoplasm were the top 3 main cell components, and glycolysis, gluconeogenesis, and glucose metabolism were the top 3 main functional roles. In contrast, the cell component analysis for the sHIE+ compared to sHIE− were cytosol, vesicle and cytoplasm for the top 3 cell components, and interleukin-12 (IL-12) signalling, glycolysis and gluconeogenesis for the top 3 functional roles.
Using the database for annotation, visualization and integrated discovery (DAVID) functional annotation tools, a high number of regulated proteins were post-translationally modified or involved in processes related to phosphorylation or acetylation, with an enrichment score of 13.89 in one annotation cluster (Figure 7A). A second annotation cluster with an enrichment score of 6.56 was on nicotinamide nucleotide and purine (Figure 7A). Furthermore, a high number of regulated proteins were post-translationally modified or involved in processes related to phosphorylation or acetylation (Figure 7B). After analysis of differential expressed proteins using STRING 10 software, most differentially-expressed proteins interacted mostly with each other and are related to catabolic processes or cytoplasm/cytoskeleton (Figure 7C).
A closer examination of the proteins related to glucose metabolism and catabolism processes in sHIE+ compared to the other groups revealed 12 proteins, which were all enzymes (Table 9). Nine of these enzymes (fructose-bisphosphate aldolase A/B/C, triosephosphate isomerase, glyceraldehyde-3-phosphate dehydrogenase, phosphoglycerate kinase 1, phosphoglycerate mutase, α-enolase, pyruvate kinase) were involved in the glycolytic/gluconeogenesis pathway, with two enzymes (transketolase and transaldolase) involved in the pentose phosphate pathway, and one enzyme (glutathione reductase, mitochondrial) involved in the citric acid cycle (Figure 8).

4. Discussion

The plasma proteins from newborns with TH-treated moderate-severe HIE, and controls from mild HIE and non-HIE cord blood were analysed in a proteomic study using TMT10plex™ mass spectrometry. A number of changes in specific proteins were identified and some were positively verified with western blotting. Moreover, protein signatures from the cord blood from normal pregnancies was distinctly different from any of the HIE groups. These data indicate that there is a radical difference in plasma protein profile between the ncord plasma and the samples from newborns with HIE. Within the HIE groups, the protein signature detected in the mHIE group was more distinct from the sHIE+ group than from the sHIE− group.
Significance of enrichment analysis, focused on Gene Ontology Cell Component terms showed that many of the proteins detected were related to the cell component of the cytosol/cytoplasm and nucleus, and that phosphorylation or acetylation or cytoplasm were the top three key categories involved. Furthermore, functional analysis revealed that many of the proteins detected were related to glucose metabolic pathways. In particular, five glucose metabolism-related enzymes were identified to be upregulated in plasma of newborns in the sHIE+ group, compared to the sHIE− group. A further 5 glucose metabolism-related enzymes were upregulated in the sHIE+ group and not the sHIE− group, in comparison to mild HIE. These data suggest that there are no major differences—apart from a cluster of glucose-related proteins—between the plasma profiles of the moderate-severe HIE babies, when separating those with favourable and those with unfavourable outcomes.

4.1. Proteomic Study in HIE Newborns

To date there has been only one small published study of blood samples from newborns with HIE (n = 4). Using plasma samples taken prior to TH and comparing them to the healthy control newborns, they showed that haptoglobin and S100A8 were upregulated in HIE patients [28]. Interestingly, S100A8 and S100A9 proteins were also detected within our study, confirming that the S100A8/A9 complex has a role in HIE, and has been suggested to be involved in the amplification of neuroinflammation [29], and cerebral ischemia-reperfusion injury [30,31]. Importantly, one major difference between the two studies was the timing of blood collection. Zhu and colleagues collected the blood samples before TH, whilst in this study, all our TH-treated HIE blood samples were collected after the initiation of TH. We speculate that the additional protein changes observed in this study, particularly the protein changes within the glucose metabolism, would most likely be influenced by the progression of the pathophysiology and/or TH treatment.

4.2. Glucose Metabolism

Within this proteomic study, the expression of proteins associated with glucose metabolism pathways was consistently upregulated. Although this is the first time a significant change in proteins related to the glucose metabolism pathway has been identified in babies with HIE, it is not surprising, since glucose along with oxygen are key substrates for normal brain function. Also, several studies have shown that initial dysglycemia has been detected in infants with neonatal encephalopathy. A few studies have suggested that hyperglycemia associated with HIE may affect brain microstructure and seizures [32,33,34,35]. It is also recognised that hypoglycemia is associated with neonatal brain injury [32,33,36]. Further research in this area is required to fully understand the role of dysglycemia in HIE.
In situations associated with deprivation of glucose and/or oxygen, 6-phosphogluconate dehydrogenase and transaldolase, which are involved in the pentose phosphate pathway (PPP) are upregulated enzymes can undergo ‘anaerobic’ glucose metabolism to generate the largest amount of NADPH in mammalian cells for ATP production [37].
Also, within the glucose/glycogen metabolism pathways, several enzymes including fructose bisphosphate aldolase, triosephosphate isomerase, GAPDH, and phosphoglycerate kinase 1 (PGK1), phosphoglycerate mutase, α-enolase and pyruvate kinase were upregulated. In particularly, GAPDH, PGK1 and pyruvate kinase, which are involved in the production of NADPH or ATP have recently been suggested to have many additional cellular functions apart from the simple glycolysis role such as regulation of gene expression, cell cycle progression and proliferation, apoptosis, T-cell activation and ion channel opening [38,39,40].

4.3. Unsuitability of Cord Blood from Normal Pregnancies as Control for This Study

Cord blood resulting from normal pregnancies has been used in various studies as a control group for HIE newborns [12,41,42,43] or as a “time zero” internal control [8,44]. However, as demonstrated in this study, the cord blood from ‘normal’ pregnancies has a distinct protein signature to the HIE group. It is not known whether this difference can be attributed to the difference in pathophysiology or to the source of the blood sample, i.e., umbilical cord. However, cord blood does contain a mixture of stem and progenitor cells [45], which is of sufficient quality to be used as a therapeutic agent [46]. Therefore, it would not be surprising that there are unique differences between umbilical cord blood and peripheral blood. Furthermore, we have also shown using next-generation sequencing that the microRNA expression was also significantly different in the HIE newborn group [47]. Therefore, this further highlights the lack of suitability of cord blood to study HIE when compared with peripherally obtained blood. Solutions to this issue would be to use peripheral blood only from both controls and neonatal HIE [48] or if umbilical cord blood was to be used, then it is important to use the umbilical cord blood for all newborns studied [49,50,51,52].

4.4. Certain Protein Biomarkers Were Not Detected in HIE Plasma

In our study, no significant changes in the expression of S100b, NSE, UHC-L1, GFAP and NfL as brain injury protein markers were detected. The reason for the discrepancy is not known, but a potential explanation may be due to the origin of the blood samples and the time point of collection of samples, as mentioned above. For example, Massaro and colleagues showed the greatest elevation in S100b at 0 h, and neuron specific enolase (NSE) at 72 h, in newborns with unfavourable outcome [11]. Also, Douglas-Escobar and colleagues showed increased ubiquitin C-terminal hydrolase L1 (UCH-L1) in serum from the umbilical cord artery at 0–6 h, compared to healthy cord control [12]. Chalak and colleagues showed a significant increase in glial fibrillary acidic protein (GFAP), interleukin (IL)-6 and IL-8 between moderate to severe HIE vs. mild HIE at 6–24 h, during the time of TH, similar to our study [8]. Another potential explanation may be related to the analytic technique, as they used ELISA to detect the protein changes, and there is a discrepancy in the ability to detect proteins between ELISA and proteomic mass spectrometry [53].

4.5. Suitability of Certain Endogenous Control Proteins

Interestingly, changes in glyceraldehyde-3-phosphate dehydrogenase (GAPDH) and β-actin expression were identified in this study. These proteins are often used as an internal loading control for western blot analysis. However, their suitability for this use has been recently questioned by other researchers [54]. This is not surprising since similar issues have been identified in other proteomic studies in the changes detected for GAPDH, that are affected by many biological conditions [55]. For example, apart from being involved in energy metabolism, GAPDH displays immunomodulatory roles by suppressing stimulated macrophages [56]. Also, GAPDH has been shown to interact with glutamatergic α-amino-3-hydroxy-5-methyl-4-isoxazolepropionic acid (AMPA) receptors for cortical neurodevelopment, which is still ongoing in newborns [57]. Moreover, β-actin is involved in biological processes. For example, intact beta-actin (~42 KDa) can be converted to cleaved β-actin (32 KDa or 27 KDa) following a very brief focal cerebral ischemia, indicating DNA fragmentation [58]. Moreover, hypothermia can preserve the expression of β-actin mRNA after 10 min of ischemic brain injury in transient bilateral carotid artery occlusion in gerbils, whereas the injury without hypothermia can cause a decrease in β-actin [59]. Therefore, our work suggests that GAPDH and β-actin are not suitable proteins to be used for endogenous controls when studying HIE.

5. Limitations and Strengths

As a cross sectional proteomic discovery study, a comparison was made between plasma from four groups of selected newborns; namely ncord, mHIE, sHIE+ and sHIE−. As such, this was not a cohort study. After demonstrating the lack of suitability of the ncord group as controls, comparisons were made between the mHIE group and the sHIE groups. A study such as ours cannot completely disentangle the impact of the severity of HIE from the effect of TH, on the proteomic signatures. Furthermore, because severe HIE occurs in combination with the effects of systemic hypoxia-ischemia, some of the proteomic signatures may not only be related to hypoxia-ischemia of the brain but also to the peripheral tissues. This is because many of the up-regulated enzymes detected are found in all cell types in the body, such as the liver and muscle, so are not specific to the brain. For example, fructose-1,6-(bis)phosphate aldolase A is predominantly located in the muscle and red blood cells and fructose-1,6-(bis)phosphate aldolase B is predominantly located in liver, kidney and small intestine [60]. However, the fructose bisphosphate aldolase C isoform signature, expressed specifically in the brain and neuronal tissue (Table 8), suggesting that brain tissue proteins are also detected [60].
Another limitation of the study is that as sampling could only take place after sensitively obtaining informed consent in this rather unforeseeable clinical condition, a pragmatic approach had to be taken to the timing of blood sampling. This is important given the three pathological phases of HIE, namely; latent phase from minutes to hours; secondary phase from 6 h-3 days, and tertiary phase from weeks to years [61,62]. As the mean (+/−SEM) age of blood sampling was 24 h (+/−21.3) for sHIE−, 18.5 h (+/−11.5) for sHIE+, and 18.7 (+/−7.5) for mHIE groups (Table 2), potentially the range of timing of blood sampling may cover the latent or secondary phase, thus contributing to the results observed.
The strengths of this study are: firstly, the untargeted detection and analysis of hundreds of proteins simultaneously from multiple patients in a single experiment, using TMT10plexTM mass spectrometry, reduces the potential variation between newborn samples; second, the unsupervised analysis of data resulted in the generation of a specific group of proteins, to avoid any bias in protein targets.

6. Conclusions

In summary, this is the first proteomic study to analyse plasma samples from newborns with moderate-severe HIE treated with TH. We showed that cord blood from normal pregnancies is an inappropriate control when compared to peripheral blood from newborns with HIE. Also, we provided compelling evidence indicating changes in pathways of glucose metabolism in newborns treated with TH. These findings increase our understanding of why some newborns with moderate-severe HIE treated with TH have favourable outcome, so could give rise to using other therapies in addition to TH, to further improve outcomes for these babies.

Supplementary Materials

The following are available online at https://www.mdpi.com/article/10.3390/biom13101471/s1, Supplementary file: Original Western Bolt Figures.

Author Contributions

Conceptualization, P.K.Y. and D.K.S.; methodology, P.K.Y., I.P. and D.K.S.; software, M.B. and I.P.; validation, P.K.Y. and M.B.; formal analysis, P.K.Y., M.B., I.P. and D.K.S.; investigation, P.K.Y. and D.K.S.; resources, I.P., P.K.Y. and D.K.S.; data curation, I.P., V.P. and D.K.S.; writing—original draft preparation, P.K.Y. and D.K.S.; writing—review and editing, P.K.Y., M.B., V.P., I.P., A.T.M.-T. and D.K.S.; project administration, P.K.Y. and D.K.S.; funding acquisition, P.K.Y. and D.K.S. All authors have read and agreed to the published version of the manuscript.

Funding

This study was funded by the National Institute for Health Research (NIHR) Brain Injury Healthcare Technology Co-operative and Barts Charity.

Institutional Review Board Statement

Recruitment of newborns was carried out at four centers in the United Kingdom (The Royal London Hospital, Homerton University Hospital, University Hospital Southampton, and Norfolk and Norwich University Hospital) during the period of January 2014 to January 2016, with Research Ethics Committee approval (Bromley REC ref: 13/LO/17380), as part of the Brain Injury Biomarkers in NewbornS (BIBiNS) study.

Informed Consent Statement

Informed consent was obtained from all subjects involved in the study.

Data Availability Statement

Data supporting reported results can be made available by writing to the corresponding author [email protected].

Acknowledgments

The authors would like to thank the staff and parents that were involved in the study. Also, we are grateful to Nicola Openshaw for the collection of non-HIE cord blood.

Conflicts of Interest

Proteome Sciences employees receive revenues from manufacture and sale of TMT reagents. The other authors declare no conflict of interest. The funders had no role in the design of the study; in the collection, analyses, or interpretation of data; in the writing of the manuscript; or in the decision to publish the results.

References

  1. Badawi, N.; Kurinczuk, J.J.; Keogh, J.M.; Alessandri, L.M.; O’Sullivan, F.; Burton, P.R.; Pemberton, P.J.; Stanley, F.J. Intrapartum risk factors for newborn encephalopathy: The Western Australian case-control study. BMJ 1998, 317, 1554–1558. [Google Scholar] [CrossRef]
  2. Edwards, A.D.; Brocklehurst, P.; Gunn, A.J.; Halliday, H.; Juszczak, E.; Levene, M.; Strohm, B.; Thoresen, M.; Whitelaw, A.; Azzopardi, D. Neurological outcomes at 18 months of age after moderate hypothermia for perinatal hypoxic ischaemic encephalopathy: Synthesis and meta-analysis of trial data. BMJ 2010, 340, c363. [Google Scholar] [CrossRef]
  3. Chiesa, C.; Pellegrini, G.; Panero, A.; De Luca, T.; Assumma, M.; Signore, F.; Pacifico, L. Umbilical cord interleukin-6 levels are elevated in term neonates with perinatal asphyxia. Eur. J. Clin. Investig. 2003, 33, 352–358. [Google Scholar] [CrossRef]
  4. Gazzolo, D.; Frigiola, A.; Bashir, M.; Iskander, I.; Mufeed, H.; Aboulgar, H.; Venturini, P.; Marras, M.; Serra, G.; Frulio, R.; et al. Diagnostic accuracy of S100B urinary testing at birth in full-term asphyxiated newborns to predict neonatal death. PLoS ONE 2009, 4, e4298. [Google Scholar] [CrossRef]
  5. Lv, H.; Wang, Q.; Wu, S.; Yang, L.; Ren, P.; Yang, Y.; Gao, J.; Li, L. Neonatal hypoxic ischemic encephalopathy-related biomarkers in serum and cerebrospinal fluid. Clin. Chim. Acta 2015, 450, 282–297. [Google Scholar] [CrossRef]
  6. O’Sullivan, M.P.; Looney, A.M.; Moloney, G.M.; Finder, M.; Hallberg, B.; Clarke, G.; Boylan, G.B.; Murray, D.M. Validation of Altered Umbilical Cord Blood MicroRNA Expression in Neonatal Hypoxic-Ischemic Encephalopathy. JAMA Neurol. 2019, 76, 333–341. [Google Scholar] [CrossRef]
  7. Celtik, C.; Acunas, B.; Oner, N.; Pala, O. Neuron-specific enolase as a marker of the severity and outcome of hypoxic ischemic encephalopathy. Brain Dev. 2004, 26, 398–402. [Google Scholar] [CrossRef]
  8. Chalak, L.F.; Sanchez, P.J.; Adams-Huet, B.; Laptook, A.R.; Heyne, R.J.; Rosenfeld, C.R. Biomarkers for severity of neonatal hypoxic-ischemic encephalopathy and outcomes in newborns receiving hypothermia therapy. J. Pediatr. 2014, 164, 468–474.e461. [Google Scholar] [CrossRef]
  9. Qian, J.; Zhou, D.; Wang, Y.W. Umbilical artery blood S100beta protein: A tool for the early identification of neonatal hypoxic-ischemic encephalopathy. Eur. J. Pediatr. 2009, 168, 71–77. [Google Scholar] [CrossRef]
  10. Ceccon, M.E. Interleukins in hypoxic-ischemic encephalopathy. J. Pediatr. 2003, 79, 280–281. [Google Scholar] [CrossRef]
  11. Massaro, A.N.; Wu, Y.W.; Bammler, T.K.; Comstock, B.; Mathur, A.; McKinstry, R.C.; Chang, T.; Mayock, D.E.; Mulkey, S.B.; Van Meurs, K.; et al. Plasma Biomarkers of Brain Injury in Neonatal Hypoxic-Ischemic Encephalopathy. J. Pediatr. 2018, 194, 67–75.e61. [Google Scholar] [CrossRef] [PubMed]
  12. Douglas-Escobar, M.V.; Heaton, S.C.; Bennett, J.; Young, L.J.; Glushakova, O.; Xu, X.; Barbeau, D.Y.; Rossignol, C.; Miller, C.; Old Crow, A.M.; et al. UCH-L1 and GFAP Serum Levels in Neonates with Hypoxic-Ischemic Encephalopathy: A Single Center Pilot Study. Front. Neurol. 2014, 5, 273. [Google Scholar] [CrossRef] [PubMed]
  13. Shah, D.K.; Ponnusamy, V.; Evanson, J.; Kapellou, O.; Ekitzidou, G.; Gupta, N.; Clarke, P.; Michael-Titus, A.T.; Yip, P.K. Raised Plasma Neurofilament Light Protein Levels Are Associated with Abnormal MRI Outcomes in Newborns Undergoing Therapeutic Hypothermia. Front. Neurol. 2018, 9, 86. [Google Scholar] [CrossRef] [PubMed]
  14. Shah, D.K.; Yip, P.K.; Barlas, A.; Tharmapoopathy, P.; Ponnusamy, V.; Michael-Titus, A.T.; Chisholm, P. Raised Plasma Neurofilament Light Protein Levels After Rewarming Are Associated with Adverse Neurodevelopmental Outcomes in Newborns After Therapeutic Hypothermia. Front. Neurol. 2020, 11, 562510. [Google Scholar] [CrossRef]
  15. Tsai, T.T.; Huang, T.H.; Ho, N.Y.; Chen, Y.P.; Chen, C.A.; Chen, C.F. Development of a multiplex and sensitive lateral flow immunoassay for the diagnosis of periprosthetic joint infection. Sci. Rep. 2019, 9, 15679. [Google Scholar] [CrossRef] [PubMed]
  16. Pappireddi, N.; Martin, L.; Wuhr, M. A Review on Quantitative Multiplexed Proteomics. ChemBioChem 2019, 20, 1210–1224. [Google Scholar] [CrossRef] [PubMed]
  17. Bachor, R.; Waliczek, M.; Stefanowicz, P.; Szewczuk, Z. Trends in the Design of New Isobaric Labeling Reagents for Quantitative Proteomics. Molecules 2019, 24, 701. [Google Scholar] [CrossRef]
  18. Azzopardi, D.; Brocklehurst, P.; Edwards, D.; Halliday, H.; Levene, M.; Thoresen, M.; Whitelaw, A.; Group, T.S. The TOBY Study. Whole body hypothermia for the treatment of perinatal asphyxial encephalopathy: A randomised controlled trial. BMC Pediatr. 2008, 8, 17. [Google Scholar] [CrossRef]
  19. Tharmapoopathy, P.; Chisholm, P.; Barlas, A.; Varsami, M.; Gupta, N.; Ekitzidou, G.; Ponnusamy, V.; Kappelou, O.; Evanson, J.; Rosser, G.; et al. In clinical practice, cerebral MRI in newborns is highly predictive of neurodevelopmental outcome after therapeutic hypothermia. Eur. J. Paediatr. Neurol. 2020, 25, 127–133. [Google Scholar] [CrossRef]
  20. Rutherford, M.; Ramenghi, L.A.; Edwards, A.D.; Brocklehurst, P.; Halliday, H.; Levene, M.; Strohm, B.; Thoresen, M.; Whitelaw, A.; Azzopardi, D. Assessment of brain tissue injury after moderate hypothermia in neonates with hypoxic-ischaemic encephalopathy: A nested substudy of a randomised controlled trial. Lancet Neurol. 2010, 9, 39–45. [Google Scholar] [CrossRef]
  21. Ramont, L.; Thoannes, H.; Volondat, A.; Chastang, F.; Millet, M.C.; Maquart, F.X. Effects of hemolysis and storage condition on neuron-specific enolase (NSE) in cerebrospinal fluid and serum: Implications in clinical practice. Clin. Chem. Lab. Med. 2005, 43, 1215–1217. [Google Scholar] [CrossRef] [PubMed]
  22. Russell, C.L.; Heslegrave, A.; Mitra, V.; Zetterberg, H.; Pocock, J.M.; Ward, M.A.; Pike, I. Combined tissue and fluid proteomics with Tandem Mass Tags to identify low-abundance protein biomarkers of disease in peripheral body fluid: An Alzheimer’s Disease case study. Rapid Commun. Mass. Spectrom. 2017, 31, 153–159. [Google Scholar] [CrossRef] [PubMed]
  23. Husson, F.; Josse, J. Handling missing values in multiple factor analysis. Food Qual. Prefer. 2013, 30, 77–85. [Google Scholar] [CrossRef]
  24. Josse, J.; Husson, F. missMDA: A Package for Handling Missing Values in Multivariate Data Analysis. J. Stat. Softw. 2016, 70, 1–31. [Google Scholar] [CrossRef]
  25. Yip, P.K.; Bowes, A.L.; Hall, J.C.E.; Burguillos, M.A.; Ip, T.H.R.; Baskerville, T.; Liu, Z.H.; Mohamed, M.; Getachew, F.; Lindsay, A.D.; et al. Docosahexaenoic acid reduces microglia phagocytic activity via miR-124 and induces neuroprotection in rodent models of spinal cord contusion injury. Human Mol. Genet. 2019, 28, 2427–2448. [Google Scholar] [CrossRef]
  26. Yip, P.K.; Wong, L.F.; Sears, T.A.; Yanez-Munoz, R.J.; McMahon, S.B. Cortical overexpression of neuronal calcium sensor-1 induces functional plasticity in spinal cord following unilateral pyramidal tract injury in rat. PLoS Biol. 2010, 8, e1000399. [Google Scholar] [CrossRef]
  27. Collins, M.A.; An, J.; Peller, D.; Bowser, R. Total protein is an effective loading control for cerebrospinal fluid western blots. J. Neurosci. Methods 2015, 251, 72–82. [Google Scholar] [CrossRef]
  28. Zhu, Y.; Yun, Y.; Jin, M.; Li, G.; Li, H.; Miao, P.; Ding, X.; Feng, X.; Xu, L.; Sun, B. Identification of novel biomarkers for neonatal hypoxic-ischemic encephalopathy using iTRAQ. Ital. J. Pediatr. 2020, 46, 67. [Google Scholar] [CrossRef]
  29. Ehrchen, J.M.; Sunderkotter, C.; Foell, D.; Vogl, T.; Roth, J. The endogenous Toll-like receptor 4 agonist S100A8/S100A9 (calprotectin) as innate amplifier of infection, autoimmunity, and cancer. J. Leukoc. Biol. 2009, 86, 557–566. [Google Scholar] [CrossRef]
  30. Li, Y.; Chen, B.; Yang, X.; Zhang, C.; Jiao, Y.; Li, P.; Liu, Y.; Li, Z.; Qiao, B.; Bond Lau, W.; et al. S100a8/a9 Signaling Causes Mitochondrial Dysfunction and Cardiomyocyte Death in Response to Ischemic/Reperfusion Injury. Circulation 2019, 140, 751–764. [Google Scholar] [CrossRef]
  31. Sun, P.; Li, Q.; Zhang, Q.; Xu, L.; Han, J.Y. Upregulated expression of S100A8 in mice brain after focal cerebral ischemia reperfusion. World J. Emerg. Med. 2013, 4, 210–214. [Google Scholar] [CrossRef] [PubMed]
  32. Guellec, I.; Ancel, P.Y.; Beck, J.; Loron, G.; Chevallier, M.; Pierrat, V.; Kayem, G.; Vilotitch, A.; Baud, O.; Ego, A.; et al. Glycemia and Neonatal Encephalopathy: Outcomes in the LyTONEPAL (Long-Term Outcome of Neonatal Hypoxic EncePhALopathy in the Era of Neuroprotective Treatment With Hypothermia) Cohort. J. Pediatr. 2023, 257, 113350. [Google Scholar] [CrossRef] [PubMed]
  33. Kalogeropoulou, M.S.; Thomson, L.; Beardsall, K. Continuous glucose monitoring during therapeutic hypothermia for hypoxic ischaemic encephalopathy: A feasibility study. Arch. Dis. Childhood. Fetal Neonatal Ed. 2023, 108, 309–315. [Google Scholar] [CrossRef] [PubMed]
  34. Pinchefsky, E.F.; Hahn, C.D.; Kamino, D.; Chau, V.; Brant, R.; Moore, A.M.; Tam, E.W.Y. Hyperglycemia and Glucose Variability Are Associated with Worse Brain Function and Seizures in Neonatal Encephalopathy: A Prospective Cohort Study. J. Pediatr. 2019, 209, 23–32. [Google Scholar] [CrossRef]
  35. Tam, E.W.Y.; Kamino, D.; Shatil, A.S.; Chau, V.; Moore, A.M.; Brant, R.; Widjaja, E. Hyperglycemia associated with acute brain injury in neonatal encephalopathy. Neuroimage Clin. 2021, 32, 102835. [Google Scholar] [CrossRef]
  36. Salhab, W.A.; Wyckoff, M.H.; Laptook, A.R.; Perlman, J.M. Initial hypoglycemia and neonatal brain injury in term infants with severe fetal acidemia. Pediatrics 2004, 114, 361–366. [Google Scholar] [CrossRef]
  37. Kauffman, F.C. The quantitative histochemistry of enzymes of the pentose phosphate pathway in the central nervous system of the rat. J. Neurochem. 1972, 19, 1–9. [Google Scholar] [CrossRef]
  38. Lu, Z.; Hunter, T. Metabolic Kinases Moonlighting as Protein Kinases. Trends Biochem. Sci. 2018, 43, 301–310. [Google Scholar] [CrossRef]
  39. Tristan, C.; Shahani, N.; Sedlak, T.W.; Sawa, A. The diverse functions of GAPDH: Views from different subcellular compartments. Cell Signal. 2011, 23, 317–323. [Google Scholar] [CrossRef]
  40. Chen, D.; Wei, L.; Liu, Z.R.; Yang, J.J.; Gu, X.; Wei, Z.Z.; Liu, L.P.; Yu, S.P. Pyruvate Kinase M2 Increases Angiogenesis, Neurogenesis, and Functional Recovery Mediated by Upregulation of STAT3 and Focal Adhesion Kinase Activities After Ischemic Stroke in Adult Mice. Neurotherapeutics 2018, 15, 770–784. [Google Scholar] [CrossRef]
  41. Ennen, C.S.; Huisman, T.A.; Savage, W.J.; Northington, F.J.; Jennings, J.M.; Everett, A.D.; Graham, E.M. Glial fibrillary acidic protein as a biomarker for neonatal hypoxic-ischemic encephalopathy treated with whole-body cooling. Am. J. Obstet. Gynecol. 2011, 205, 251.e1–251.e7. [Google Scholar] [CrossRef] [PubMed]
  42. Imam, S.S.; Gad, G.I.; Atef, S.H.; Shawky, M.A. Cord blood brain derived neurotrophic factor: Diagnostic and prognostic marker in fullterm newborns with perinatal asphyxia. Pak. J. Biol. Sci. 2009, 12, 1498–1504. [Google Scholar] [CrossRef] [PubMed]
  43. Nagdyman, N.; Komen, W.; Ko, H.K.; Muller, C.; Obladen, M. Early biochemical indicators of hypoxic-ischemic encephalopathy after birth asphyxia. Pediatr. Res. 2001, 49, 502–506. [Google Scholar] [CrossRef] [PubMed]
  44. Takahashi, K.; Hasegawa, S.; Maeba, S.; Fukunaga, S.; Motoyama, M.; Hamano, H.; Ichiyama, T. Serum tau protein level serves as a predictive factor for neurological prognosis in neonatal asphyxia. Brain Dev. 2014, 36, 670–675. [Google Scholar] [CrossRef]
  45. Weiss, M.L.; Troyer, D.L. Stem cells in the umbilical cord. Stem Cell Rev. 2006, 2, 155–162. [Google Scholar] [CrossRef]
  46. Malhotra, A.; Novak, I.; Miller, S.L.; Jenkin, G. Autologous transplantation of umbilical cord blood-derived cells in extreme preterm infants: Protocol for a safety and feasibility study. BMJ Open 2020, 10, e036065. [Google Scholar] [CrossRef]
  47. Ponnusamy, V.; Ip, R.T.H.; Mohamed, M.; Clarke, P.; Wozniak, E.; Mein, C.; Schwendimann, L.; Barlas, A.; Chisholm, P.; Chakkarapani, E.; et al. Neuronal let-7b-5p acts through the Hippo-YAP pathway in neonatal encephalopathy. Commun. Biol. 2021, 4, 1143. [Google Scholar] [CrossRef]
  48. Douglas-Escobar, M.; Yang, C.; Bennett, J.; Shuster, J.; Theriaque, D.; Leibovici, A.; Kays, D.; Zheng, T.; Rossignol, C.; Shaw, G.; et al. A pilot study of novel biomarkers in neonates with hypoxic-ischemic encephalopathy. Pediatr. Res. 2010, 68, 531–536. [Google Scholar] [CrossRef]
  49. Looney, A.M.; Walsh, B.H.; Moloney, G.; Grenham, S.; Fagan, A.; O’Keeffe, G.W.; Clarke, G.; Cryan, J.F.; Dinan, T.G.; Boylan, G.B.; et al. Downregulation of Umbilical Cord Blood Levels of miR-374a in Neonatal Hypoxic Ischemic Encephalopathy. J. Pediatr. 2015, 167, 269–273.e2. [Google Scholar] [CrossRef]
  50. Van Anh, T.N.; Hao, T.K.; Chi, N.T.D.; Son, N.H. Predictions of Hypoxic-Ischemic Encephalopathy by Umbilical Cord Blood Lactate in Newborns with Birth Asphyxia. Open Access Maced. J. Med. Sci. 2019, 7, 3564–3567. [Google Scholar] [CrossRef]
  51. Walsh, B.H.; Broadhurst, D.I.; Mandal, R.; Wishart, D.S.; Boylan, G.B.; Kenny, L.C.; Murray, D.M. The metabolomic profile of umbilical cord blood in neonatal hypoxic ischaemic encephalopathy. PLoS ONE 2012, 7, e50520. [Google Scholar] [CrossRef]
  52. Zaigham, M.; Lundberg, F.; Olofsson, P. Protein S100B in umbilical cord blood as a potential biomarker of hypoxic-ischemic encephalopathy in asphyxiated newborns. Early Hum. Dev. 2017, 112, 48–53. [Google Scholar] [CrossRef]
  53. Buhimschi, I.A.; Buhimschi, C.S.; Weiner, C.P.; Kimura, T.; Hamar, B.D.; Sfakianaki, A.K.; Norwitz, E.R.; Funai, E.F.; Ratner, E. Proteomic but not enzyme-linked immunosorbent assay technology detects amniotic fluid monomeric calgranulins from their complexed calprotectin form. Clin. Diagn. Lab. Immunol. 2005, 12, 837–844. [Google Scholar] [CrossRef]
  54. Moritz, C.P. Tubulin or Not Tubulin: Heading Toward Total Protein Staining as Loading Control in Western Blots. Proteomics 2017, 17, 1600189. [Google Scholar] [CrossRef]
  55. Petrak, J.; Ivanek, R.; Toman, O.; Cmejla, R.; Cmejlova, J.; Vyoral, D.; Zivny, J.; Vulpe, C.D. Deja vu in proteomics. A hit parade of repeatedly identified differentially expressed proteins. Proteomics 2008, 8, 1744–1749. [Google Scholar] [CrossRef]
  56. Nakano, T.; Goto, S.; Takaoka, Y.; Tseng, H.P.; Fujimura, T.; Kawamoto, S.; Ono, K.; Chen, C.L. A novel moonlight function of glyceraldehyde-3-phosphate dehydrogenase (GAPDH) for immunomodulation. Biofactors 2018, 44, 597–608. [Google Scholar] [CrossRef]
  57. Lee, F.H.; Su, P.; Xie, Y.F.; Wang, K.E.; Wan, Q.; Liu, F. Disrupting GluA2-GAPDH Interaction Affects Axon and Dendrite Development. Sci. Rep. 2016, 6, 30458. [Google Scholar] [CrossRef]
  58. Ye, Z.; Ander, B.P.; Sharp, F.R.; Zhan, X. Cleaved beta-Actin May Contribute to DNA Fragmentation Following Very Brief Focal Cerebral Ischemia. J. Neuropathol. Exp. Neurol. 2018, 77, 260–265. [Google Scholar] [CrossRef]
  59. Wu, X.; Evans, A.T.; Kumar, K. Hypothermia preserves expression of beta-actin mRNA in ischemic brain. Neuroreport 1995, 7, 302–304. [Google Scholar] [CrossRef]
  60. Arakaki, T.L.; Pezza, J.A.; Cronin, M.A.; Hopkins, C.E.; Zimmer, D.B.; Tolan, D.R.; Allen, K.N. Structure of human brain fructose 1,6-(bis)phosphate aldolase: Linking isozyme structure with function. Protein Sci. 2004, 13, 3077–3084. [Google Scholar] [CrossRef]
  61. Hassell, K.J.; Ezzati, M.; Alonso-Alconada, D.; Hausenloy, D.J.; Robertson, N.J. New horizons for newborn brain protection: Enhancing endogenous neuroprotection. Arch. Dis. Childhood. Fetal Neonatal Ed. 2015, 100, F541–F552. [Google Scholar] [CrossRef]
  62. Peeples, E.S.; Genaro-Mattos, T.C. Ferroptosis: A Promising Therapeutic Target for Neonatal Hypoxic-Ischemic Brain Injury. Int. J. Mol. Sci. 2022, 23, 7420. [Google Scholar] [CrossRef]
Figure 1. Plasma sample selection and preparation. (A) Plasma samples contained various levels of haemolysis (black arrow indicated high haemolysis levels). (B) Qualitative analysis of plasma sample haemolysis enables a majority of plasma samples of grade 3 or below to be used. (C,D) Western blotting stained with Coomassie blue was used to verify albumin and IgG presence in plasma samples ((C), blue arrow) and removal using PierceTM Top 2 Abundant protein depletion spin columns ((D), green arrow). One sample (HM5) contained significant amounts of albumin and IgG after purification, so was not included for further analysis ((D), red arrow). Ncord, blood from the umbilical cord of non-HIE newborns; mHIE, peripheral blood from newborns with mild HIE and not treated with TH; sHIE+, peripheral blood from moderate-severe HIE newborns treated with TH and with a favourable outcome; sHIE−, moderate-severe HIE newborns treated with TH and with an unfavourable outcome.
Biomolecules 13 01471 g001
Figure 2. Differences in ncord plasma compared to newborn babies with HIE. (A) PCA score plot in first two principal components of protein matrix defined by regulated proteins with p-value ≤ α = 0.05. (B) Heatmap of the same matrix. Ncord, blood from the umbilical cord of non-HIE newborns; mHIE, peripheral blood from newborns with mild HIE and not treated with TH; sHIE+, peripheral blood from moderate-severe HIE newborns treated with TH and with a favourable outcome; sHIE−, moderate-severe HIE newborns treated with TH and with an unfavourable outcome.
Biomolecules 13 01471 g002
Figure 3. Comparison between plasma proteins of moderate-severe HIE and mHIE. PCA plot (A), loading plot (B) and heatmap plot (C) after normalization. (A) PCA plot shows mHIE (black cluster) to be fairly separate from the TH-treated HIE with favourable outcome (sHIE+, red cluster), but TH-treated HIE with unfavourable outcome (sHIE−, blue cluster) overlapped with the mHIE and sHIE+ clusters. (B) Loading plot confirmed that the sHIE+ was opposite to the mHIE and that sHIE− was tangent to mHIE and sHIE−. (C) Heatmap plot confirmed that sHIE− is fairly separated, with mHIE scattered throughout both cohorts of sHIE. Ncord, blood from the umbilical cord of non-HIE newborns; mHIE, peripheral blood from newborns with mild HIE and not treated with TH; sHIE+, peripheral blood from moderate-severe HIE newborns treated with TH and with a favourable outcome; sHIE−, moderate-severe HIE newborns treated with TH and with an unfavourable outcome.
Biomolecules 13 01471 g003
Figure 4. Volcano plot showing regulated features comparing between groups, with estimated log2 fold changes (x-axis) versus the log10 p values (y-axis) for each protein. (A) Volcano plot showing significantly regulated features comparing mHIE and sHIE+. (B) Volcano plot showing significantly regulated features comparing mHIE and sHIE−. (C) Volcano plot showing significantly regulated features comparing sHIE+ and sHIE−. Red and green filled circles indicate proteins that have a significant and non-significant change, respectively. Ncord, blood from the umbilical cord of non-HIE newborns; mHIE, peripheral blood from newborns with mild HIE and not treated with TH; sHIE+, peripheral blood from moderate-severe HIE newborns treated with TH and with a favorable outcome; sHIE−, moderate-severe HIE newborns treated with TH and with an unfavourable outcome.
Biomolecules 13 01471 g004
Figure 5. Western blot validation of proteomic data. (AE) Western bot analysis of randomly selected proteins between mHIE, and sHIE+ or sHIE−. (A) Ponceau S staining of 2 independent blots with each lane randomly allocated to a patient’s plama sample, (B) glyceraldehyde-3-phosphate dehydrogenase (GAPDH), (C) lactotransferrin, (D) β-actin, and (E) phosphoglycerate kinase 1. N = 8–11 per group. mHIE, peripheral blood from newborns with mild HIE and are not treated with TH; sHIE+, peripheral blood from moderate-severe HIE newborns treated with TH and have a favourable outcome; sHIE−, moderate-severe HIE newborns treated with TH and have an unfavourable outcome. * = p < 0.05. Original Western Bolt Figures can be found in supplementary.
Biomolecules 13 01471 g005
Figure 6. Enrichment Gene Ontology Cell Component and functional analysis volcano plots. (A,B) Enrichment of Gene Ontology Cell Component (A) and functional analysis (B) comparing protein levels from sHIE+ with mHIE. (C,D) Enrichment of Gene Ontology Cell Component (C) and functional analysis (D) comparing protein levels from sHIE+ with sHIE−. Data points are showing median log2FC against significance of enrichment of protein (-log10adj p-value), highlighting the pathways found to be significantly over-represented (shifted to the right side of zero) and under-represented (shifted to the left side of zero). Red filled circles represent significant pathways hits (Adjusted p value < 0.05). Grey circles were not significant.
Biomolecules 13 01471 g006
Figure 7. Functional annotation charts and interactomic analysis. (A) Clustering of regulated proteins based on the protein matrix using DAVID. Selection criteria: # of summarised peptides ≥ 3. Only two clusters with the best enrichment score out of 35 are shown. (B) Regulated proteins based on the protein matrix using DAVID. Selection criteria: # of summarised peptides ≥ 3, sorted to number of protein counts per keyword. Only the 15 hits of 202 with the most number of related proteins are shown. (C) Network analysis of proteins differentiated expressed in sHIE group using STRING 10 software. Ncord, blood from the umbilical cord of non-HIE newborns; mHIE, peripheral blood from newborns with mild HIE and not treated with TH; sHIE+, peripheral blood from moderate-severe HIE newborns treated with TH and with a favourable outcome; sHIE−, moderate-severe HIE newborns treated with TH and with an unfavourable outcome.
Biomolecules 13 01471 g007
Figure 8. Glucose metabolism pathway affected by the perinatal asphyxia and TH treatment. Glycolysis/gluconeogenesis pathway (green), pentose phosphate pathway (pink) and citric acid cycle (blue). Enzymes (red text) are all proteins significantly up-regulated in sHIE+ newborns compared to non-TH treated controls. Enzymes (blue starred) are upregulated in sHIE+ compared sHIE− group. mHIE, peripheral blood from newborns with mild HIE and not treated with TH; sHIE+, peripheral blood from moderate-severe HIE newborns treated with TH and with a favourable outcome; sHIE−, moderate-severe HIE newborns treated with TH and with an unfavourable outcome.
Biomolecules 13 01471 g008
Table 1. Primary antibodies used for western blot validation. GAPDH, glyceraldehyde-3-phosphate dehydrogenase, PGK1, phosphoglycerate kinase 1; HRP, Horseradish peroxidase.
AntibodySpeciesDilutionCat. NoCompany
Primary antibodies
β-ActinRabbit1:2504970New England Biolabs, Ipswich, MA, USA
GAPDHRabbit1:5005174New England Biolabs, Ipswich, MA, USA
LactotransferrinRabbit1:500ab15811Abcam, Cambridge, UK
PGK1Rabbit1:100ab38007Abcam, Cambridge, UK
Secondary antibodies
Mouse immunoglobulins/HRPGoat1:10,000P0447Dako, Cheshire, UK
Rabbit immunoglobulins/HRPGoat1:5000P0448Dako, Cheshire, UK
Table 2. Demography of control newborn babies used in the study, including clinical characteristics of the four groups of babies. Group 1 is blood from the umbilical cord of non-HIE newborns (ncord). Group 2 is peripheral blood from newborns with mild HIE and are not treated with TH (mHIE). Group 3 is moderate-severe HIE babies treated with TH and have a favourable outcome (sHIE+). Group 4 is moderate-severe HIE babies treated with TH and have an unfavourable outcome (sHIE−). Values are expressed as medians (interquartile range), mean ± standard deviation and. %, percentage of the categorical variable. A sentinel event was defined as cord prolapse, cord rupture, uterine rupture, placental abruption or shoulder dystocia as diagnosed by the obstetric team providing clinical care.
ncordmHIEsHIE+sHIE−p
n12101210
Male84870.47
Birth weight (g)3340 (2790, 3622)3430 (2886, 3905)3770 (3172, 4274)3685 (3472, 3813)0.39
Apgar at 10 min10 (10, 10)9 (9, 10)4 (3, 6)4 (3, 5)<0.001
Post menstrual age (week)39.1
(38, 39.2)
40
(39, 40.8)
40.6
(39.5, 41.9)
40.5
(40, 41.1)
0.08
Sentinel event01420.14
Chest compressions01550.016
Cord or pH in first hournot done6.97 (6.93, 6.99)6.93 (6.87, 6.97)6.88 (6.78, 6.98)0.33
Cord or base excess in first hournot done−12.8 (16.3, −11.4)−19.1 (−22.8, −16)−19.5 (−22.0, −18.2)0.014
HIE grade (0,1,2,3)12,0,0,01,9,0,00,0,8,40,0,5,5<0.001
Meconium aspiration (%)0 (0)1 (10)0 (0)3 (30)0.05
Positive blood cultures (%)0 (0)0 (0)0 (0)1 (10)0.32
Inotropic support (%)0 (0)0 (0)3 (25)8 (80)<0.001
Seizuures (%)0 (0)0 (0)7 (58)9 (90)<0.001
Age at MRI
(d)
not donenot done8 (7, 10)8 (8, 9)0.71
Age at blood sample (hr)0.518.7 ± 7.518.5 ± 11.524.0 ± 21.3
Table 3. List of most reliable plasma proteins between mild HIE and ncord of newborns. Ncord, blood from the umbilical cord of non-HIE newborns; mHIE, peripheral blood from newborns with mild HIE and are not treated with TH.
Protein IDGene NameProtein NameNumber of PeptidesMild HIE/ncord
Log2FCp-Value
P06276CHLECholinesterase30.762.44 × 10−2
P26927HGFLHepatocyte growth factor-like protein140.711.26 × 10−3
P78417-2GSTO1Isoform 2 of Glutathione S-transferase omega-131.584.60 × 10−3
P37837TALDOTransaldolase41.875.50 × 10−3
Table 4. List of most reliable plasma proteins between sHIE+ and ncord of newborns. Ncord, blood from the umbilical cord of non-HIE newborns; sHIE+, peripheral blood from moderate-severe HIE newborns treated with TH and have a favourable outcome.
Protein IDGene NameProtein NameNumber of PeptidessHIE+/ncord
Log2FCp-Value
P07737PROF1Profilin-144.082.09 × 10−8
P26038MOESMoesin33.678.29 × 10−13
P62328TYB4Thymosin beta-433.312.05 × 10−6
Q5T123SH3BGRL3SH3 domain-binding glutamic acid-rich-like protein33.292.00 × 10−8
P63104YWHAZ14-3-3 protein zeta/delta43.099.64 × 10−8
P04075ALDOAFructose-bisphosphate aldolase A132.941.21 × 10−8
P00558PGK1Phosphoglycerate kinase 172.833.44 × 10−8
P13796PLS2Plastin-252.739.30 × 10−8
P59665DEFA1Neutrophil defensin 132.631.10 × 10−4
E7EQB2LTFKaliocin-1 (Fragment)42.453.28 × 10−5
P04406GAPDHGlyceraldehyde-3-phosphate dehydrogenase62.421.05 × 10−5
P60709ACTBActin, cytoplasmic 152.401.15 × 10−6
P02763AGP1Alpha-1-acid glycoprotein 1101.528.80 × 10−3
Table 5. List of most reliable plasma proteins between sHIE− and ncord of newborns. Ncord, blood from the umbilical cord of non-HIE newborns; sHIE−, moderate-severe HIE newborns treated with TH and have an unfavourable outcome.
Protein IDGene NameProtein NameNumber of PeptidessHIE−/ncord
Log2FCp-Value
P11142HSPA8Heat shock cognate 71 kDa protein52.419.91 × 10−8
P18065IGFBP2Insulin-like growth factor-binding protein 272.046.71 × 10−6
Table 6. List of most reliable plasma proteins between sHIE+ and mHIE newborns. MHIE, peripheral blood from newborns with mild HIE who are not treated with TH; sHIE+, peripheral blood from moderate-severe HIE newborns treated with TH and have a favourable outcome.
Protein IDGene NameProtein NameNumber of PeptidessHIE+/mHIE
Log2FCp-Value
P01861IGHG4Immunoglobulin heavy constant gamma 42−1.464.87 × 10−3
P00738HPHaptoglobin13−1.444.96 × 10−2
P01779IG_HV318Immunoglobulin heavy variable 3–231−1.151.56 × 10−2
P19652ORM2Alpha−1-acid glycoprotein 211−0.917.75 × 10−5
P01764IG_HV304Immunoglobulin heavy variable 3–232−0.863.32 × 10−2
P22352GPX3Glutathione peroxidase 33−0.765.10 × 10−4
P18428LBPLipopolysaccharide-binding protein5−0.674.62 × 10−2
P02763ORM1Alpha-1-acid glycoprotein 110−0.594.44 × 10−2
P00390-2GSRGlutathione reductase, mitochondrial10.611.79 × 10−2
O95445APOMApolipoprotein M50.612.41 × 10−4
F5H6 × 6GANABNeutral alpha-glucosidase AB20.623.67 × 10−4
Q9HD89RETNResistin10.643.81 × 10−2
Q12907LMAN2Vesicular integral-membrane protein VIP3610.667.15 × 10−4
H7BZJ3PDIA3Protein disulfide-isomerase10.666.45 × 10−3
F5GZK1EXTL2Exostosin-like 210.727.82 × 10−4
G3V1A4CFL1Cofilin-120.734.07 × 10−2
P06858LPLLipoprotein lipase10.759.99 × 10−3
P01130-3LDLRLow-density lipoprotein receptor30.761.52 × 10−2
P18206-2VCLVinculin50.786.69 × 10−4
P00441SOD1Superoxide dismutase [Cu-Zn]20.792.20 × 10−2
P10599TXNThioredoxin10.815.36 × 10−3
P78417-2GSTO1Glutathione S-transferase omega-130.828.83 × 10−3
P26038MSNMoesin30.829.88 × 10−3
P08246ELANENeutrophil elastase10.822.02 × 10−2
P04040CATCatalase100.821.74 × 10−2
P68104EEF1A1Elongation factor 1-alpha 110.839.68 × 10−3
P01040CSTACystatin-A20.853.60 × 10−2
P30043BLVRBFlavin reductase (NADPH)20.851.36 × 10−2
P07900HSP90AA1Heat shock protein HSP 90-alpha10.854.26 × 10−2
Q71U36-2TUBA1ATubulin alpha-1A chain10.863.92 × 10−3
Q5T123SH3BGRL3SH3 domain-binding glutamic acid-rich-like protein 330.871.33 × 10−2
E5RIF1UBE2V2Ubiquitin-conjugating enzyme E2 variant 210.872.58 × 10−2
F5H265UBCPolyubiquitin-C40.878.71 × 10−3
P37837TALDO1Transaldolase40.891.80 × 10−2
P06733ENO1Alpha-enolase40.901.11 × 10−2
P62328TMSB4XThymosin beta-430.904.33 × 10−2
P04075ALDOAFructose-bisphosphate aldolase A130.918.63 × 10−3
P05062ALDOBFructose-bisphosphate aldolase B30.944.88 × 10−2
P14618-2PKMPyruvate kinase PKM10.953.09 × 10−2
P18669PGAM1Phosphoglycerate mutase 110.981.76 × 10−2
P63104YWHAZ14-3-3 protein zeta/delta40.999.96 × 10−3
P09972ALDOCFructose-bisphosphate aldolase C11.011.97 × 10−3
P60709ACTBActin, cytoplasmic 151.072.53 × 10−3
P04406GAPDHGlyceraldehyde-3-phosphate dehydrogenase61.092.69 × 10−3
P06753-2TPM3Tropomyosin alpha-3 chain11.112.36 × 10−2
E7EQB2LTFLactotransferrin41.123.13 × 10−3
P60174-1TPI1Triosephosphate isomerase41.121.01 × 10−2
P00558PGK1Phosphoglycerate kinase 171.179.79 × 10−4
P62937PPIAPeptidyl-prolyl cis-trans isomerase A61.189.19 × 10−4
P09211GSTP1Glutathione S-transferase P11.193.43 × 10−3
R4GN98S100A6Protein S10021.205.15 × 10−4
B4DQJ8PGD6-phosphogluconate dehydrogenase, decarboxylating11.311.55 × 10−3
P06732CKMCreatine kinase M-type91.324.38 × 10−2
P62158CALM1Calmodulin-111.339.83 × 10−4
P07737PFN1Profilin-141.342.45 × 10−3
P11142HSPA8Heat shock cognate 71 kDa protein51.375.16 × 10−5
P07451CA3Carbonic anhydrase 331.384.64 × 10−2
P31146CORO1ACoronin-1A11.513.86 × 10−3
P68431HIST1H3AHistone H3.111.552.06 × 10−2
P61604HSPE110 kDa heat shock protein, mitochondrial21.575.44 × 10−3
P02042HBDHemoglobin subunit delta21.914.93 × 10−4
Table 7. List of most reliable plasma proteins between sHIE− and mHIE newborns.mHIE, peripheral blood from newborns with mild HIE and not treated with TH; sHIE−, moderate-severe HIE newborns treated with TH and with an unfavourable outcome.
Protein IDGene NameProtein NameNumber of PeptidessHIE−/mHIE
Log2FCp-Value
P01861IGHG4Immunoglobulin heavy constant gamma 42−1.653.20 × 10−3
P01860IGHG3Immunoglobulin heavy constant gamma 35−1.051.35 × 10−2
P11226MBL2Mannose-binding protein C4−0.871.97 × 10−2
P24592IGFBP6Insulin-like growth factor-binding protein 62−0.658.67 × 10−3
P02458COL2A1Collagen alpha-1(II) chain2−0.641.24 × 10−2
P35858IGFALSInsulin-like growth factor-binding protein complex acid labile subunit120.621.74 × 10−2
Q02985CFHR3Complement factor H-related protein 310.742.02 × 10−2
P11142HSPA8Heat shock cognate 71 kDa protein50.821.19 × 10−2
P61604HSPE110 kDa heat shock protein, mitochondrial21.214.00 × 10−2
P02042HBDHemoglobin subunit delta21.421.05 × 10−2
Table 8. List of most reliable plasma proteins between sHIE+ and sHIE− newborns. * P62158 is obsolete and it is now P0DP23. sHIE+, peripheral blood from moderate-severe HIE newborns treated with TH and with a favourable outcome; sHIE−, moderate-severe HIE newborns treated with TH and with an unfavourable outcome.
Protein IDGene NameProtein NameNumber of PeptidessHIE+/sHIE−
Log2FCp-Value
P13727PRG2Bone marrow proteoglycan2−0.723.80 × 10−2
P68104EEF1A1Elongation factor 1-alpha 110.673.37 × 10−2
P26038MSNMoesin30.682.82 × 10−2
P09972ALDOCFructose-bisphosphate aldolase C10.702.43 × 10−2
P02730SLC4A1Band 3 anion transport protein30.721.00 × 10−2
P13796LCP1Plastin-250.742.78 × 10−2
P00441SOD1Superoxide dismutase [Cu-Zn]20.743.01 × 10−2
P04075ALDOAFructose-bisphosphate aldolase A130.831.52 × 10−2
P18669PGAM1Phosphoglycerate mutase 110.843.87 × 10−2
P62937PPIAPeptidyl-prolyl cis-trans isomerase A60.861.17 × 10−2
P63104YWHAZ14-3-3 protein zeta/delta40.872.13 × 10−2
G3V1A4CFL1Cofilin-120.921.22 × 10−2
Q5T123SH3BGRL3SH3 domain-binding glutamic acid-rich-like protein 330.928.96 × 10−3
P32119PRDX2Peroxiredoxin-290.923.41 × 10−3
P60709ACTBActin, cytoplasmic 150.937.41 × 10−3
P30740SERPINB1Leukocyte elastase inhibitor10.952.55 × 10−2
P00915CA1Carbonic anhydrase 110.951.01 × 10−2
P09211GSTP1Glutathione S-transferase P10.981.38 × 10−2
P59665DEFA1Neutrophil defensin 130.983.95 × 10−2
P00558PGK1Phosphoglycerate kinase 171.003.81 × 10−3
P07737PFN1Profilin-141.061.39 × 10−2
P02008HBZHemoglobin subunit zeta31.082.00 × 10−2
P30043BLVRBFlavin reductase (NADPH)21.092.30 × 10−3
P62158 *CALM1Calmodulin-111.182.76 × 10−3
E7EQB2LTFLactotransferrin41.221.45 × 10−3
P14618-2PKMPyruvate kinase PKM11.236.53 × 10−3
P31146CORO1ACoronin-1A11.281.23 × 10−2
P04406GAPDHGlyceraldehyde-3-phosphate dehydrogenase61.305.43 × 10−4
R4GN98S100A6Protein S10021.371.18 × 10−4
P68431HIST1H3AHistone H3.111.452.92 × 10−2
P06732CKMCreatine kinase M-type92.112.21 × 10−3
Table 9. List of most reliable plasma proteins related to the glucose metabolism pathway between sHIE+ and the other groups. sHIE+, peripheral blood from moderate-severe HIE newborns treated with TH and with a favourable outcome.
Protein IDGene NameProtein NameNumber of PeptidesLog2FCp-Value
P00390-2GSRGlutathione reductase, mitochondrial10.611.79 × 10−2
P37837TALDO1Transaldolase40.891.80 × 10−2
P06733ENO1Alpha-enolase40.91.11 × 10−2
P04075ALDOAFructose-bisphosphate aldolase A130.918.63 × 10−3
P05062ALDOBFructose-bisphosphate aldolase B30.944.88 × 10−2
P14618-2PKMPyruvate kinase PKM10.953.09 × 10−2
P18669PGAM1Phosphoglycerate mutase 110.981.76 × 10−2
P09972ALDOCFructose-bisphosphate aldolase C11.011.97 × 10−3
P04406 GAPDHGlyceraldehyde-3-phosphate dehydrogenase61.092.69 × 10−3
P60174-1TPI1Triosephosphate isomerase41.121.01 × 10−2
P00558PGK1Phosphoglycerate kinase 171.179.79 × 10−4
B4DQJ8PGD6-phosphogluconate dehydrogenase, decarboxylating11.311.55 × 10−3
Disclaimer/Publisher’s Note: The statements, opinions and data contained in all publications are solely those of the individual author(s) and contributor(s) and not of MDPI and/or the editor(s). MDPI and/or the editor(s) disclaim responsibility for any injury to people or property resulting from any ideas, methods, instructions or products referred to in the content.

