
Significance of Plasma Irisin, Adiponectin, and Retinol Binding Protein-4 Levels as Biomarkers for Obstructive Sleep Apnea Syndrome Severity
 , ,
, ,
Abstract
:1. Introduction
2. Materials and Methods
2.1. Informed Consent
2.2. Study Population
2.3. Exclusion Criteria
2.4. Polysomnography (PSG)
2.5. Sample Collection and Measurements
2.6. Measurement of Plasma Irisin Levels
2.7. Measurements of the Plasma RBP-4 Levels
2.8. Measurement of Plasma Adiponectin Levels
2.9. Statistical Analysis
3. Results
3.1. Comparison of General Characteristics
3.2. Comparisons of Plasma Irisin, RBP-4, and Adiponectin Levels between Groups
3.3. Comparisons of Plasma Irisin, RBP-4, and Adiponectin Levels between Comorbidity in Cases
3.4. Correlation Analysis
3.5. ROC and Regression Analysis
4. Discussion
Author Contributions
Funding
Institutional Review Board Statement
Informed Consent Statement
Data Availability Statement
Conflicts of Interest
References
- Luzzi, V.; Mazur, M.; Guaragna, M.; Di Carlo, G.; Cotticelli, L.; Magliulo, G.; Marasca, B.; Pirro, V.; Di Giorgio, G.; Ndokaj, A.; et al. Correlations of Obstructive Sleep Apnea Syndrome and Daytime Sleepiness with the Risk of Car Accidents in Adult Working Population: A Systematic Review and Meta-Analysis with a Gender-Based Approach. J. Clin. Med. 2022, 11, 3971. [Google Scholar] [CrossRef] [PubMed]
- Hernández, C.; Durán-Cantolla, J.; Lloberes, P.; González, M. Novedades en la epidemiología, la historia natural, el diagnóstico y el tratamiento del síndrome de apneas-hipopneas durante el sueño [Innovations in the epidemiology, natural history, diagnosis and treatment of sleep apnea-hypopnea syndrome]. Arch. Bronconeumol. 2009, 45 (Suppl. S1), 3–10. [Google Scholar] [CrossRef]
- Moreno-Navarrete, J.M.; Ortega, F.; Serrano, M.; Guerra, E.; Pardo, G.; Tinahones, F.; Ricart, W.; Fernández-Real, J.M. Irisin Is Expressed and Produced by Human Muscle and Adipose Tissue in Association with Obesity and Insulin Resistance. J. Clin. Endocrinol. Metab. 2013, 98, E769–E778. [Google Scholar] [CrossRef]
- Li, Y.; Li, X.; Sun, D.; Cai, S. Association of serum irisin concentrations with the presence and severity of obstructive sleep apnea syndrome. J. Clin. Lab. Anal. 2017, 31, e22077. [Google Scholar] [CrossRef] [PubMed]
- Polyzos, S.A.; Kountouras, J.; Anastasilakis, A.D.; Geladari, E.V.; Mantzoros, C.S. Irisin in patients with nonalcoholic fatty liver disease. Metabolism 2014, 63, 207–217. [Google Scholar] [CrossRef] [PubMed]
- Gavi, S.; Qurashi, S.; Melendez, M.M.; Mynarcik, D.C.; McNurlan, M.A.; Gelato, M.C. Plasma retinol-binding protein-4 concentrations are elevated in human subjects with impaired glucose tolerance and type 2 diabetes: Response to Cho et al. Diabetes Care 2007, 30, e7–e8. [Google Scholar] [CrossRef] [PubMed]
- Tschoner, A.; Sturm, W.; Engl, J.; Kaser, S.; Laimer, M.; Laimer, E.; Weiss, H.; Patsch, J.R.; Ebenbichler, C.F. Retinol-binding Protein 4, Visceral Fat, and the Metabolic Syndrome: Effects of Weight Loss. Obesity 2008, 16, 2439–2444. [Google Scholar] [CrossRef] [PubMed]
- Nena, E.; Steiropoulos, P.; Tzouvelekis, A.; Tsara, V.; Hatzizisi, O.; Kyriazis, G.; Froudarakis, M.; Trakada, G.; Papanas, N.; Bouros, D. Reduction of Serum Retinol-Binding Protein-4 Levels in Nondiabetic Obstructive Sleep Apnea Patients under Continuous Positive Airway Pressure Treatment. Respiration 2010, 80, 517–523. [Google Scholar] [CrossRef] [PubMed]
- Makino, S.; Fujiwara, M.; Suzukawa, K.; Handa, H.; Fujie, T.; Ohtaka, Y.; Komatsu, Y.; Aoki, Y.; Maruyama, H.; Terada, Y.; et al. Visceral Obesity is Associated with the Metabolic Syndrome and Elevated Plasma Retinol Binding Protein-4 Level in Obstructive Sleep Apnea Syndrome. Horm. Metab. Res. 2009, 41, 221–226. [Google Scholar] [CrossRef]
- Maeda, K.; Okubo, K.; Shimomura, I.; Funahashi, T.; Matsuzawa, Y.; Matsubara, K. cDNA Cloning and Expression of a Novel Adipose Specific Collagen-like Factor, apM1 (Adipose Most Abundant Gene Transcript 1). Biochem. Biophys. Res. Commun. 1996, 221, 286–289. [Google Scholar] [CrossRef]
- Yamauchi, T.; Kamon, J.; Waki, H.; Terauchi, Y.; Kubota, N.; Hara, K.; Mori, Y.; Ide, T.; Murakami, K.; Tsuboyama-Kasaoka, N.; et al. The fat-derived hormone adiponectin reverses insulin resistance associated with both lipoatrophy and obesity. Nat. Med. 2001, 7, 941–946. [Google Scholar] [CrossRef]
- Matsuda, M.; Shimomura, I.; Sata, M.; Arita, Y.; Nishida, M.; Maeda, N.; Kumada, M.; Okamoto, Y.; Nagaretani, H.; Nishizawa, H.; et al. Role of adiponectin in preventing vascular stenosis. The missing link of adipo-vascular axis. J. Biol. Chem. 2002, 277, 37487–37491. [Google Scholar] [CrossRef] [PubMed]
- Al Mutairi, S.; Mojiminiyi, O.A.; Al Alawi, A.; Al Rammah, T.; Abdella, N. Study of Leptin and Adiponectin as Disease Markers in Subjects with Obstructive Sleep Apnea. Dis. Markers 2014, 2014, 706314. [Google Scholar] [CrossRef]
- Abdel-Fadeil, M.R.; Abedelhaffez, A.S.; Makhlouf, H.A.; Al Qirshi, G.A. Obstructive sleep apnea: Influence of hypertension on adiponectin, inflammatory markers and dyslipidemia. Pathophysiology 2017, 24, 305–315. [Google Scholar] [CrossRef]
- Wolk, R.; Svatikova, A.; Nelson, C.A.; Gami, A.S.; Govender, K.; Winnicki, M.; Somers, V.K. Plasma Levels of Adiponectin, a Novel Adipocyte-Derived Hormone, in Sleep Apnea. Obes. Res. 2005, 13, 186–190. [Google Scholar] [CrossRef]
- Najafi, A.; Mohammadi, I.; Sadeghi, M.; Brühl, A.B.; Sadeghi-Bahmani, D.; Brand, S. Evaluation of Plasma/Serum Adiponectin (an Anti-Inflammatory Factor) Levels in Adult Patients with Obstructive Sleep Apnea Syndrome: A Systematic Review and Meta-Analysis. Life 2022, 12, 738. [Google Scholar] [CrossRef]
- Flores-Cortez, Y.A.; Barragán-Bonilla, M.I.; Mendoza-Bello, J.M.; González-Calixto, C.; Flores-Alfaro, E.; Espinoza-Rojo, M. Interplay of retinol binding protein 4 with obesity and associated chronic alterations (Review). Mol. Med. Rep. 2022, 26, 244. [Google Scholar] [CrossRef]
- Roca-Rivada, A.; Castelao, C.; Senin, L.L.; Landrove, M.O.; Baltar, J.; Crujeiras, A.B.; Seoane, L.M.; Casanueva, F.F.; Pardo, M. FNDC5/irisin is not only a myokine but also an adipokine. PLoS ONE 2013, 8, e60563. [Google Scholar] [CrossRef] [PubMed]
- Boström, P.; Wu, J.; Jedrychowski, M.P.; Korde, A.; Ye, L.; Lo, J.C.; Rasbach, K.A.; Boström, E.A.; Choi, J.H.; Long, J.Z.; et al. A PGC1-α-dependent myokine that drives brown-fat-like development of white fat and thermogenesis. Nature 2012, 481, 463–468. [Google Scholar] [CrossRef] [PubMed]
- Makiel, K.; Suder, A.; Targosz, A.; Maciejczyk, M.; Haim, A. Effect of Exercise Interventions on Irisin and Interleukin-6 Concentrations and Indicators of Carbohydrate Metabolism in Males with Metabolic Syndrome. J. Clin. Med. 2023, 12, 369. [Google Scholar] [CrossRef]
- Hu, G.; Si, W.; Zhang, Q.; Lv, F. Circulating asprosin, irisin, and abdominal obesity in Chinese patients with type 2 diabetes mellitus: A case-control study. Endokrynol. Pol. 2023, 74, 55–62. [Google Scholar] [CrossRef]
- More, C.E.; Papp, C.; Harsanyi, S.; Gesztelyi, R.; Mikaczo, A.; Tajti, G.; Kardos, L.; Seres, I.; Lorincz, H.; Csapo, K.; et al. Altered irisin/BDNF axis parallels excessive daytime sleepiness in obstructive sleep apnea patients. Respir. Res. 2019, 20, 67. [Google Scholar] [CrossRef] [PubMed]
- Carneiro, G.; Togeiro, S.M.; Ribeiro-Filho, F.F.; Truksinas, E.; Ribeiro, A.B.; Zanella, M.T.; Zhong, A.; Xiong, X.; Shi, M.; Xu, H.; et al. Continuous Positive Airway Pressure Therapy Improves Hypoadiponectinemia in Severe Obese Men With Obstructive Sleep Apnea Without Changes in Insulin Resistance. Metab. Syndr. Relat. Disord. 2009, 7, 537–542. [Google Scholar] [CrossRef]
- Punjabi, N.M.; Shahar, E.; Redline, S.; Gottlieb, D.J.; Givelber, R.; Resnick, H.E. Sleep-Disordered Breathing, Glucose Intolerance, and Insulin Resistance: The Sleep Heart Health Study. Am. J. Epidemiol. 2004, 160, 521–530. [Google Scholar] [CrossRef]
- Bingol, Z.; Karaayvaz, E.B.; Telci, A.; Bilge, A.K.; Okumus, G.; Kiyan, E. Leptin and adiponectin levels in obstructive sleep apnea phenotypes. Biomark. Med. 2019, 13, 865–874. [Google Scholar] [CrossRef] [PubMed]
- Moraes-Vieira, P.; Yore, M.M.; Dwyer, P.M.; Syed, I.; Aryal, P.; Kahn, B.B. RBP4 Activates Antigen-Presenting Cells, Leading to Adipose Tissue Inflammation and Systemic Insulin Resistance. Cell Metab. 2014, 19, 512–526. [Google Scholar] [CrossRef]
- Nono Nankam, P.A.; Blüher, M. Retinol-binding protein 4 in obesity and metabolic dysfunctions. Mol. Cell. Endocrinol. 2021, 531, 111312. [Google Scholar] [CrossRef] [PubMed]
- Grosjean, F.; Esposito, P.; Maccarrone, R.; Libetta, C.; Canton, A.D.; Rampino, T. RBP4: A Culprit for Insulin Resistance in End Stage Renal Disease That Can Be Cleared by Hemodiafiltration. BioMed Res. Int. 2017, 2017, 7270595. [Google Scholar] [CrossRef]
- Li, G.; Esangbedo, I.C.; Xu, L.; Fu, J.; Li, L.; Feng, D.; Han, L.; Xiao, X.; Li, M.; Mi, J.; et al. Childhood retinol-binding protein 4 (RBP4) levels predicting the 10-year risk of insulin resistance and metabolic syndrome: The BCAMS study. Cardiovasc. Diabetol. 2018, 17, 69. [Google Scholar] [CrossRef]
- Abbas, N.A.; Salem, A.E. Metformin, sitagliptin, and liraglutide modulate serum retinol-binding protein-4 level and adipocytokine production in type 2 diabetes mellitus rat model. Can. J. Physiol. Pharmacol. 2018, 96, 1226–1231. [Google Scholar] [CrossRef]
- Perseghin, G.; Lattuada, G.; De Cobelli, F.; Esposito, A.; Belloni, E.; Canu, T.; Ragogna, F.; Scifo, P.; Del Maschio, A.; Luzi, L. Serum Retinol-Binding Protein-4, Leptin, and Adiponectin Concentrations Are Related to Ectopic Fat Accumulation. J. Clin. Endocrinol. Metab. 2007, 92, 4883–4888. [Google Scholar] [CrossRef]
- Tabak, O.; Simsek, G.; Erdenen, F.; Sozer, V.; Hasoglu, T.; Gelisgen, R.; Altunoglu, E.; Muderrisoglu, C.; Senyigit, A.; Uzun, H. The relationship between circulating irisin, retinol binding protein-4, adiponectin and inflammatory mediators in patients with metabolic syndrome. Arch. Endocrinol. Metab. 2017, 61, 515–523. [Google Scholar] [CrossRef] [PubMed]
- Cuttitta, G.; Ferraro, M.; Cibella, F.; Alfano, P.; Bucchieri, S.; Patti, A.M.; Muratori, R.; Pace, E.; Bruno, A. Relationship among Body Composition, Adipocytokines, and Irisin on Exercise Capacity and Quality of Life in COPD: A Pilot Study. Biomolecules 2022, 13, 48. [Google Scholar] [CrossRef] [PubMed]
- Monna, F.; Ben Messaoud, R.; Navarro, N.; Baillieul, S.; Sanchez, L.; Loiodice, C.; Tamisier, R.; Joyeux-Faure, M.; Pépin, J.-L. Machine learning and geometric morphometrics to predict obstructive sleep apnea from 3D craniofacial scans. Sleep Med. 2022, 95, 76–83. [Google Scholar] [CrossRef] [PubMed]
- Gastaut, H.; Tassinari, C.A.; Duron, B. Etude polygraphique des manifestations épisodiques (hypniques et respiratoires), diurnes et nocturnes, du syndrome de Pickwick [Polygraphic study of diurnal and nocturnal (hypnic and respiratory) episodal manifestations of Pickwick syndrome]. Rev. Neurol. 1965, 112, 568–579. [Google Scholar] [PubMed]


| Variables | AHI Groups | p | |||
|---|---|---|---|---|---|
| Control AHI < 5 (n:46) | Mild OSAS (5 < AHI < 15) (n:14) | Moderate OSAS (15 < AHI < 30) (n:23) | Severe OSAS (AHI > 30) (n:88) | ||
| Age (Year) | 41.67 ± 11.04 a | 49.92 ± 11.25 ab | 48.55 ± 13.97 ab | 52.57 ± 10.62 b | <0.001 * |
| Height (m) | 170.13 ± 9.84 | 165.00 ± 9.58 | 167.09 ± 10.23 | 167.93 ± 7.95 | 0.228 * |
| Weight (kg) | 74.61 ± 13.91 a | 80.50 ± 8.28 ac | 91.13 ± 19.20 bc | 93.55 ± 16.37 b | <0.001 * |
| BMI (kg/m2) | 25.66 ± 3.59 a | 29.76 ± 4.17 ac | 32.91 ± 8.11 bc | 33.34 ± 6.52 bc | <0.001 * |
| MOS (%) | 93.00 (90.00–96.75) a | 90.00 (85.00–90.00) a | 81.00 (75.00–87.00) ab | 76.00 (66.25–83.00) b | <0.001 ¶ |
| SpO2 (%) | 95.50 (92.00–97.00) | 94.50 (91.00–95.25) | 93.00 (91.00–94.00) | 92.00 (90.00–94.00) | 0.083 ¶ |
| Irisin (µg/mL) | 3.20 ± 0.79 a | 3.52 ± 0.67 a | 2.96 ± 0.23 a | 2.34 ± 0.76 b | <0.001 * |
| RBP-4 (ng/mL) | 28.00 ± 9.58 a | 34.64 ± 5.96 ab | 42.81 ± 11.72 b | 51.24 ± 11.13 c | <0.001 * |
| Adiponectin (µg/mL) | 8.74 (7.58–10.57) a | 6.34 (5.73–7.40) b | 5.99 (5.49–7.94) b | 6.67 (5.43–8.92) b | <0.001 ¶ |
| Gender | n (%) | n (%) | n (%) | n(%) | |
| Female | 15 (32.6) | 6 (42.9) | 7 (30.4) | 21 (23.9) | 0.431 † |
| Male | 31 (67.4) | 8 (57.1) | 16 (69.6) | 67 (76.1) | |
| Obesity | |||||
| No | 22 (47.8) | 8 (57.1) | 8 (34.8) | 28 (31.8) | 0.137 † |
| Yes | 24 (52.2) | 6 (42.9) | 15 (65.2) | 60 (68.2) | |
| DM | |||||
| No | 46 (100.0) a | 13 (100.0) ab | 21 (91.3) ab | 69 (78.4) b | 0.001 ● |
| Yes | 0 (0.0) a | 0 (0.0) ab | 2 (8.7) ab | 19 (21.6) b | |
| HT | |||||
| No | 45 (97.8) a | 10 (76.9) b | 11 (47.8) b | 49 (56.3) b | <0.001 ● |
| Yes | 1 (2.2) a | 3 (23.1) b | 12 (52.2) b | 38 (43.7) b | |
| Interactions between | ||||||||
|---|---|---|---|---|---|---|---|---|
| AHI Groups | Age | BMI | DM | HT | Group * DM | Group * HT | Group * HT * DM | |
| p Value | ||||||||
| Irisin (µg/mL) | <0.001 | 0.558 | 0.633 | 0.965 | 0.817 | 0.205 | 0.497 | 0.257 |
| RBP-4 (ng/mL) | 0.001 | 0.971 | 0.002 | 0.254 | 0.842 | 0.539 | 0.819 | 0.250 |
| Adiponectin (µg/mL) | 0.239 | 0.493 | <0.001 | 0.729 | 0.931 | 0.574 | 0.867 | 0.729 |
| Obesity | Mean ± Std | p Value | |
|---|---|---|---|
| Irisin (µg/mL) | No | 2.87 ± 0.75 | 0.004 * |
| Yes | 2.44 ± 0.78 | ||
| RBP-4 (ng/mL) | No | 43.05 ± 10 | 0.001 * |
| Yes | 50.43 ± 12.47 | ||
| Adiponectin (µg/mL) | No | 8.78 (6.77–9.92) | <0.001 ¶ |
| Yes | 5.84 (5.39–6.41) | ||
| Diabetes Mellitus | |||
| Irisin (µg/mL) | No | 2.67 ± 0.78 | 0.017 * |
| Yes | 2.21 ± 0.81 | ||
| RBP-4 (ng/mL) | No | 46.3 ± 11.69 | 0.001 * |
| Yes | 56.15 ± 10.91 | ||
| Adiponectin (µg/mL) | No | 6.53 (5.76–7.94) | 0.009 ¶ |
| Yes | 5.78 (5.29–6.46) | ||
| Hypertension | |||
| Irisin (µg/mL) | No | 2.62 ± 0.84 | 0.599 * |
| Yes | 2.54 ± 0.76 | ||
| RBP-4 (ng/mL) | No | 45.76 ± 12.28 | 0.02 * |
| Yes | 50.87 ± 11.45 | ||
| Adiponectin (µg/mL) | No | 6.74 (5.76–8.80) | 0.004 ¶ |
| Yes | 5.95 (5.45–6.58) |
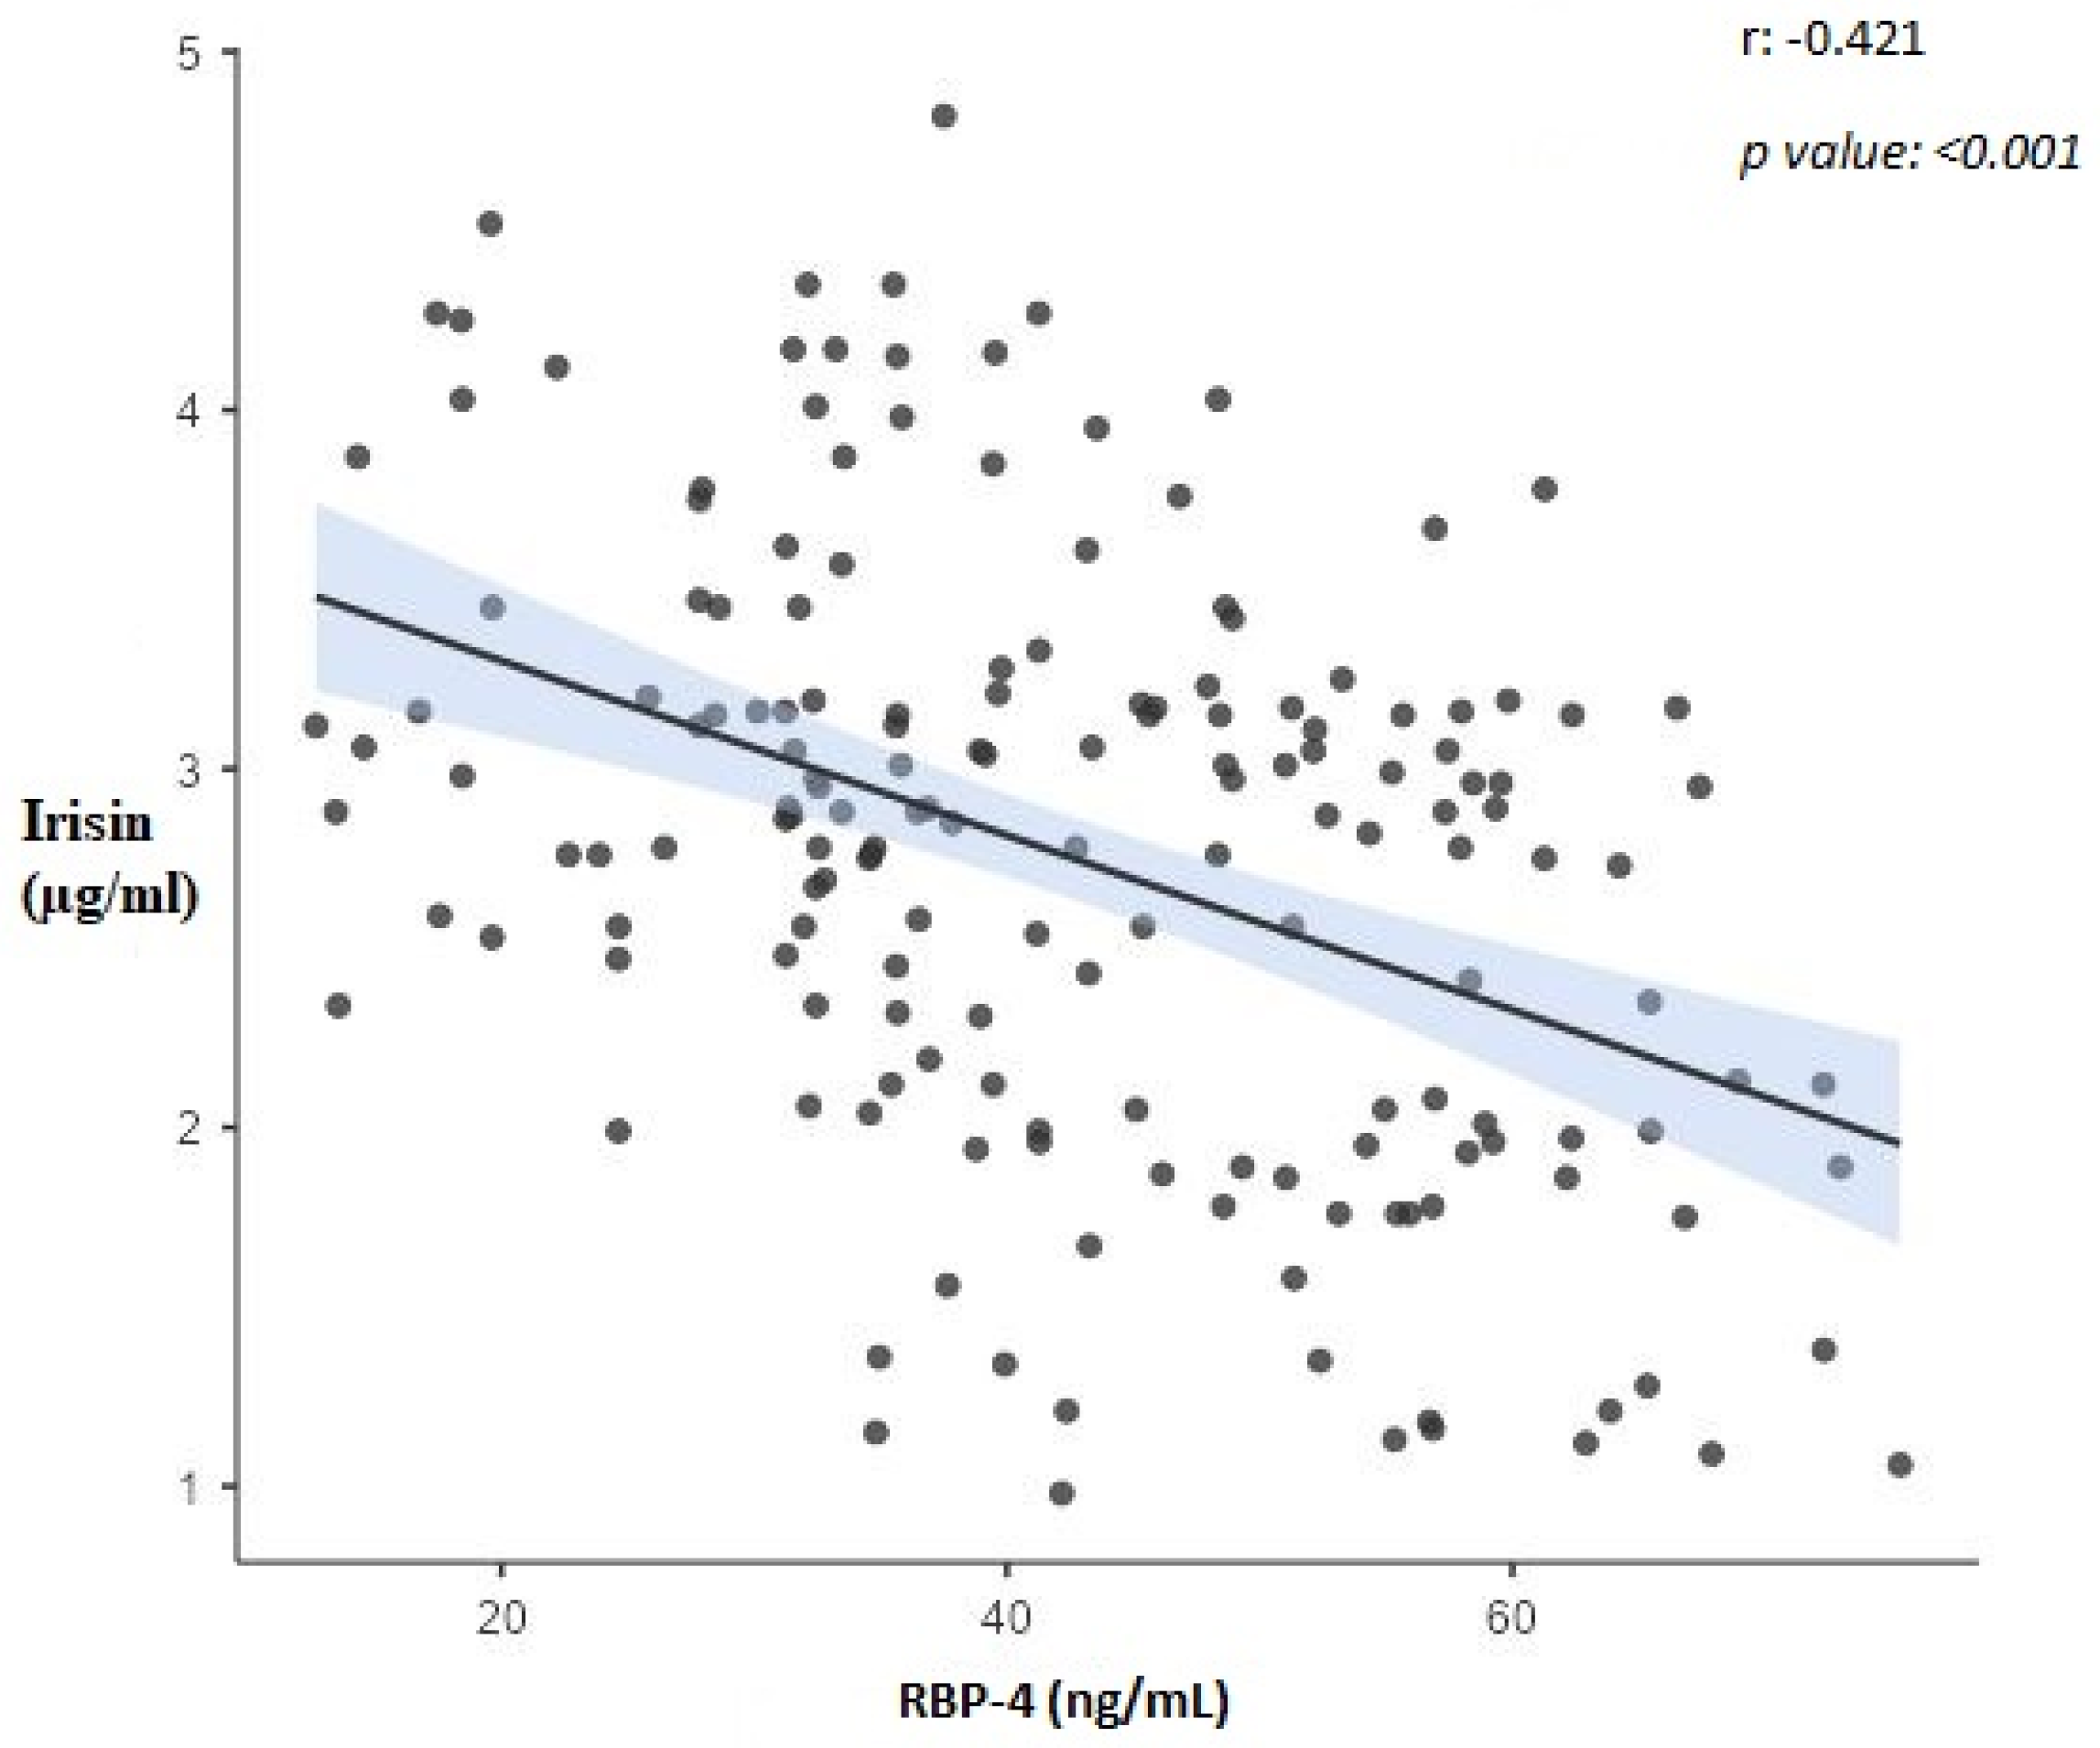
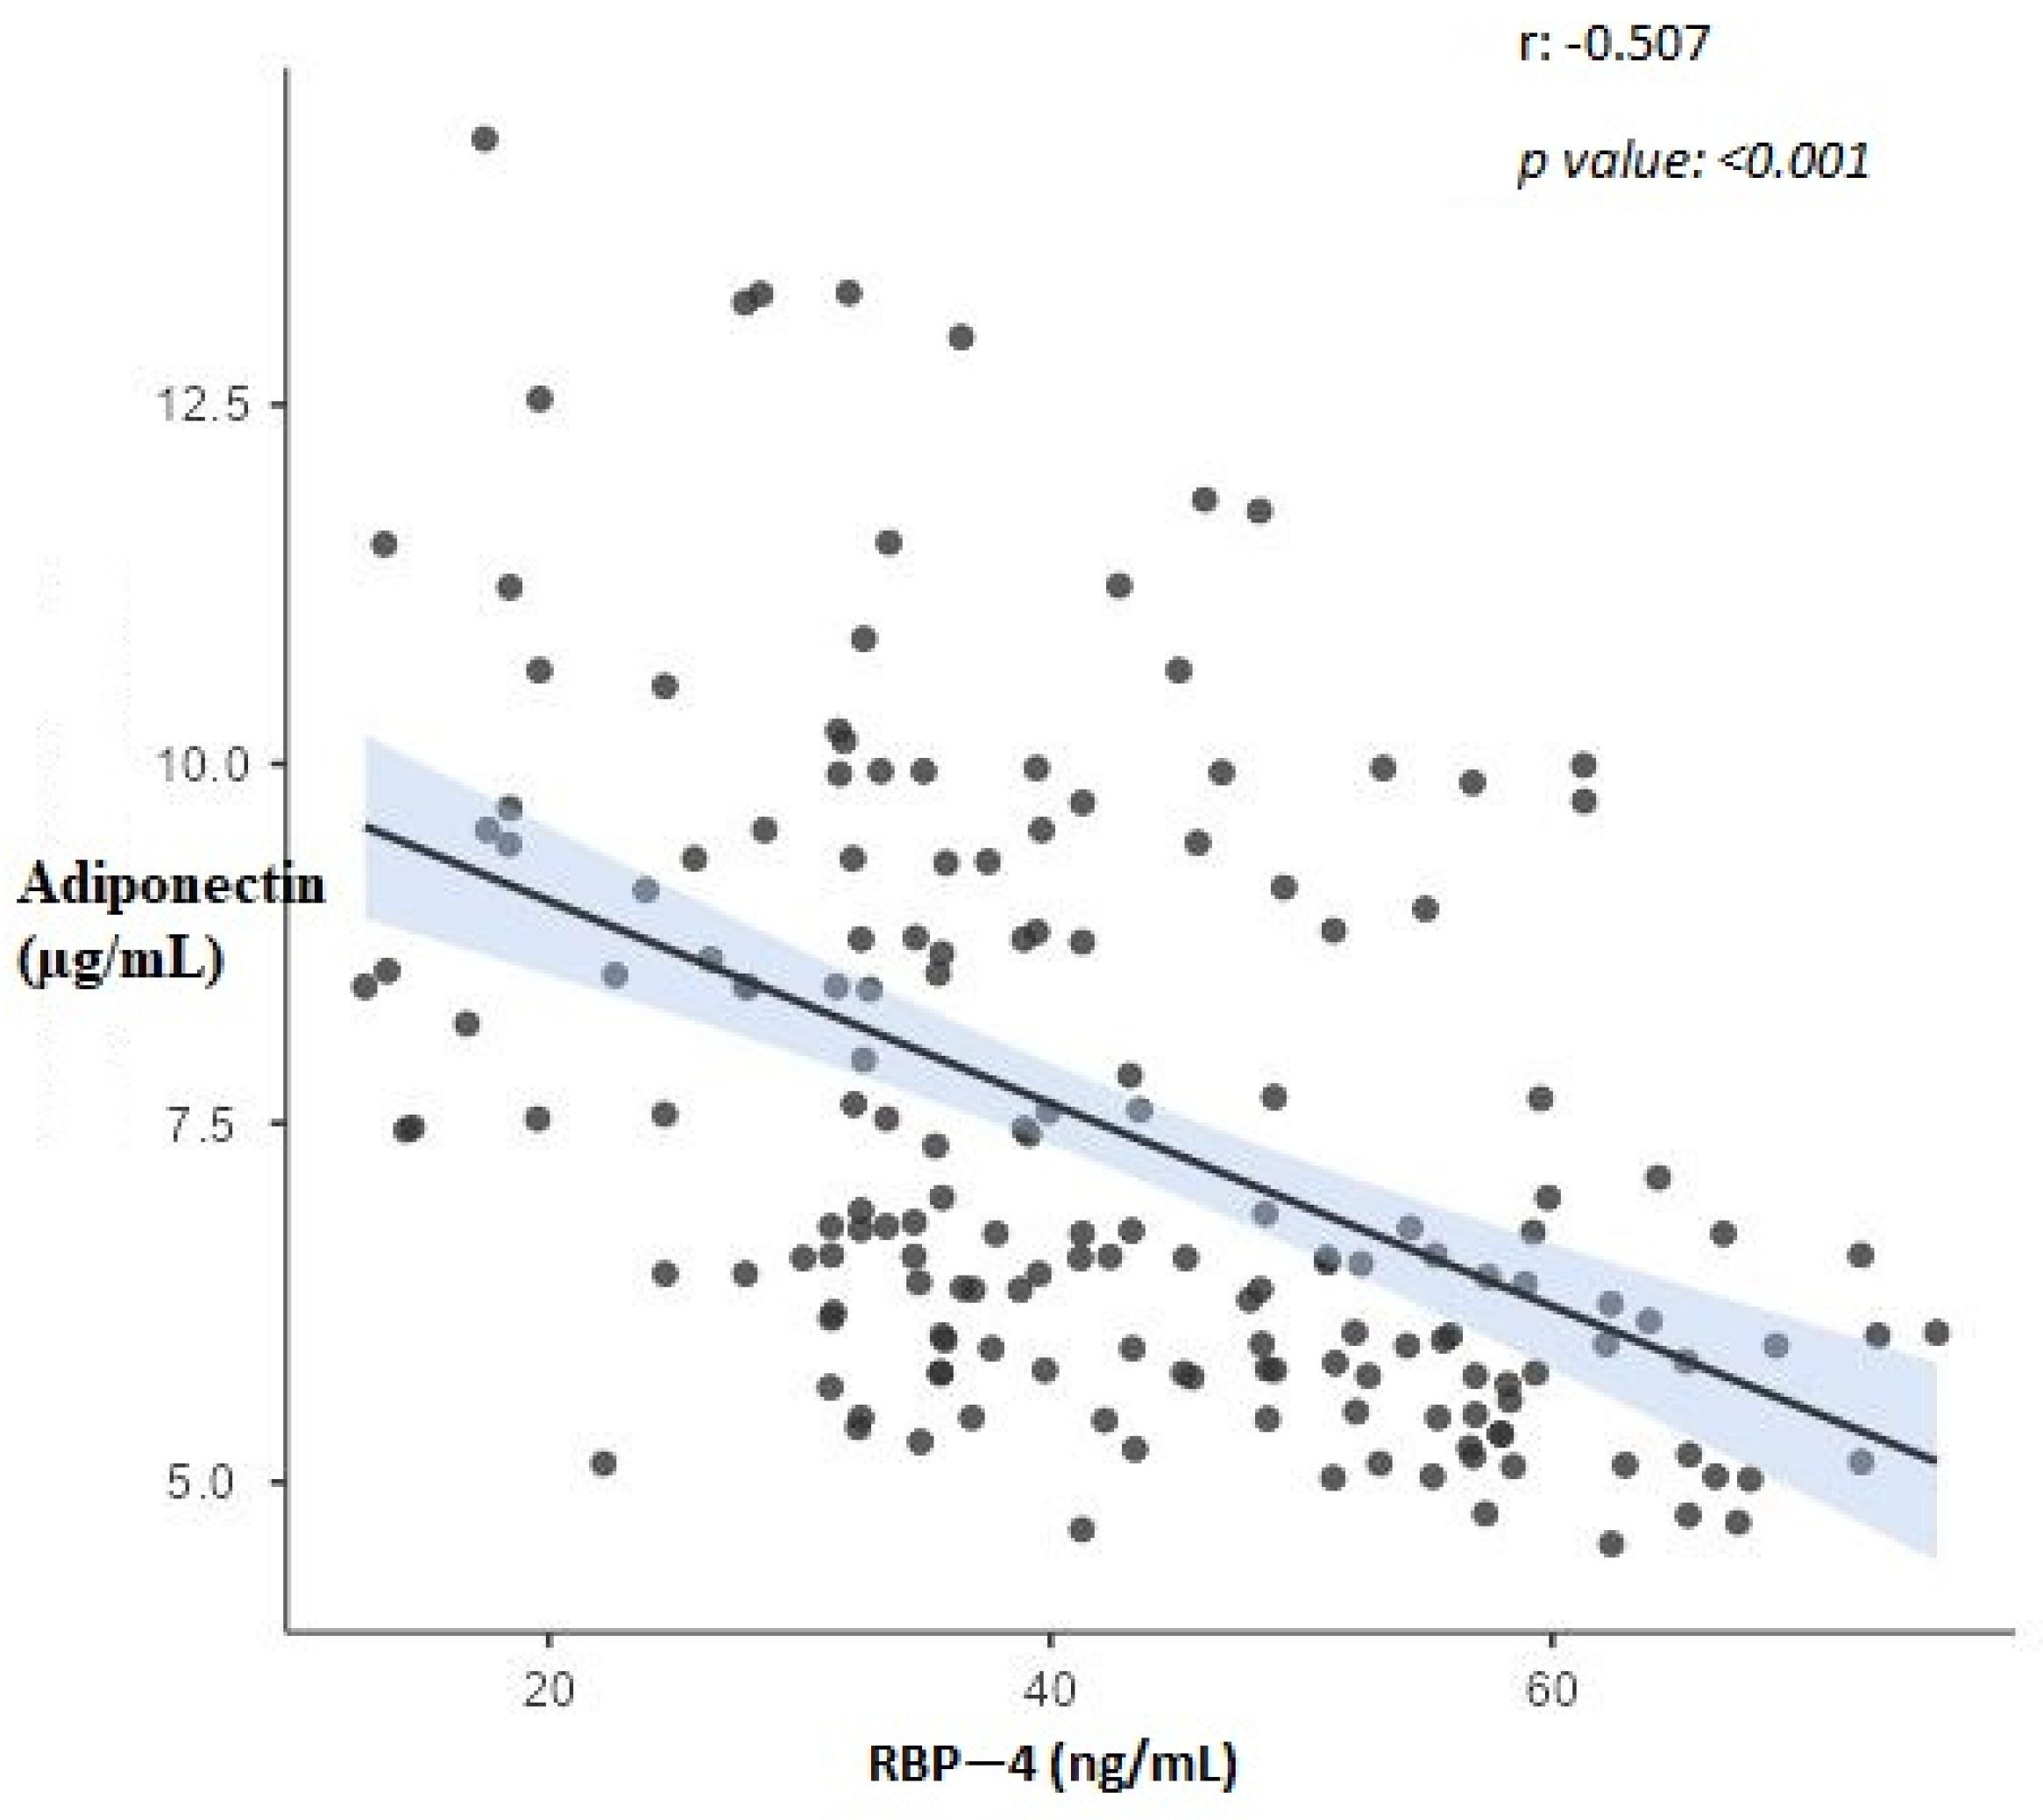
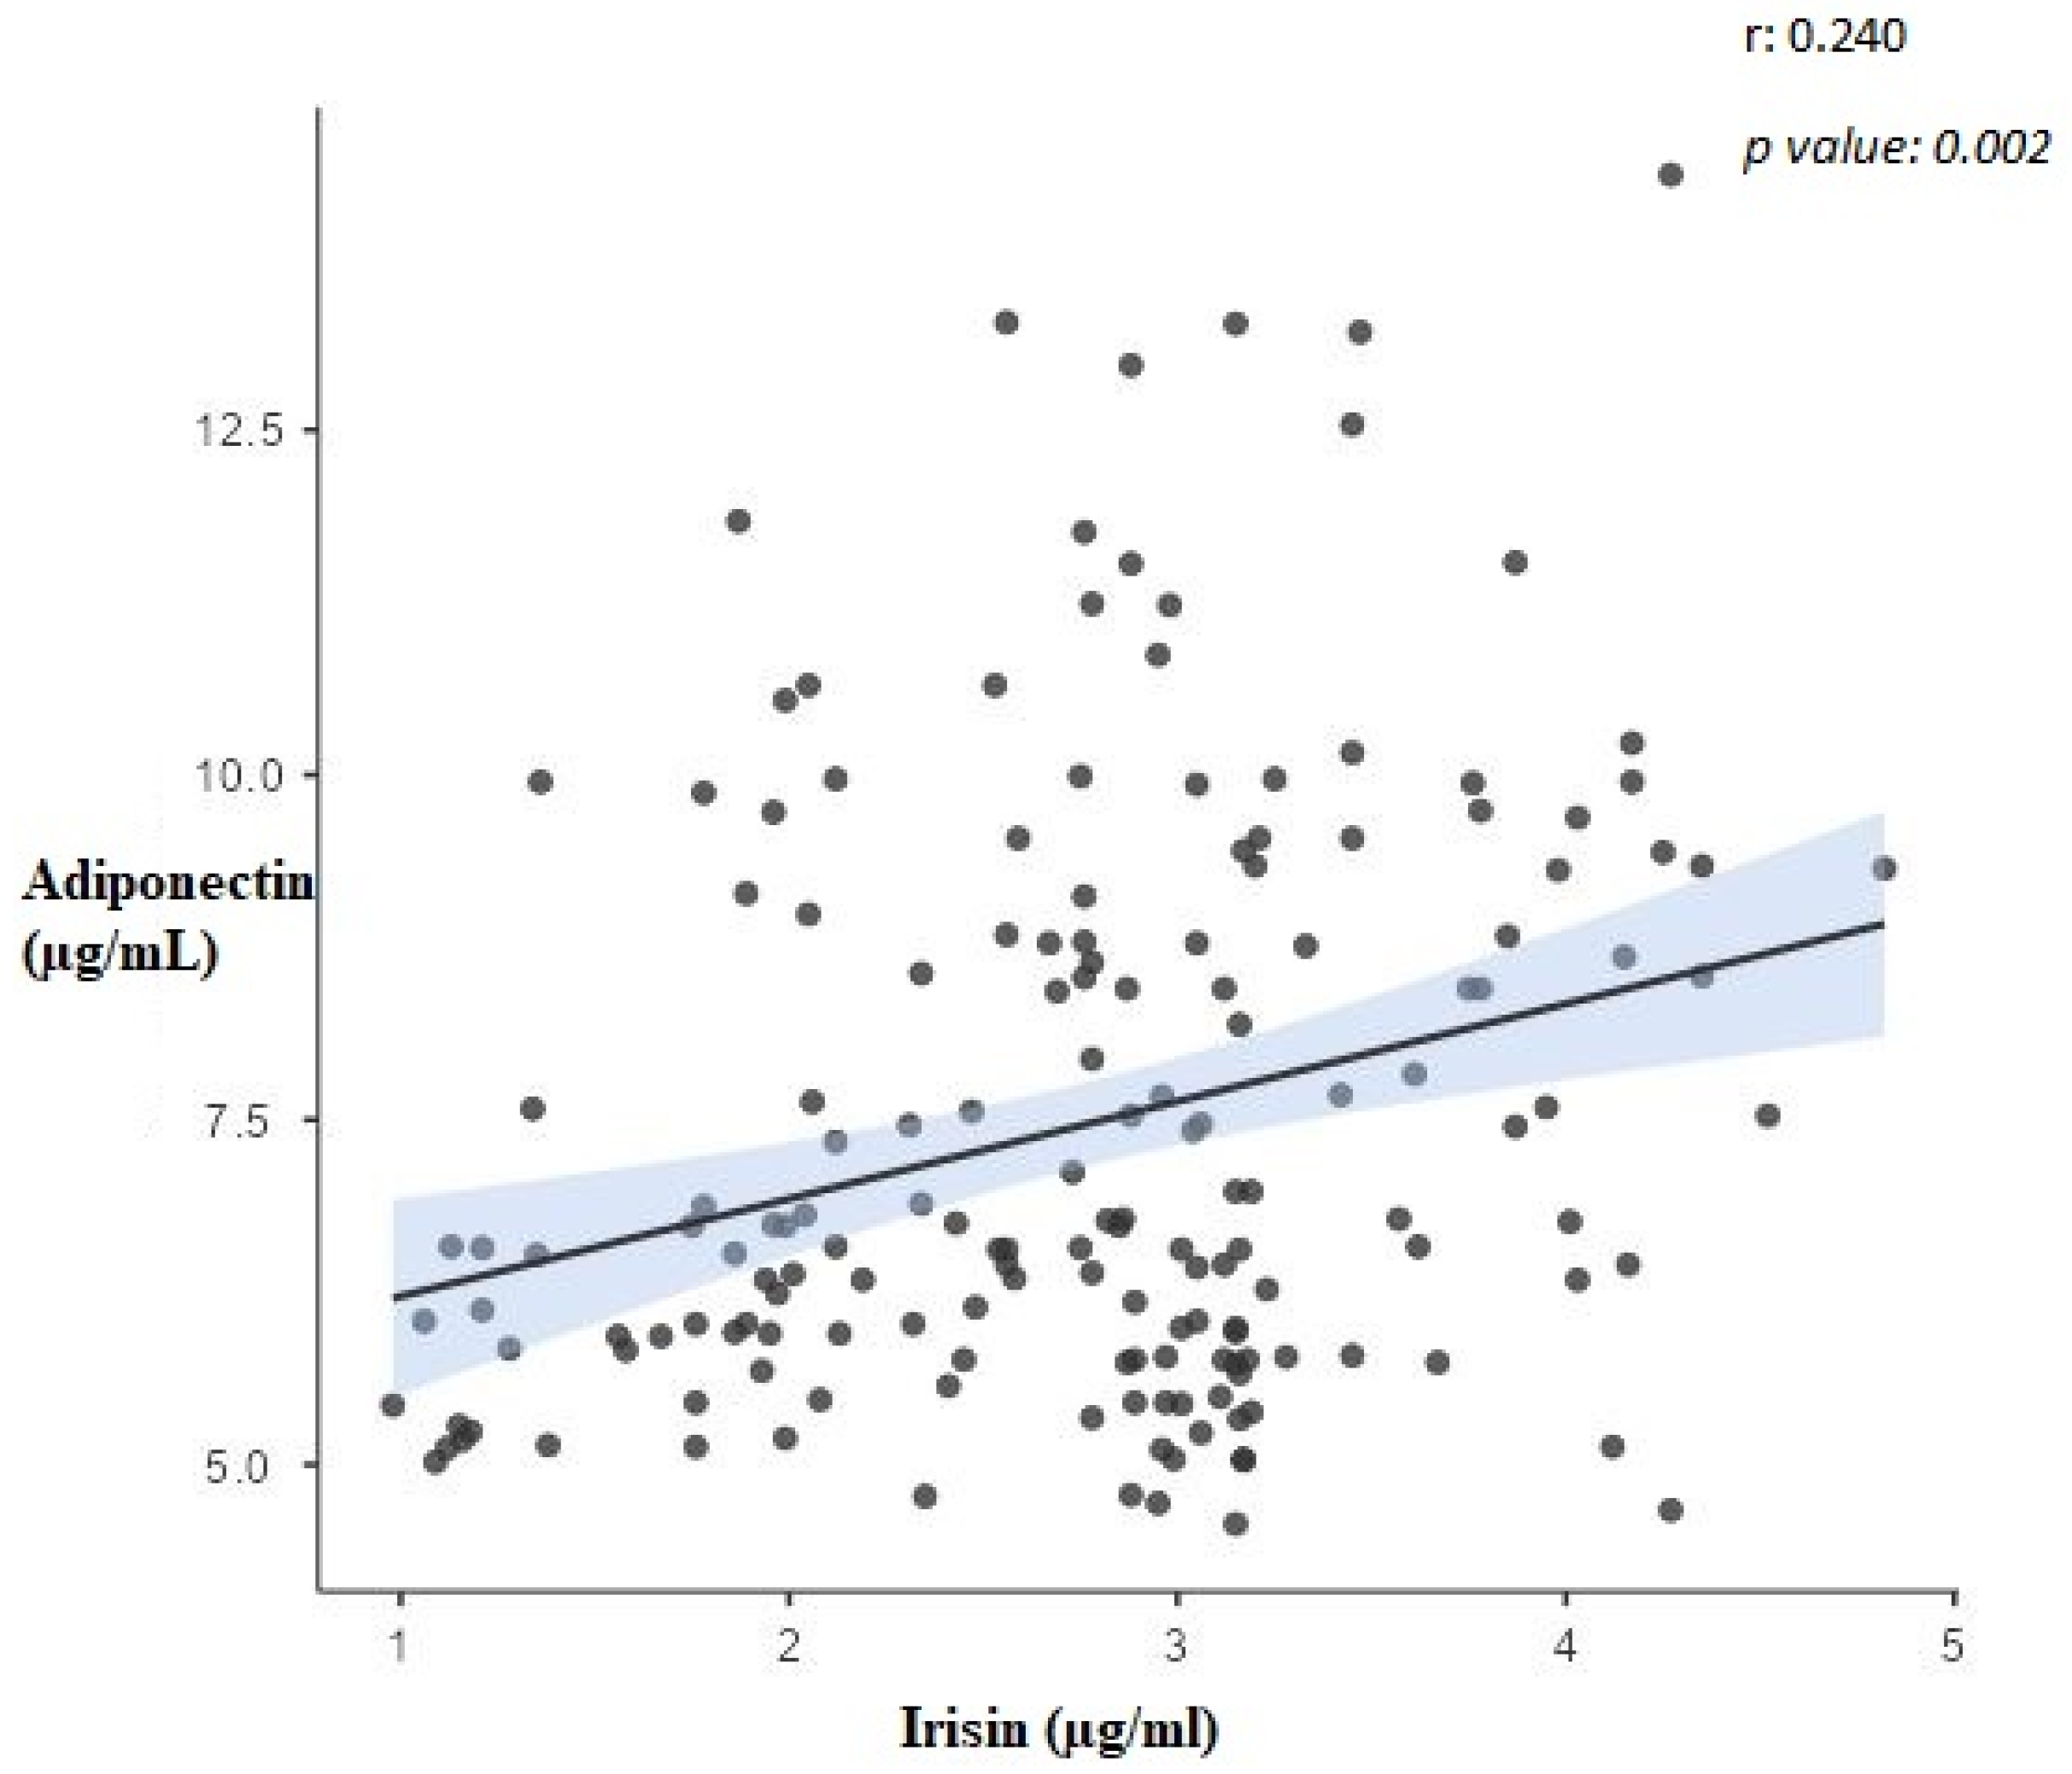
| Variable | Irisin (µg/mL) | RBP-4 (ng/mL) | Adiponectin (µg/mL) | AHI | BMI (kg/m2) |
|---|---|---|---|---|---|
| Irisin (µg/mL) | 1 | −0.421 ** | 0.240 * | −0.834 ** | −0.249 * |
| RBP-4 (ng/mL) | −0.421 ** | 1 | −0.507 ** | 0.473 ** | 0.535 ** |
| Adiponectin (µg/mL) | 0.240 * | −0.507 ** | 1 | −0.118 | −0.768 ** |
| AHI | −0.834 ** | 0.473 ** | −0.118 | 1 | 0.205 * |
| Variables | AUC | (CI) | p | Cut off Point | Sensitivity | Specificity |
|---|---|---|---|---|---|---|
| Adiponectin | 0.826 | (0.761–0.879) | <0.001 | 7.42 * | 74.4% | 84.8% |
| RBP-4 | 0.893 | (0.837–0.935) | <0.001 | 32.34 ¶ | 92.0% | 67.3% |
| Irisin | 0.690 | 0.615–0.758 | <0.001 | 3.42 * | 89.6% | 43.5% |
Disclaimer/Publisher’s Note: The statements, opinions and data contained in all publications are solely those of the individual author(s) and contributor(s) and not of MDPI and/or the editor(s). MDPI and/or the editor(s) disclaim responsibility for any injury to people or property resulting from any ideas, methods, instructions or products referred to in the content. |
© 2023 by the authors. Licensee MDPI, Basel, Switzerland. This article is an open access article distributed under the terms and conditions of the Creative Commons Attribution (CC BY) license (https://creativecommons.org/licenses/by/4.0/).
Share and Cite
Fazlıoğlu, N.; Uysal, P.; Durmus, S.; Yurt, S.; Gelisgen, R.; Uzun, H. Significance of Plasma Irisin, Adiponectin, and Retinol Binding Protein-4 Levels as Biomarkers for Obstructive Sleep Apnea Syndrome Severity. Biomolecules 2023, 13, 1440. https://doi.org/10.3390/biom13101440
Fazlıoğlu N, Uysal P, Durmus S, Yurt S, Gelisgen R, Uzun H. Significance of Plasma Irisin, Adiponectin, and Retinol Binding Protein-4 Levels as Biomarkers for Obstructive Sleep Apnea Syndrome Severity. Biomolecules. 2023; 13(10):1440. https://doi.org/10.3390/biom13101440
Chicago/Turabian StyleFazlıoğlu, Nevin, Pelin Uysal, Sinem Durmus, Sibel Yurt, Remise Gelisgen, and Hafize Uzun. 2023. "Significance of Plasma Irisin, Adiponectin, and Retinol Binding Protein-4 Levels as Biomarkers for Obstructive Sleep Apnea Syndrome Severity" Biomolecules 13, no. 10: 1440. https://doi.org/10.3390/biom13101440
APA StyleFazlıoğlu, N., Uysal, P., Durmus, S., Yurt, S., Gelisgen, R., & Uzun, H. (2023). Significance of Plasma Irisin, Adiponectin, and Retinol Binding Protein-4 Levels as Biomarkers for Obstructive Sleep Apnea Syndrome Severity. Biomolecules, 13(10), 1440. https://doi.org/10.3390/biom13101440