Article

Identification of a Multi-Messenger RNA Signature as Type 2 Diabetes Mellitus Candidate Genes Involved in Crosstalk between Inflammation and Insulin Resistance

by
Hebatalla Said Ali
1,*,
Mariam Sameh Boshra
1,*,
Sara H. A. Agwa
2,
Mohamed S. Abdel Hakeem
3,
Mahmoud Shawky El Meteini
4 and
Marwa Matboli
1,*
1
Medical Biochemistry and Molecular Biology Department, Faculty of Medicine, Ain Shams University, Abbassia, Cairo P.O. Box 11381, Egypt
2
Clinical Pathology, Medical Ain Shams Research Institute, Ain Shams University, Abbassia, Cairo P.O. Box 11381, Egypt
3
Institute of Immunology, University of Pennsylvania, Philadelphia, PA 19014, USA
4
Department of General Surgery, The School of Medicine, University of Ain Shams, Cairo 11591, Egypt
*
Authors to whom correspondence should be addressed.
Biomolecules 2022, 12(9), 1230; https://doi.org/10.3390/biom12091230
Submission received: 2 July 2022 / Revised: 16 August 2022 / Accepted: 22 August 2022 / Published: 2 September 2022

Abstract

:
Type 2 Diabetes Mellitus (T2DM) is a metabolic disease associated with inflammation widening the scope of immune-metabolism, linking the inflammation to insulin resistance and beta cell dysfunction. New potential and prognostic biomarkers are urgently required to identify individuals at high risk of β-cell dysfunction and pre-DM. The DNA-sensing stimulator of interferon genes (STING) is an important component of innate immune signaling that governs inflammation-mediated T2DM. NOD-like receptor (NLR) reduces STING-dependent innate immune activation in response to cyclic di-GMP and DNA viruses by impeding STING-TBK1 interaction. We proposed exploring novel blood-based mRNA signatures that are selective for components related to inflammatory, immune, and metabolic stress which may reveal the landscape of T2DM progression for diagnosing or treating patients in the pre-DM state. In this study, we used microarray data set to identify a group of differentially expressed mRNAs related to the cGAS/STING, NODlike receptor pathways (NLR) and T2DM. Then, we comparatively analyzed six mRNAs expression levels in healthy individuals, prediabetes (pre-DM) and T2DM patients by real-time PCR. The expressions of ZBP1, DDX58, NFKB1 and CHUK were significantly higher in the pre-DM group compared to either healthy control or T2DM patients. The expression of ZBP1 and NFKB1 mRNA could discriminate between good versus poor glycemic control groups. HSPA1B mRNA showed a significant difference in its expression regarding the insulin resistance. Linear regression analysis revealed that LDLc, HSPA1B and NFKB1 were significant variables for the prediction of pre-DM from the healthy control. Our study shed light on a new finding that addresses the role of ZBP1 and HSPA1B in the early prediction and progression of T2DM.

Graphical Abstract

1. Introduction

Type 2 Diabetes Mellitus (T2DM) is a metabolic disease associated with inflammation widening the scope of immune-metabolism linking the inflammation to insulin resistance and beta cell dysfunction. There is a worldwide increase in the prevalence of T2DM with its complications including diabetic retinopathy, nephropathy, neuropathy and cardiovascular strokes, which are the main causes of morbidity and mortality related to T2 DM [1]. The prevalence of DM in Egypt in 2019 was almost around 9 million adult cases, occupying second place in the Middle East and North Africa (MENA) region [2,3].
T2DM diagnostic criteria that were clarified by the American Diabetes Association (ADA) include the following: A fasting plasma glucose (FPG) level of 126 mg/dL or higher, or A 2-h plasma glucose level of 200 mg/dL or higher, or A hemoglobin A1c (HbA1c) level of 6.5 or higher [4]. Although there are some difficulties in distinguishing type 1 and type 2 DM in all age groups at onset, the actual diagnosis becomes more obvious over time using autoimmunity-specific tests [5]. The problem is that most of the patients with type 2 DM do not have specific symptoms in the early stage and, once diagnosed, the majority of the cases will have serious complications. Prediabetic-state current laboratory methods show several limitations in the early prediction of pre-diabetes and T2DM. The diagnosis of pre-DM relies on the oral glucose tolerance test as a gold standard, but this test is time-consuming and complicated. Although fasting blood glucose is a convenient tool for T2DM diagnosis, the rate of missing pre-DM diagnosis is relatively high. In addition, HbA1c% is likely to be linked to other changes in red blood cell life rather than glycation rates, e.g., haemoglobinopathies. That is why there is an urgent need to find future potential biomarkers for pre-DM early detection [6]. During prediabetes (pre-DM), beta islets undergo stress and release many mRNAs [7]. Several etiological factors have been reported to have a role in the development of T2DM; one of them is the activation of the immune response as a result of overnutrition, leading to low-grade chronic inflammation, which may be a strong contributor to the development of T2DM [8].
The disbiosis of gut microbiota can lead to inflammatory changes with subsequent activation of nuclear factor-kappa B (NF-κB), which may be triggered by activation of cGAS/STING [9] or nucleotide-binding oligomerization domain-containing protein (NOD) receptor signaling, resulting in decreased insulin sensitivity and beta cell function [10].
STING (The DNA-sensing stimulator of interferon genes) is an important mediator of interferons inflammatory response, which can sense any foreign pathogen and activates protective antimicrobial signals [11]. The cGAS–STING–IRF3 pathway plays a role in metabolic stress-induced endothelial inflammation in obesity [12]. STING1 (TMEM173) also can recognize self-DNA leaking from the nucleus to the cytoplasm. Recently, evidence showed that STING plays an important role in many metabolic pathways as insulin resistance due to obesity, fat metabolism in the liver leading to Non-Alcoholic Fatty Liver [13,14]. STING is a critical regulator for both glucose and lipid metabolism. STING knockout significantly improved insulin resistance and glucose intolerance in rat on a high-fat diet [8]. Z-DNA-binding protein 1 (ZBP1) is a positive mediator of innate immunity through its cooperation with the cGAS-STING pathway [15]. ZBP1 is a cytoplasmic sensor of DNA and has an important role in the immune response activated by the introduction of different viruses inside the body [16]. ZBP1 can lead to the production of type 1 interferon through the activation of the interferon regulatory factor (IRF) and nuclear factor-kappa B (NF-kappaB) transcription factors [17]. Thus, it can promote chronic inflammation in various pathological conditions as insulin resistance [18]. DDX58 is an innate immune receptor that can detect cytoplasmic DNA and activate the signaling pathway, leading to the production of interferon 1 and different inflammatory cytokines [19]. A crosslink was found between cGAS-STING1- and DDX58-MAVS-dependent innate immune response pathways.
NOD is an intracellular pattern recognition receptor that recognizes fragments of the bacterial cell wall; when it is mutated, it loses the ability to respond properly to bacterial cell wall fragments with dysregulation in NF-κB signaling. Acute stimulation of NOD signaling by mimetics of bacterial PGNs causes insulin resistance [20]; NOD1 ligands lipid-derived metabolites were produced during obesity and contribute to insulin resistance development [21]. There is strong crosstalk between NOD signaling and the insulin receptor pathway through NF-KB and MAPK intermediates [22]. Among NOD stimulators, HSP70 can aggravate the response of NOD2 to bacterial cell wall fragments, and increase NOD-like receptor (NLR)-mediated NF-KB activation [23]. Heat shock proteins (HSPs) are proteins responsible for cellular stress response that inhibit denaturation or protein unfolding in response to stress. HSPs are linked to the modulation of several pathways in antigen-presenting cells like tumor antigen uptake and processing through MHC Class I and class II pathways. HSP60 showed a direct link between innate immunity and pancreatic islets functions [24]. Heat shock protein is related to many inflammatory diseases such as diabetes mellitus, rheumatoid arthritis and atherosclerosis [25]. Another crucial player of NOD signaling is conserved helix–loop–helix ubiquitous kinase (CHUK) encodes for Inhibitor-κB kinase α (IKKα) that acts as a catalytic domain of the Serine/Threonine kinase, Inhibitor of Nuclear Factor-KappaB Kinase (IKK). IKKα phosphorylate IκBα and inhibitors of NF-KB, leading to their degradation, thus activating NF-KB [26].
A literature search shed light on the crucial role of the STING and NLR pathways in development of inflammation-mediated insulin resistance. The DNA-sensing cGAS-cGAMP-STING pathway mediates type I interferon inflammatory responses in immune cells during infections. Recent studies showed that this pathway is also activated by host DNA aberrantly localized in the cytosol, contributing to increased sterile inflammation; insulin resistance via potential interactions of the cGAS-cGAMP-STING pathway with mTORC1 signaling and apoptosis have been discussed, suggesting its critical role in obesity-induced metabolic diseases [27]. STING trafficking and degradation are also regulated by a variety of mechanisms; for example, Nod-like receptors NLR family domain-containing protein 3 (NLRC3) interacts with STING to modulate its trafficking [28]. Moreover, obesity causes significant changes in the skeletal muscles and adipose tissue with an increase in the plasma free fatty acids (FFA). Also, obesity induces changing in gut microbiota composition. Both FFA and lipopolysachrides (LPS) trigger the activation of the Nod-like receptors (NLRs)-mediated inflammation, which further activates NF-kB with subsequent development of inflammation-mediated insulin resistance [29].
We propose exploring novel blood-based mRNA signatures that are selective for components related to inflammatory, immune and metabolic stress, which may reveal the landscape of T2DM progression for diagnosing or treating patients in the pre-DM state. In this study, we used a microarray data set to identify a group of differentially expressed mRNAs related to the cGAS/STING, NOD-like receptor pathways (NLR) and T2DM. Then, we comparatively analyzed six mRNAs expression levels in healthy individuals, prediabetes (pre-DM) and T2DM patients. We also demonstrated that these mRNAs may represent a multi-messenger RNA signature that can be used to effectively discriminate between healthy and pre-DM individuals to identify T2DM susceptible ones.

2. Materials and Methods

2.1. Selection of mRNA Set Linked to cGAS/STING, NOD-like Receptor Pathways (NLR) and T2DM

We have used several microarray databases including KEGG: Kyoto Encyclopedia of Genes and Genomes (https://www.genome.jp/kegg (accessed on 22 May 2022))), Human protein atlas (https://www.proteinatlas.org/ (accessed on 22 May 2022)) and GeneCards Human Genes database (https://www.genecards.org/ (accessed on 22 May 2022)). We have retrieved a set of mRNAs based on the following criteria: (a) Genes that are expressed and deregulated in T2DM; (b) Genes that are highly expressed in tissues of interest in T2DM, e.g.,: skeletal muscle, adipose tissue and also expressed in Peripheral Blood Mononuclear Cells (PBMCs) obtained from whole-blood samples for easiest extraction and least invasiveness; (c) These genes are related to the cGAS-cGAMP-STING pathway and NOD-like receptor signaling pathway, which are parts of the PAMPs and DAMPs pathways of innate immunity and chronic sterile inflammation; (d) Linking these novel genes from the 2 concerned pathways to previously known genes in T2DM through an interaction network. We have selected 6 mRNAs, namely: ZBP1, Heat Shock Protein Family A (Hsp70) Member 1B (HSPA1B), Stimulator of Interferon Response CGAMP Interactor 1(TMEM173), DExD/H-Box Helicase 58 (DDX58), Nuclear Factor Kappa B Subunit 1(NFKB1) and CHUK (Supplementary Figures S1–S6). The six selected 6 mRNAs were then imported into the Search Tool for the Retrieval of Interacting Genes (STRING; version 11.0; Zurich, Switzerland http://stringdb.org (accessed on 22 May 2022)) online database for protein–protein interaction (PPI) assessment (Supplementary Figure S7).

2.2. Study Population and Blood Samples

This study was authorized by the medical research ethical committee, Ain Shams University, Faculty of Medicine. All subjects included in the study provided informed consent according to the Declaration of Helsinki. The study is formed of 44 individuals with a pre-DM group (pre-DM), 61 T2DM patients and 45 healthy control individuals, age- and sex-matched. The participants were selected from the Endocrinology Unit, Department of Internal Medicine, Faculty of Medicine, Ain Shams University during the period between February 2020 and March 2021. Patients were diagnosed according to the American Diabetes Association (ADA) criteria 2021 for the diagnosis of T2DM [30]. All patients with liver or kidney dysfunction, inflammatory diseases, cancer, autoimmune diseases and any endocrine disease other than T2DM were excluded from our study.
All the participants gave a detailed past history of any chronic medical conditions and full clinical examinations were done. Any participant with blood pressure above 139/89 mmHg was considered a hypertensive patient [31]. Anthropometric measures were obtained, Body Mass Index (BMI) was calculated according to the WHO recommendations [32]. After 8–10 h of overnight fasting, 10 mL of venous blood were taken from every participant and divided into three samples: 4 mL of them were used for quantitative colorimetric determination of glycated hemoglobin as a percent of total hemoglobin using kits supplied by Sigma-Aldrich, St. Louis, MO, USA [33]. Then, another 1 mL of blood was transferred into a sodium flouride tube, and another sample of blood was taken after 2 h for determination of blood glucose by enzymatic colorimetric method using Thermofischer, USA. The other 5 mL were transferred into a plain tube and samples were left to coagulate, then centrifuged at 1300× g for 20 min. The sera samples were separated and kept at −80 °C until biochemical analysis and RNA extraction.
Biochemical analyses were carried out, including: fasting blood glucose levels, glycated hemoglobin (HbA1c%), lipid profile and Albumin/creatine ratio. HOMA-IR formula was calculated to assess the degree of tissue resistance to insulin. (Serum fasting insulin (SFI) in μmol/dL × Serum fasting glucose (SFG) in mmol/L) over 22.5. Insulin resistance was determined when the score was above 2.5 [34]. HOMA-B was used to assess insulin sensitivity. Serum total cholesterol (TC), Triglycerides (TG), HDL-c and LDL-c were estimated using a multifunctional biochemistry analyzer (AU680, Beckman Coulter Inc., Indianapolis, IN, USA).

2.3. Extraction of the mRNA

The total RNA was extracted from the serum samples using the miRNeasy Serum/Plasma Kit extraction kits (Cat No. 217184, Qiagen, Hilden, Germany), according to the manufacturer’s protocol. The concentration and integrity of RNA in the different samples were measured using a Nano-Drop instrument (Thermo Scientific, Waltham, MA, USA), using samples with RNA: protein higher than 1.8–2.
RNA samples were stored at −80 °C till analysis. Then, reverse transcription was performed using miScript II RT Kit (Qiagen, Hilden, Germany, Cat No. 218161) to obtain cDNA following the instructions of the manufacturer. Four microliter 5 x miScript HiFlex Buffer, two microliter 10 x miScript Nucleics Mix, one microliter miScript Reverse Transcriptase Mix and RNase free water were added to 2 ug RNA extract, then incubated at 37 °C for 60 min, then 95 °C for 5 min using a Rotor gene Thermal cycler (Thermo Electron Waltham, MA, USA).

2.4. Quantitation of the Selected Six-Based mRNA Signature Expression

The differential expression of ZBP1, HSPA1B, TMEM173, DDX58, NFKB1 and CHUK, the 6 chosen mRNAs, was determined using Quantitect SYBR Green Master Mix (Qiagen, Hilden, Germany) and specific primers for (Hs_ZBP1_1_SG QuantiTect Primer Assay) (NM_00116041), (Hs_HSPA1B_1_SG QuantiTect Primer Assay) (NM_005346), (Hs_TMEM173_1_SG QuantiTect Primer Assay) (NM_198282), (Hs_DDX58_1_SG QuantiTect Primer Assay) (NM_014314), (Hs_NFKB1_1_SG QuantiTect Primer Assay) (NM_001165412), and (Hs_CHUK_1_SG QuantiTect Primer Assay) (NM_001278); following the manufacturer’s protocol, alongside with GAPDH (NM_002046) as the reference gene. The PCR program was as follows: initial activation step at 95 °C for 15 min followed by 40 cycles of PCR were done under the following conditions: at 94 °C for 15 s, at 55 °C for 30 s and at 72 °C for 30 s.
All the reactions were carried out in duplicate using The Rotor Gene real-time PCR detection system (Qiagen, Hilden, Germany). The amplification plot curve and melting curve were used to assess the specificities of the amplicons. If the threshold cycle exceeded 36, it was considered negative. Melting curves were used to identify the specificity of the amplicons of the PCR. The relative expression of the mRNAs was estimated by 2−ΔΔCT [35]. The results of the samples were compared to a control sample and reference gene.

2.5. Statistics

The Statistical Package for the Social Sciences 20th version (SPSS, Chicago, IL, USA) was used to analyze all the statistical data. The Chi-square test, one-way ANOVA, and Kruskal–Wallis test were performed for comparing the samples. The cutoff of the mRNA as a predictor of T2DM was obtained using the receiver operating characteristic (ROC curves). The correlation between mRNA levels and the different clinicopathological variables were assessed using Spearman correlations. A 2-tailed p value 0.05 is considered statistically significant.

3. Results

3.1. The Study Groups’ Medical and Anthropometric Characters

The medical and anthropometric characters of all subjects are shown in Supplementary Table S1. We found that the FSG levels and the HbA1c are significantly higher in the group with T2DM compared to the healthy controls group and the group with impaired glucose level (pre-DM). As for the blood pressure, serum cholesterol and LDL-c were significantly higher in the T2DM group compared to the other 2 groups, and also higher in the group with pre-DM in relation to the healthy controls. On the other hand, the BMI was significantly higher in both the T2DM group and the pre-DM group in comparison with the healthy controls, as shown in Supplementary Table S1.

3.2. Insulin Sensitivity and the Function of the Pancreatic Islet Cells

The HOMA-IR was calculated to determine the presence of insulin resistance; it was significantly higher in the T2DM group in relation to the other 2 groups. Also, HOMA-IR was significantly higher in the pre-DM group in comparison with the healthy controls. Concerning the HOMA-B values, we found that it was significantly reduced in the T2DM group compared to the group with the pre-DM group and the healthy controls, it was also reduced in the group with pre-DM compared to its value in the healthy controls, as shown in Supplementary Table S1.

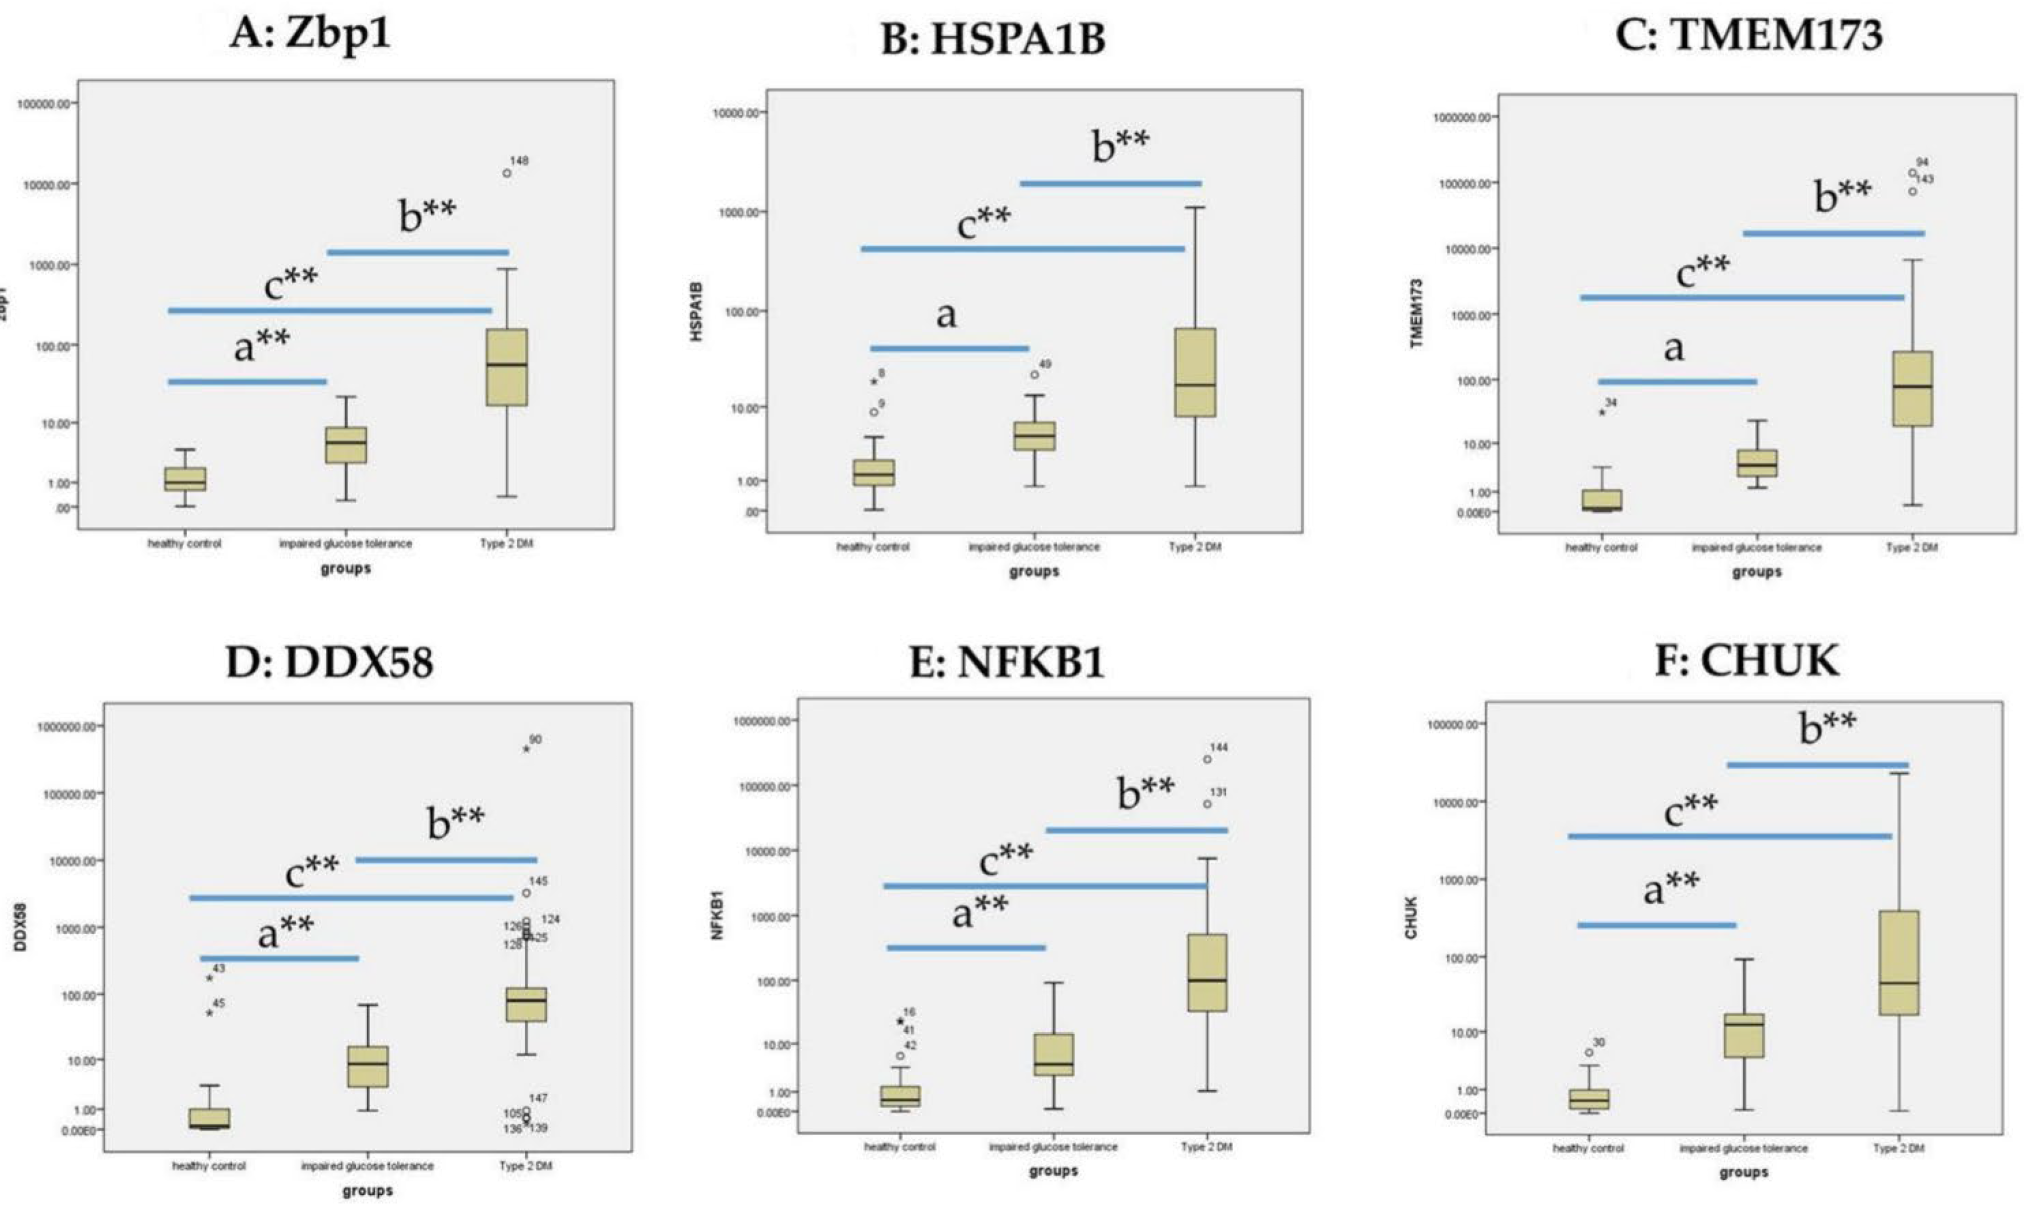
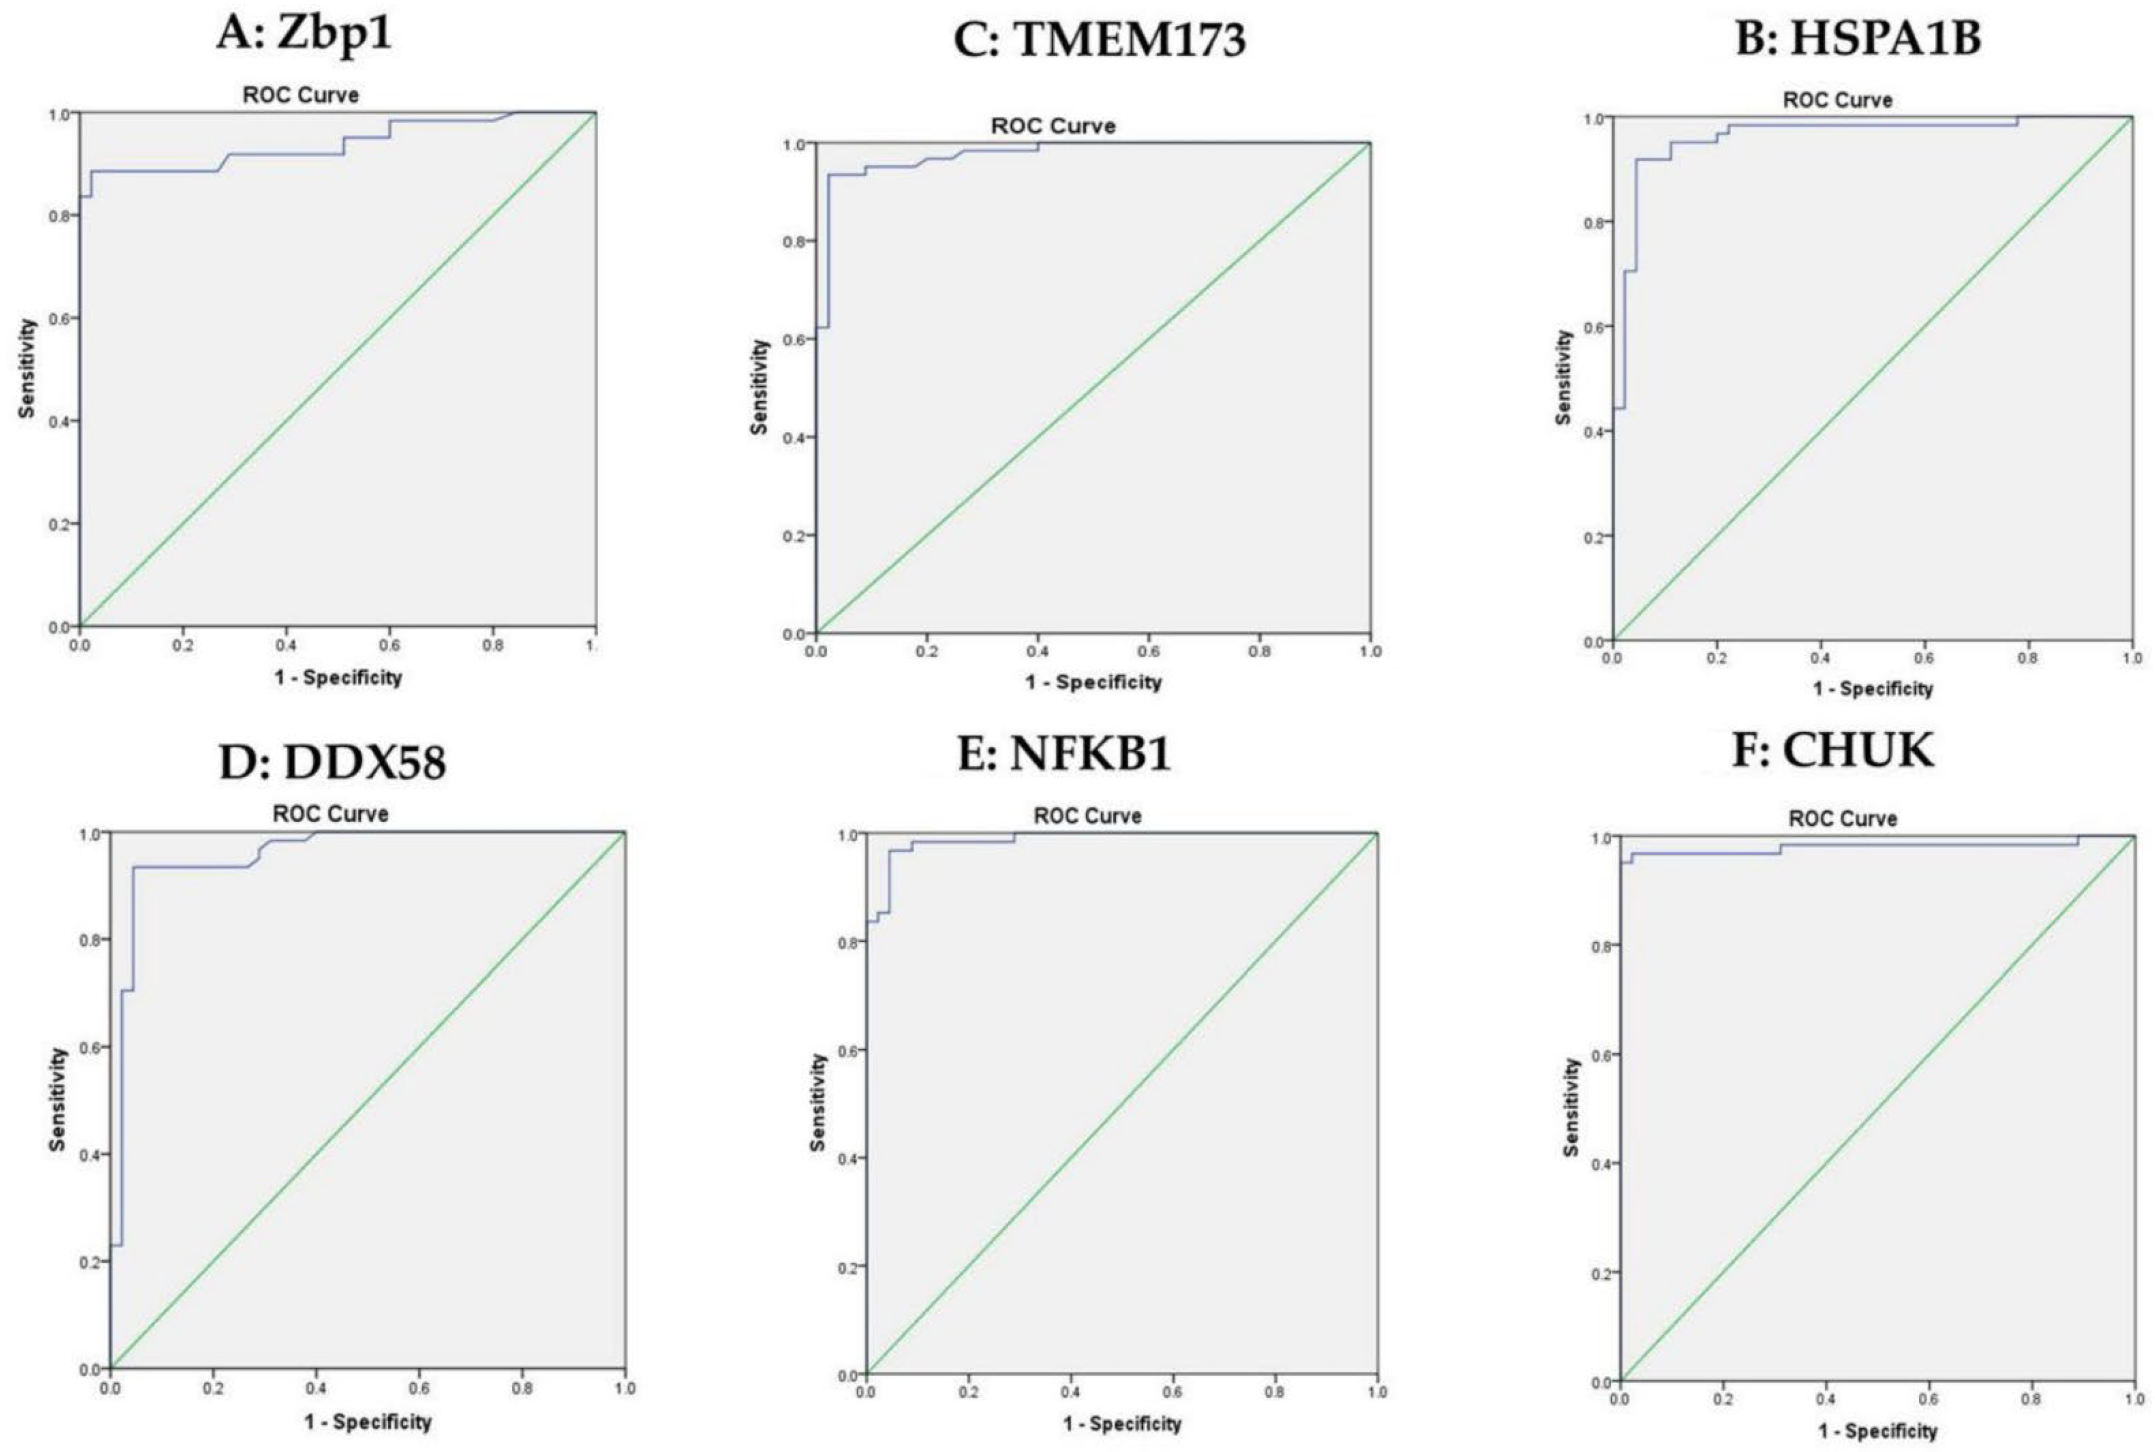
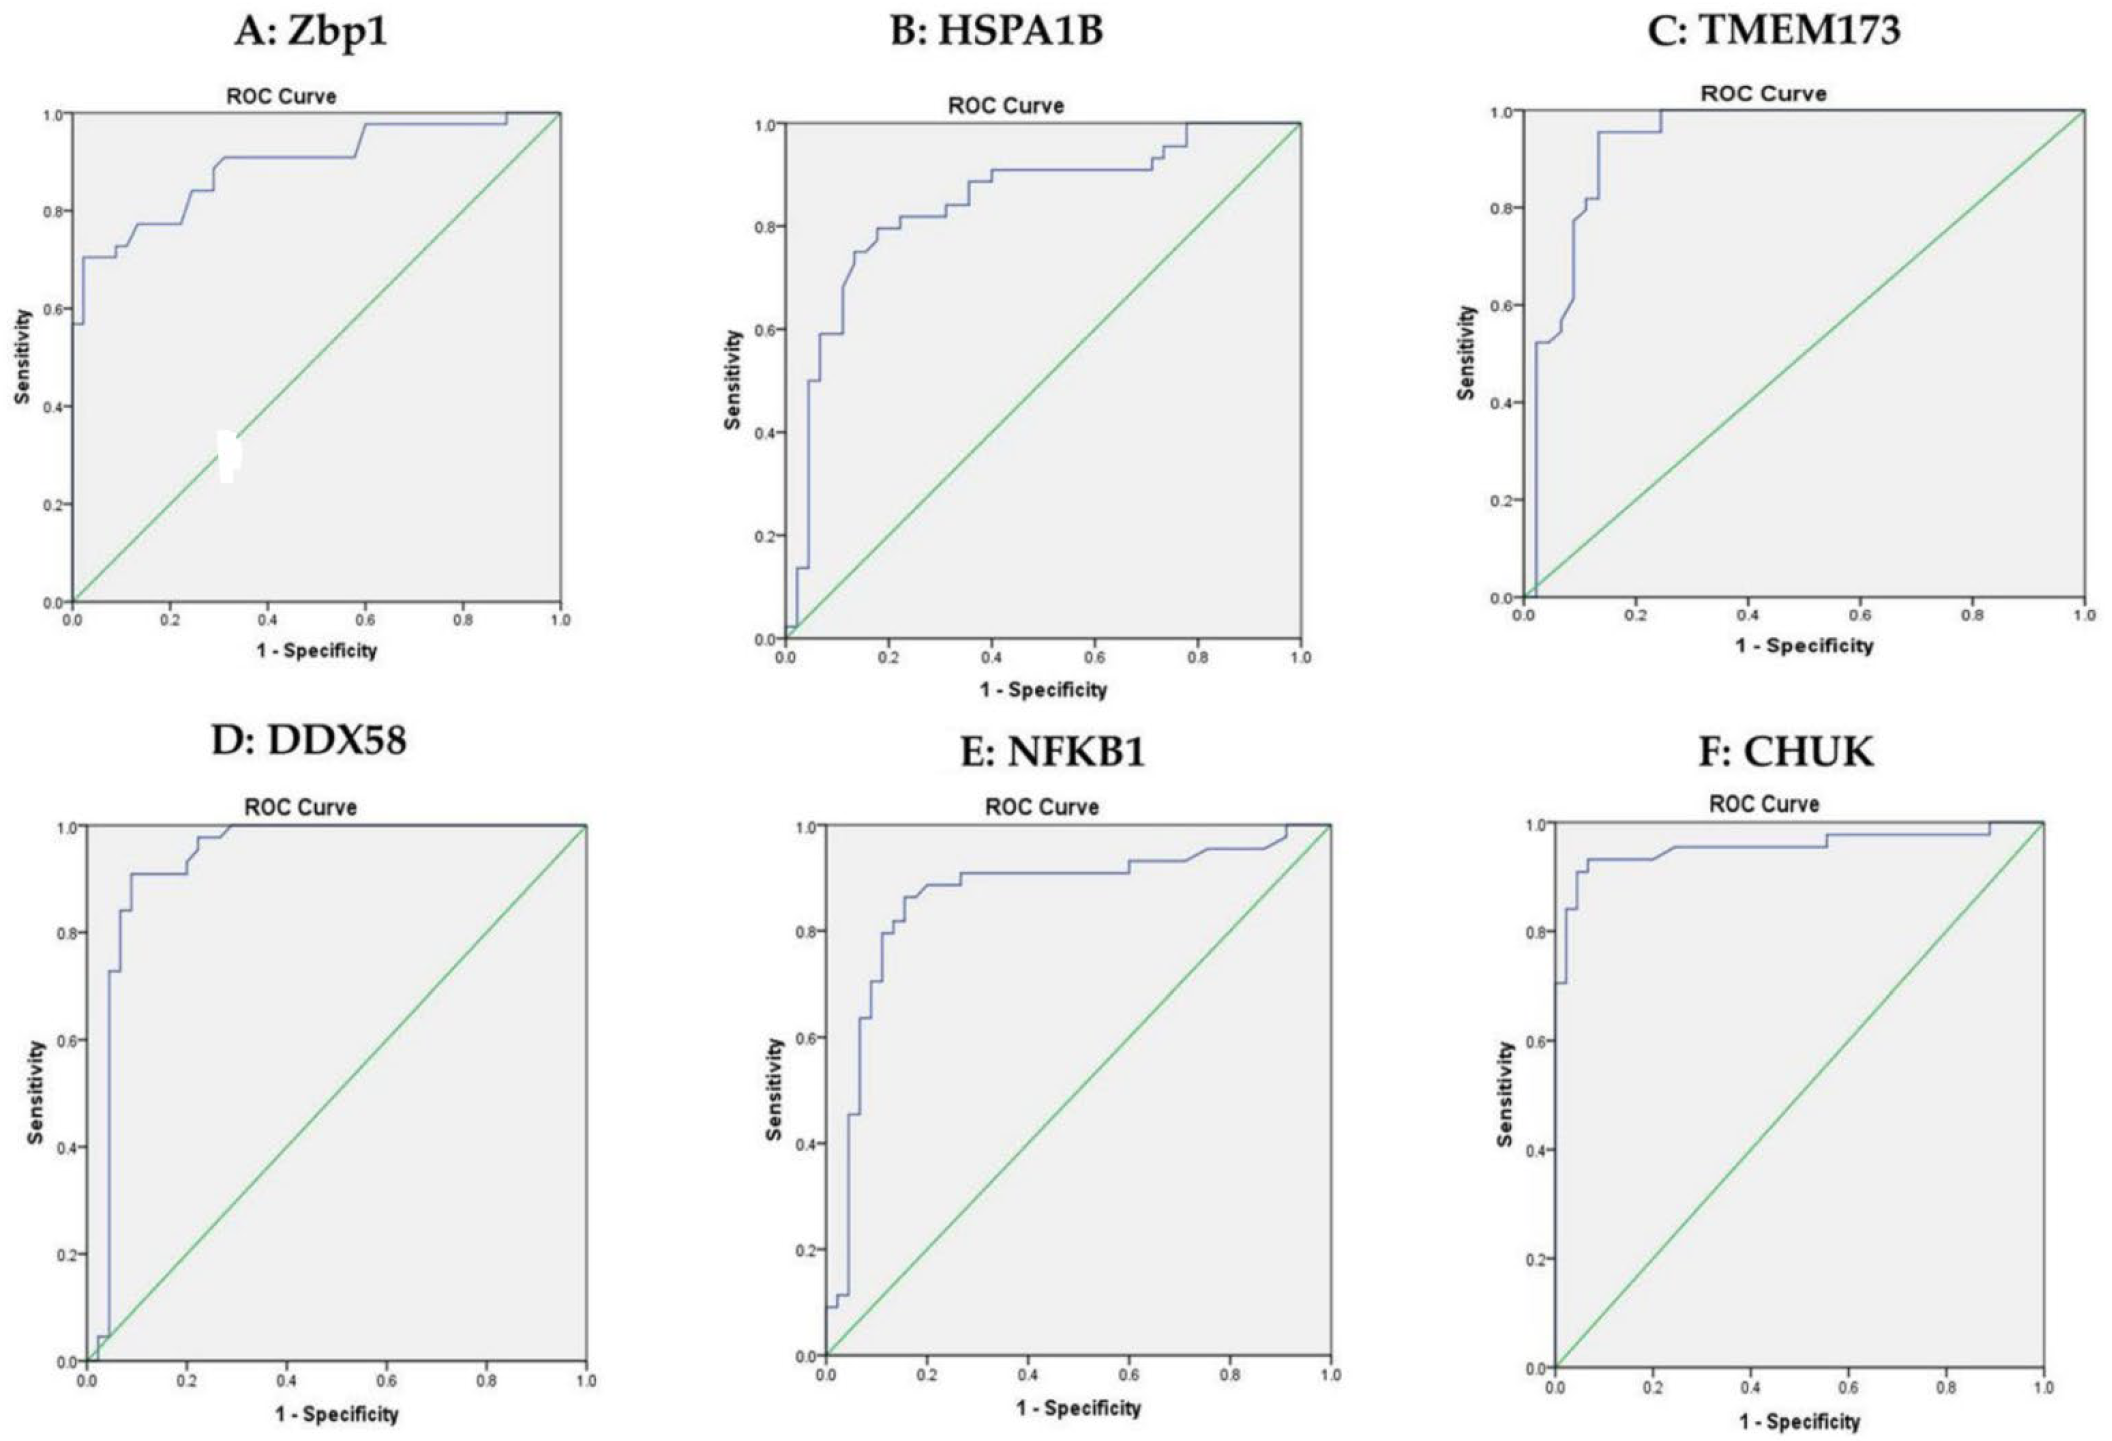
3.3. The Expression of ZBP1, HSPA1B, TMEM173, DDX58, NFKB1 and CHUK in the Sera Samples

The expression of ZBP1, HSPA1B, TMEM173, DDX58, NFKB1 and CHUK was estimated in the sera of all the study groups (Table 1). A Mann–Whitney test was performed; it was found that the 6 mRNAs were significantly highly expressed in the group with T2DM compared to the pre-DM group and the healthy controls. They were also significantly higher in the pre-DM group in relation to the healthy controls, as shown in Figure 1A–F. Of note, there was a significant progressive increase in the expression levels of ZBP1, HSPA1B, TMEM173, DDX58, NFKB1 and CHUK from healthy to pre-diabetic by 5, 3.5-, 40-, 84-, 14.3- and 31-folds, respectively), and from the pre-DM group; T2DM individuals by 10.5-, 3.7-, 19.5-, 9.5-, 23- and 3.6-folds, respectively).
Patients with T2DM were further divided into 2 groups regarding their glycemic control. HbA1c < 7% was considered good glycemic control, while HbA1c ≥ 7% was considered poor glycemic control. There was significant upregulation in the expression of (Zbp1 and DDX58) in the poor glycemic control group compared to individuals with good glycemic control (p = 0.0241 and 0.054, respectively). Interestingly, HSPA1B showed higher expression in patients with HOMA-IR ≥ 2.5 compared to the other group (p = 0.05) (Table 2).
We examined the degree of insulin resistance that could affect the expression of the mRNA panel, so, we divided the group with T2DM into two subgroups, one with insulin resistance (HOMA-IR ≥ 2.5) and the other subgroup being insulin sensitive (HOMA-IR < 2.5). HSPA1B mRNA showed a significant difference in its expression regarding the insulin resistance (Table 3).
The optimum cutoff values of ZBP1, HSPA1B, TMEM173, DDX58, NFKB1 and CHUK used for discriminating patients with T2DM and the control groups were calculated using ROC curves. ZBP1 was 3.25, HSPA1B was 4.7817, TMEM173 was 4.005, DDX58 was 7.750, NFKB1 was 6.525 and CHUK was 3.640 with sensitivity of 88.5%, 91.8%, 93.4%, 93.4%, 96.7%, 96.7%, respectively, as shown in Figure 2A–F.
ROC curve analysis was performed to discriminate between the groups with pre-DM and T2DM; the optimum cutoff values of ZBP1, HSPA1B, TMEM173, DDX58, NFKB1 and CHUK were 15.590, 6.898, 12.751, 26.5700, 17.350 and 17.740 with sensitivity of 75.4%, 85.2%, 90.2%, 85.2%, 90.2%, 73.8%, respectively, as shown in Figure 3A–F.
ROC curve analysis has been also used to discriminate between the healthy control group and the group with pre-DM. The optimum cutoff values of ZBP1, HSPA1B, TMEM173, DDX58, NFKB1 and CHUK were 1.600, 2.341, 1.800, 1.220, 1.580 and 2.050 with sensitivity of 88.6%, 81.8%, 95.5%, 97.7%, 88.6%, 93.2%, respectively, as shown in Figure 4A–F.
The best combination was that of ZBP1, TMEM173 and NFKB1 to discriminate between pre-DM and the development of T2DM, with sensitivity of 100%, specificity of 68.2% and accuracy of 86.6%. Linear regression analysis for prediction of pre-DM revealed that the most significant variable for prediction of preDM was LDLc (p value 0.001), (Standardized Coefficients Beta 0.429 followed by HSPA1B (p value 0.014), (Standardized Coefficients Beta 0.118); then NFKB1 (p value 0.031), (Standardized Coefficients Beta 0.113) (Supplementary Table S2).

3.4. Correlation Analysis

There was high significant positive correlation between the 6 chosen mRNAs among all studied groups and also among the T2DM group and pre-DM group, as seen in Table 4. Thus, we can hypothesize that the chosen RNA panel works in synergy to modulate STING and NOD signaling with a crucial role in T2DM pathogenesis. Also, there was a significant positive correlation between the 6 mRNAs and the important clinicopathological factors, while with the HOMA-B, there was significant negative correlation, as shown in Table 5. Also, we found a significant direct association between HOMA-IR with the chosen gene expression levels, ensuring their role in the presence of inflammation in T2DM (Table 5).

4. Discussion

T2DM is a very common form of DM characterized by high glucose level accompanied by insulin resistance and impairment in insulin secretion. T2DM represents around 90% of all diabetic cases [36]. Prediabetes shows high probability to developing T2DM. The different serious complications associated with chronic hyperglycemia as neuropathy, coronary heart diseases, retinopathy and nephropathy could already be seen among prediabetic patients [37]. That is why there is a great need for new methods for early detection of prediabetes.
Both the STING and NLRs pathways are mediated through different adaptor proteins, commonly found to activate the NF-kB, which induces the expression of proinflammatory cytokines. It has been suggested that STING and NLRs have a significant role in the pathogenesis of inflammation-mediated insulin resistance, which further develops metabolic complications [38]. In light of these finding, we have selected a set of six mRNAs related to STING and NLRs pathways and T2DM pathogenesis from public microarray databases. Afterwards, we studied their expression profile in sera samples to investigate its role in prediabetes and T2DM. We identified the level of expression of ZBP1, HSPA1B, TMEM173, DDX58, NFKB1 and CHUK mRNAs among all the studied groups and they are highly detected in the blood of pre-DM and T2DM patients. Raising the susceptibility of using this network as a circulating biomarker for early detection and stratification of T2DM modes may act as potential therapeutic targets.
The cGAS-cGAMP-STING pathway plays an important role in mediating inflammatory responses and may have a significant role in insulin resistance in T2DM. Qiao, J. et al. 2022 found that TMEM173 (STING1) deficiency significantly improved glucose intolerance, while neither the basal insulin level nor glucose-induced insulin secretion was increased in STING−/− mice. They stated also that high-fat-diet (HFD)-fed mice (STING−/− mice) showed lower levels of triacyl glycerol and cholesterol in comparison with the control group [8]. These results went hand in hand with our study that TMEM173 (STING1) was highly significant in patients with T2DM in comparison with the group with pre-DM and healthy controls. A previous study by Jiao et al., in 2020, suggested that activation of ZBP1 may lead to necrosis and chronic inflammation through triggering receptor-interacting serine/threonine-protein kinase 3 (RIPK3) [39]. A study made by Lei, Y. et al., in 2022, stated that ZBP1 can be considered a new regulator of IFN-1-mediated disease progression, acting on the cGAS-STING pathway to sense mitochondrial DNA (mtDNA) instability and sustain IFN-1 signaling, which has a role in heart failure and cardiac cell remodeling [15]. Previous studies found that single-point mutations in genes responsible for innate immunity as DDX58 might have a role in the risk of developing T1DM [40]. Consistent with our results, An.,T. et al., in 2020, performed a whole exons sequencing for obese patients with T2DM, and the DDX58 gene was one of the mutated genes that was differentially expressed in the T2DM patients [41]. On the other hand, another study found that DDX58 (RIG1) deficiency promotes insulin resistance induced by a high-fat diet in mice [42].
NLR signaling acts as critical regulator of inflammatory response triggered by the STING pathway [43]. NLRs are pathogen recognition receptors, which play a crucial role in the innate immune system that could activate the NF-kB, stimulating the expression of proinflammatory cytokines highlighting their crosstalk inflammation-mediated insulin resistance [44]. Mir et al. stated that HSP 70 gene polymorphism, the HSPA1B genotype, has been related to the severity of diabetic foot ulcers and the outcome of surgical treatment [45]. Polymorphisms in the HSPA1B and HSPA1L genes are associated with higher circulating concentrations of the inflammatory cytokines TNF-α and interleukin (IL) 6 [46]. The CHUK gene is an inhibitor of nuclear factor kappa-B kinase subunit alpha, which plays a significant role in the regulation of immune response, epidermal differentiation and keratinocyte migration [47]. Suppression of IκB kinase (IKK) and IKK-related kinases has been assessed as a potential therapeutic option for inflammatory diseases and tumors [48].
NF-κB is the core terminal effector in the pathogenesis of inflammation-mediated insulin resistance and muscle loss in diabetic patients [49,50]. Stimuli such as hyperglycemia, FFAs and reactive oxygen species could activate IκB kinase (IKK), leading to IκB ubiquitination and proteasomal degradation that can inhibit NF-κB [51]. Increased IKK/NF-κB signaling may inhibit insulin signaling through the insulin receptor, through NF-κB-mediated inflammatory proteins expression [52].
In the current pilot study, the expressions of ZBP1, DDX58, NFKB1 and CHUK were significantly higher in the T2DM group compared to either healthy control or pre-DM patients, which may give us new predictive markers for the development of T2DM in prediabetes patients. The expression of ZBP1 and NFKB1 mRNA could discriminate between the good and the poor glycemic control groups. HSPA1B mRNA showed a significant difference in its expression regarding the insulin resistance. Linear regression analysis revealed that LDLc, HSPA1B and NFKB1 were significant variables for prediction of pre-DM. To the best of our knowledge, it is a new finding that addresses the role of ZBP1, HSPA1B in the progression of T2DM. The study was limited by a relatively small sample size from a single center in Egypt. More in vitro and in vivo functional studies are needed to verify the mechanisms of RNA–RNA crosstalk in T2DM different modes.

5. Conclusions

In the current pilot study, we have estimated the expression of different mRNAs implicated in the cGAS-STING pathway as ZBP1, DDX58 and TMEM173 (STING1) and mRNAs involved with a NOD-like receptor pathway as HSPA1B and CHUK; all the investigated mRNA eventually affect NFKB expression, which was also measured. The mRNA panel was highly expressed in the sera of patients with T2DM in comparison with the pre-DM patients (Figure 4). These findings may have a promising impact in predicting the risk of T2DM individuals.

Supplementary Materials

The following supporting information can be downloaded at: https://www.mdpi.com/article/10.3390/biom12091230/s1, Figure S1. Showing the retrieval of NFKB1 as an important effector in the pathway of type 2 DM development, Figure S2. showing the retrieval of STING1 (TMEM173) as an important intermediate in cGAS/CGAMP/STING pathway, Figure S3. Showing the retrieval of ZBP1 as an important intermediate in Cgas/CGAMP/STING pathway, Figure S4. showing the retrieval of DDX58 as an important intermediate in cGAS/CGAMP/STING pathway, Figure S5. showing the retrieval of CHUK as an important intermediate in cGAS/CGAMP/STING pathway, Figure S6. showing the retrieval of HSPA1B as an important intermediate in NOD like receptor pathway, Figure S7. showing the STRING interaction between the 6 chosen mRNAs (TMEM173, DDX58, ZBP1, CHUK, NFKB1 and HSPA1B) obtained from Gene Cards data base, Table S1. The research group’s medical and physical characteristics.

Author Contributions

H.S.A. participated in funding and supervision. M.S.E.M. shared in resource acquisition. M.S.A.H. handled supervision, shared in the original drafting, reviewing, and editing. M.M. contributed to data creation, methodology, validation, original drafting, investigation, reviewing, and editing. S.H.A.A. shared in the methodology and investigation. M.S.B. contributed to data acquisition, formal analysis, validation, and review. All authors have read and agreed to the published version of the manuscript.

Funding

This study was funded by the Academy of Scientific Research and Technology, Egypt, JESOR call 2019 ID 5090.

Institutional Review Board Statement

The study was done based on the guidelines of the Declaration of Helsinki, and received approval from the Research Ethics Committee, Faculty of Medicine, Ain Shams University, Egypt, dated 21/7/2020, FWA 000017585.

Informed Consent Statement

Informed consent was obtained from all subjects involved in the study.

Data Availability Statement

Data presented are available on request by the corresponding authors.

Conflicts of Interest

All the authors have no conflict of interest to disclose.

Abbreviations

T2DMType 2 Diabetes Mellitus
STINGDNA-sensing stimulator of interferon genes
NLRNOD-like receptor
MENAMiddle East and North Africa
mRNAmessenger ribonucleic acid
NF-κBnuclear factor-kappa beta
cGAScyclic GMP AMP synthase
NODnucleotide-binding oligomerization domain-containing protein
TMEM173transmembrane protein 173
ZBP1Z-DNA-binding protein 1
IRFinterferon regulatory factor
RIG-Iretinoic acid inducible gene 1
HSPHeat shock protein
PGNpeptidoglycans
DDX58DexD/H-Box Helicase 58
MAVsmitochondrial antiviral signaling
MHCMajor histocompatibility complex
CHUKconserved helix–loop–helix ubiquitous kinase
IKK αInhibitor-κB kinase α
mTORC1mammalian target of rapamycin complex 1
NLRC3NLR family domain-containing protein 3
FFAfree fatty acids
LPSlipopolysachrides
KEGGKyoto Encyclopedia of Genes and Genomes
PBMCsPeripheral Blood Mononuclear Cells
PAMPsPathogen-associated molecular pattern
DAMPsDamage-associated molecular pattern
HSPA1BHeat Shock Protein Family A (Hsp70) Member 1B
PPIProtein–protein interaction
ADAThe American Diabetes Association
BMIBody Mass Index
HOMA-IRHomeostatic Model Assessment of Insulin Resistance
FSIfasting serum Insulin
FSGfasting serum glucose
HOMA-BHomeostatic Model Assessment of beta cell function
TCtotal cholesterol
TGtriglyceride
HDL-chigh density lipoprotein- cholesterol
LDL-clow density lipoprotein- cholesterol
GAPDHglyceraldehyde 3 phosphate dehydrogenase
PCRpolymerase chain reaction
CTcycle threshold
SPSSThe Statistical Package for the Social Sciences
ANOVAAnalysis of Variance
ROC curveReceiver operating characteristic
HFDHigh-fat diet
RIPK3Receptor-interacting serine/threonine-protein kinase 3
mtDNAmitochondrial DNA
TNF-αTumor necrosis factor alpha
ILinterleukin
IKKIκB kinase

References

  1. American Diabetes Association. Introduction: Standards of Medical Care in Diabetes—2022. Diabetes Care 2021, 45 (Suppl. S1), S1–S2. [Google Scholar] [CrossRef]
  2. International Diabetes Federation. IDF Diabetes Atlas, 9th ed.; International Diabetes Federation: Brussels, Belgium, 2021. [Google Scholar]
  3. El-Kebbi, I.M.; Bidikian, N.H.; Hneiny, L.; Nasrallah, M.P. Epidemiology of type 2 diabetes in the Middle East and North Africa: Challenges and call for action. World J. Diabetes 2021, 12, 1401–1425. [Google Scholar] [CrossRef] [PubMed]
  4. 4American Diabetes Association. Classification and Diagnosis of Diabetes: Standards of Medical Care in Diabetes—2021. Diabetes Care 2021, 44 (Suppl. S1), S15–S33. [Google Scholar] [CrossRef] [PubMed]
  5. American Diabetes Association. Diagnosis and classification of diabetes mellitus. Diabetes Care  2014, 37 (Suppl. S1), S81–S90. [Google Scholar] [CrossRef]
  6. Fukuda, H.; Mizobe, M. Impact of nonadherence on complication risks and healthcare costs in patients newly-diagnosed with diabetes. Diabetes Res. Clin. Pract. 2016, 123, 55–62. [Google Scholar] [CrossRef] [PubMed]
  7. Vasu, S.; Kumano, K.; Darden, C.M.; Rahman, I.; Lawrence, M.C.; Naziruddin, B. MicroRNA Signatures as Future Biomarkers for Diagnosis of Diabetes States. Cells 2019, 8, 1533. [Google Scholar] [CrossRef] [PubMed]
  8. Qiao, J.; Zhang, Z.; Ji, S.; Liu, T.; Zhang, X.; Huang, Y.; Feng, W.; Wang, K.; Wang, J.; Wang, S.; et al. A distinct role of STING in regulating glucose homeostasis through insulin sensitivity and insulin secretion. Proc. Natl. Acad. Sci. USA 2022, 119, e2101848119. [Google Scholar] [CrossRef]
  9. Yang, Q.; Ouyang, J.; Sun, F.; Yang, J. Short-Chain Fatty Acids: A Soldier Fighting against Inflammation and Protecting from Tumorigenesis in People with Diabetes. Front. Immunol. 2020, 11, 590685. [Google Scholar] [CrossRef]
  10. Scheithauer, T.P.M.; Rampanelli, E.; Nieuwdorp, M.; Vallance, B.A.; Verchere, C.B.; Van Raalte, D.H.; Herrema, H. Gut Microbiota as a Trigger for Metabolic Inflammation in Obesity and Type 2 Diabetes. Front. Immunol. 2020, 11, 571731. [Google Scholar] [CrossRef]
  11. Chen, Q.; Sun, L.; Chen, Z.J. Regulation and function of the cGAS–STING pathway of cytosolic DNA sensing. Nat. Immunol. 2016, 17, 1142–1149. [Google Scholar] [CrossRef]
  12. Mao, Y.; Luo, W.; Zhang, L.; Wu, W.; Yuan, L.; Xu, H.; Song, J.; Fujiwara, K.; Abe, J.-I.; Lemaire, S.A.; et al. STING–IRF3 Triggers Endothelial Inflammation in Response to Free Fatty Acid-Induced Mitochondrial Damage in Diet-Induced Obesity. Arterioscler. Thromb. Vasc. Biol. 2017, 37, 920–929. [Google Scholar] [CrossRef] [PubMed]
  13. Bai, J.; Cervantes, C.; Liu, J.; He, S.; Zhou, H.; Zhang, B.; Cai, H.; Yin, D.; Hu, D.; Li, Z.; et al. DsbA-L prevents obesity-induced inflammation and insulin resistance by suppressing the mtDNA release-activated cGAS-cGAMP-STING pathway. Proc. Natl. Acad. Sci. USA 2017, 114, 12196–12201. [Google Scholar] [CrossRef] [PubMed]
  14. Wang, X.; Rao, H.; Zhao, J.; Wee, A.; Li, X.; Fei, R.; Huang, R.; Wu, C.; Liu, F.; Wei, L. STING expression in monocyte-derived macrophages is associated with the progression of liver inflammation and fibrosis in patients with nonalcoholic fatty liver disease. Lab. Investig. 2020, 100, 542–552. [Google Scholar] [CrossRef] [PubMed]
  15. Lei, Y.; Vanportfliet, J.J.; Chen, Y.F.; Bryant, J.D.; Ragan, K.B.; Tong, C.W.; West, L.C.; Bosenberg, M.W.; Li, P.; Shadel, G.S.; et al. ZBP1 sequesters cGAS in the cytoplasm and sustains type I interferon responses to mitochondrial DNA. bioRxiv 2022. [Google Scholar] [CrossRef]
  16. Peng, R.; Wang-Kan, X.; Idorn, M.; Zhou, F.Y.; Orozco, S.L.; McCarthy, J.; Leung, C.S.; Lu, X.; Bagola, K.; Rehwinkel, J.; et al. ZBP1 induces inflammatory signaling via RIPK3 and promotes SARS-CoV-2-induced cytokine expression. bioRxiv 2021. [Google Scholar] [CrossRef]
  17. Rebsamen, M.; Heinz, L.; Meylan, E.; Michallet, M.; Schroder, K.; Hofmann, K.; Vazquez, J.; A Benedict, C.; Tschopp, J. DAI/ZBP1 recruits RIP1 and RIP3 through RIP homotypic interaction motifs to activate NF-κB. EMBO Rep. 2009, 10, 916–922. [Google Scholar] [CrossRef]
  18. Gautheron, J.; Vucur, M.; Schneider, A.T.; Severi, I.; Roderburg, C.; Roy, S.; Bartneck, M.; Schrammen, P.; Diaz, M.B.; Ehling, J.; et al. The necroptosis-inducing kinase RIPK3 dampens adipose tissue inflammation and glucose intolerance. Nat. Commun. 2016, 7, 11869. [Google Scholar] [CrossRef]
  19. Yoneyama, M.; Kikuchi, M.; Natsukawa, T.; Shinobu, N.; Imaizumi, T.; Miyagishi, M.; Taira, K.; Akira, S.; Fujita, T. The RNA helicase RIG-I has an essential function in double-stranded RNA-induced innate antiviral responses. Nat. Immunol. 2004, 5, 730–737. [Google Scholar] [CrossRef]
  20. Schertzer, J.D.; Tamrakar, A.K.; Magalhães, J.G.; Pereira, S.; Bilan, P.J.; Fullerton, M.D.; Liu, Z.; Steinberg, G.R.; Giacca, A.; Philpott, D.J.; et al. NOD1 Activators Link Innate Immunity to Insulin Resistance. Diabetes 2011, 60, 2206–2215. [Google Scholar] [CrossRef]
  21. Rivers, S.L.; Klip, A.; Giacca, A. NOD1: An Interface Between Innate Immunity and Insulin Resistance. Endocrinology 2019, 160, 1021–1030. [Google Scholar] [CrossRef]
  22. Chan, K.L.; Tam, T.H.; Boroumand, P.; Prescott, D.; Costford, S.R.; Escalante, N.K.; Fine, N.; Tu, Y.; Robertson, S.J.; Prabaharan, D.; et al. Circulating NOD1 activators and hematopoietic NOD1 contribute to metabolic inflammation and insulin resistance. Cell Rep. 2017, 18, 2415–2426. [Google Scholar] [CrossRef] [PubMed]
  23. Mohanan, V.; Grimes, C.L. The Molecular Chaperone HSP70 Binds to and Stabilizes NOD2, an Important Protein Involved in Crohn Disease. J. Biol. Chem. 2014, 289, 18987–18998. [Google Scholar] [CrossRef]
  24. Brudzynski, K. Insulitis-caused redistribution of heat-shock protein HSP60 inside beta-cells correlates with induction of HSP60 autoantibodies. Diabetes 1993, 42, 908–913. [Google Scholar] [CrossRef] [PubMed]
  25. Juwono, J.; Martinus, R.D. Does Hsp60 Provide a Link between Mitochondrial Stress and Inflammation in Diabetes Mellitus? J. Diabetes Res. 2016, 2016, 8017571. [Google Scholar] [CrossRef] [PubMed]
  26. Li, X.; Hu, Y. Attribution of NF-κB Activity to CHUK/IKKα-Involved Carcinogenesis. Cancers 2021, 13, 1411. [Google Scholar] [CrossRef]
  27. Bai, J.; Liu, F. The cGAS-cGAMP-STING Pathway: A Molecular Link Between Immunity and Metabolism. Diabetes 2019, 68, 1099–1108. [Google Scholar] [CrossRef]
  28. Zhang, L.; Mo, J.; Swanson, K.V.; Wen, H.; Petrucelli, A.; Gregory, S.M.; Zhang, Z.; Schneider, M.; Jiang, Y.; Fitzgerald, K.A.; et al. NLRC3, a Member of the NLR Family of Proteins, Is a Negative Regulator of Innate Immune Signaling Induced by the DNA Sensor STING. Immunity 2014, 40, 329–341. [Google Scholar] [CrossRef]
  29. Prajapati, B.; Jena, P.K.; Rajput, P.; Purandhar, K.; Seshadri, S. Understanding and Modulating the Toll Like Receptors (TLRs) and NOD Like Receptors (NLRs) Cross Talk in Type 2 Diabetes. Curr. Diabetes Rev. 2014, 10, 190–200. [Google Scholar] [CrossRef]
  30. American Diabetes Association. Standards of Medical Care in Diabetes—2010. Diabetes Care 2010, 33 (Suppl. S1), 2010. [Google Scholar]
  31. Chobanian, A.V.; Bakris, G.L.; Black, H.R.; Cushman, W.C.; Green, L.A.; Izzo, J.L., Jr.; Jones, D.W.; Materson, B.J.; Oparil, S.; Wright, J.T., Jr.; et al. The seventh report of the joint national committee on prevention, detection, evaluation, and treatment of high blood pressure: The JNC 7 report. JAMA 2003, 289, 2560–2571. [Google Scholar] [CrossRef]
  32. WHO Expert Consultation. Appropriate body-mass index for Asian populations and its implications for policy and intervention strategies. Lancet 2004, 363, 157–163. [Google Scholar] [CrossRef]
  33. Gonen, B.; Rubenstien, A.H. Determination of glycohemoglobin. Diabetologia 1978, 15, 5. [Google Scholar]
  34. Świderska, E.; Strycharz, J.; Wróblewski, A.; Szemraj, J.; Drzewoski, J.; Śliwińska, A. Role of PI3K/AKT Pathway in Insulin-Mediated Glucose Uptake. In Blood Glucose Levels; Szablewski, L., Ed.; IntechOpen: London, UK, 2018. [Google Scholar]
  35. Livak, K.J.; Schmittgen, T.D. Analysis of relative gene expression data using real-time quantitative PCR and the 2−ΔΔCT method. Methods 2001, 25, 402–408. [Google Scholar] [CrossRef] [PubMed]
  36. Zhang, L.; Chu, J.; Hao, W.; Zhang, J.; Li, H.; Yang, C.; Yang, J.; Chen, X.; Wang, H. Gut Microbiota and Type 2 Diabetes Mellitus: Association, Mechanism, and Translational Applications. Mediat. Inflamm. 2021, 2021, 5110276. [Google Scholar] [CrossRef]
  37. Eleftheriadou, A.; Williams, S.; Nevitt, S.; Brown, E.; Roylance, R.; Wilding, J.P.H. The prevalence of cardiac autonomic neuropathy in prediabetes: A systematic review. Diabetologia 2021, 64, 288–303. [Google Scholar] [CrossRef]
  38. Menini, S.; Iacobini, C.; Vitale, M.; Pugliese, G. The Inflammasome in Chronic Complications of Diabetes and Related Metabolic Disorders. Cells 2020, 9, 1812. [Google Scholar] [CrossRef]
  39. Jiao, H.; Wachsmuth, L.; Kumari, S.; Schwarzer, R.; Lin, J.; Eren, R.O.; Fisher, A.; Lane, R.; Young, G.R.; Kassiotis, G.; et al. Z-nucleic-acid sensing triggers ZBP1-dependent necroptosis and inflammation. Nature 2020, 580, 391–395. [Google Scholar] [CrossRef]
  40. Blum, S.I.; Tse, H.M. Innate Viral Sensor MDA5 and Coxsackievirus Interplay in Type 1 Diabetes Development. Microorganisms 2020, 8, 993. [Google Scholar] [CrossRef]
  41. An, T.; Zhang, J.; Liu, Y.; Wu, Y.; Lian, J.; Wang, T.; Hu, Y.; Zhu, J.; Huang, J.; Zhao, D.; et al. Combined analysis of whole-exon sequencing and lncRNA sequencing in type 2 diabetes mellitus patients with obesity. J. Cell. Mol. Med. 2020, 24, 2451–2463. [Google Scholar] [CrossRef]
  42. Yang, G.; Lee, H.E.; Seok, J.K.; Kang, H.C.; Cho, Y.-Y.; Lee, H.S.; Lee, J.Y. RIG-I Deficiency Promotes Obesity-Induced Insulin Resistance. Pharmaceuticals 2021, 14, 1178. [Google Scholar] [CrossRef] [PubMed]
  43. Uppal, T.; Sarkar, R.; Dhelaria, R.; Verma, S.C. Role of Pattern Recognition Receptors in KSHV Infection. Cancers 2018, 10, 85. [Google Scholar] [CrossRef] [PubMed]
  44. Hasegawa, M.; Fujimoto, Y.; Lucas, P.C.; Nakano, H.; Fukase, K.; Nunez, G.; Inohara, N. A critical role of RICK/RIP2 polyubiquitination in Nod-induced NF-kappaB activation. EMBO J. 2008, 27, 373–383. [Google Scholar] [CrossRef] [PubMed] [Green Version]
  45. Mir, K.A.; Pugazhendhi, S.; Paul, M.J.; Nair, A.; Ramakrishna, B.S. Heat-shock protein 70 gene polymorphism is associated with the severity of diabetic foot ulcer and the outcome of surgical treatment. Br. J. Surg. 2009, 96, 1205–1209. [Google Scholar] [CrossRef] [PubMed]
  46. Schröder, O.; Schulte, K.-M.; Ostermann, P.; Röher, H.-D.; Ekkernkamp, A.; Laun, R.A. Heat shock protein 70 genotypes HSPA1B and HSPA1L influence cytokine concentrations and interfere with outcome after major injury. Crit. Care Med. 2003, 31, 73–79. [Google Scholar] [CrossRef]
  47. Haäcker, H.; Karin, M. Regulation and Function of IKK and IKK-Related Kinases. Sci. STKE 2006, 2006, re13. [Google Scholar] [CrossRef]
  48. Llona-Minguez, S.; Baiget, J.; Mackay, S.P. Small-molecule inhibitors of IκB kinase (IKK) and IKK-related kinases. Pharm. Pat. Anal. 2013, 2, 481–498. [Google Scholar] [CrossRef]
  49. Arkan, M.C.; Hevener, A.L.; Greten, F.R.; Maeda, S.; Li, Z.W.; Long, J.M.; Wynshaw-Boris, A.; Poli, G.; Olefsky, J.; Karin, M. IKK-beta links inflammation to obesity-induced insulin resistance. Nat. Med. 2005, 11, 191–198. [Google Scholar] [CrossRef]
  50. Tantiwong, P.; Shanmugasundaram, K.; Monroy, A.; Ghosh, S.; Li, M.; DeFronzo, R.A.; Cersosimo, E.; Sriwijitkamol, A.; Mohan, S.; Musi, N. NF-κB activity in muscle from obese and type 2 diabetic subjects under basal and exercise-stimulated conditions. Am. J. Physiol. Metab. 2010, 299, E794–E801. [Google Scholar] [CrossRef]
  51. Evans, J.L.; Goldfine, I.D.; Maddux, B.A.; Grodsky, G.M. Oxidative Stress and Stress-Activated Signaling Pathways: A Unifying Hypothesis of Type 2 Diabetes. Endocr. Rev. 2002, 23, 599–622. [Google Scholar] [CrossRef]
  52. Kim, J.K.; Kim, Y.J.; Fillmore, J.J.; Chen, Y.; Moore, I.; Lee, J.; Yuan, M.; Li, Z.W.; Karin, M.; Perret, P.; et al. Prevention of fat-induced insulin resistance by salicylate. J. Clin. Investig. 2001, 108, 437–446. [Google Scholar] [CrossRef]
Figure 1. Box plot representing the relative expression of ZBP1, HSPA1B, TMEM173, DDX58, NFKB1 and CHUK mRNAs among all the studied groups. (AF): Boxplot showing the differential expression of the 6 mRNAs among the 3 studied groups and Mann–Whitney test to analyze their expression between each 2 groups. a: The expression of the 6 mRNAs was highly significantly different between the group with pre-DM and the healthy controls. b: High significant difference in the expression of the 6 mRNAs between the T2DM group and the pre-DM group. c: High significant difference in the expression of the 6 mRNAs between the T2DM group and the healthy controls. ** highly significant p < 0.01.
Biomolecules 12 01230 g001
Figure 2. ROC curve analysis for the 6 mRNAs to discriminate between healthy controls and T2DM. (A): ROC curve analysis for serum Zbp1 used to calculate the best cutoff point to discriminate between T2DM and healthy controls. The best cutoff point for Zbp1 was ≥3.25 (sensitivity = 88.5%, specificity = 97.8%). (B): ROC curve analysis for serum HSPA1B used to calculate the best cutoff point to discriminate between the T2DM and healthy controls. The best cutoff point for HSPA1B was ≥4.7817 (sensitivity = 91.8%, specificity = 95.6%). (C): ROC curve analysis for serum TMEM173 used to calculate the best cutoff point to discriminate between the T2DM and healthy controls. The best cutoff point for TMEM173 was ≥4.005 (sensitivity = 93.4%, specificity = 97.8%). (D): ROC curve analysis for serum DDX58 used to calculate the best cutoff point to discriminate between the T2DM and healthy controls. The best cutoff point for DDX58 was ≥7.750 (sensitivity = 93.4%, specificity = 95.6%). (E): ROC curve analysis for serum NFKB1 used to calculate the best cutoff point to discriminate between the T2DM and healthy controls. The best cutoff point for NFKB1 was ≥6.525 (sensitivity = 96.7%, specificity = 95.6%) (F): ROC curve analysis for serum CHUK used to calculate the best cutoff point to discriminate between the T2DM and healthy controls. The best cutoff point for CHUK was ≥3.640 (sensitivity = 96.7%, specificity = 97.8%). Green line represents diagonal random classifier.
Biomolecules 12 01230 g002
Figure 3. Roc curve analysis for the 6 mRNAs to discriminate between the pre-DM group and T2DM. (A): ROC curve analysis for serum Zbp1 used to calculate the best cutoff point to discriminate between pre-DM and T2DM. The best cutoff point for Zbp1 was ≥15.590 (sensitivity = 75.4%, specificity = 90.9%). (B): ROC curve analysis for serum HSPA1B used to calculate the best cutoff point to discriminate between the pre-DM group and T2DM. The best cutoff point for HSPA1B was ≥6.898 (sensitivity = 85.2%, specificity = 77.3%). (C): ROC curve analysis for serum TMEM173 used to calculate the best cutoff point to discriminate between the pre-DM group and T2DM. The best cutoff point for TMEM173 was ≥12.751 (sensitivity = 90.2%, specificity = 88.6%. (D): ROC curve analysis for serum DDX58 used to calculate the best cutoff point to discriminate between the pre-DM group and T2DM. The best cutoff point for DDX58 was ≥26.5700 (sensitivity = 85.2%, specificity = 93.2%). (E): ROC curve analysis for serum NFKB1 used to calculate the best cutoff point to discriminate between the pre-DM group and T2DM. The best cutoff point for NFKB1 was ≥17.350 (sensitivity = 90.2%, specificity = 84.1%) (F): ROC curve analysis for serum CHUK used to calculate the best cutoff point to discriminate between the pre-DM group and T2DM. The best cutoff point for CHUK was ≥17.740 (sensitivity = 73.8%, specificity = 77.3%). Green line represents diagonal random classifier.
Biomolecules 12 01230 g003
Figure 4. ROC curve analysis for the 6 mRNAs to discriminate healthy controls and the pre-DM group. (A): ROC curve analysis for serum Zbp1 used to calculate the best cutoff point to discriminate healthy controls from pre-DM. The best cutoff point for Zbp1 was ≥1.600 (sensitivity = 88.6%, specificity = 71.7%). (B): ROC curve analysis for serum HSPA1B used to calculate the best cutoff point to discriminate between healthy controls and the pre-DM group. The best cutoff point for HSPA1B was ≥2.341 (sensitivity = 81.8%, specificity = 77.8%). (C): ROC curve analysis for serum TMEM173 used to calculate the best cutoff point to discriminate between healthy controls and the pre-DM group. The best cutoff point for TMEM173 was ≥1.800 (sensitivity = 95.5%, specificity = 86.7%). (D): ROC curve analysis for serum DDX58 used to calculate the best cutoff point to discriminate between healthy controls and the pre-DM group. The best cutoff point for DDX58 was ≥1.220 (sensitivity = 97.7%, specificity = 77.8%). (E): ROC curve analysis for serum NFKB1 used to calculate the best cutoff point to discriminate between healthy controls and the pre-DM group. The best cutoff point for NFKB1 was ≥1.580 (sensitivity = 88.6%, specificity = 80%). (F): ROC curve analysis for serum CHUK used to calculate the best cutoff point to discriminate between the healthy controls and pre-DM. The best cutoff point for CHUK was ≥2.050 (sensitivity = 93.2%, specificity = 93.3%).
Biomolecules 12 01230 g004
Table 1. The relative expression of the ZBP1, HSPA1B, TMEM173, DDX58, NFKB1 and CHUK mRNAs among all the studied groups.
mRNAsHealthy ControlsImpaired Glucose LevelT2DMχ2(c)p
MedianMean RankMedianMean RankMedianMean Rank
RQ ZBP1131.375.373.3756109.583.90.000 **
RQ HSPA1B1.332.34.668.017.1112.890.90.000 **
RQ TMEM1730.127.34.069.678.0115.3107.50.000 **
RQ DDX580.128.48.471.080.0113.599.90.000 **
RQ NFKB10.529.74.365.499.0116.6106.90.000 **
RQ CHUK0.426.212.576.745.0110.998.60.000 **
Kruskal–Wallis test, p: p value, ** p < 0.01: Highly Significant, RQ: Relative quantity (fold change) of gene expression.
Table 2. Relation between the expression of the 6 mRNAs and the glycemic control in the T2DM group.
Bad Glycemic Control HbA1c ≥ 7Good Glycemic Control HbA1c < 7U(d)p
MedianMean RankMedianMean Rank
Zbp1883329.517.43510.0241 **
HSPA1B18.232.5915.0328.183670.352
TMEM17369.0131.4583.530.20411.50.793
DDX588932.0871.529.093870.528
NFKB1122.833.3666.519.824370.05 *
CHUK4430.79110.931.364210.904
Mann–Whitney test: p value, ** p < 0.01: Highly Significant, * p < 0.05: Significant, p > 0.05: non-Significant.
Table 3. Relation between the expression of the 6 mRNAs and the insulin resistance in the T2DM group.
Insulin Resistance HOMA-IR ≥ 2.5Insulin Sensitive HOMA-IR < 2.5U(d)p
MedianMean RankMedianMean Rank
Zbp15631.555.127.7185.50.57
HSPA1B88.232.512.417.3134.50.05 *
TMEM1737830.5105.534.3185.50.57
DDX5866.630.29436.11710.38
NFKB18930.5174.834.2186.50.58
CHUK4530.213836.1171.50.39
Mann–Whitney test: p value, * p < 0.05: Significant, p > 0.05: non-Significant.
Table 4. Correlation analysis between the 6 mRNAs among all the studied groups and also among the group with pre-DM and the T2DM group.
Group RQ
(Zbp1)
RQ (HSPA1B)RQ (TMEM173)RQ (DDX58)RQ (NFKB1)RQ (CHUK)
All groupsRQ (Zbp1)Correlation Coefficient10.578 **0.606 **0.603 **0.642 **0.621 **
Sig.--------0.0000.0000.0000.0000.000
RQ (HSPA1B)Correlation Coefficient0.578 **10.626 **0.654 **0.616 **0.601 **
Sig.0.000--------0.0000.0000.0000.000
RQ (TMEM173)Correlation Coefficient0.606 **0.626 **10.740 **0.730 **0.739 **
Sig.0.0000.000--------0.0000.0000.000
RQ (DDX58)Correlation Coefficient0.603 **0.654 **0.740 **10.691 **0.652 **
Sig.0.0000.0000.000--------0.0000.000
RQ (NFKB1)Correlation Coefficient0.642 **0.616 **0.730 **0.691 **10.751 **
Sig.0.0000.0000.0000.000--------0.000
RQ (CHUK)Correlation Coefficient0.621 **0.601 **0.739 **0.652 **0.751 **1
Sig.0.0000.0000.0000.0000.000--------
Pre-DM group and T2DMRQ (Zbp1)Correlation Coefficient10.318 **0.374 **0.384 **0.463 **0.360 **
Sig.--------0.0010.0000.0000.0000.000
RQ (HSPA1B)Correlation Coefficient0.318 **10.368 **0.475 **0.403 **0.351 **
Sig.0.001--------0.0000.0000.0000.000
RQ (TMEM173)Correlation Coefficient0.374 **0.368 **10.433 **0.539 **0.466 **
Sig.0.0000.000--------0.0000.0000.000
RQ (DDX58)Correlation Coefficient0.384 **0.475 **0.433 **10.499 **0.297 **
Sig.0.0000.0000.000--------0.0000.002
RQ (NFKB1)Correlation Coefficient0.463 **0.403 **0.539 **0.499 **10.542 **
Sig.0.0000.0000.0000.000--------0.000
RQ (CHUK)Correlation Coefficient0.360 **0.351 **0.466 **0.297 **0.542 **1
Sig.0.0000.0000.0000.0020.000--------
Spearman correlation. p value, ** p < 0.01: Highly Significant, p > 0.05: non-Significant, RQ: Relative quantity (fold change) in gene expression.
Table 5. Correlation between the 6 mRNAs and the different clinicopathological factors.
RQ (Zbp1)RQ (HSPA1B)RQ (TMEM173)RQ (DDX58)RQ (NFKB1)RQ (CHUK)FSGHbA1cHOMA_IRHOMA-BBMITotal_Cholesterol
RQ (Zbp1)
RQ (HSPA1B)0.578 **
RQ (TMEM173)0.606 **0.626 **
RQ (DDX58)0.603 **0.654 **0.740 **
RQ (NFKB1)0.642 **0.616 **0.730 **0.691 **
RQ (CHUK)0.621 **0.601 **0.739 **0.652 **0.751 **
FSG0.571 **0.604 **0.657 **0.638 **0.681 **0.615 **
HbA1c0.505 **0.588 **0.567 **0.533 **0.652 **0.484 **0.671 **
HOMA_IR0.555 **0.572 **0.477 **0.489 **0.550 **0.438 **0.576 **0.572 **
HOMA-B−0.655 **−0.676 **−0.701 **−0.724 **−0.734 **−0.666 **−0.739 **−0.704 **−708 **
BMI0.500 **0.546 **0.578 **0.551 **0.512 **0.543 **0.491 **0.420 **0.428 **−0.495 **
Total_Cholesterol0.569 **0.606 **0.633 **0.590 **0.658 **0.612 **0.607 **0.656 **0.673 **−0.733 **0.747 **
LDLc0.575 **0.669 **0.655 **0.640 **0.702 **0.622 *0.670 **0.655 **0.678 **−0.744 **0.710 **0.879 **
* p < 0.05, ** p < 0.01.
Publisher’s Note: MDPI stays neutral with regard to jurisdictional claims in published maps and institutional affiliations.

