
Drosophila melanogaster as a Model Organism for Obesity and Type-2 Diabetes Mellitus by Applying High-Sugar and High-Fat Diets


Abstract
:1. Introduction
2. Materials and Methods
2.1. Fly Strains and Husbandry
2.2. Experimental Design
2.3. Survival
2.4. Climbing
2.5. Fly Weights
2.6. Glucose and Triglyceride Levels
2.7. Real-Time PCR Analysis
2.8. Statistical Analysis
3. Results
3.1. Survival
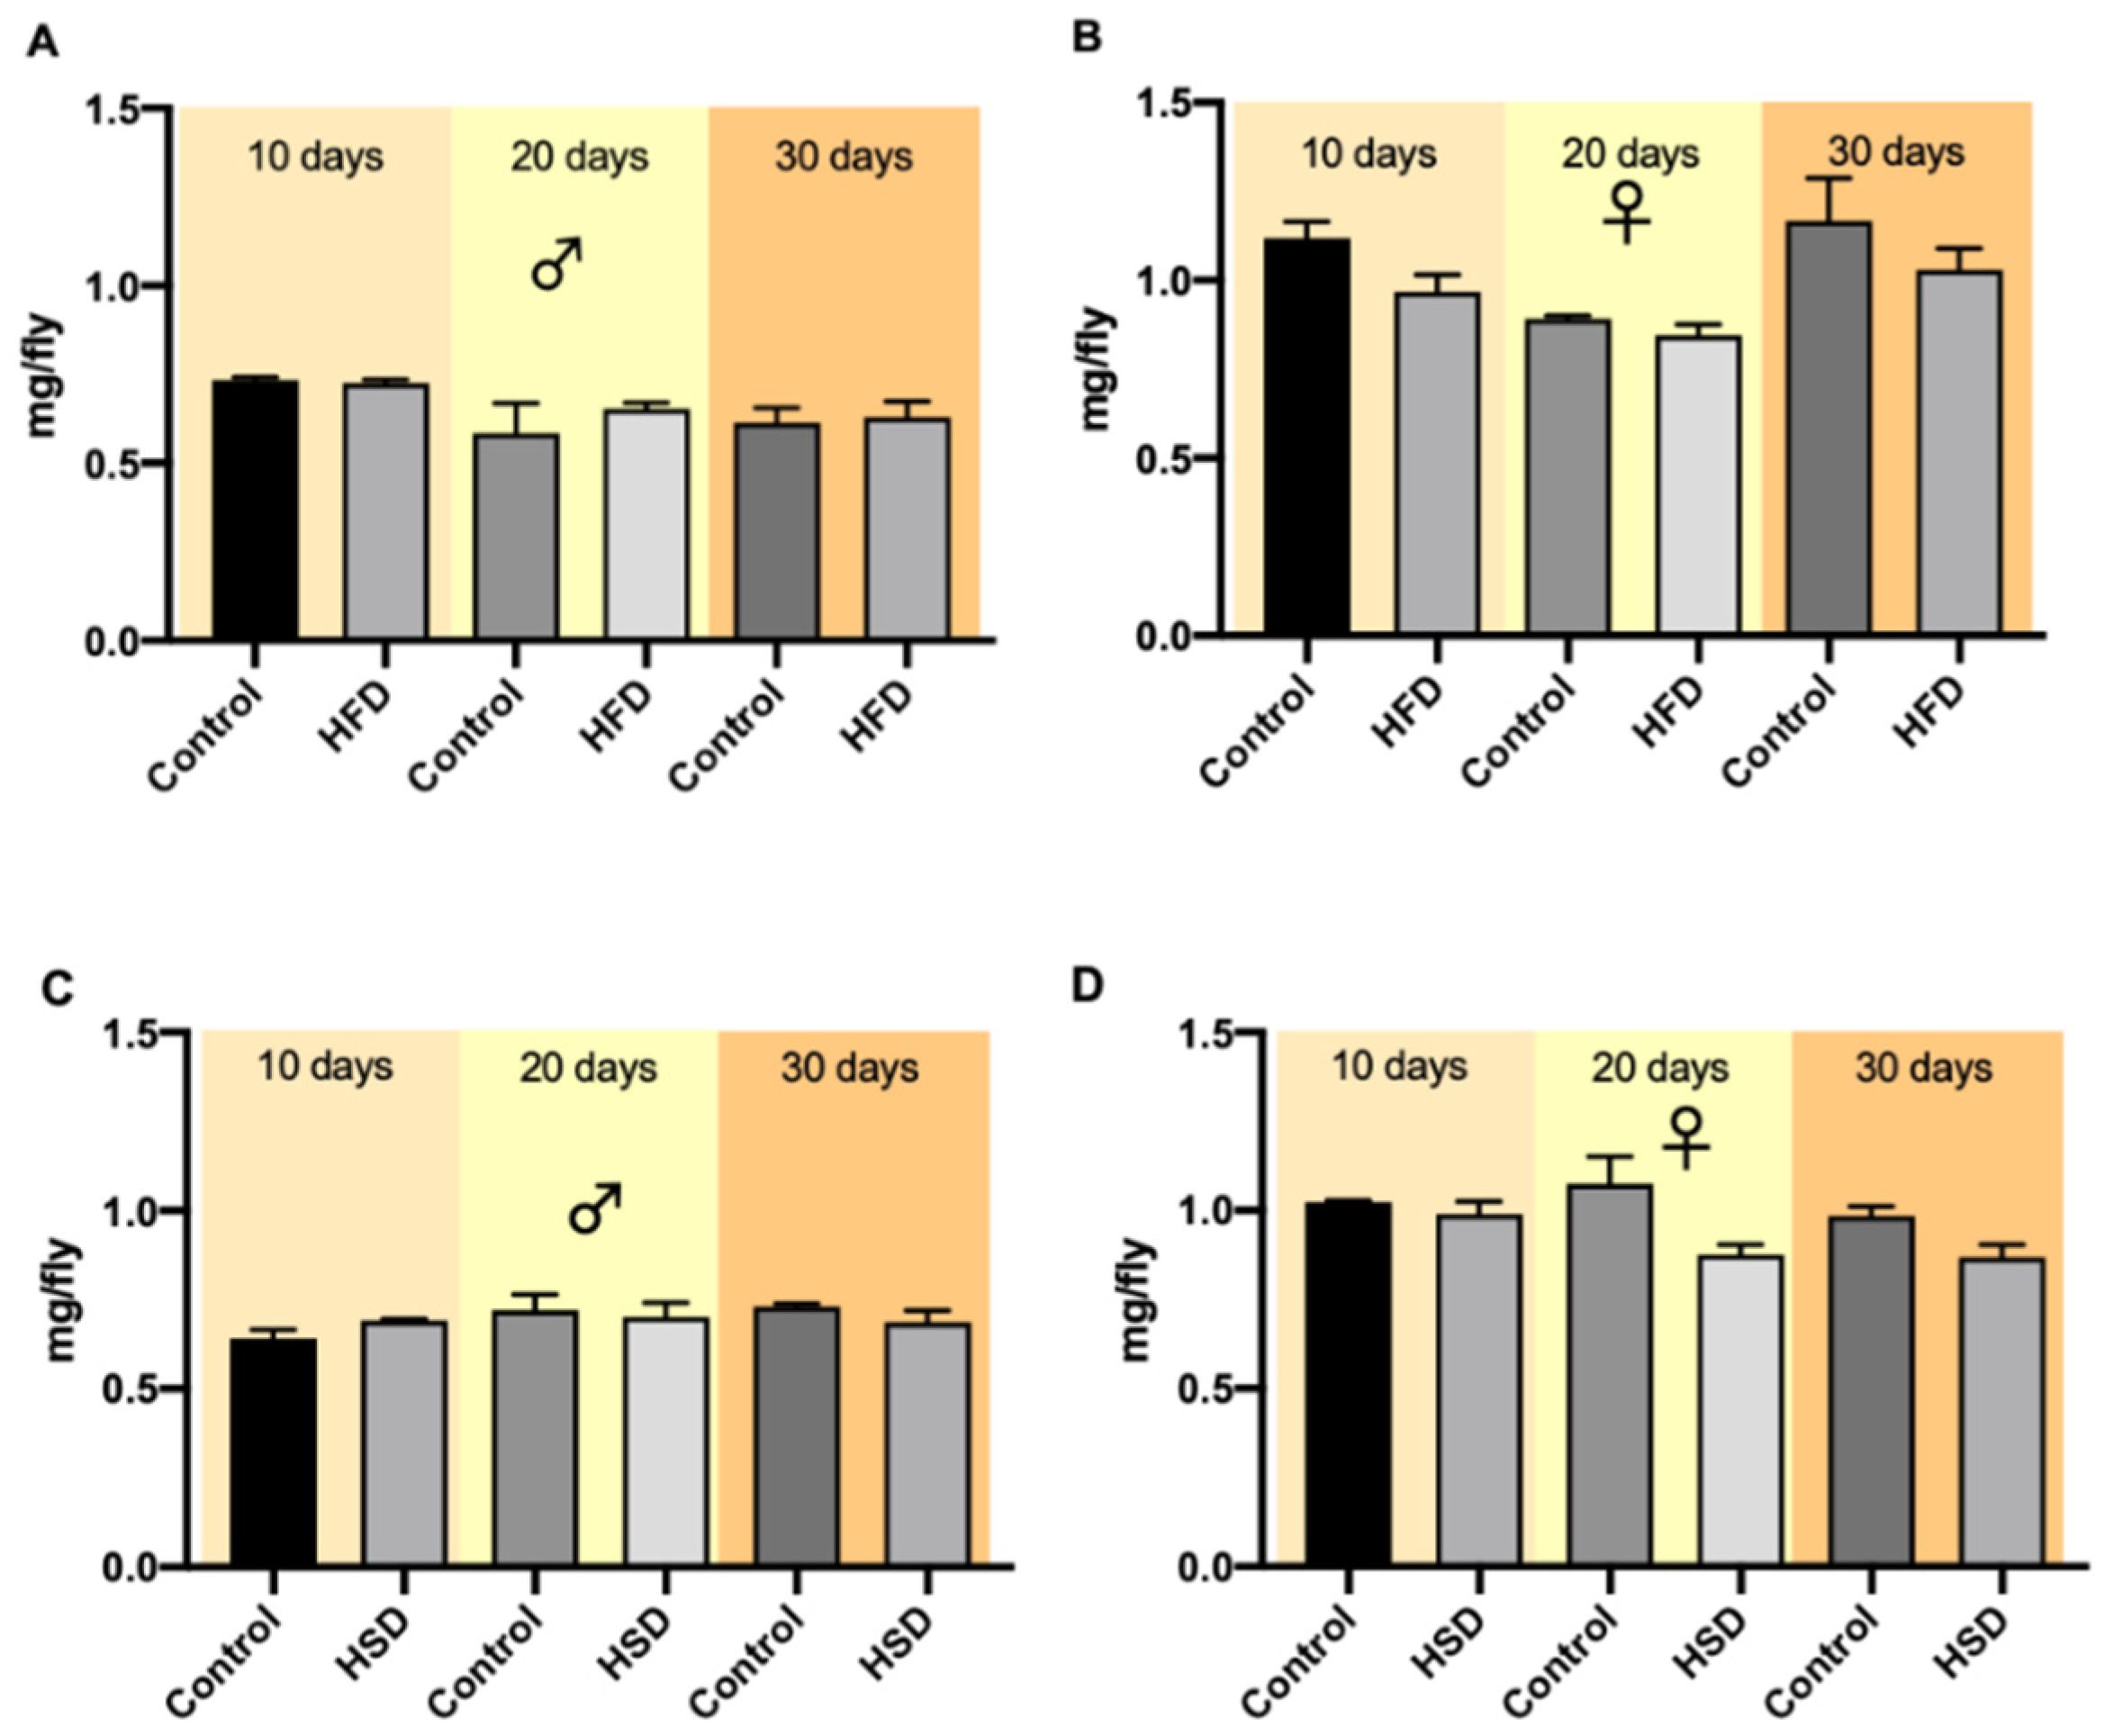
3.2. Weight Gain
3.3. Climbing
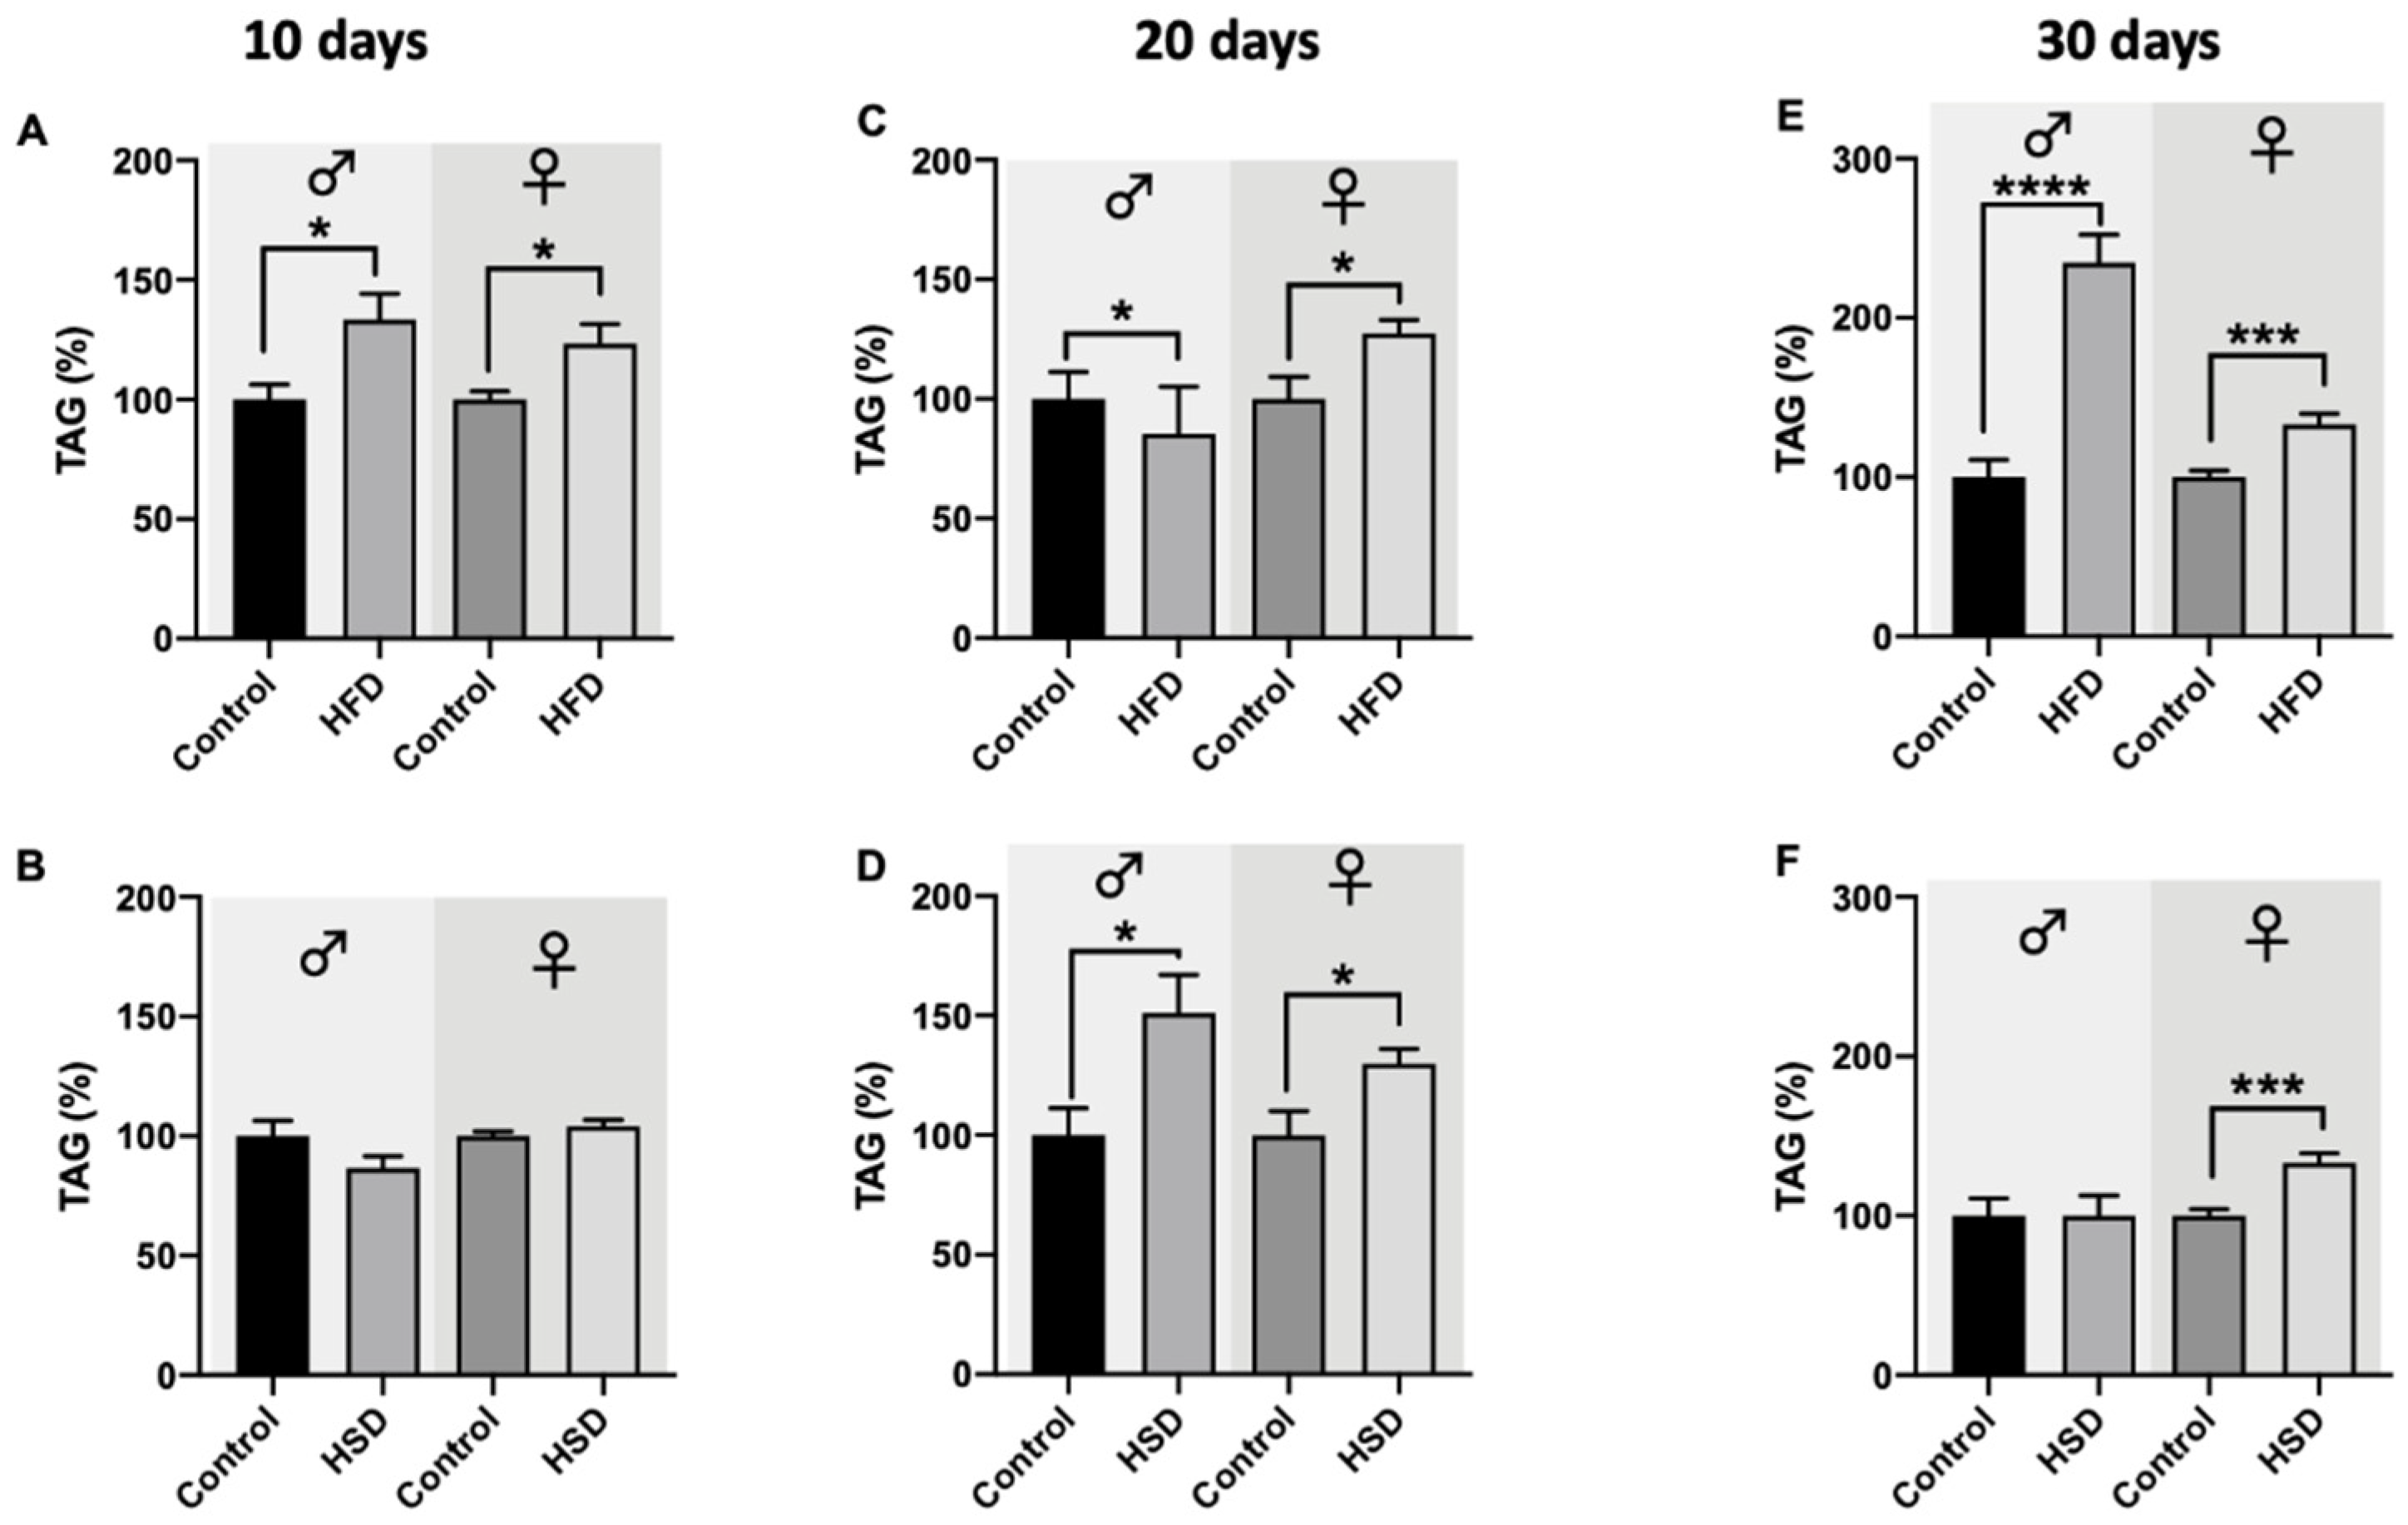
3.4. Glucose and Triglycerides
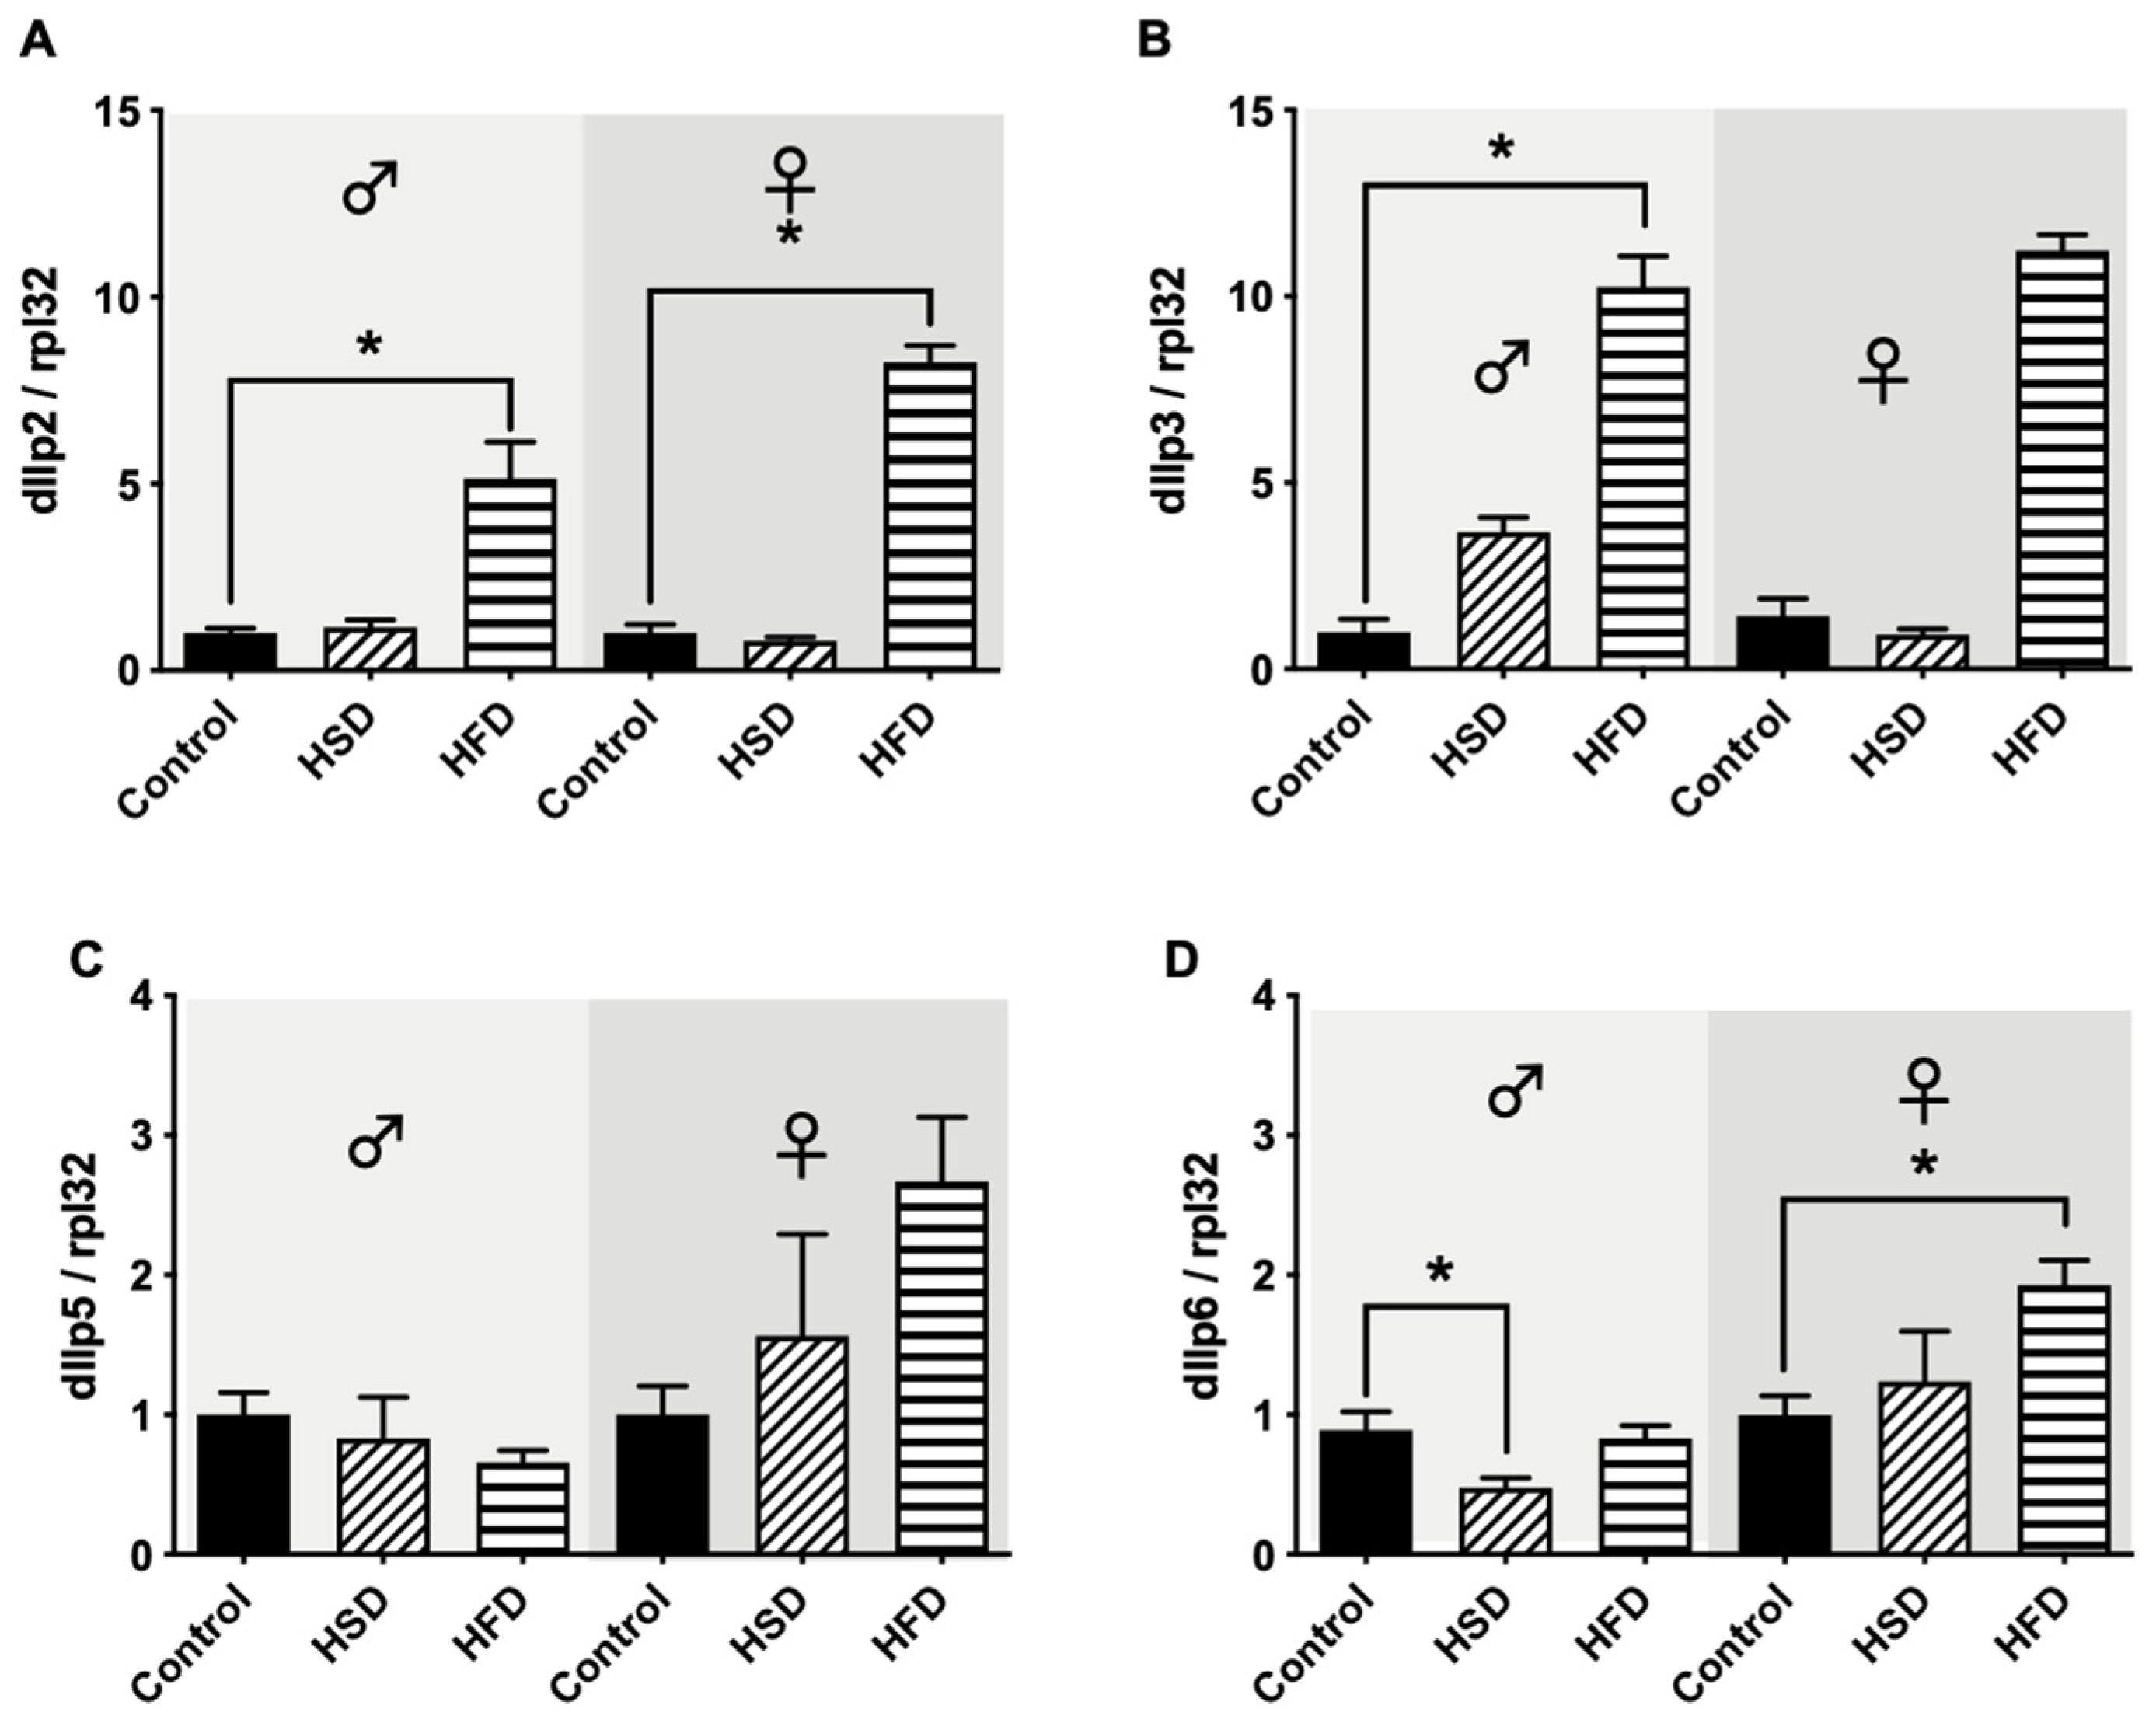
3.5. Drosophila Insulin-like Peptides
4. Discussion
5. Conclusions
Supplementary Materials
Author Contributions
Funding
Data Availability Statement
Acknowledgments
Conflicts of Interest
References
- WHO World Health Organization. Obesity and Overweight. Available online: https://www.who.int/en/news-room/fact-sheets/detail/obesity-and-overweight (accessed on 5 January 2022).
- Zhang, Y.; Liu, J.; Yao, J.; Ji, G.; Qian, L.; Wang, J.; Zhang, G.; Tian, J.; Nie, Y.; Zhang, Y.E.; et al. Obesity: Pathophysiology and intervention. Nutrients 2014, 6, 5153–5183. [Google Scholar] [CrossRef] [Green Version]
- Reiter, L.T.; Potocki, L.; Chien, S.; Gribskov, M.; Bier, E. A systematic analysis of human disease-associated gene sequences in Drosophila melanogaster. Genome Res. 2001, 11, 1114–1125. [Google Scholar] [CrossRef] [PubMed] [Green Version]
- Trinh, I.; Boulianne, G.L. Modeling Obesity and Its Associated Disorders in Drosophila. Physiology 2013, 28, 117. [Google Scholar] [CrossRef] [PubMed] [Green Version]
- Koyama, T.; Texada, M.J.; Halberg, K.A.; Rewitz, K. Metabolism and growth adaptation to environmental conditions in Drosophila. Cell Mol. Life Sci. 2020, 77, 4523–4551. [Google Scholar] [CrossRef]
- Musselman, L.P.; Fink, J.L.; Baranski, T.J. Similar effects of high-fructose and high-glucose feeding in a Drosophila model of obesity and diabetes. PLoS ONE 2019, 14, e0217096. [Google Scholar] [CrossRef] [PubMed]
- Musselman, L.P.; Fink, J.L.; Narzinski, K.; Ramachandran, P.V.; Hathiramani, S.S.; Cagan, R.L.; Baranski, T.J. A high-sugar diet produces obesity and insulin resistance in wild-type Drosophila. DMM Dis. Model Mech. 2011, 4, 842–849. [Google Scholar] [CrossRef] [PubMed] [Green Version]
- Birse, R.T.; Choi, J.; Reardon, K.; Rodriguez, J.; Graham, S.; Diop, S.; Ocorr, K.; Bodmer, R.; Oldham, S. High-fat-diet-induced obesity and heart dysfunction are regulated by the TOR pathway in Drosophila. Cell Metab. 2010, 12, 533–544. [Google Scholar] [CrossRef] [Green Version]
- Wagner, A.E.; Piegholdt, S.; Rabe, D.; Baenas, N.; Schloesser, A.; Eggersdorfer, M.; Stocker, A.; Rimbach, G. Epigallocatechin gallate affects glucose metabolism and increases fitness and lifespan in Drosophila melanogaster. Oncotarget 2015, 6, 30568. [Google Scholar] [CrossRef]
- Linford, N.J.; Bilgir, C.; Ro, J.; Pletcher, S.D. Measurement of lifespan in Drosophila melanogaster. J. Vis. Exp. 2013, e50068. [Google Scholar] [CrossRef] [Green Version]
- Gargano, J.W.; Martin, I.; Bhandari, P.; Grotewiel, M.S. Rapid iterative negative geotaxis (RING): A new method for assessing age-related locomotor decline in Drosophila. Exp. Gerontol. 2005, 40, 386–395. [Google Scholar] [CrossRef]
- Musselman, L.P.; Kühnlein, R.P. Drosophila as a model to study obesity and metabolic disease. J. Exp. Biol. 2018, 121, jeb163881. [Google Scholar] [CrossRef] [PubMed] [Green Version]
- Na, J.; Musselman, L.P.; Pendse, J.; Baranski, T.J.; Bodmer, R.; Ocorr, K.; Cagan, R. A Drosophila Model of High Sugar Diet-Induced Cardiomyopathy. PLOS Genet. 2013, 9, e1003175. [Google Scholar] [CrossRef] [PubMed] [Green Version]
- Morris, S.N.S.; Coogan, C.; Chamseddin, K.; Fernandez-Kim, S.O.; Kolli, S.; Keller, J.N.; Bauer, J.H. Development of diet-induced insulin resistance in adult Drosophila melanogaster. Biochim. Biophys. Acta—Mol. Basis Dis. 2012, 1822, 1230–1237. [Google Scholar] [CrossRef] [PubMed] [Green Version]
- Liao, S.; Amcoff, M.; Nässel, D.R. Impact of high-fat diet on lifespan, metabolism, fecundity and behavioral senescence in Drosophila. Insect Biochem. Mol. Biol. 2021, 133, 103495. [Google Scholar] [CrossRef]
- Heinrichsen, E.T.; Haddad, G.G. Role of high-fat diet in stress response of Drosophila. PLoS ONE 2012, 7, e42587. [Google Scholar] [CrossRef] [Green Version]
- Galenza, A.; Hutchinson, J.; Campbell, S.D.; Hazes, B.; Foley, E. Glucose modulates Drosophila longevity and immunity independent of the microbiota. Biol. Open 2016, 5, 165–173. [Google Scholar] [CrossRef] [Green Version]
- De Groef, S.; Wilms, T.; Balmand, S.; Calevro, F.; Callaerts, P. Sexual dimorphism in metabolic responses to western diet in Drosophila melanogaster. Biomolecules 2022, 12, 33. [Google Scholar] [CrossRef]
- Chandegra, B.; Tang, J.L.Y.; Chi, H.; Alic, N. Sexually dimorphic effects of dietary sugar on lifespan, feeding and starvation resistance in Drosophila. Aging (Albany. NY) 2017, 9, 2521–2528. [Google Scholar] [CrossRef] [Green Version]
- Camus, M.F.; Fowler, K.; Piper, M.W.D.; Reuter, M. Sex and genotype effects on nutrientdependent fitness landscapes in Drosophila melanogaster. Proc. R. Soc. B Biol. Sci. 2017, 284, 20172237. [Google Scholar] [CrossRef] [Green Version]
- Wu, Q.; Yu, G.; Cheng, X.; Gao, Y.; Fan, X.; Yang, D.; Xie, M.; Wang, T.; Piper, M.D.W.; Yang, M. Sexual dimorphism in the nutritional requirement for adult lifespan in Drosophila melanogaster. Aging Cell 2020, 19, e13120. [Google Scholar] [CrossRef] [Green Version]
- Graze, R.M.; Tzeng, R.Y.; Howard, T.S.; Arbeitman, M.N. Perturbation of IIS/TOR signaling alters the landscape of sex-differential gene expression in Drosophila. BMC Genom. 2018, 19, 893. [Google Scholar] [CrossRef] [PubMed] [Green Version]
- Millington, J.W.; Rideout, E.J. Sex differences in Drosophila development and physiology. Curr. Opin. Physiol. 2018, 6, 46–56. [Google Scholar] [CrossRef]
- Ahmed, S.M.H.; Maldera, J.A.; Krunic, D.; Paiva-Silva, G.O.; Pénalva, C.; Teleman, A.A.; Edgar, B.A. Fitness trade-offs incurred by ovary-to-gut steroid signalling in Drosophila. Nature 2020, 584, 415–419. [Google Scholar] [CrossRef] [PubMed]
- Murashov, A.K.; Pak, E.S.; Lin, C.T.; Boykov, I.N.; Buddo, K.A.; Mar, J.; Bhat, K.M.; Neufer, P.D. Preference and detrimental effects of high fat, sugar, and salt diet in wild-caught Drosophila simulans are reversed by flight exercise. FASEB BioAdv. 2021, 3, 49–64. [Google Scholar] [CrossRef]
- Lee, K.P.; Kim, J.S.; Min, K.J. Sexual dimorphism in nutrient intake and life span is mediated by mating in Drosophila melanogaster. Anim. Behav. 2013, 86, 987–992. [Google Scholar] [CrossRef]
- Gáliková, M.; Klepsatel, P. Obesity and Aging in the Drosophila Model. Int. J. Mol. Sci. 2018, 19, 1896. [Google Scholar] [CrossRef] [PubMed] [Green Version]
- Smith, W.W.; Thomas, J.; Liu, J.; Li, T.; Moran, T.H. From fat fruit fly to human obesity. Physiol. Behav. 2014, 136, 15–21. [Google Scholar] [CrossRef] [Green Version]
- DiAngelo, J.R.; Birnbaum, M.J. Regulation of Fat Cell Mass by Insulin in Drosophila melanogaster. Mol. Cell. Biol. 2009, 29, 6341–6352. [Google Scholar] [CrossRef] [Green Version]
- Beshel, J.; Dubnau, J.; Zhong, Y. A Leptin analog locally produced in the brain acts via a conserved neural circuit to modulate obesity-linked behaviors in Drosophila. Cell Metab. 2017, 25, 208. [Google Scholar] [CrossRef] [Green Version]
- Nayak, N.; Mishra, M. High fat diet induced abnormalities in metabolism, growth, behavior, and circadian clock in Drosophila melanogaster. Life Sci. 2021, 281, 119758. [Google Scholar] [CrossRef]
- Sujkowski, A.; Wessells, R. Using Drosophila to Understand Biochemical and Behavioral Responses to Exercise. Exerc. Sport Sci. Rev. 2018, 46, 112–120. [Google Scholar] [CrossRef] [PubMed]
- Kim, S.K.; Rulifson, E.J. Conserved mechanisms of glucose sensing and regulation by Drosophila corpora cardiaca cells. Nature 2004, 431, 316–320. [Google Scholar] [CrossRef] [PubMed]
- Cognigni, P.; Bailey, A.P.; Miguel-Aliaga, I. Enteric neurons and systemic signals couple nutritional and reproductive status with intestinal homeostasis. Cell Metab. 2011, 13, 92–104. [Google Scholar] [CrossRef] [PubMed] [Green Version]
- Nakitto, A.M.S.; Rudloff, S.; Borsch, C.; Wagner, A.E. Solanum anguivi Lam. fruit preparations counteract the negative effects of a high-sugar diet on the glucose metabolism in Drosophila melanogaster. Food Funct. 2021, 12, 9238–9247. [Google Scholar] [CrossRef]
- Álvarez-Rendón, J.P.; Salceda, R.; Riesgo-Escovar, J.R. Drosophila melanogaster as a Model for Diabetes Type 2 Progression. Biomed. Res. Int. 2018, 2018, 1417528. [Google Scholar] [CrossRef] [Green Version]
- Wat, L.W.; Chowdhury, Z.S.; Millington, J.W.; Biswas, P.; Rideout, E.J. Sex determination gene transformer regulates the male-female difference in Drosophila fat storage via the adipokinetic hormone pathway. eLife 2021, 10, e72350. [Google Scholar] [CrossRef]
- Semaniuk, U.; Piskovatska, V.; Strilbytska, O.; Strutynska, T.; Burdyliuk, N.; Vaiserman, A.; Bubalo, V.; Storey, K.B.; Lushchak, O. Drosophila insulin-like peptides: From expression to functions—A review. Entomol. Exp. Appl. 2021, 169, 195–208. [Google Scholar] [CrossRef]
- Alfa, R.W.; Kim, S.K. Using Drosophila to discover mechanisms underlying type 2 diabetes. DMM Dis. Model. Mech. 2016, 9, 365–376. [Google Scholar] [CrossRef] [Green Version]


| Ingredients | Control | High Sugar Diet (HSD) | High Fat Diet (HFD) |
|---|---|---|---|
| Water (mL) | 1075 | 1075 | 1075 |
| Agar 1 (g) | 20 | 20 | 20 |
| Sucrose 2 (g) | 100 | 300 | 100 |
| Inactive yeast 3 (g) | 50 | 50 | 50 |
| Pure coconut oil 4 (g) | 0 | 0 | 150 |
| Tegosept 5 (20% in 95% ethanol) (mL) | 15 | 15 | 15 |
| Propionic acid 6 | 3 | 3 | 3 |
| Gene | Forward Primer (5′→3′) | Reverse Primer (5′→3′) | Accession No. (NM_...) |
|---|---|---|---|
| dIlp2 | AACGAGGTGCTGAGTATGGT | CGAACTCCTGGACAAACTGC | 079288 |
| dIlp3 | ATCCTTATGATCGGCGGTGT | GTTCACGGGGTCCAAAGTTC | 140103 |
| dIlp5 | TGATGGACATGCTGAGGGTT | CATGTGGTGAGATTCGGAGC | 206315 |
| dIlp6 | TGGCGATGTATTTCCCAACAG | CCTTCACTATCCTTTGCAGTACT | 130644 |
| rpl32 | GGCAAGCTTCAAGATGACCA | GTTCGATCCGTAACCGATGT | 170461 |
Publisher’s Note: MDPI stays neutral with regard to jurisdictional claims in published maps and institutional affiliations. |
© 2022 by the authors. Licensee MDPI, Basel, Switzerland. This article is an open access article distributed under the terms and conditions of the Creative Commons Attribution (CC BY) license (https://creativecommons.org/licenses/by/4.0/).
Share and Cite
Baenas, N.; Wagner, A.E. Drosophila melanogaster as a Model Organism for Obesity and Type-2 Diabetes Mellitus by Applying High-Sugar and High-Fat Diets. Biomolecules 2022, 12, 307. https://doi.org/10.3390/biom12020307
Baenas N, Wagner AE. Drosophila melanogaster as a Model Organism for Obesity and Type-2 Diabetes Mellitus by Applying High-Sugar and High-Fat Diets. Biomolecules. 2022; 12(2):307. https://doi.org/10.3390/biom12020307
Chicago/Turabian StyleBaenas, Nieves, and Anika E. Wagner. 2022. "Drosophila melanogaster as a Model Organism for Obesity and Type-2 Diabetes Mellitus by Applying High-Sugar and High-Fat Diets" Biomolecules 12, no. 2: 307. https://doi.org/10.3390/biom12020307
APA StyleBaenas, N., & Wagner, A. E. (2022). Drosophila melanogaster as a Model Organism for Obesity and Type-2 Diabetes Mellitus by Applying High-Sugar and High-Fat Diets. Biomolecules, 12(2), 307. https://doi.org/10.3390/biom12020307