Article

Molecular Structure and Phylogenetic Analyses of the Plastomes of Eight Sorbus Sensu Stricto Species

School of Biological Science and Technology, Liupanshui Normal University, Liupanshui 553004, China
*
Author to whom correspondence should be addressed.
Biomolecules 2022, 12(11), 1648; https://doi.org/10.3390/biom12111648
Submission received: 12 October 2022 / Revised: 2 November 2022 / Accepted: 3 November 2022 / Published: 7 November 2022

Abstract

:
Sorbus L. is a genus of controversy on its taxonomic concept due to great variations in morphological characteristics. Sorbus sensu stricto species, being monophyletic, are characterized as pinnate leaves. However, phylogenetic relationships of these species are somewhat fluid based on morphological characteristics and genetic markers. In this study, the chloroplast (cp) genomes of eight Sorbus s. str. species were characterized and compared with those of twelve released species in this genus. Our results indicated that the plastomes of the twenty Sorbus species had a conserved quadripartite structure, and 129 annotated genes had the same order and showed a good collinearity. Additionally, numerous SSRs were observed in the cp genome of each Sorbus species; most of the sequence variations appeared in non-coding regions, and four intergenic regions were identified as mutation spots. By contrast, protein-coding genes showed low variations under purifying selection. The phylogenetic and molecular-dating analysis showed that Sorbus was resolved into two major clades, in which S. americana forms one clade originating at 51.78 Ma, and the rest of Sorbus formed another clade, splitting at 36.77 Ma into two sister groups with high support values. These results provide a basis for further studying the phylogenetic relationship and biogeography of Sorbus species.

1. Introduction

Sorbus L. is a deciduous plant that belongs to Amygdaloideae of Rosaceae, which is widespread in the northern temperate regions [1,2,3]. China is regarded as the center of distribution and differentiation of this species, because more than half of the species in this genus have been recorded in China [4]. This genus is famous for its ornamental values, which can exhibit various leaf and fruit colors in different seasons [5]. In addition, the edible fruits (berries) are rich in nutritional materials, such as vitamins, polysaccharides, organic acids, and minerals, which are usually used raw in processing into preserves and beverages [6]. Meanwhile, numbers of studies have reported that the fruits of this genus are appreciated for their medicinal properties. It has so far been indicated that chemical constituents of the genus Sorbus include phenolic compounds, triterpenes, sterols, carboxylic acids, coumarins, and cyanogenic glycosides, which have antidiabetic, anti-inflammatory, antimicrobial, and antioxidant effects [6]. With more findings of the values of this genus species, some other application potentials have been found, such as insect and disease resistance [5].
The classification of Sorbus has been a controversy for a long time. Sorbus sensu lato are characterized by both the simple-leaved species and pinnate-leaved species. In 1974, Yü and Lu [4] divided Sorbus s. l. into three sections (Aria, Micromeles, and Sorbus), mainly based on the serrated position on leaves and the pairs of leaflets. Subsequently, Phipps et al. (1990) suggested that Sorbus s. l. can be divided into six subgenus (Chamaemespilus Medikus, Torminalis Medikus, Aria (Pers.) Host, Micromeles Decaisne, Cormus Spach, and Sorbus sensu stricto) and includes over 250 species [3]. The former four subgenera comprise the simple-leaved species, whereas the latter two subgenera include the pinnate-leaved species. However, several lines of evidence have indicated that Sorbus s. l. is polyphyletic, based on the molecular data and morphological characteristics [7,8,9,10]. Therefore, some taxonomists have thought that the genus Sorbus should be narrowed in the scope of classification and only include Sorbus sensu stricto.
The Sorbus sensu stricto (88 species) have high similarities in many morphological characteristics, such as flower structure and color, fruit color and, the numbers of leaflet pairs [11]. The findings have confirmed that Sorbus s. str. is a monophyletic group and is classified into two major lineages (core Sorbus and Albo-carmesinae) [12]. However, a phylogenetic analysis based on a few plastid and nuclear gene fragments found that the relationships and definitions of clades within core Sorbus and Albo-carmesinae lineages are not well-supported or not consistent with traditional taxonomy based on the morphological characters [12].
In recent decades, the chloroplast (cp) genome has been widely utilized as a phylogenetic marker for investigating plant evolution due to its many advantages. First, the cp genome is small in size, and usually used in comparative studies. In addition, the evolutionary rate of the overall cp genome is slower than that of the nucleotide genome, and the different parts in the cp genome show different rates of nucleotide change, which is appropriate for different level comparisons [13]. Finally, the uniparental inheritance pattern and lack of recombination in the cp genome can simplify analysis. Recently, we analyzed the phylogenetic relationship of Rosaceae based on the complete cp genome to reveal the temporal diversification [7]. In this study, the cp genomes of eight Sorbus s. str. species were sequenced using the modern next-generation sequencing approach, and these were compared with those of twelve released species in this genus. We mainly focused on cp genome features, repeat sequences, genome structure rearrangement, sequence variations, and selective pressure, as well as phylogenetic and molecular-dating analysis. This study will further detail the cp genomes of Sorbus and provide the basis for studying the phylogenetic relationships within Sorbus.

2. Materials and Methods

2.1. Plant Material and DNA Extraction

Eight Sorbus s. str. species, including S. amabilis, S. discolor, S. filipes, S. hupehensis var. hupehensis, S. multijuga, S. pohuashanensis, S. reducta, and S. wilsoniana, were collected from several provinces of China, and the voucher specimens of these species were deposited in Herbarium, Kunming Institute of Botany, CAS (KUN). Detailed information on the samples is shown in Table S1. The total DNA of each sample was isolated from the silica gel-dried leaves by modified CTAB method [14], and a NEB Next Ultra DNA Library Prep Kit for Illumina (New England Biolabs, Ipswich, MA, USA) was used for preparing libraries, which were sequenced on the Illumina HiSeq X-ten. In this study, twelve released Sorbus species were also used for a comparative analysis, and the detailed information is shown in Table S1.

2.2. Cp Genome Assembly, Annotation, and Comparative Analysis

After the cp genome was de novo assembled using SPAdes software [15], the genes, including protein-coding genes (PCGs), transfer RNAs (tRNAs), and ribosomal RNAs, (rRNAs) were annotated by PGA software [16] with manual adjustments. The annotated cp genome map of Sorbus was constructed using the OGDRAW program [17]. The GC content and length of each part of the cp genome were analyzed for 20 Sorbus species (8 newly sequenced and 12 available Sorbus species) using Geneious software [18]. The plastid sequences from 20 Sorbus species were aligned with MAFFT v.6.833 [19] using the default settings. Cp genome sequence homology and collinearity were analyzed using the Mauve software [20]. Pairwise alignments among 20 Sorbus cp genomes were performed in the mVISTA program [21], using S. amabilis as reference sequence to obtain the overall similarity of cp genomes within Sorbus species. The boundary information of the junction of IR, LSC, and SSC was analyzed using the online IRscope tool (https://irscope.shinyapps.io/irapp/, accessed on 24 October 2022).).
The online REPuter software [22] was used to identify four different repeat types: forward, palindrome, reverse, and complement repeats. Additionally, we detected the distribution of microsatellite (simple sequence repeats, SSRs) using MISA web software [23]. In our analysis, we set the threshold of ten, five, four, three, three, and three repeat units for each mono-, di-, tri-, tetra-, penta-, and hexa-nucleotide SSR, respectively. The minimum distance between two SSRs was set to 100 bp.
The nucleotide diversity (pi) values were calculated using a sliding window for cp genomes among the Sorbus species with the DNASP 5.0 program [24]. The window length and step size were set to 600 and 200 bp, respectively. The ratio of synonymous (Ks) and non-synonymous (Ka) substitution rates was designed to measure selection pressure on amino acid substitutions [25]. In this study, we extracted the same individual CDS sequence of PCGs and aligned them separately using MAFFT v.6.833 [19]. Then, the alignments were used to calculate the Ka/Ks values, which were lower than, equal to, or greater than 1, indicating purifying selection, neutral evolution, and positive selection, respectively.

2.3. Phylogenetic Analysis and Divergence Time Estimation

A total of twenty species were used for the phylogenetic reconstruction of Sorbus. Of these, eight species were newly sequenced in this study, and twelve species were downloaded from the NCBI GenBank database (Table S1). In addition, five Pyrus species (P. medvedevii, P. oxyprion, P. hopeiensis, P. pyrifolia, and P. pashia) were used as outgroups. All complete cp genomes were aligned using MAFFT v.6.833 [19] and then separately used to perform the phylogenetic analysis with the Bayesian inference (BI) and maximum likelihood (ML) methods, as previously described [7].
During the calculation of the divergence time, three fossil-based calibration points and one secondary calibration point (lognormal prior distribution) were selected from the literature. (1) Based on the result of Lo and Donoghue [9], the crown node age of Pyrus and Sorbus was constrained to 45 Ma (A, offset: 45 Ma). (2) The crown of Sorbus was dated based on the record of the oldest Sorbus-like macrofossils [26] (B, offset: 51 Ma). (3) The stem of clade II-2 (C, offset: 30 Ma) was set to 30 Ma based on the fossil S. cf. tianschanica from the northwest of China [27]. (4) According to the suggestions of Korotkova et al. [28], the crown node age of Pyrus was constrained to 25 Ma (D, offset: 25 Ma).
The node ages of the major clades of Sorbus were analyzed using the GTR + GAMMA model in BEAST v.1.8.4 [29]. The divergence time was estimated using a Yule speciation prior and an uncorrelated lognormal model of rate change with a relaxed clock. Two independent runs, each with 20,000,000 generations, were carried out, with sampling every 1000 generations. The effective sample sizes (ESSs) of all parameters were determined (>200) using Tracer v1.6 [30], and the first 25% of the samples was discarded as burn-in. TreeAnnotator v1.8.0 [29] was used to produce a maximum clade credibility chronogram showing the mean divergence time estimates with 95% highest posterior density (HPD) intervals.

3. Results and Discussion

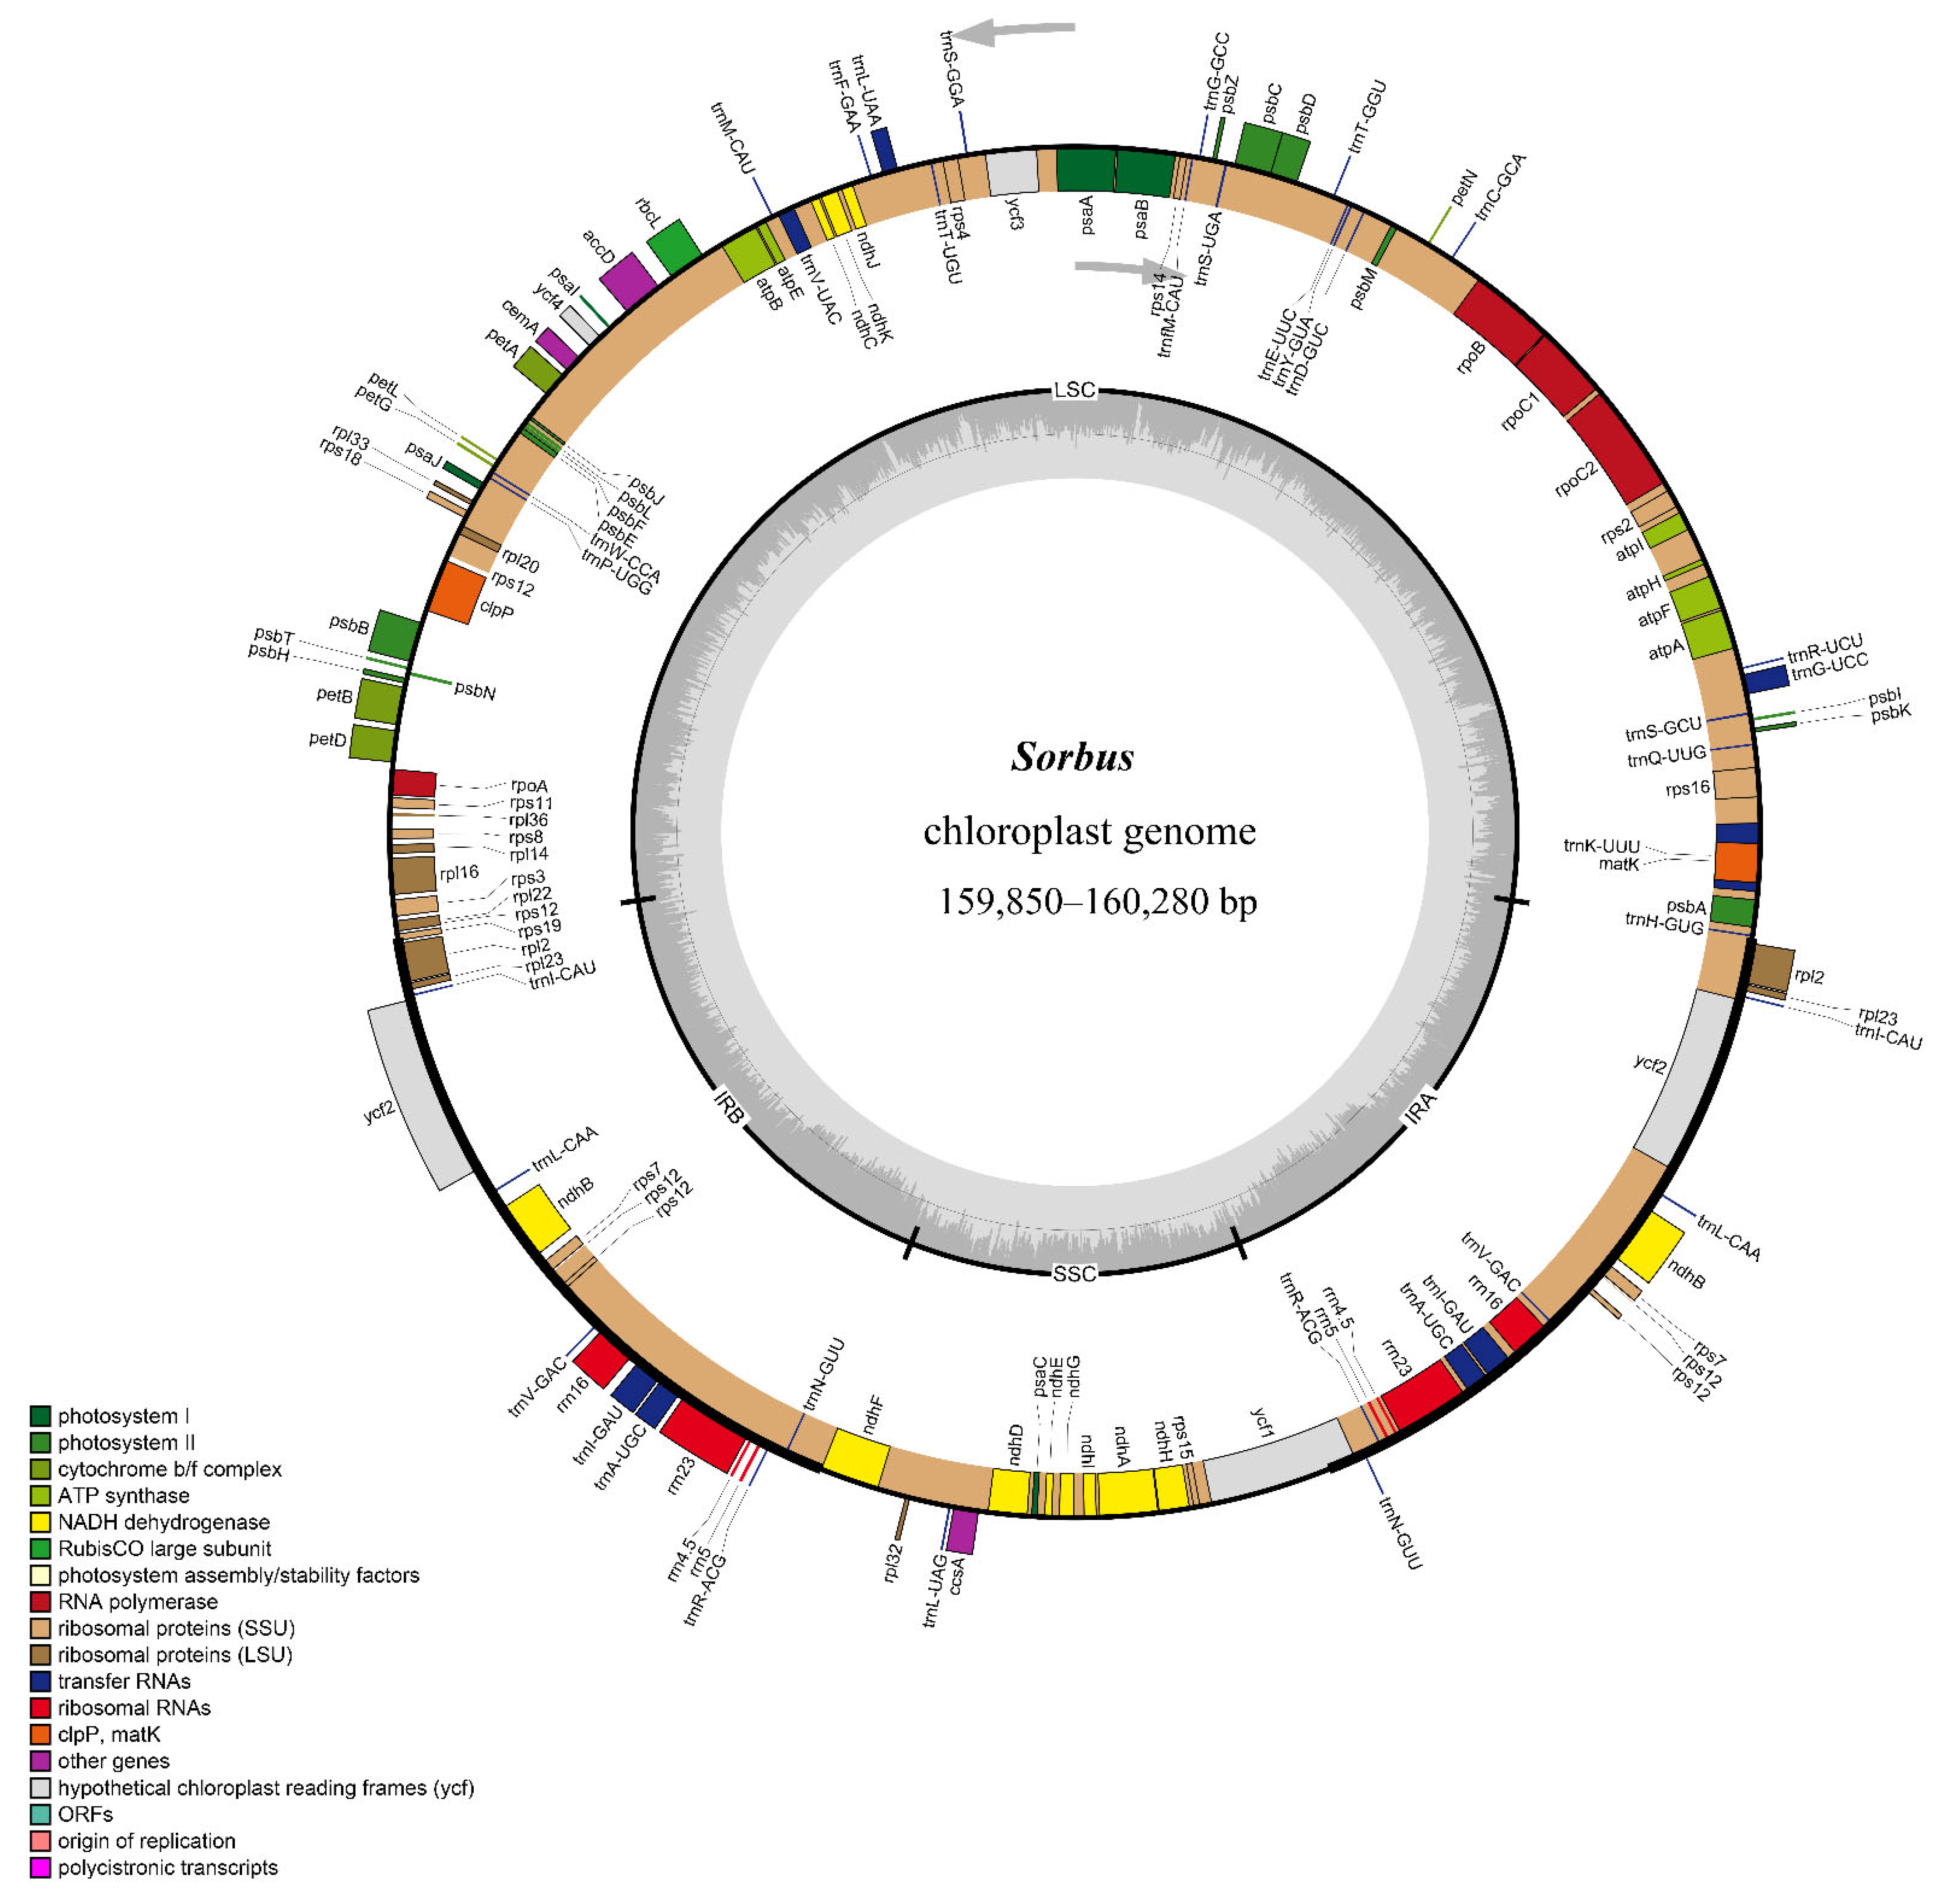
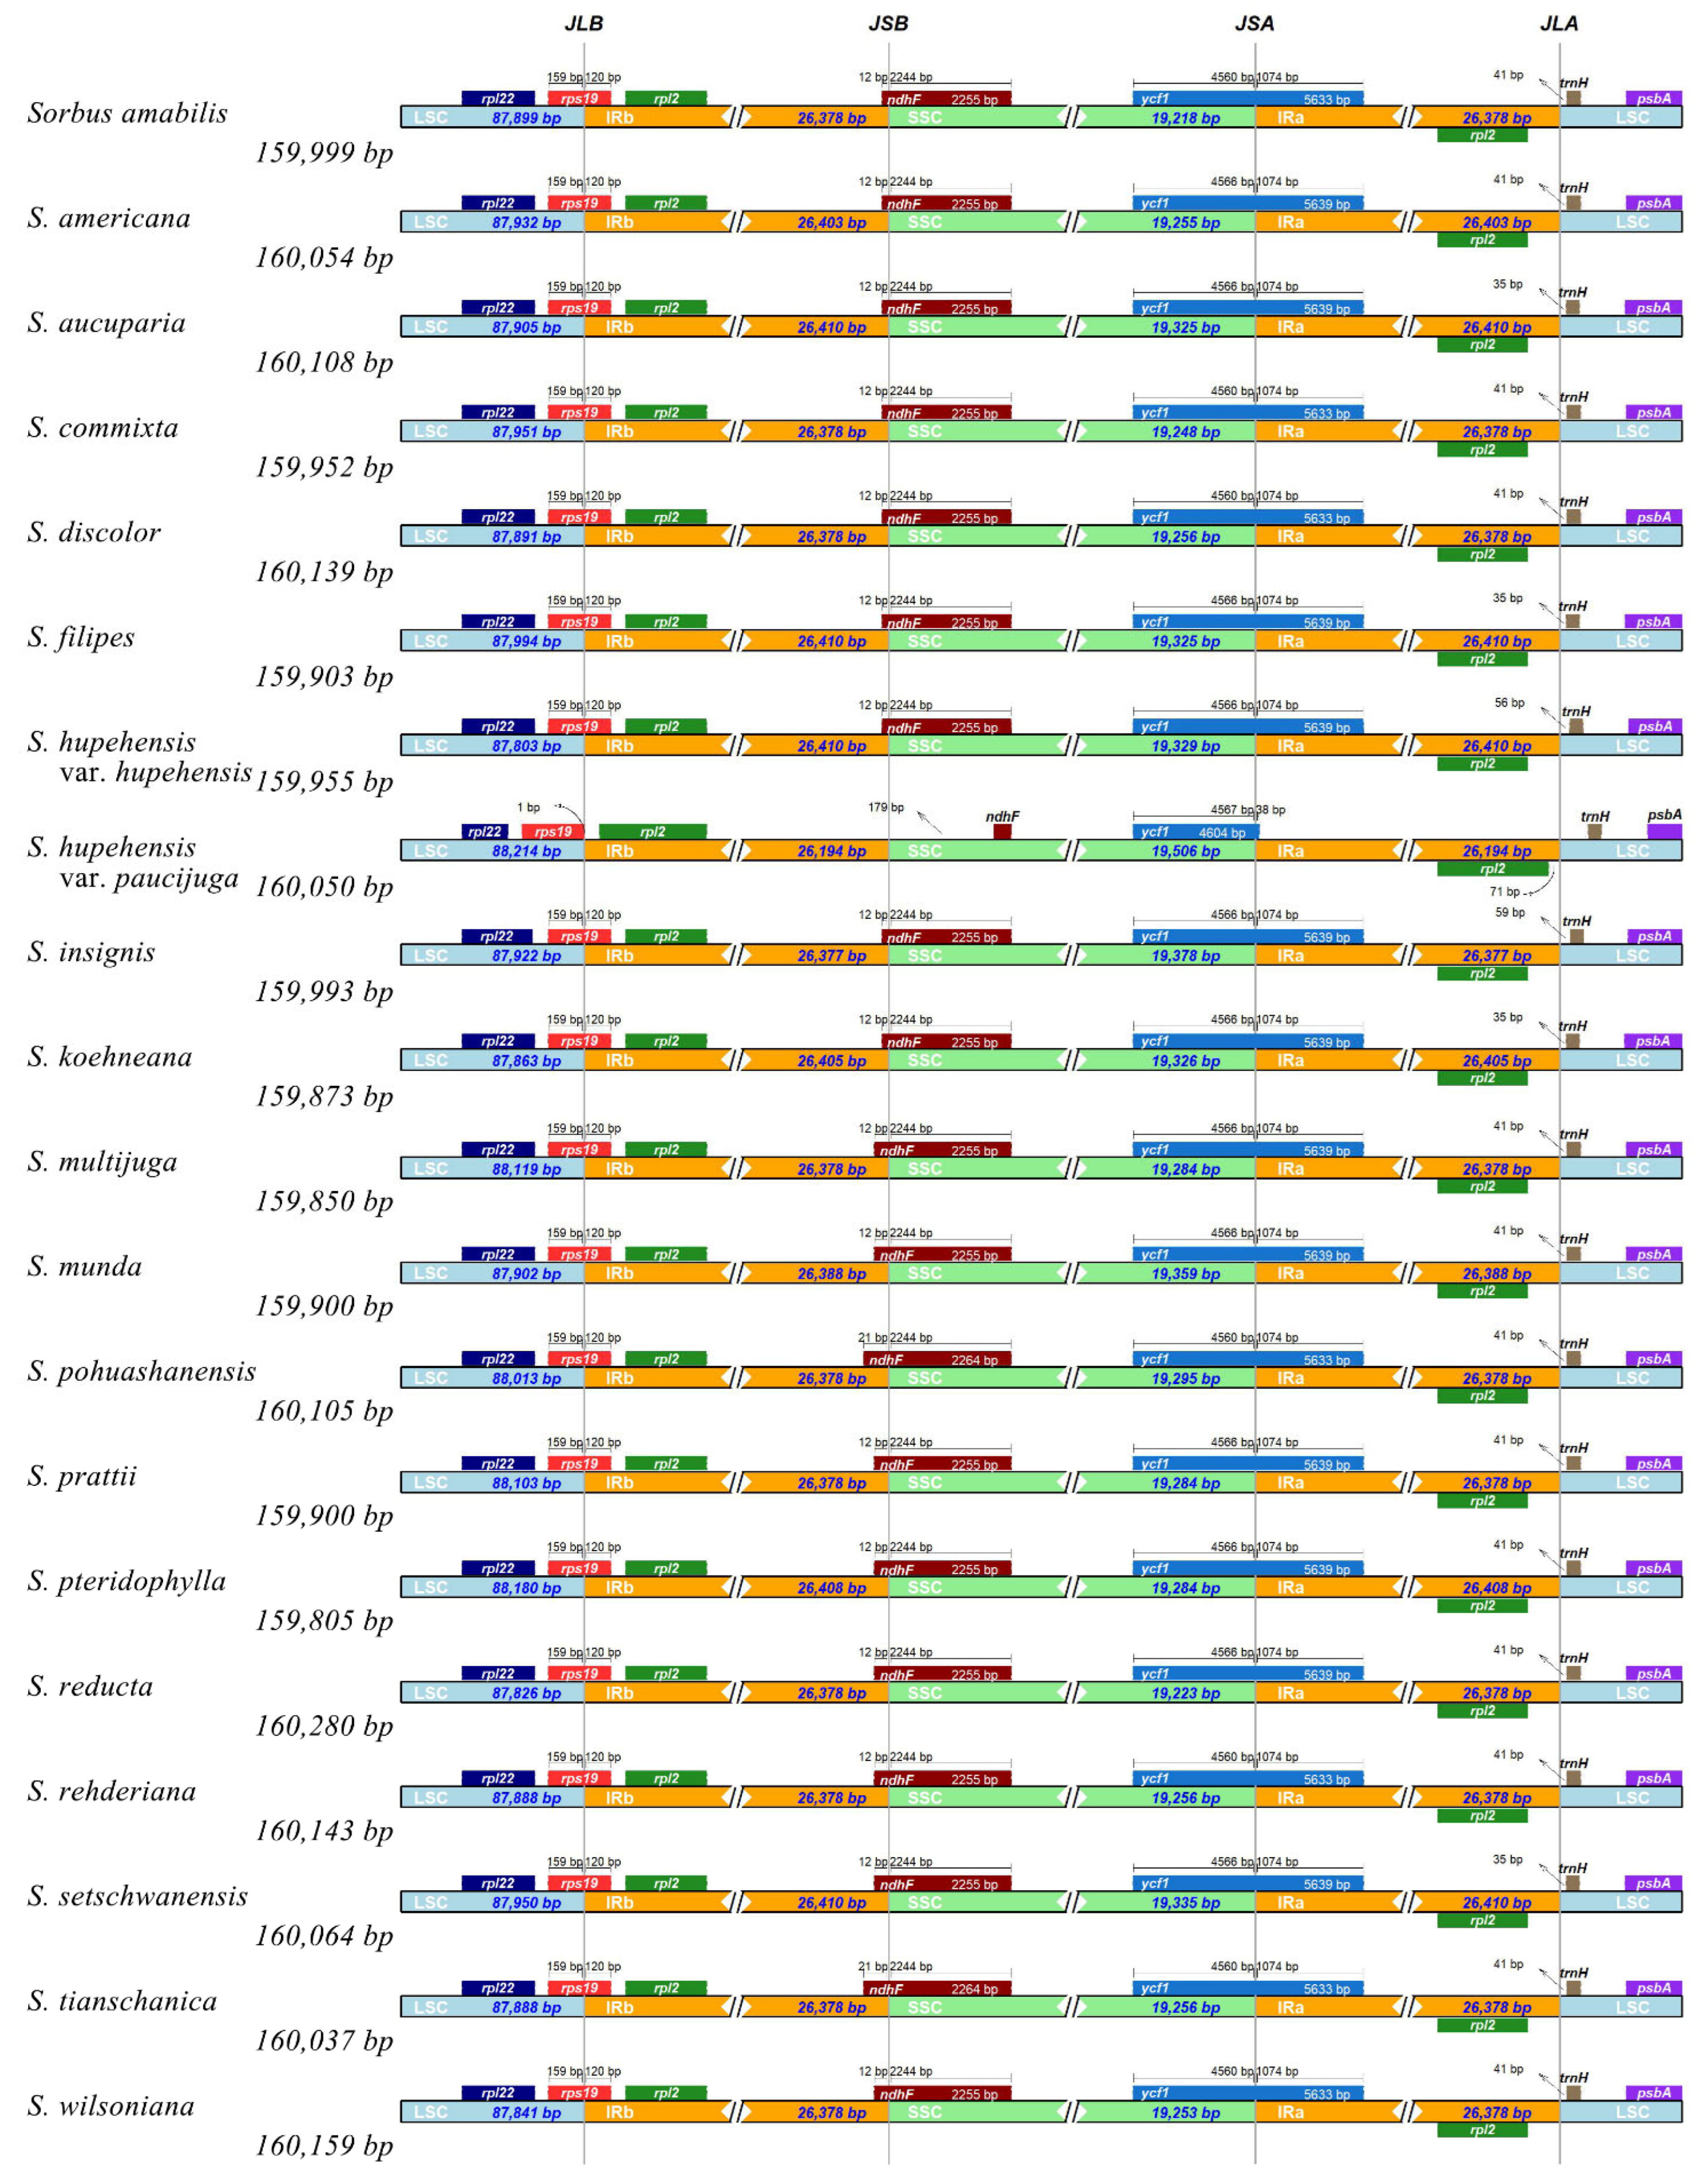
3.1. Comparative Analysis of the Features and Structure of Cp Genomes in Sorbus

In this study, sequencing of eight different Sorbus s. str. species showed an identical cp genome structure. At first, all eight cp genomes exhibited a circular and quadripartite DNA structure with two copies of an inverted repeat (IR) separating two single copy regions, namely, the large and small single copy regions (LSC and SSC, respectively) (Figure 1). This cp genome structure is typical in most land plants [6,13,31] and also found in twelve other publicly available Sorbus species (Figure 1). The eight cp genome sizes ranged from 159,850 bp to 160,280 bp, and GC contents rarely changed (36.52–36.58%) (Table 1).
Among four regions, the length of IR regions was nearly identical in newly sequenced and released Sorbus species, ranging from 26,314 bp to 26,410 bp (Table 1). The LSC region had the largest length, with 87,803 bp of S. commixta to 88,180 bp of S. pohuashanensis (Table 1). By contrast, the SSC region had the smallest length, with 19,218 bp of S. koehneana to 19,506 bp of S. aucuparia.
A total of 129 genes were annotated in each Sorbus species, and 17 genes were duplicated in the IR region (Table S2). The majority of these genes were protein-coding genes (PCGs, 84), mostly involved in photosynthesis (Table 1 and Table S2). The remaining genes were transfer RNA (tRNA, 37) and ribosomal RNA (rRNA, 8) genes, and the detailed information is shown in Table S2. In some other genera of Rosaceae (i.e., Rosa), the same gene number was found in the same category of gene [32]. In addition, a total of 19 introns occurred in 17 genes among 20 cp genomes (Table S2). Of these, 15 genes had one intron, and two genes had two introns (Table S2). All the genes in 20 cp genomes were organized in an identical order, although these gene transcripts were subjected to cis- or trans-splicing (Figure 1).
It has been suggested that the presence of IR is correlated with the stability of gene order [33,34]. For instance, changes of gene order usually co-occur with the loss of the IR region in legumes [35] and conifer [36]. In this study, the IR/SC region boundaries were analyzed and varied slightly across Sorbus species. Among Sorbus species, the boundaries of IRb/SC were relatively conserved, and two genes (rps19 and ndhF) were detected across the LSC/IRb and SSC/IRb, respectively (Figure 2). There was one exception that a little contraction occurred in the IRb region of the released S. aucuparia (Figure 2). The LSC/IRb (JLB) boundary was in the intergenic spacer (IGS) between rps19 and rpsl2, whereas the SSC/IRb (JSB) boundary was flanked ndhF with a length of 179 bp away from the 5′ end of this gene (Figure 2). By contrast, the IRa/SC junctions showed quite major differences. The IRa/SSC (JSA) junction was also located within ycf1, in which the partial sequence present in the SSC region showed a difference in length (4560–4567 bp) (Figure 2). However, the IRa/LSC (JLA) junctions were located between rpl2 and trnH. The distance between trnH or rpl2 and the boundaries of the JLA exhibited slight changes among the Sorbus species, ranging from 35–71 bp (Figure 2). Similarly, the junction of IRa/SC region in S. aucuparia showed a difference from other Sorbus species (Figure 2). The reason for this sight difference in the individual species needs to be further explored. Therefore, a lack of any change in gene order among the 20 cp genomes of the Sorbus species might be correlated with the nearly unchanged IR.
Repeat motifs in plastomes may induce recombination and genome rearrangement [37]. In this study, we analyzed the repeat motifs of four types: palindromic repeat, forward repeat, reverse repeat, and complement repeat. The results revealed that palindromic and forward repeats were the two main repeat motifs across the Sorbus cp genomes, ranging from 31–46% for the former and 38–58% for the latter (Figure S1). Although the repeat motifs in each Sorbus species varied little, the majority of them were located in non-coding regions within the LSC region (Table S3). To further determine whether the rearrangement occurred in the cp genome of Sorbus species, we conducted multiple genome alignments and found that there were no changes in gene order or orientation in cp genomes across the 20 Sorbus species (Figure S2). These analyses demonstrate that no genes were disrupted by the repeats, and no genome rearrangement occurred over vast periods of evolutionary time in Sorbus. Altogether, the results indicated that eight sequenced cp genomes shared an identical gene structure (gene order and organization) with twelve released Sorbus species (Figure 1 and Figure S2), suggesting evolutionary conservativism in Sorbus.

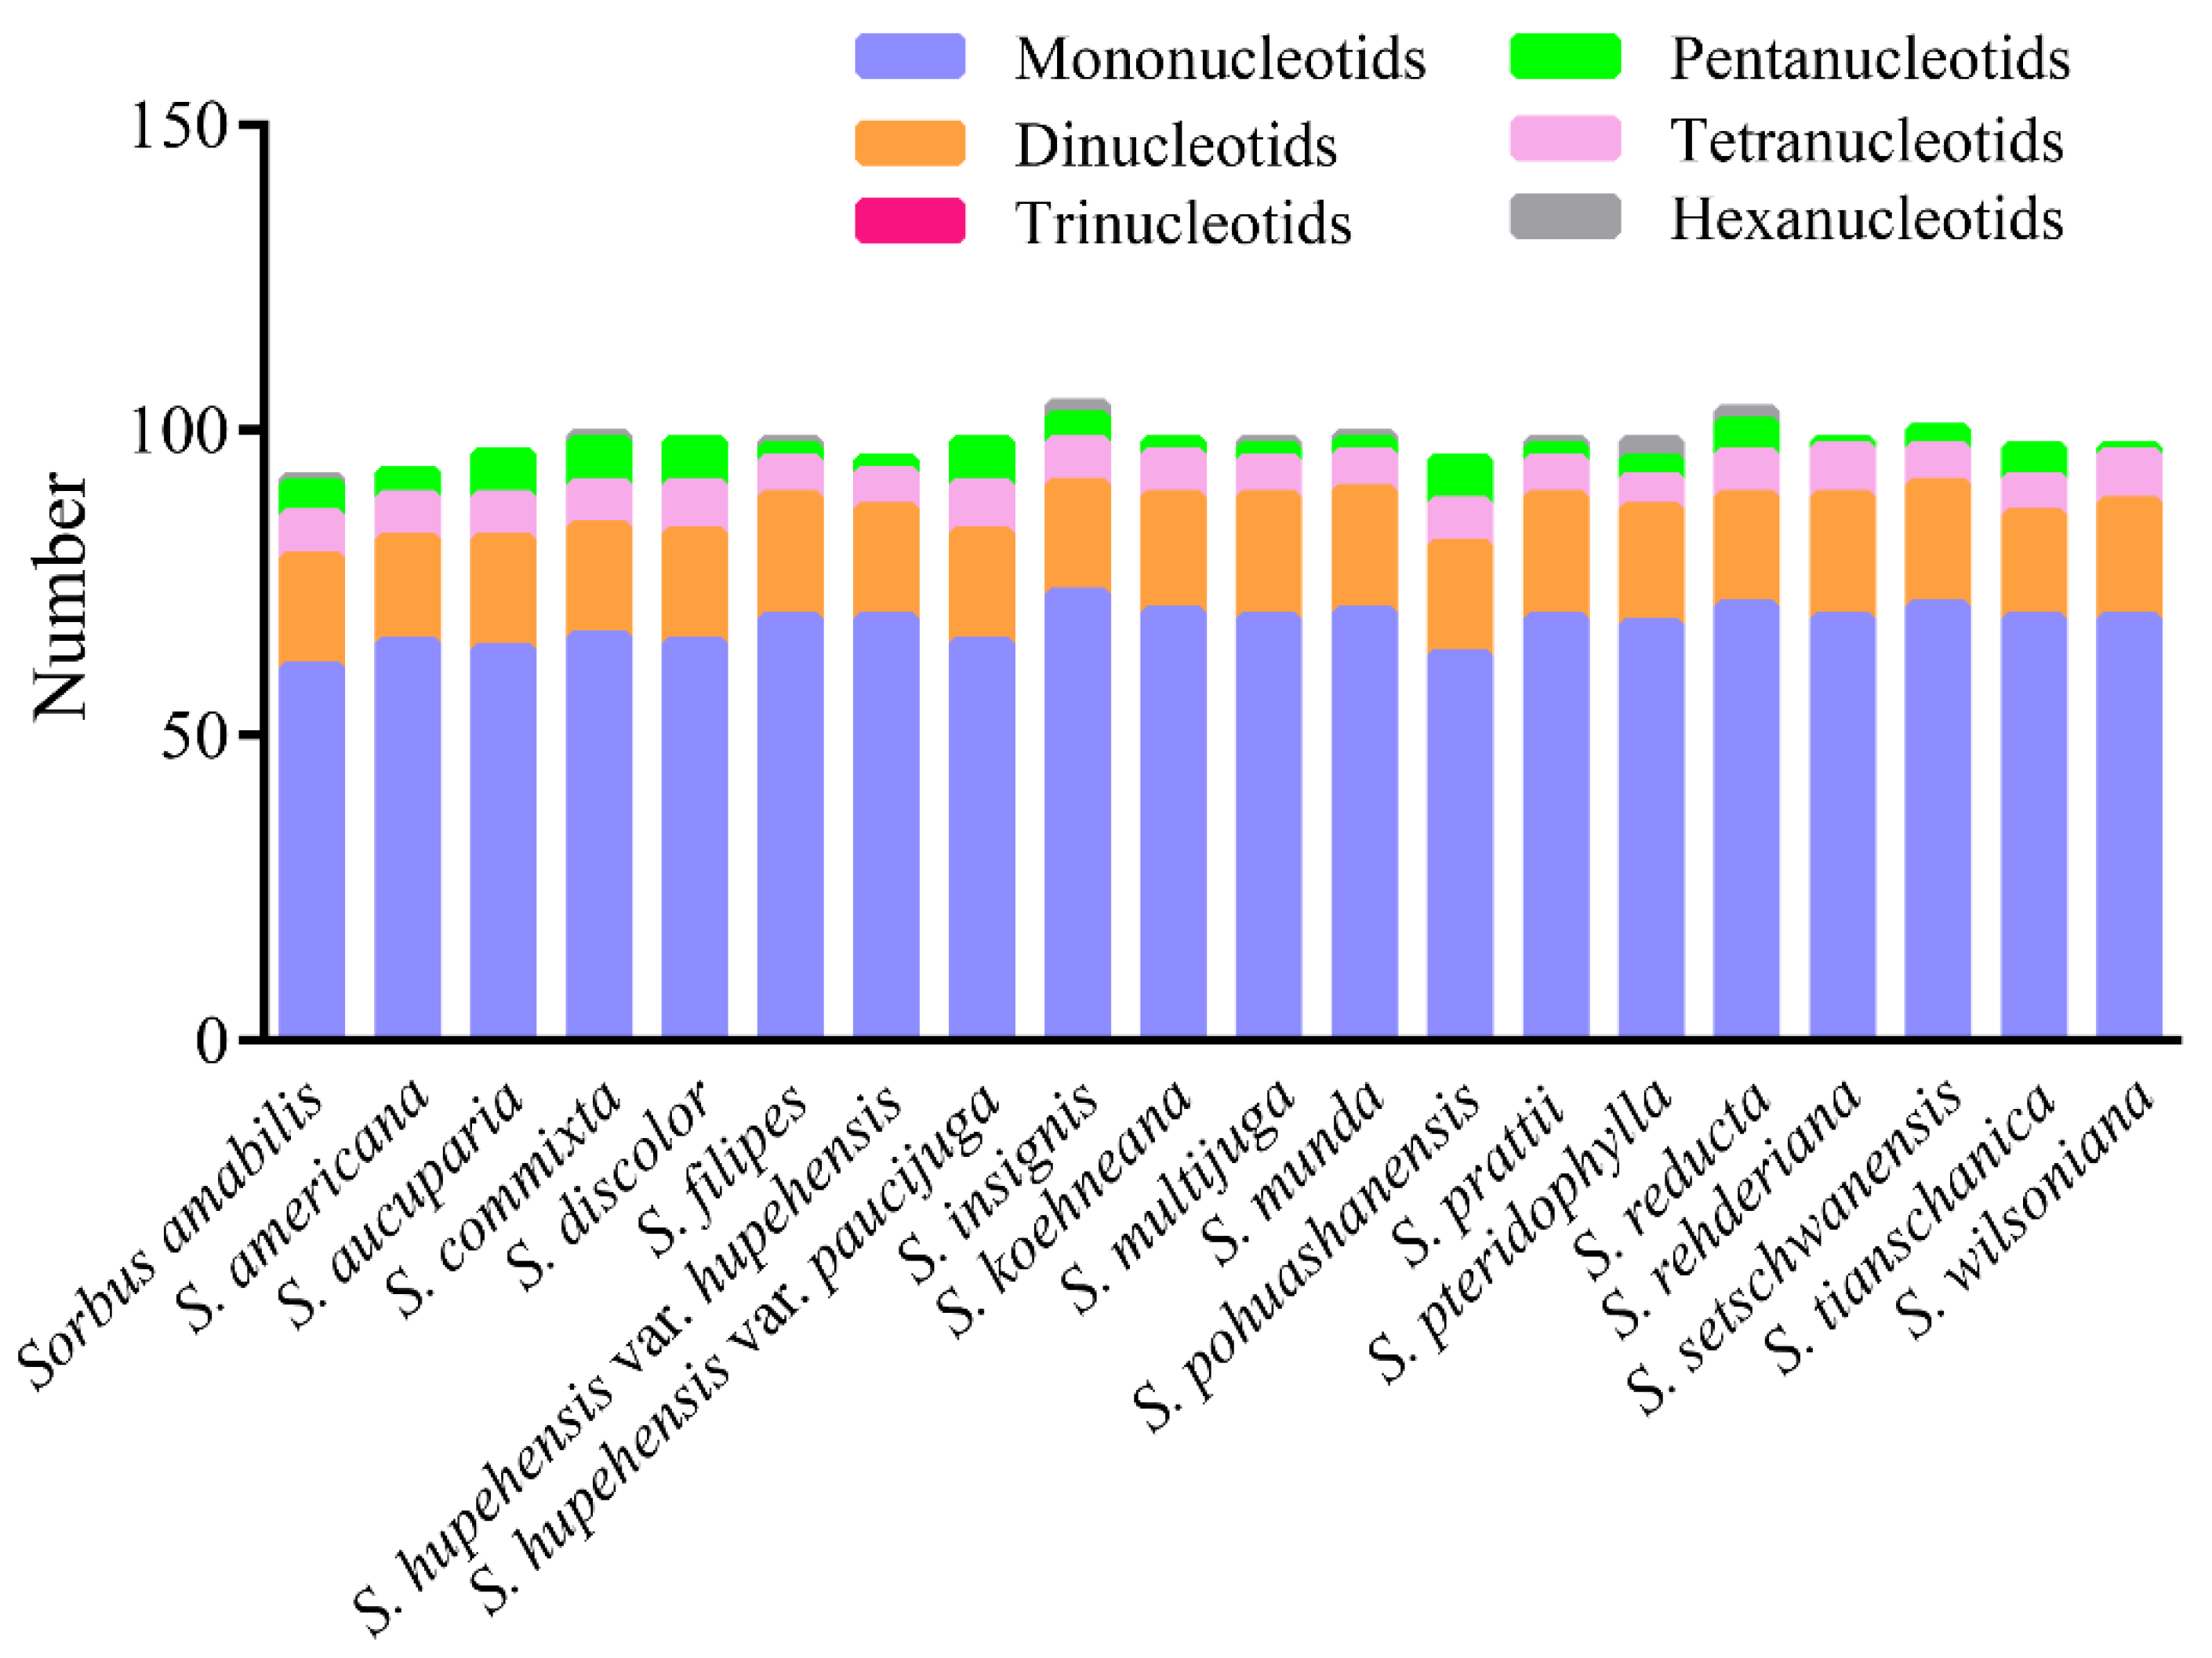
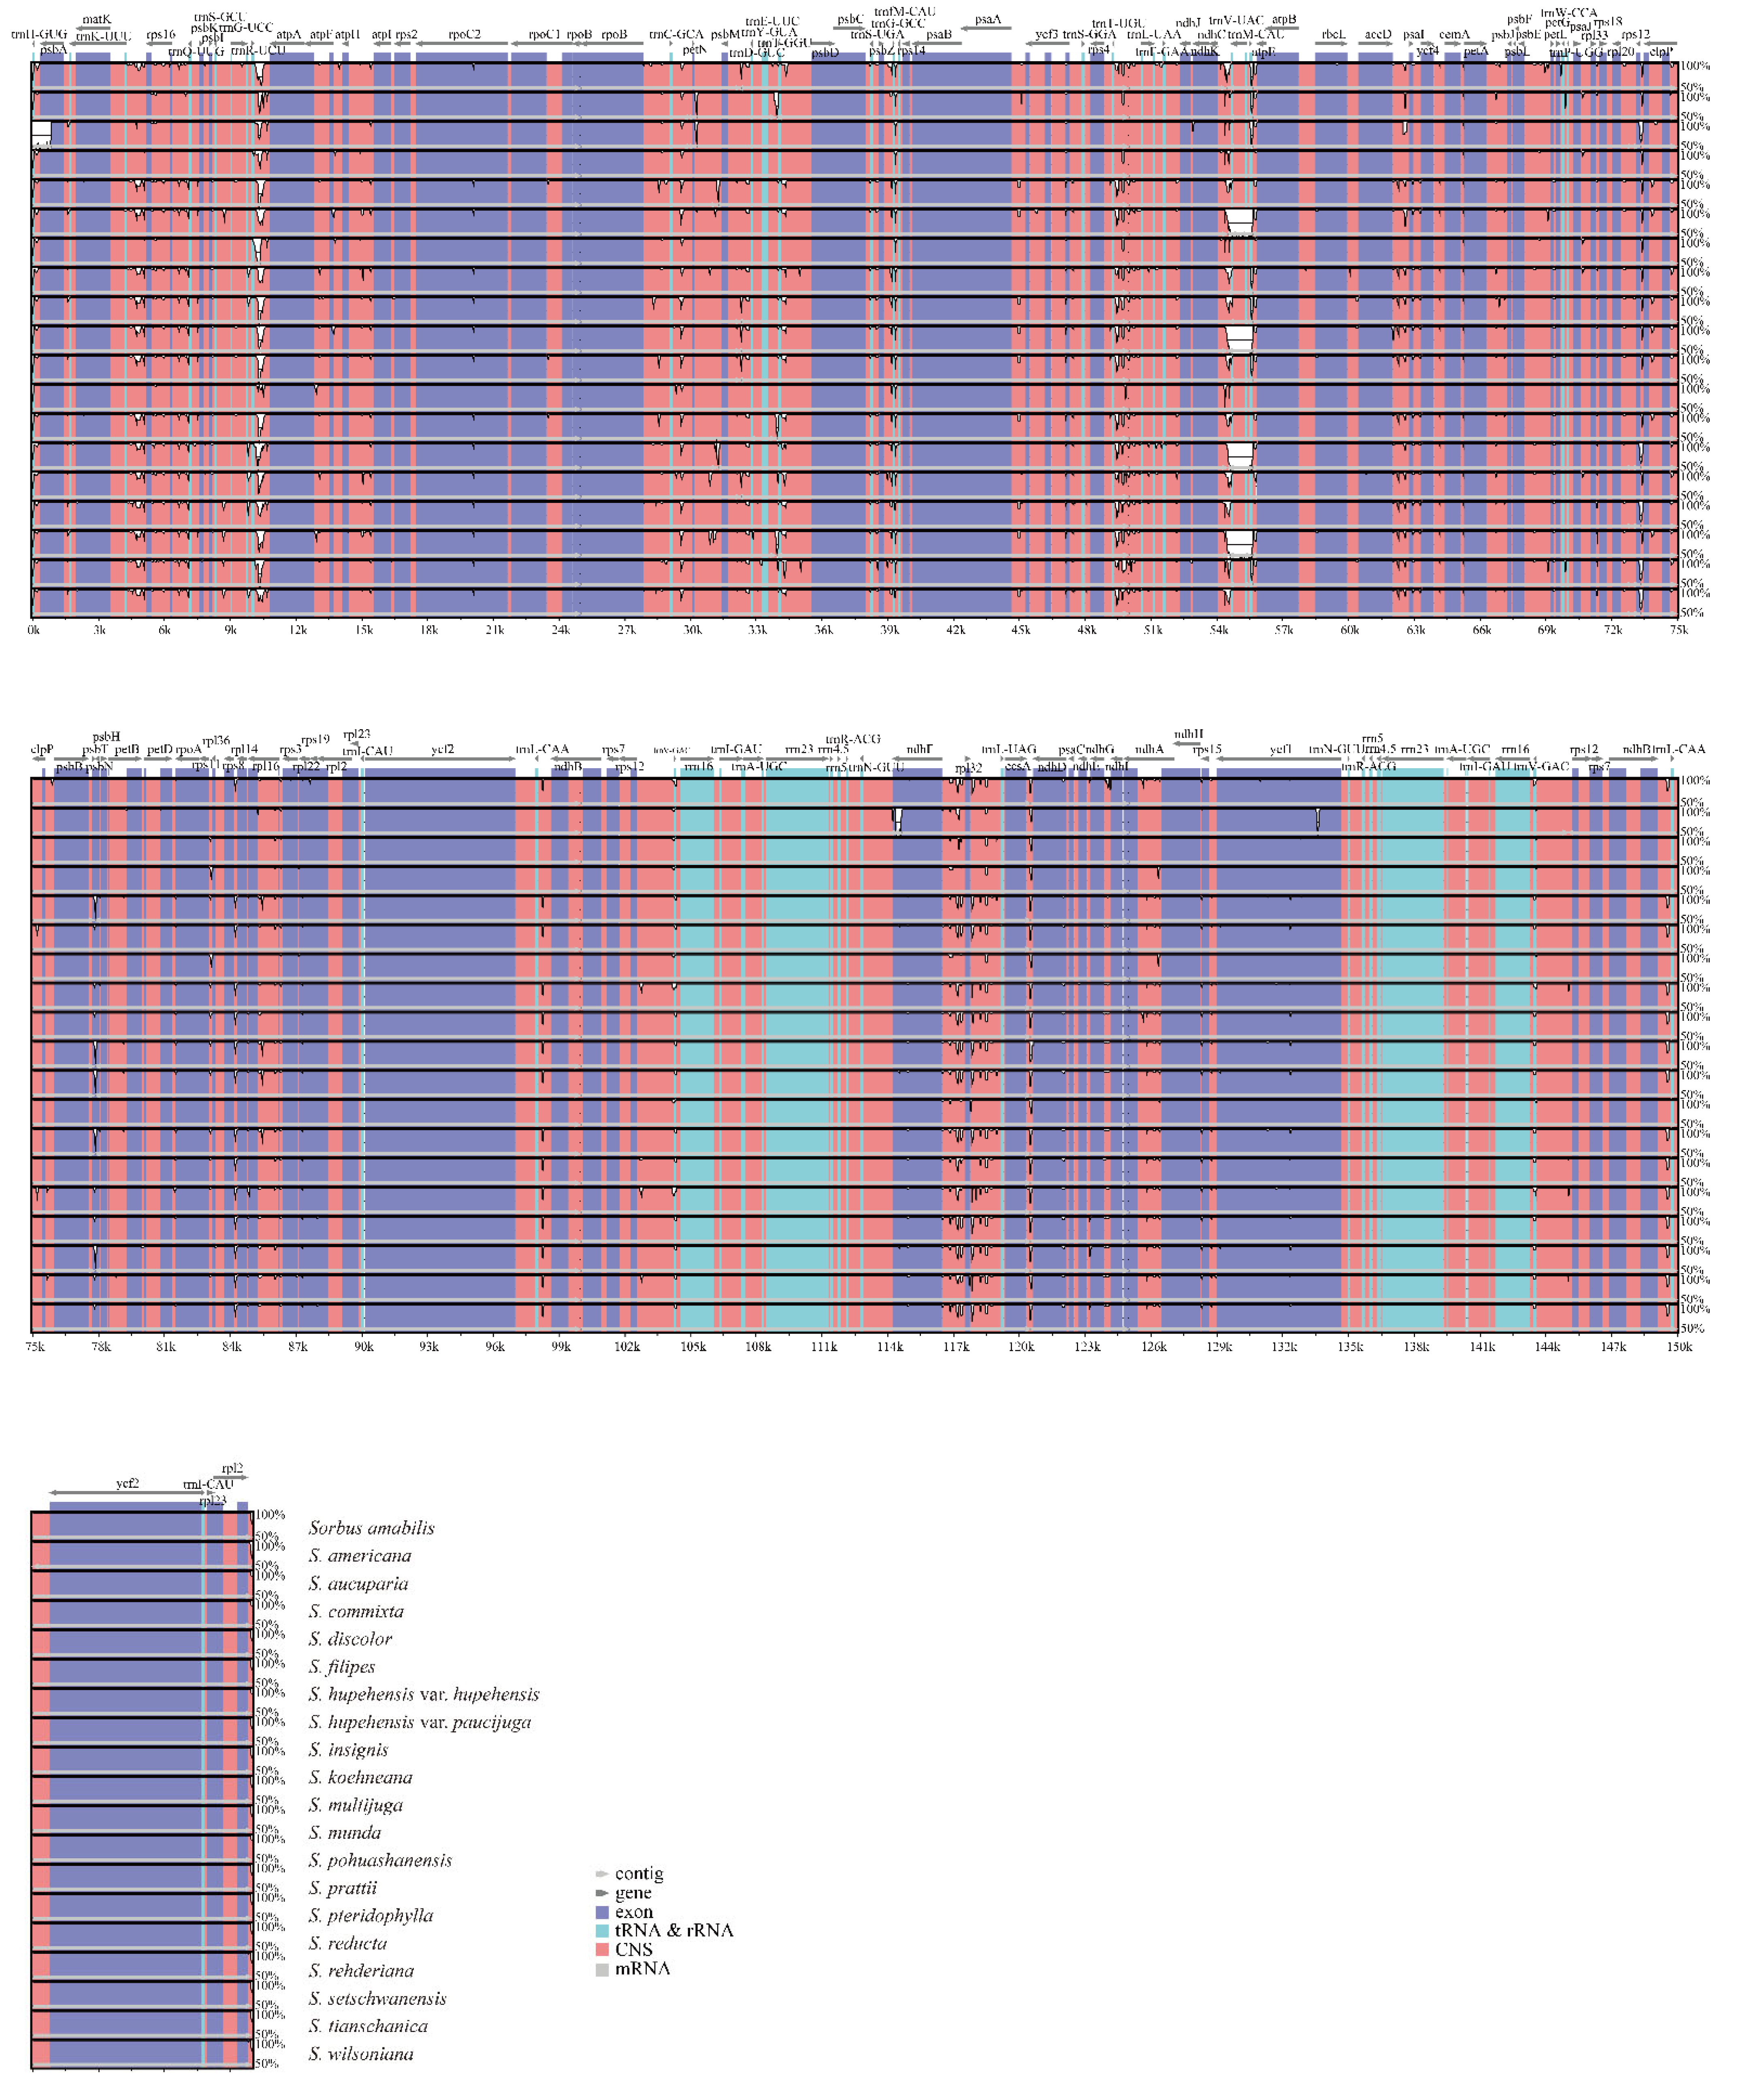
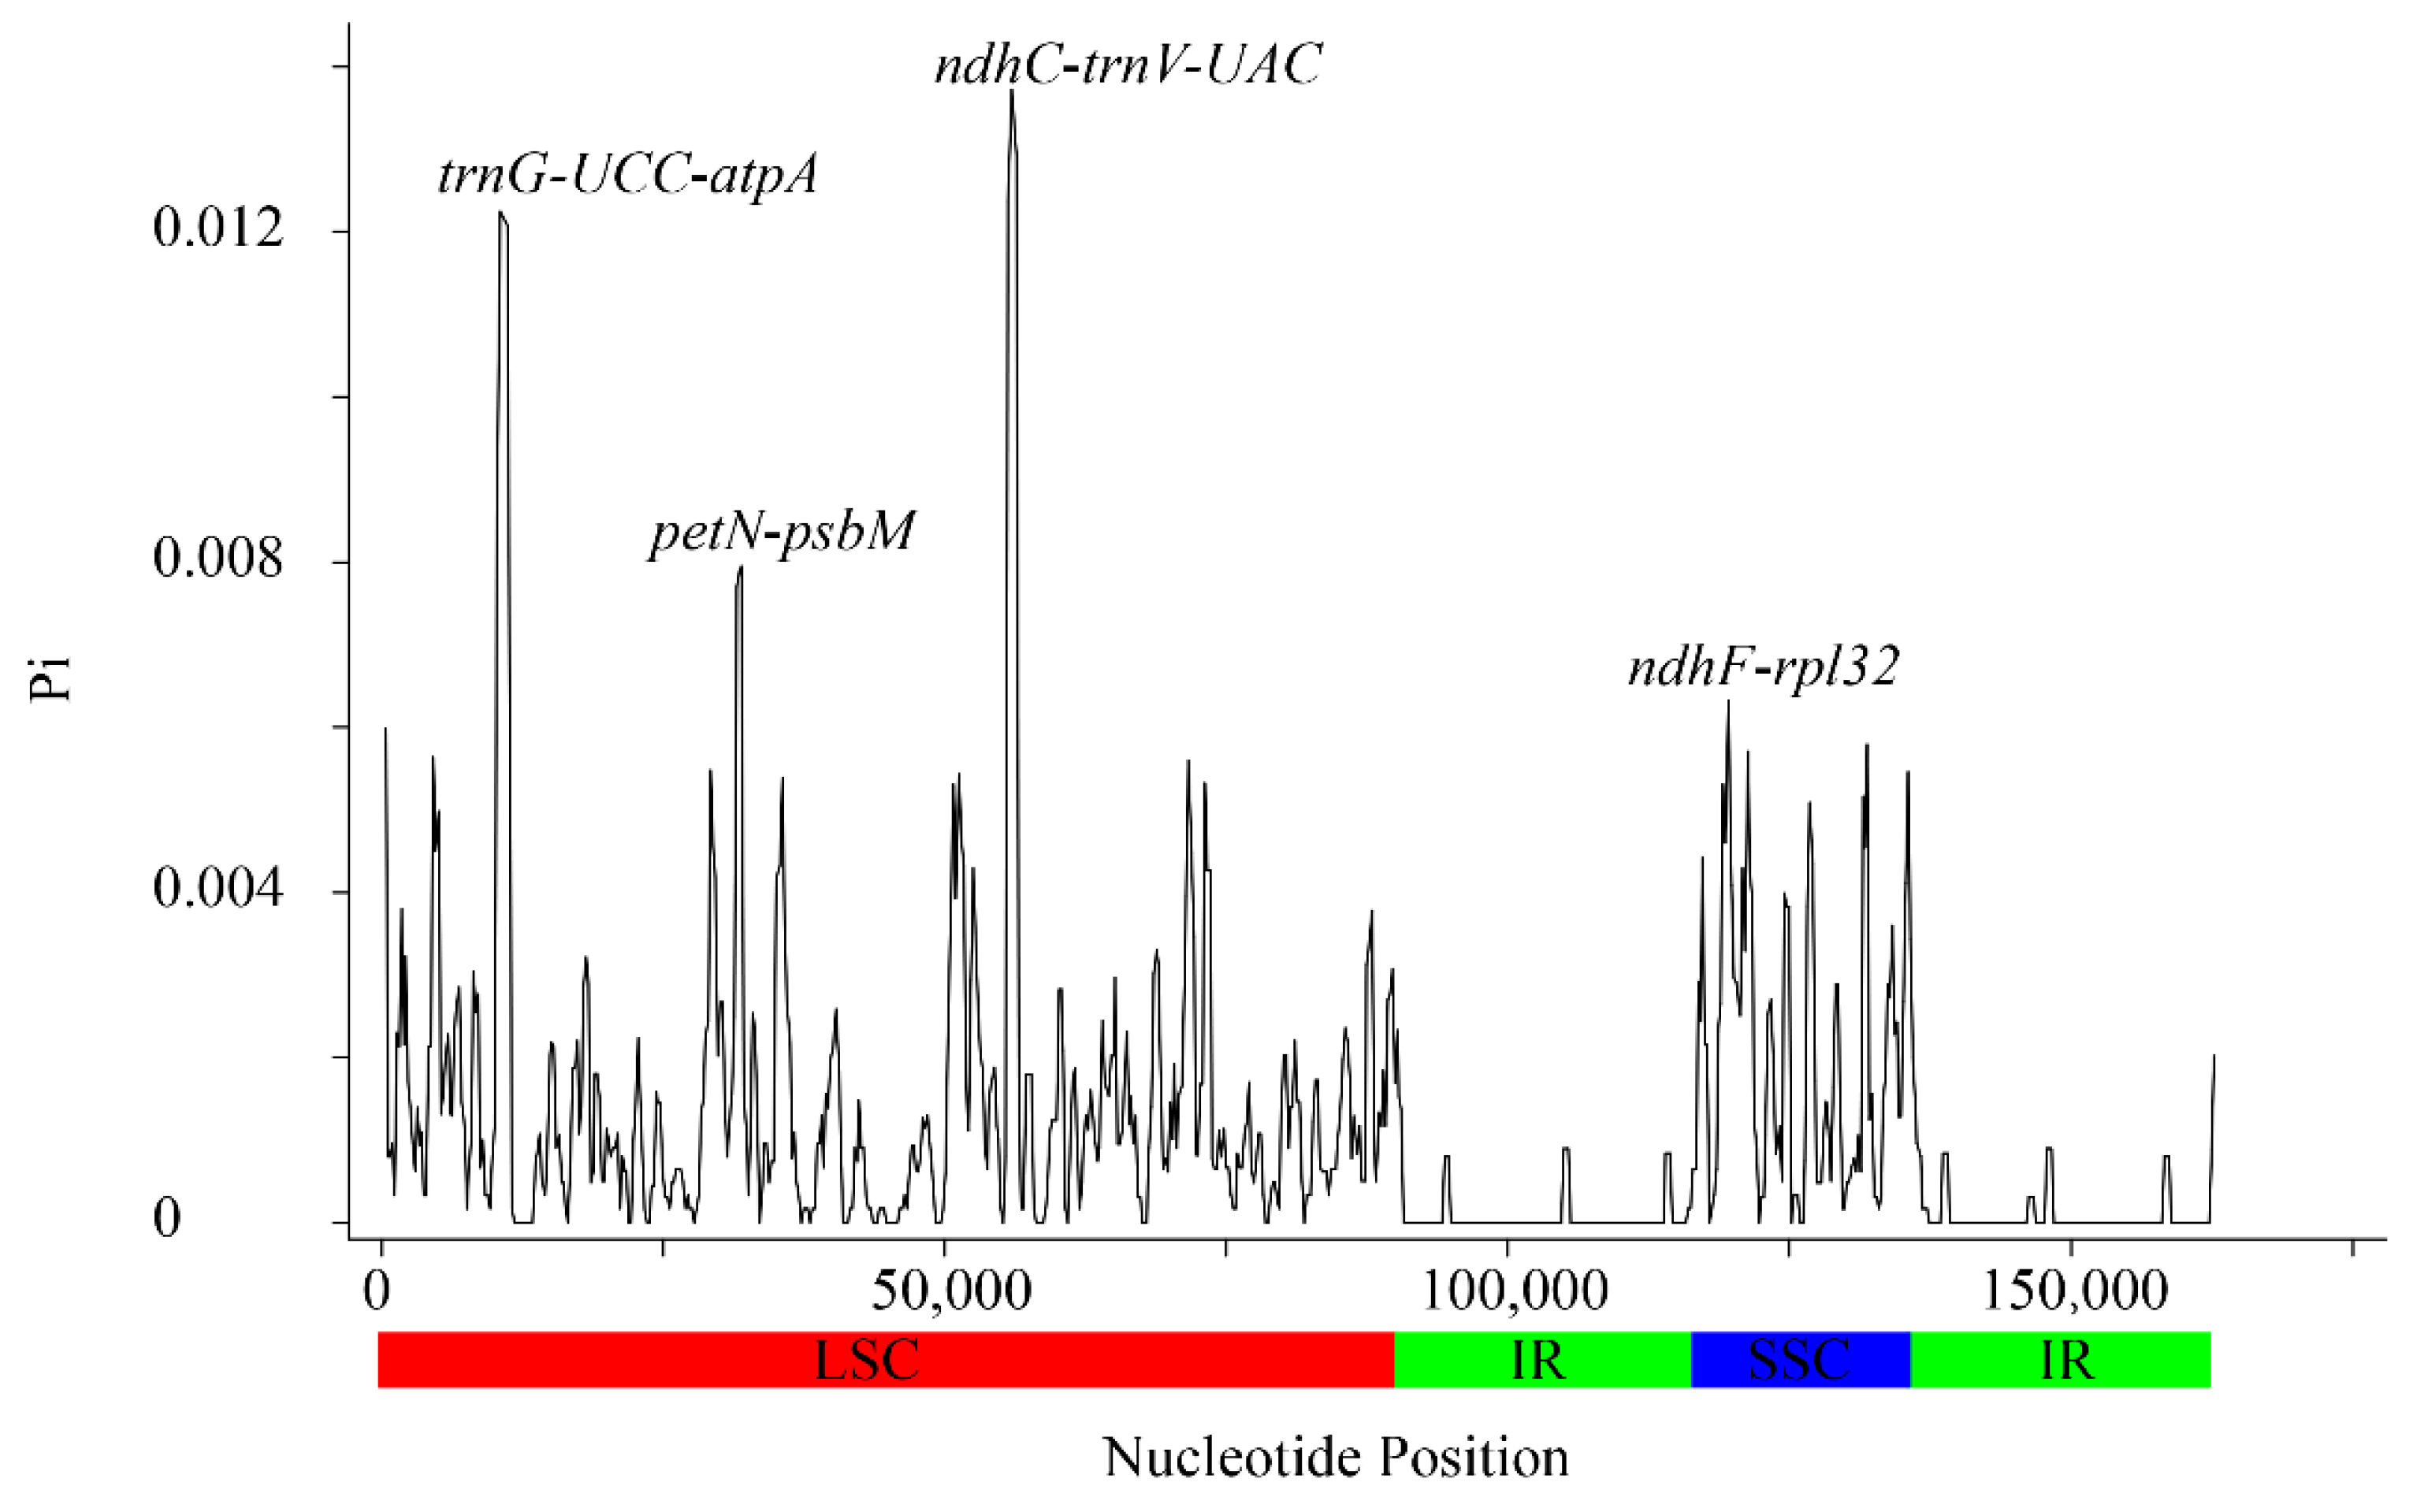
3.2. Sequence Polymorphism Variation and Divergence Analysis in Sorbus

Simple sequence repeats (SSRs) have a high degree of polymorphism and are usually employed as the molecular marker for species identification [38] and phylogenetic analyses [39]. SSRs contain tandem repeats of 1–6 bp and are widely distributed in the plastomes in plants [40]. In this study, we analyzed the mono-, di-, tri-, tetra-, penta-, and hexa-nucleotide repeat units, and a total of 1954 SSRs were identified in the 20 Sorbus species (Figure 3). Among them, mononucleotide repeats were the most abundant repeat motif, followed by dinucleotide repeats in each Sorbus species (Figure 3). We also found that there were more tetranucleotide repeats than pentanucleotide repeats in most of the Sorbus species. Hexanucleotide repeats were very rare across these cp genomes and were not even found in some species (Figure 3). However, trinucleotide repeats were not identified in all 20 Sorbus species (Figure 3). Moreover, mononucleotide and dinucleotide repeats showed a certain base preference. A/T showed the highest single nucleotide repeats, whereas the majority of dinucleotide repeats were AT/AT repeats (Table S4). These results are consistent with A/T enrichment in the cp genomes of plants [40].
In addition, the plastomes of the 20 Sorbus species were compared and plotted with mVSITA, using the cp genome of S. amabilis as a reference. Our results indicated that the complete cp genomes among the Sorbus species were relatively conserved, and two IR regions were the most conserved, whereas the SC regions (especially the LSC) were more divergent and variable (Figure 4). These variations were mainly distributed in non-coding regions, whereas most of the protein-coding regions had a high degree of conservation (Figure 4). Unsurprisingly, these findings were consistent with the patterns observed in many other plants [41,42]. Sliding window analysis further revealed highly variable regions in the plastomes of the 20 Sorbus species. The nucleotide diversity (pi) was calculated, and we found that the genomic regions of LSC and SSC had more nucleotide diversity than the two repeat regions (IRa and IRb) (Figure 5), which was consistent with the mVISTA results. In addition, four variable regions with pi values higher than 0.06 were detected, including trnG-UCC-atpA, petN-psbM, ndhC-trnV-UAC, and ndhF-rpl32 (Figure 5). Of these, trnG-UCC-atpA and ndhC-trnV-UAC showed the highest diversity, and both the pi values were greater than 0.12, which might have potential value for inferring the phylogenetic evolutionary relationship of the Sorbus species. Based on these results, the non-coding regions underwent more variations and divergences than the protein-coding regions. Subsequently, we further calculated the ratio of nonsynonymous (Ka) and synonymous (Ks) substitutions on 79 unique PCGs. The results indicated that the Ka/Ks values of all genes in these Sorbus species were less than one, suggesting that all the PCGs were under strong purifying selection (Table S5). Meanwhile, these results demonstrate that these genes might be very important in their functions during the evolution of the Sorbus species, and less variations occurred.

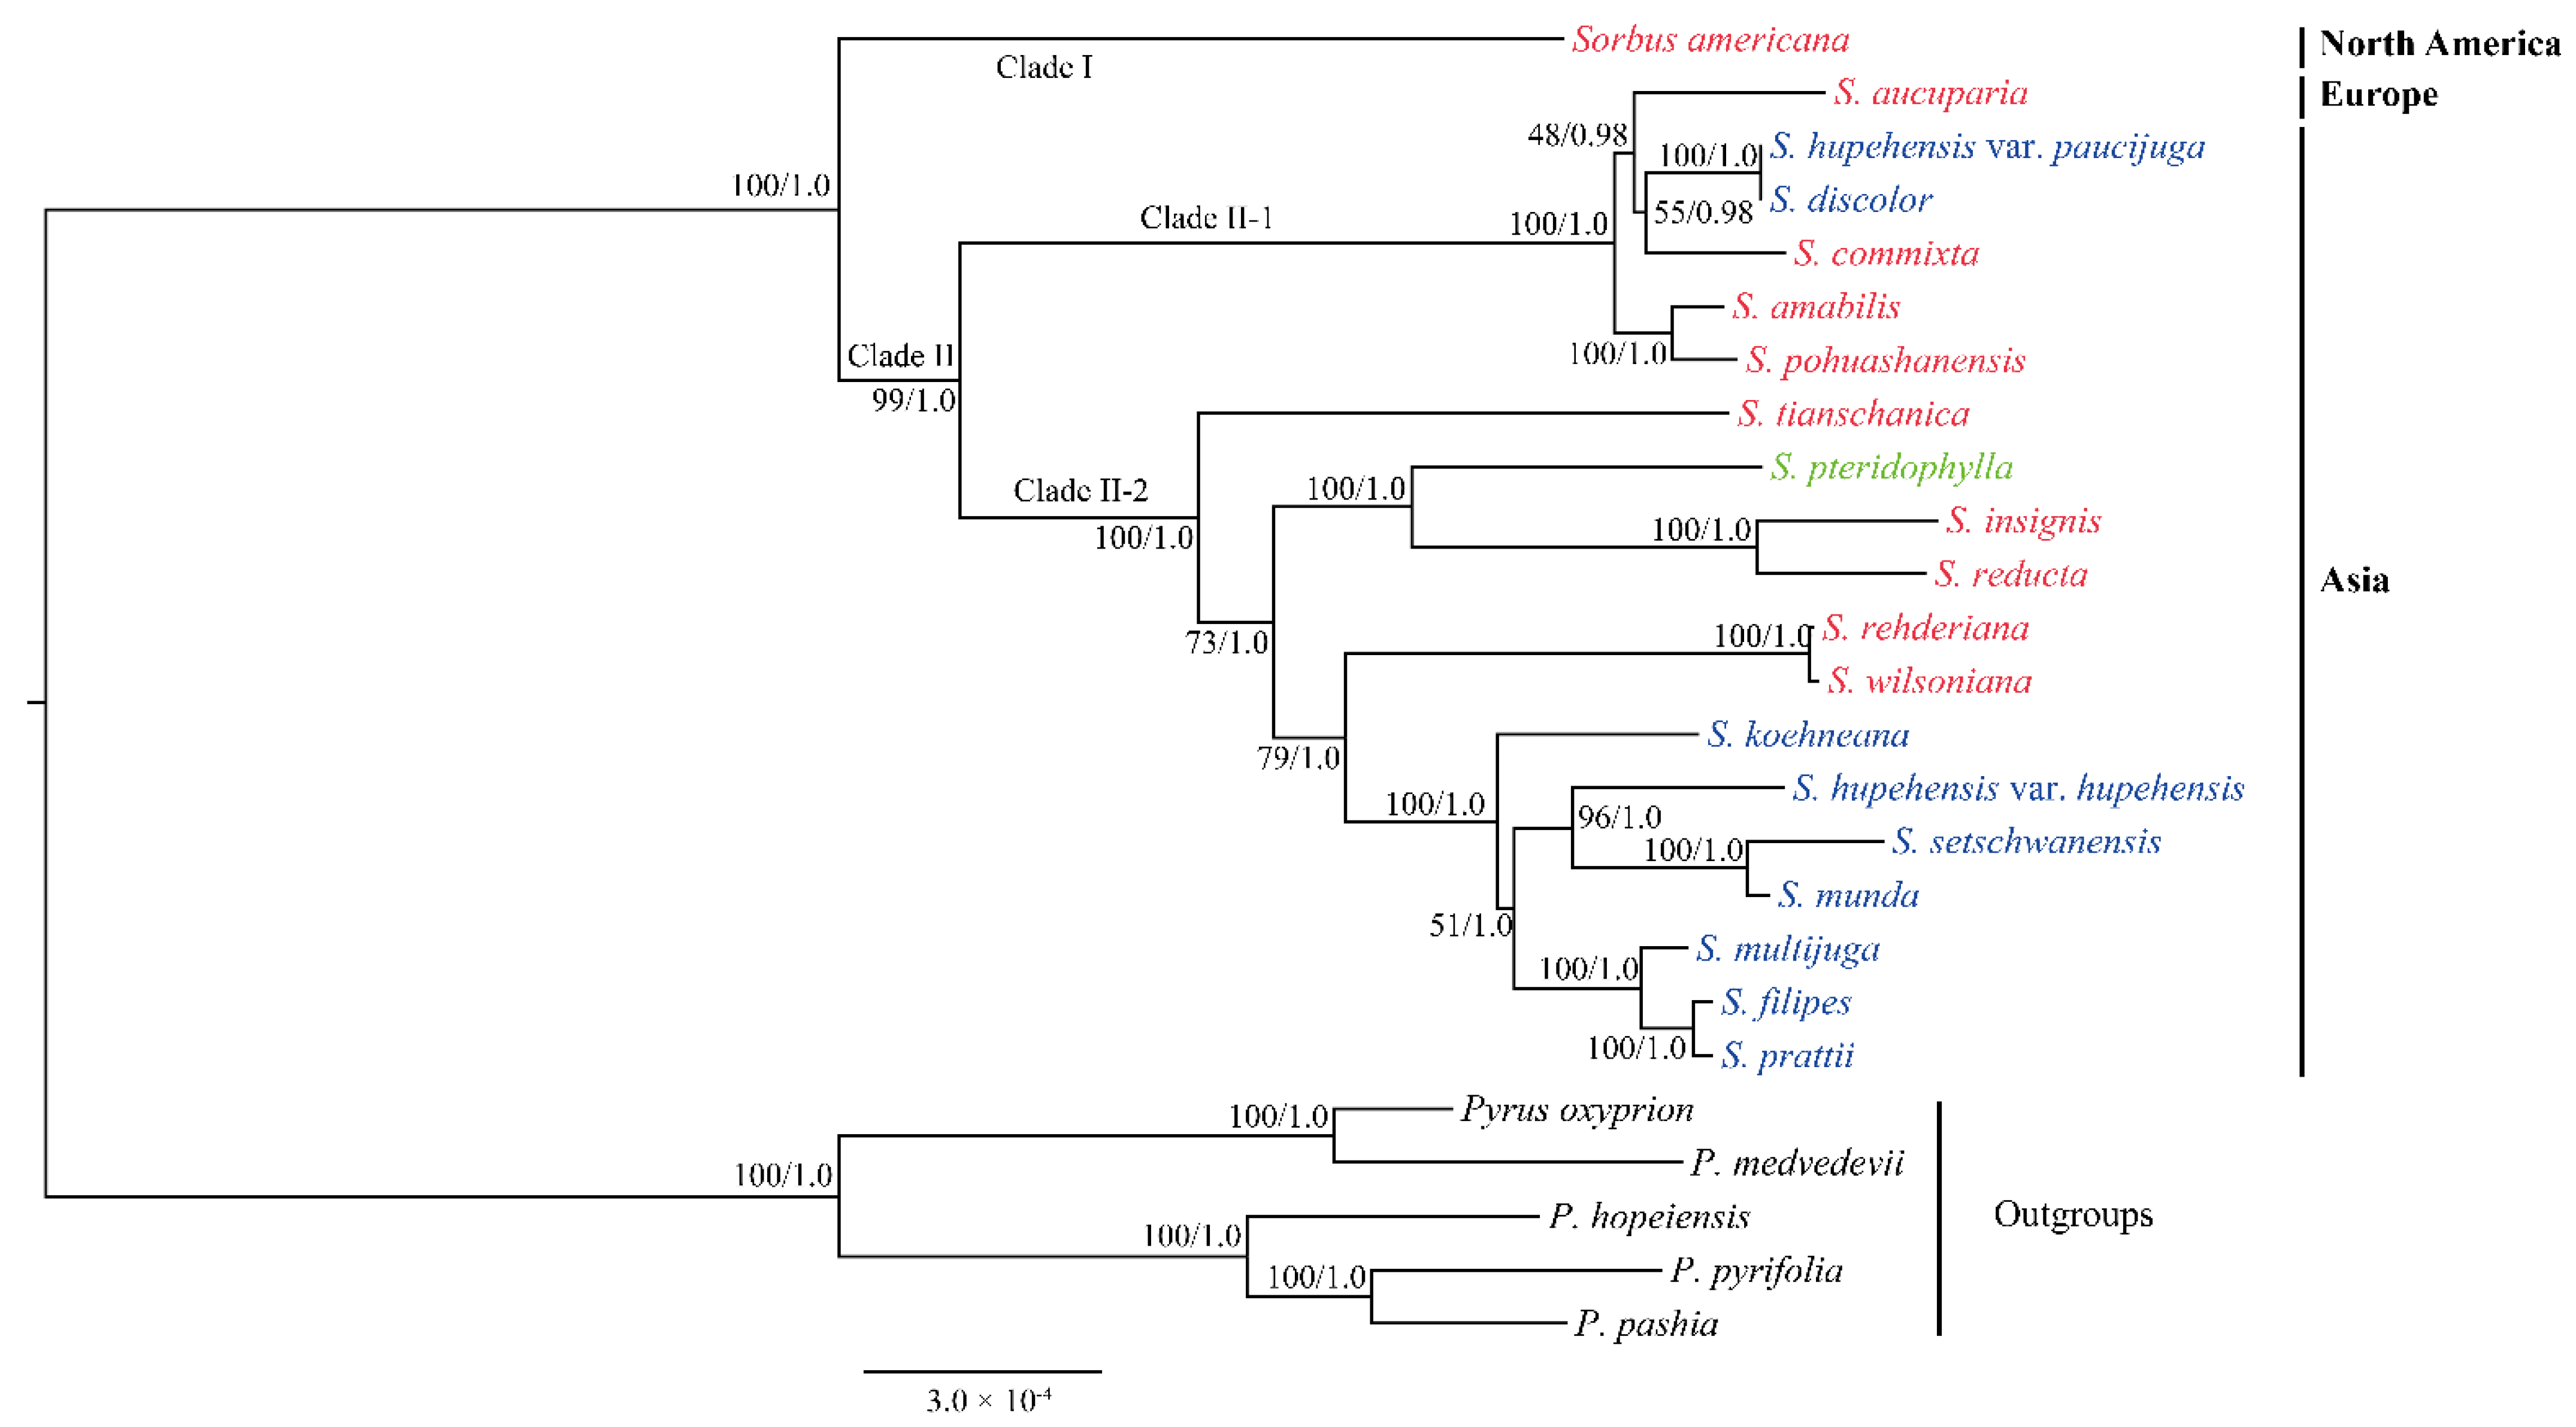
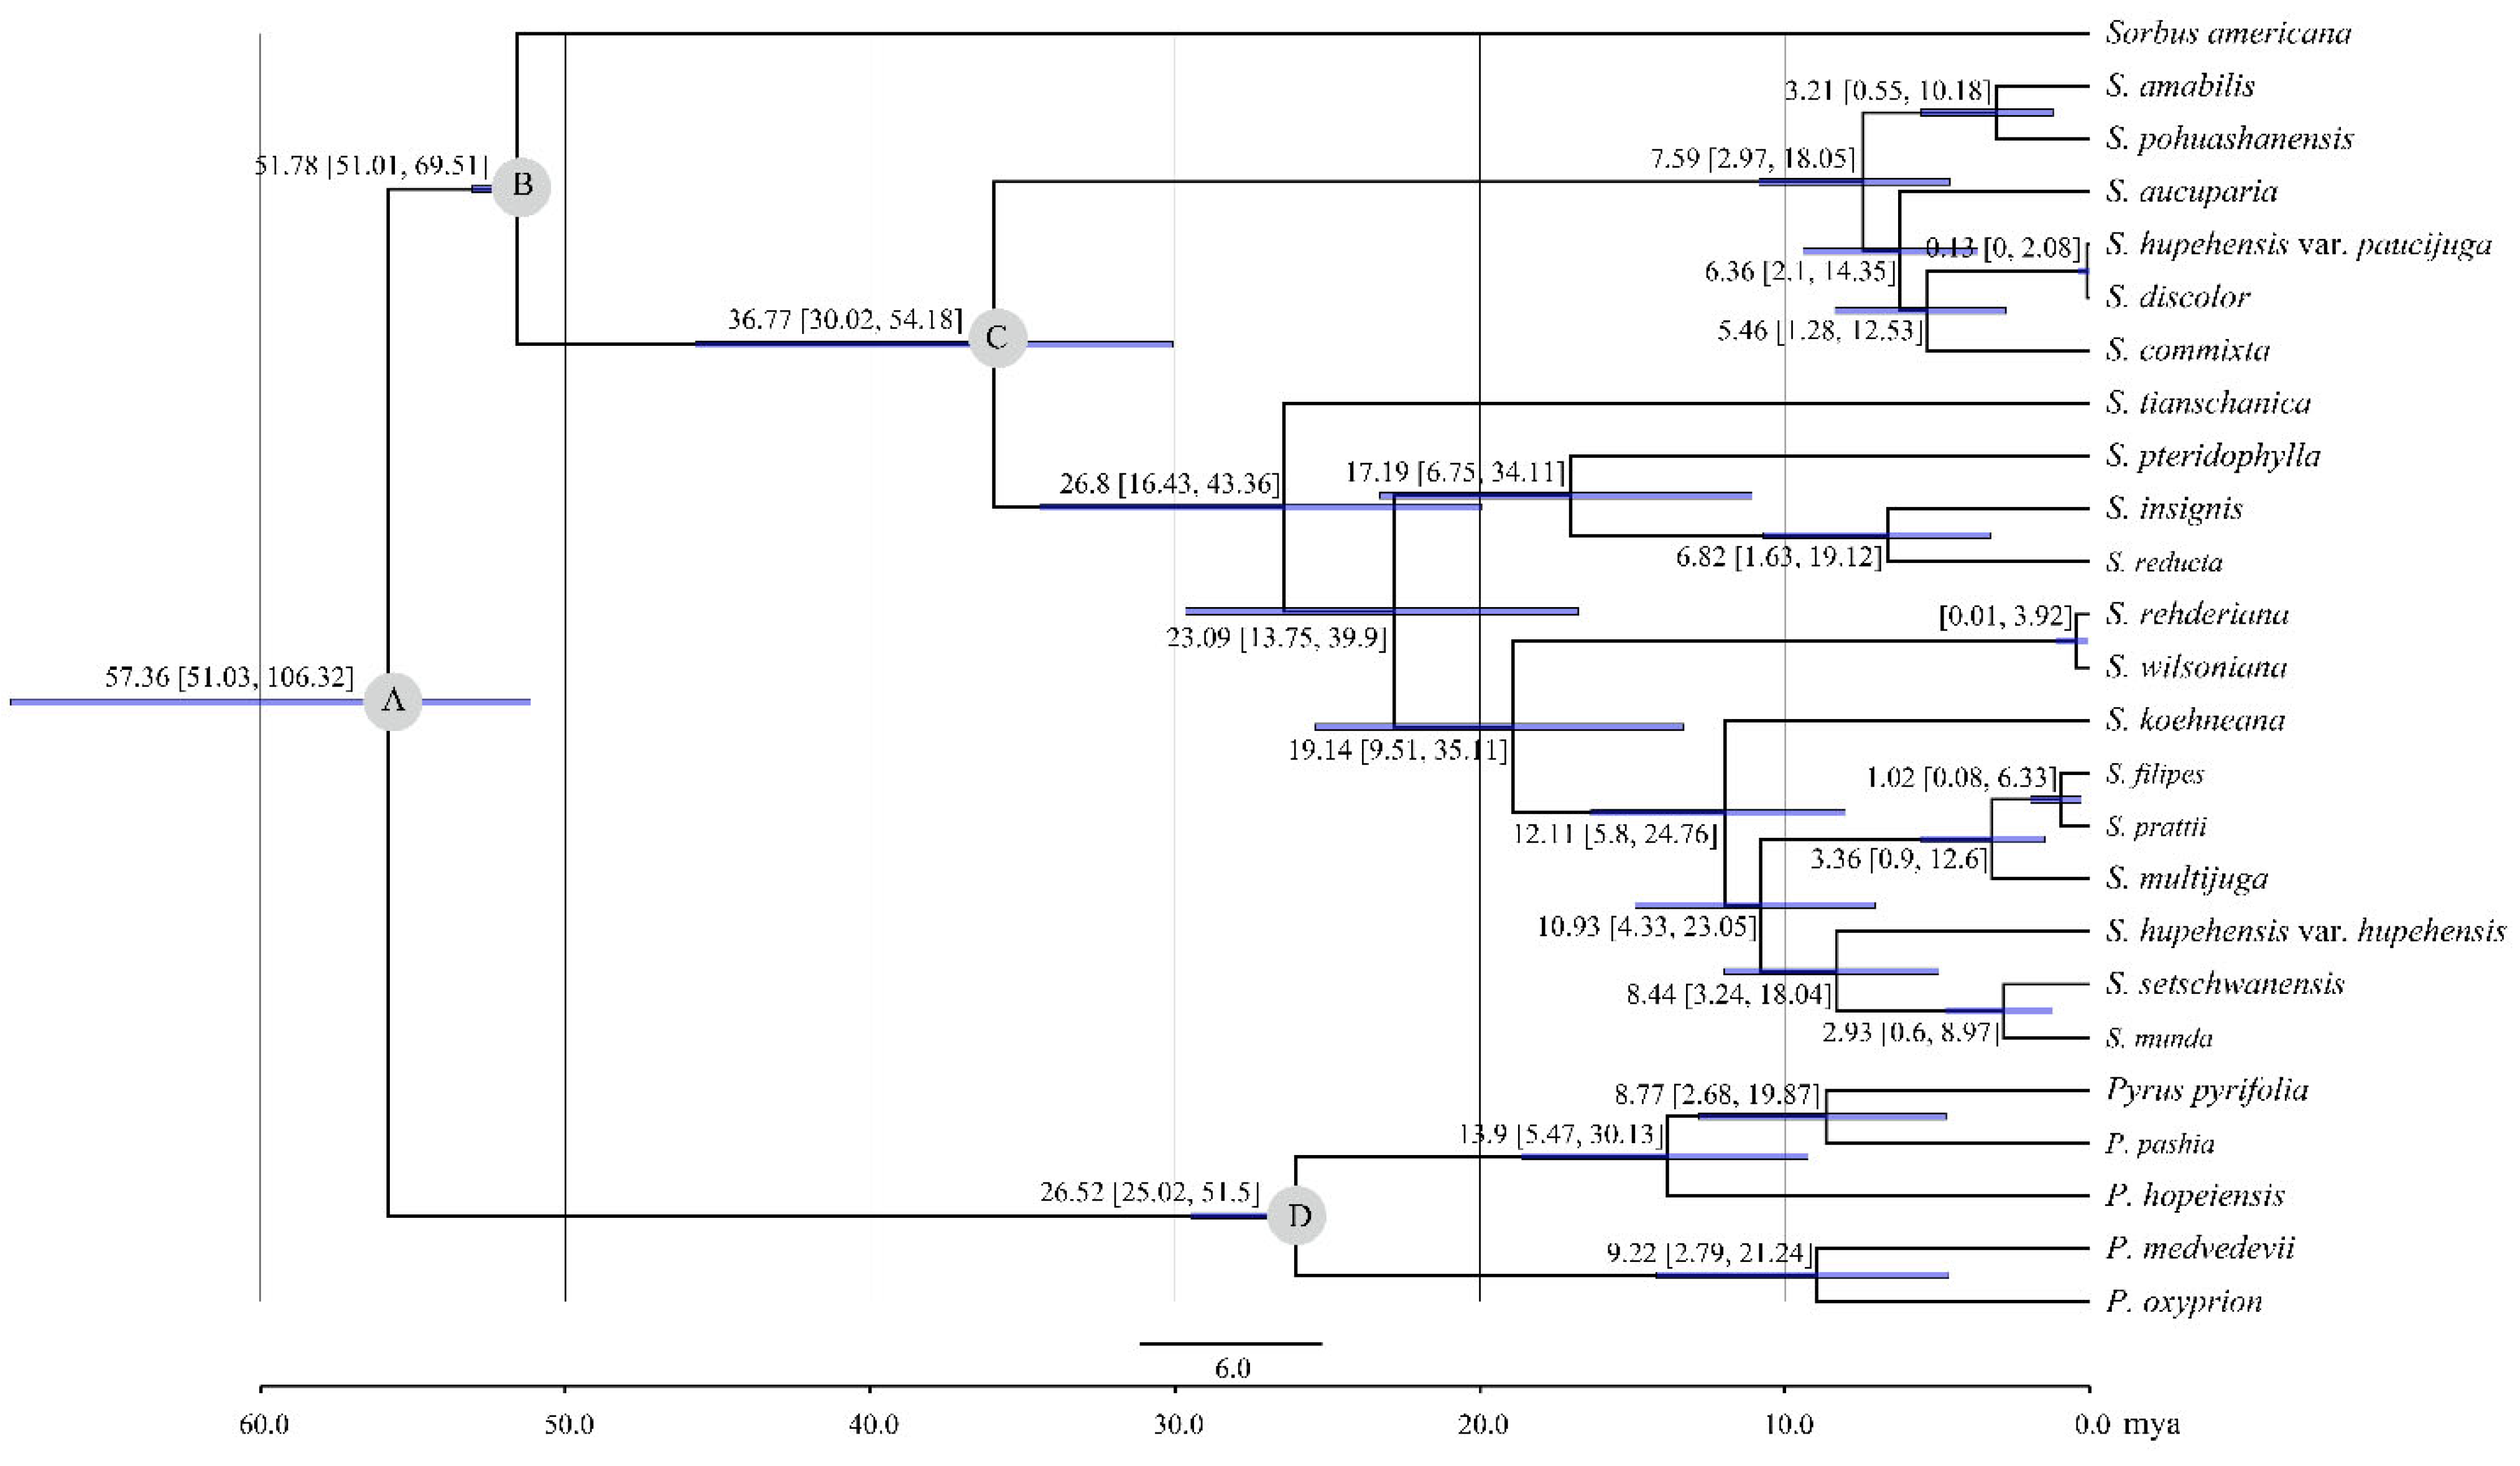
3.3. Phylogenetic Analysis of Sorbus

Chloroplast genomes have been characterized for reconstructing phylogenies of plants using three different approaches: restriction fragment/site comparisons, structural rearrangements, and sequence variations [13]. In the present study, the cp genomes of eight Sorbus species were newly sequenced and compared with those of twelve released species in this genus. The comparative results indicated that the overall structure of the cp genomes of 20 Sorbus species was highly conserved (Figure 1 and Figure S2). Genetic variations (i.e., SSR) were observed in the cp genomes (Figure S2, Figure 4 and Figure 5) and can thus be used for reconstructing the phylogeny of Sorbus. ML and BI analysis results showed that the tested Sorbus species formed an identical tree topology (Figure 6). We found that S. americana from North America was the basal species in Sorbus, with 100% bootstrap support and 1.0 posterior probability (Clade I). The remaining 19 Sorbus species were classified into two sister groups (Clade II-1 and Clade II-2) (Figure 6). One sister group (Clade II-1) contained six Sorbus species: five species from Asia (S. discolor, S. hupehensis var. paucijuga, S. pohuashanensis, Sorbus amabilis, S. commixta) and S. aucuparia from Europe. The other 13 Sorbus species from Asia formed another sister group (Clade II-2), in which S. tianschanica was an early divergent species. All these major clades were strongly supported with high bootstrap support and posterior probability values (Figure 6).
In two previous studies [9,12], phylogenetic analyses resolved two major lineages within Sorbus based on nucleotide and chloroplast segments. However, the phylogenetic trees indicated that S. americana from North America was embedded into one clade with S. aucuparia from Europe and some Sorbus species from Asia [9,12]. These topological relationships within Sorbus apparently did not coincide with our results (Figure 6). Further, the phylogenetic results of the two studies have a lower support resolution of clades, and the phylogenetic relationships between Sorbus and other genera or infrageneric phylogeny of Sorbus conflicted [9,12]. Li et al. [12] attributed their conflict to the selection of different genetic markers, whereby four nucleotide segments (LEAFY-2, GBSSI-1, SBEI and WD) and one chloroplast segment (rps16-trnK) were used in his study. By contrast, another study used a greater number of chloroplast markers (trnL-trnF, trnK + matK, rpl16 intron, rps16 intron, atpB-rbcL, rbcL, trnG-trnS, rpl20-rps12, trnC-ycf6, psbA-trnH, and trnH-rpl2) and one nucleotide segment (ITS) [9]. These different topologies exert an important influence on the dispersal route of Sorbus. Therefore, we will collect more Sorbus species from different geographic origins to further determine their topological relationship.
In addition, fruit color is usually used as an indicator of traditional taxonomy within Sorbus [4]. In our results, the species in Clade I and II-1 were mainly characterized by red or orange-red fruits, whereas most species of Clade II-2 had white fruits (Figure 6). However, few of the species with different fruit colors were nested in the two sister groups of Clade II, such as two species with white fruit: S. discolor and S. hupehensis var. paucijuga in Clade II-1. Of course, there was low nodal support in infrageneric phylogeny in our results. For example, a low support value (< 50%) occurred between S. aucuparia from Europe and three other Asian species (Figure 6). These phenomena also appeared in the phylogenetic results of two previous studies [9,12]. Apomixis, hybridization, and polyploidy are common in Sorbus [43,44]. Therefore, infrageneric classification of Sorbus becomes more complex, and the fruit color alone cannot be used as a diagnostic characteristic for the clades within Sorbus.
The divergence time between Sorbus and Pyrus was estimated at 57.36 Ma in the Paleocene, with a 95% HPD range of 51.03–106.32 Ma (Figure 7). The basal node for S. americana (Clade I) showed a divergence time of 51.78 Ma (51.01–69.51 Ma, 95% HPD) (Figure 7). These results did not coincide with a previous study, in which Sorbus diverged from Osteomeles and Dichotomanthes at about 31 Ma, and the split within Sorbus occurred at about 41 Ma [12]. It has been reported that the oldest Sorbus-like macrofossils from North America might date back to 50–52 Ma [45]. Apparently, the divergence time of the Sorbus genus or the species from North America was inconsistent with the fossil record in this previous study [12]. Moreover, Clade II-1 and II-2 were split at 36.77 Ma (30.02–54.18 Ma, 95% HPD) in the Eocene (Figure 7). Sorbus tianschanica within Clade II-2 originated at 26.8 Ma (16.43–43.36 Ma, 95% HDP) during the late Eocene to Oligocene (Figure 7). The origination of the remainders of Sorbus within Clade II occurred in the Miocene (Figure 7), which is similar to the report of Li et al. [12].

4. Conclusions

In this study, the cp genomes of eight Sorbus s. str. species were newly sequenced and comparatively analyzed with twelve released species in this genus. Our results indicated that all cp genomes of the Sorbus species had a typical quadripartite DNA structure and showed little genome size variation, ranging from 159,850 bp to 160,280 bp, and a stable GC level (36.52–36.58%). All cp genomes of Sorbus contained the same gene content, indicating no gene loss or intron loss occurred during evolution. Moreover, these genes were organized in the same order and had a good collinearity among all cp genomes of the Sorbus species, although long repeat units were found in each species. Therefore, these results indicate that no cp genome of the Sorbus species had a rearrangement in structure. Comparative analyses demonstrated that numerous SSRs were observed in the cp genome of each Sorbus species, and most sequence variations appeared in non-coding regions. By contrast, the protein-coding genes were all under purifying selection, and four intergenic regions were identified as mutation spots. The phylogenetic analysis based on the complete cp genomes showed that Sorbus was resolved into two major clades, in which S. americana from North America formed Clade I and originated at 51.78 Ma, and the other species from Europe and Asia were divided into two sister groups (Clade II-1 and Clade II-2) with high support values, which were split at 36.77 Ma. These results not only enrich the data on the cp genomes of Sorbus, but also provide the basis for further studying the phylogenetic relationship and biogeography of the Sorbus species.

Supplementary Materials

The following supporting information can be downloaded at: https://www.mdpi.com/article/10.3390/biom12111648/s1, Figure S1: Number of four repeats in the cp genomes of 20 Sorbus species; Figure S2: Collinearity analysis of chloroplast genomes across 20 Sorbus species. Local collinear blocks are labeled by the same color; Table S1: The information of 20 Sorbus species used in this study; Table S2: Gene information of the different functional categories of 20 Sorbus plastomes; Table S3: Details of the repeats in each Sorbus species; Table S4: Details of SSRs in the cp genomes of 20 Sorbus; Table S5: The Ka/Ks ratios of protein-coding genes.

Author Contributions

L.-Z.L. conceived and designed the study. S.-D.Z. collected the samples, performed the experiments, analyzed the data, and wrote the manuscript. L.-Z.L. revised the manuscript. All authors contributed to the article. All authors have read and agreed to the published version of the manuscript.

Funding

This research was funded by the National Natural Science Foundation of China, grant number 31860052, the Science and Technology Program of Liupanshui, grant number 52020-2022-PT-20 and the Science and Technology Program of Liupanshui, grant number 52020-2019-05-05.

Data Availability Statement

The datasets generated and analyzed during the current study can be accessed in the NCBI GenBank database (https://www.ncbi.nlm.nih.gov/genbank/), and the accession numbers are listed in Table S1.

Acknowledgments

We thank Germplasm Bank of Wild Species, Kunming Institute of Botany, Chinese Academy of Sciences for providing the samples.

Conflicts of Interest

The authors declare no conflict of interest.

References

  1. Aldasoro, J.J.; Aedo, C.; Navarro, C.; Munoz Garmendia, F. The genus Sorbus (Maloideae, Rosaceae) in Europe and in North Africa: Morphological analysis and systematics. Syst. Bot. 1998, 23, 189–212. [Google Scholar] [CrossRef]
  2. Phipps, J.B.; Robertson, K.R.; Rohrer, J.R.; Smith, P.G. Origins and evolution of subfam. Maloideae (Rosaceae). Syst. Bot. 1991, 16, 303–332. [Google Scholar] [CrossRef]
  3. Phipps, J.B.; Robertson, K.R.; Smith, P.G.; Rohrer, J.R. A checklist of the subfamily Maloideae (Rosaceae). Can. J. Bot. 1990, 68, 2209–2269. [Google Scholar] [CrossRef]
  4. Yü, D.; Lu, L. Sorbus L. In Flora Reipublicae Popularis Sinicae; Science Press: Beijing, China, 1974; Volume 36, pp. 283–344. [Google Scholar]
  5. Liu, Y.-H.; Li, J.-X.; Zhou, L.-Y.; Yang, J.; Wang, S.; Guo, L.-P. Research advances in Sorbus plants. Chin. J. Exp. Tradit. Med. Formulae 2019, 25, 195–205. [Google Scholar]
  6. Sołtys, A.; Galanty, A.; Podolak, I. Ethnopharmacologically important but underestimated genus Sorbus: A comprehensive review. Phytochem. Rev. 2020, 19, 491–526. [Google Scholar] [CrossRef]
  7. Zhang, S.D.; Jin, J.J.; Chen, S.Y.; Chase, M.W.; Soltis, D.E.; Li, H.; Yang, J.; Li, D.; Yi, T. Diversification of Rosaceae since the Late Cretaceous based on plastid phylogenomics. New Phytol. 2017, 214, 1355–1367. [Google Scholar] [CrossRef] [Green Version]
  8. Potter, D.; Eriksson, T.; Evans, R.C.; Oh, S.; Smedmark, J.E.E.; Morgan, D.R.; Kerr, M.; Robertson, K.R.; Arsenault, M.; Dickinson, T.A.; et al. Phylogeny and classification of Rosaceae. Plant Syst. Evol. 2007, 266, 5–43. [Google Scholar] [CrossRef]
  9. Lo, E.Y.; Donoghue, M.J. Expanded phylogenetic and dating analyses of the apples and their relatives (Pyreae, Rosaceae). Mol. Phylogenet. Evol. 2012, 63, 230–243. [Google Scholar] [CrossRef]
  10. Zheng, D.-M.; Zhang, M.-L. A cladistic and phenetic analysis of the infrageneric relationships of Sorbus s. l. (Maloideae, Rosaceae) based on the morphological characters. Acta Hortic. Sin. 2007, 34, 723–728. [Google Scholar]
  11. Mcallister, H. Genus Sorbus: Mountain Ash and Other Rowans; The Royal Botanic Gardens, Kew: London, UK, 2005; ISBN 9781842460887. [Google Scholar]
  12. Li, M.; Ohi-Toma, T.; Gao, Y.-D.; Xu, B.; Zhu, Z.-M.; Ju, W.-B.; Gao, X.-F. Molecular phylogenetics and historical biogeography of Sorbus sensu stricto (Rosaceae). Mol. Phylogenet. Evol. 2017, 111, 76–86. [Google Scholar] [CrossRef]
  13. Raubeson, L.A.; Robert, K.J. Chloroplast genomes of plants. In Plant Diversity and Evolution. Genotypic and Phenotypic Variation in Higher Plants; Henry, R.J., Ed.; CABI Publishing: Wallingford, UK, 2005; Volume 42, pp. 45–68. [Google Scholar]
  14. Yang, J.B.; Li, D.Z.; Li, H.T. Highly effective sequencing whole chloroplast genomes of angiosperms by nine novel universal primer pairs. Mol. Ecol. Resour. 2015, 14, 1024–1031. [Google Scholar] [CrossRef] [PubMed]
  15. Prjibelski, A.; Antipov, D.; Meleshko, D.; Lapidus, A.; Korobeynikov, A. Using SPAdes De Novo Assembler. Curr. Protoc. Bioinform. 2020, 70, e102–e130. [Google Scholar] [CrossRef] [PubMed]
  16. Qu, X.J.; Moore, M.J.; Li, D.Z.; Yi, T.S. PGA: A software package for rapid, accurate, and flexible batch annotation of plastomes. Plant Methods 2019, 15, 50–61. [Google Scholar] [CrossRef] [Green Version]
  17. Stephan, G.; Pascal, L.; Ralph, B. OrganellarGenomeDRAW (OGDRAW) version 1.3.1: Expanded toolkit for the graphical visualization of organellar genomes. Nucleic Acids Res. 2019, 47, W59–W64. [Google Scholar]
  18. Kearse, M.; Moir, R.; Wilson, S.-H.; Steven, C.; Matthew, S. Geneious Basic: An integrated and extendable desktop software platform for the organization and analysis of sequence data. Bioinformatics 2012, 228, 1647–1649. [Google Scholar] [CrossRef] [Green Version]
  19. Katoh, K.; Kuma, K.; Toh, H.; Miyata, T. MAFFT version 5: Improvement in accuracy of multiple sequence alignment. Nucleic Acids Res. 2005, 33, 511–518. [Google Scholar] [CrossRef]
  20. Darling, A.C.; Mau, B.; Blattner, F.R.; Perna, N.T. Mauve: Multiple alignment of conserved genomic sequence with rearrangements. Genome Res. 2004, 14, 1394–1403. [Google Scholar] [CrossRef] [Green Version]
  21. Frazer, K.A.; Lior, P.; Alexander, P.; Rubin, E.M.; Inna, D. VISTA: Computational tools for comparative genomics. Nucleic Acids Res. 2018, 32, W273–W279. [Google Scholar] [CrossRef] [Green Version]
  22. Kurtz, S.; Choudhuri, J.V.; Ohlebusch, E.; Schleiermacher, C.; Stoye, J.; Giegerich, R. REPuter: The manifold applications of repeat analysis on a genomic scale. Nucleic Acids Res. 2001, 29, 4633–4642. [Google Scholar] [CrossRef] [Green Version]
  23. Sebastian, B.; Thomas, T.; Thomas, M.; Uwe, S.; Martin, M. MISA-web: A web server for microsatellite prediction. Bioinformatics 2017, 33, 2583–2585. [Google Scholar]
  24. Librado, P.; Rozas, J. DnaSP v5: A software for comprehensive analysis of DNA polymorphism data. Bioinformatics 2009, 25, 1451–1452. [Google Scholar] [CrossRef] [Green Version]
  25. Xing, Y.; Lee, C. Can RNA selection pressure distort the measurement of Ka/Ks? Gene 2006, 370, 1–5. [Google Scholar] [CrossRef]
  26. Vikulin, S.V.; Bystriakova, N.; Schneider, H.; Jolley, D. Plant macrofossils from Boltysh crater provide a window into early Cenozoic vegetation. Geol. Soc. Am. Spec. Pap. 2014, 505, 147–169. [Google Scholar]
  27. Geng, B.Y.; Jun-Rong, T.A.; Xie, G.P. Early Tertiary fossil plants and paleoclimate of Lanzhou Basin. J. Syst. Evol. 2001, 39, 105–115. [Google Scholar]
  28. Korotkova, N.; Parolly, G.; Khachatryan, A.; Ghulikyan, L.; Sargsyan, H.; Akopian, J.; Borsch, T.; Gruenstaeudl, M. Towards resolving the evolutionary history of Caucasian pears (Pyrus, Rosaceae)—Phylogenetic relationships, divergence times and leaf trait evolution. J. Syst. Evol. 2018, 56, 35–47. [Google Scholar] [CrossRef]
  29. Drummond, A.J.; Suchard, M.A.; Xie, D.; Rambaut, A. Bayesian phylogenetics with BEAUti and the BEAST 1.7. Mol. Biol. Evol. 2012, 29, 1969–1973. [Google Scholar] [CrossRef]
  30. Rambaut, A.; Drummond, A.J.; Xie, D.; Baele, G.; Suchard, M.A. Posterior summarization in Bayesian phylogenetics using Tracer 1.7. Syst. Biol. 2018, 67, 901–904. [Google Scholar] [CrossRef] [Green Version]
  31. Teske, D.; Peters, A.; Moellers, A.; Fischer, M. Genomic Profiling: The strengths and limitations of chloroplast genome-based plant variety authentication. J. Agric. Food Chem. 2020, 68, 14323–14333. [Google Scholar] [CrossRef]
  32. Zhang, C.; Li, S.Q.; Xie, H.H.; Liu, J.Q.; Gao, X.F. Comparative plastid genome analyses of Rosa: Insights into the phylogeny and gene divergence. Tree Genet. Genomes 2022, 18, 20–36. [Google Scholar] [CrossRef]
  33. Palmer, J.D. Chapter 2—Plastid Chromosomes: Structure and Evolution. In The Molecular Biology of Plastids; Elsevier Academic Press: Amsterdam, The Netherlands, 1991; pp. 5–53. ISBN 9780127150079. [Google Scholar]
  34. Palmer, J.D.; Osorio, B.; Aldrich, J.; Thompson, W.F. Chloroplast DNA evolution among legumes: Loss of a large inverted repeat occurred prior to other sequence rearrangements. Curr. Genet. 1987, 11, 275–286. [Google Scholar] [CrossRef] [Green Version]
  35. Lavin, M.; Doyle, J.J.; Palmer, J.D. Evolutionary significance of the loss of the chloroplast-DNA inverted repeat in the leguminosae subfamily papilionoideae. Evol. Int. J. Org. Evol. 1990, 44, 390–402. [Google Scholar]
  36. Raubeson, L.A.; Jansen, R.K. A rare chloroplast-DNA structural mutation is shared by all conifers. Biochem. Syst. Ecol. 1992, 20, 17–24. [Google Scholar] [CrossRef]
  37. Cavalier-Smith, T. Chloroplast evolution: Secondary symbiogenesis and multiple losses. Curr. Biol. 2002, 12, R62–R64. [Google Scholar] [CrossRef] [Green Version]
  38. Cho, K.S.; Cheon, K.S.; Hong, S.Y.; Cho, J.H.; Im, J.S.; Mekapogu, M.; Yu, Y.S.; Park, T.H. Complete chloroplast genome sequences of Solanum commersonii and its application to chloroplast genotype in somatic hybrids with Solanum tuberosum. Plant Cell Rep. 2016, 35, 2113–2123. [Google Scholar] [CrossRef]
  39. Williams, A.V.; Miller, J.T.; Small, I.; Nevill, P.G.; Boykin, L.M. Integration of complete chloroplast genome sequences with small amplicon datasets improves phylogenetic resolution in Acacia. Mol. Phylogenet. Evol. 2016, 96, 1–8. [Google Scholar] [CrossRef] [Green Version]
  40. Powell, W.; Mcdevitt, R.; Vendramin, G.G.; Rafalski, J.A.; Morgante, M. Polymorphic simple sequence repeat regions in chloroplast genomes—Applications to the population genetics of pines. Proc. Natl. Acad. Sci. USA 1995, 92, 7759–7763. [Google Scholar] [CrossRef] [Green Version]
  41. Du, Y.P.; Bi, Y.; Yang, F.P.; Zhang, M.F.; Chen, X.Q.; Xue, J.; Zhang, X.H. Complete chloroplast genome sequences of Lilium: Insights into evolutionary dynamics and phylogenetic analyses. Sci. Rep. 2017, 7, 5751. [Google Scholar] [CrossRef]
  42. Sajjad, A.; Khan, A.L.; Khan, A.R.; Muhammad, W.; Kang, S.M.; Khan, M.A.; Seok-Min, L.; In-Jung, L. Complete chloroplast genome of Nicotiana otophora and its comparison with related species. Front. Plant Sci. 2016, 7, 843–854. [Google Scholar]
  43. Vamosi, J.C.; Dickinson, T.A. Polyploidy and diversification: A phylogenetic investigation in Rosaceae. Int. J. Plant Sci. 2006, 167, 349–358. [Google Scholar] [CrossRef] [Green Version]
  44. Burgess, M.B.; Cushman, K.R.; Doucette, E.T.; Frye, C.T.; Campbell, C.S. Understanding diploid diversity: A first step in unraveling polyploid, apomictic complexity in Amelanchier. Am. J. Bot. 2015, 102, 2041–2057. [Google Scholar] [CrossRef]
  45. DeVore, M.; Pigg, K. Biotic processes in the Okanagan Highlands floras: Possible evidence of hybridization in plants adapting to a temperate forest. Can. J. Earth Sci. 2016, 53, 622–629. [Google Scholar] [CrossRef]
Figure 1. Chloroplast genome map of Sorbus. The inner grey circle indicates the GC content of each genome position. Genes in the inner circle of the genomic map are transcribed clockwise and vice versa.
Biomolecules 12 01648 g001
Figure 2. Comparison of the border regions of four chloroplast genome parts among Sorbus species.
Biomolecules 12 01648 g002
Figure 3. Number of six SSR types examined in the 20 Sorbus chloroplast genomes.
Biomolecules 12 01648 g003
Figure 4. Alignment of 20 Sorbus chloroplast genomes using mVISTA.
Biomolecules 12 01648 g004
Figure 5. Sliding window analysis of pi values among 20 Sorbus species. X-axis, position of the midpoint of a window; Y-axis, nucleotide diversity of each window. (Window length: 600 bp, step size: 200 bp).
Biomolecules 12 01648 g005
Figure 6. The phylogenetic tree of 20 Sorbus species based on chloroplast genome sequences. The species’ names marked with red, blue, and green indicate that the species has red or orange-red, pink, or white fruit, respectively. Numbers at nodes correspond to maximum likelihood bootstrap percentage and the posterior probability of Bayesian inference.
Biomolecules 12 01648 g006
Figure 7. Divergence time of 20 Sorbus species derived from BEAST. A, B, C, and D with gray circle represent calibration points. Blue bars represent 95% highest posterior density.
Biomolecules 12 01648 g007
Table 1. Summary of complete plastomes of Sorbus species.
SpeciesPCGtRNArRNATotal NumberLength of Plastome (bp)Length of LSC (bp)Length of IR (bp)Length of SSC (bp)GC Content (%)
Sorbus amabilis *84378129159,99987,86326,40519,32636.55
S. discolor *84378129160,13987,99426,41019,32536.53
S. filipes *84378129159,90387,89126,37819,25636.58
S. hupehensis var. hupehensis *84378129159,95587,95126,37819,24836.56
S. multijuga *84378129159,85087,84126,37819,25336.58
S. pohuashanensis *84378129160,10587,95026,41019,33536.54
S. reducta *84378129160,28088,18026,40819,28436.55
S. wilsoniana *84378129160,15988,11926,37819,28436.54
S. americana **84378129160,05487,92226,37719,37836.55
S. aucuparia **84378129160,10887,97426,31419,50636.54
S. commixta **84378129159,95287,80326,41019,32936.55
S. hupehensis var. paucijuga **84378129160,05087,90526,41019,32536.55
S. insignis **84378129159,99387,93226,40319,25536.56
S. koehneana **84378129159,87387,89926,37819,21836.58
S. munda **84378129159,90087,88826,37819,25636.57
S. prattii **84378129159,90087,88826,37819,25636.58
S. pteridophylla **84378129159,80587,82626,37819,22336.59
S. rehderiana **84378129160,14388,10326,37819,28436.54
S. setschwanensis **84378129160,06488,01326,37819,29536.54
S. tianschanica **84378129160,03787,90226,38819,35936.55
Note: PCG indicates protein-coding gene. * indicates the newly sequenced Sorbus species in this study, and ** indicates the publicly available Sorbus species.
Publisher’s Note: MDPI stays neutral with regard to jurisdictional claims in published maps and institutional affiliations.

