MMP-1, UCH-L1, and 20S Proteasome as Potential Biomarkers Supporting the Diagnosis of Brain Glioma
Abstract
1. Introduction
2. Materials and Methods
2.1. Reagents
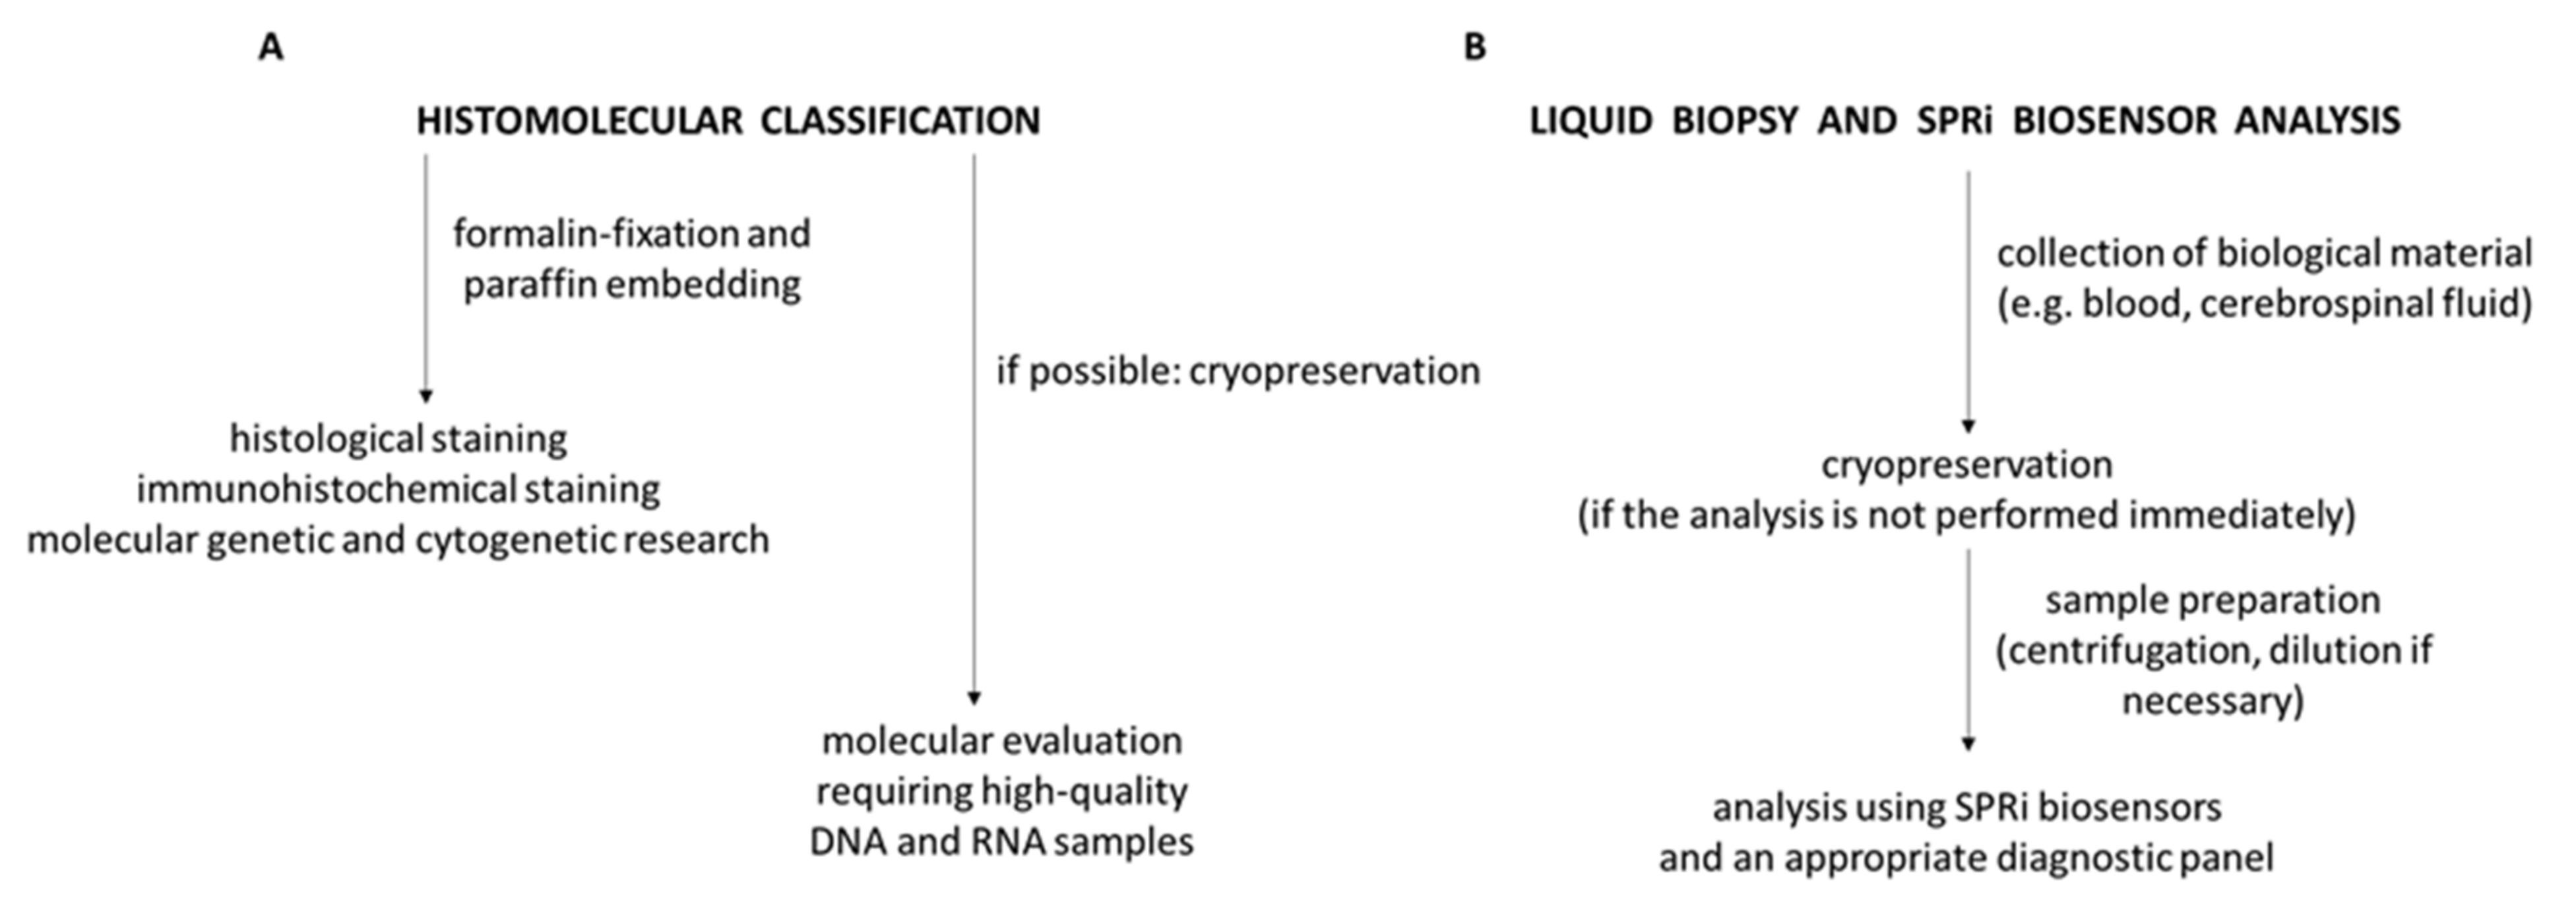
2.2. Biological Material
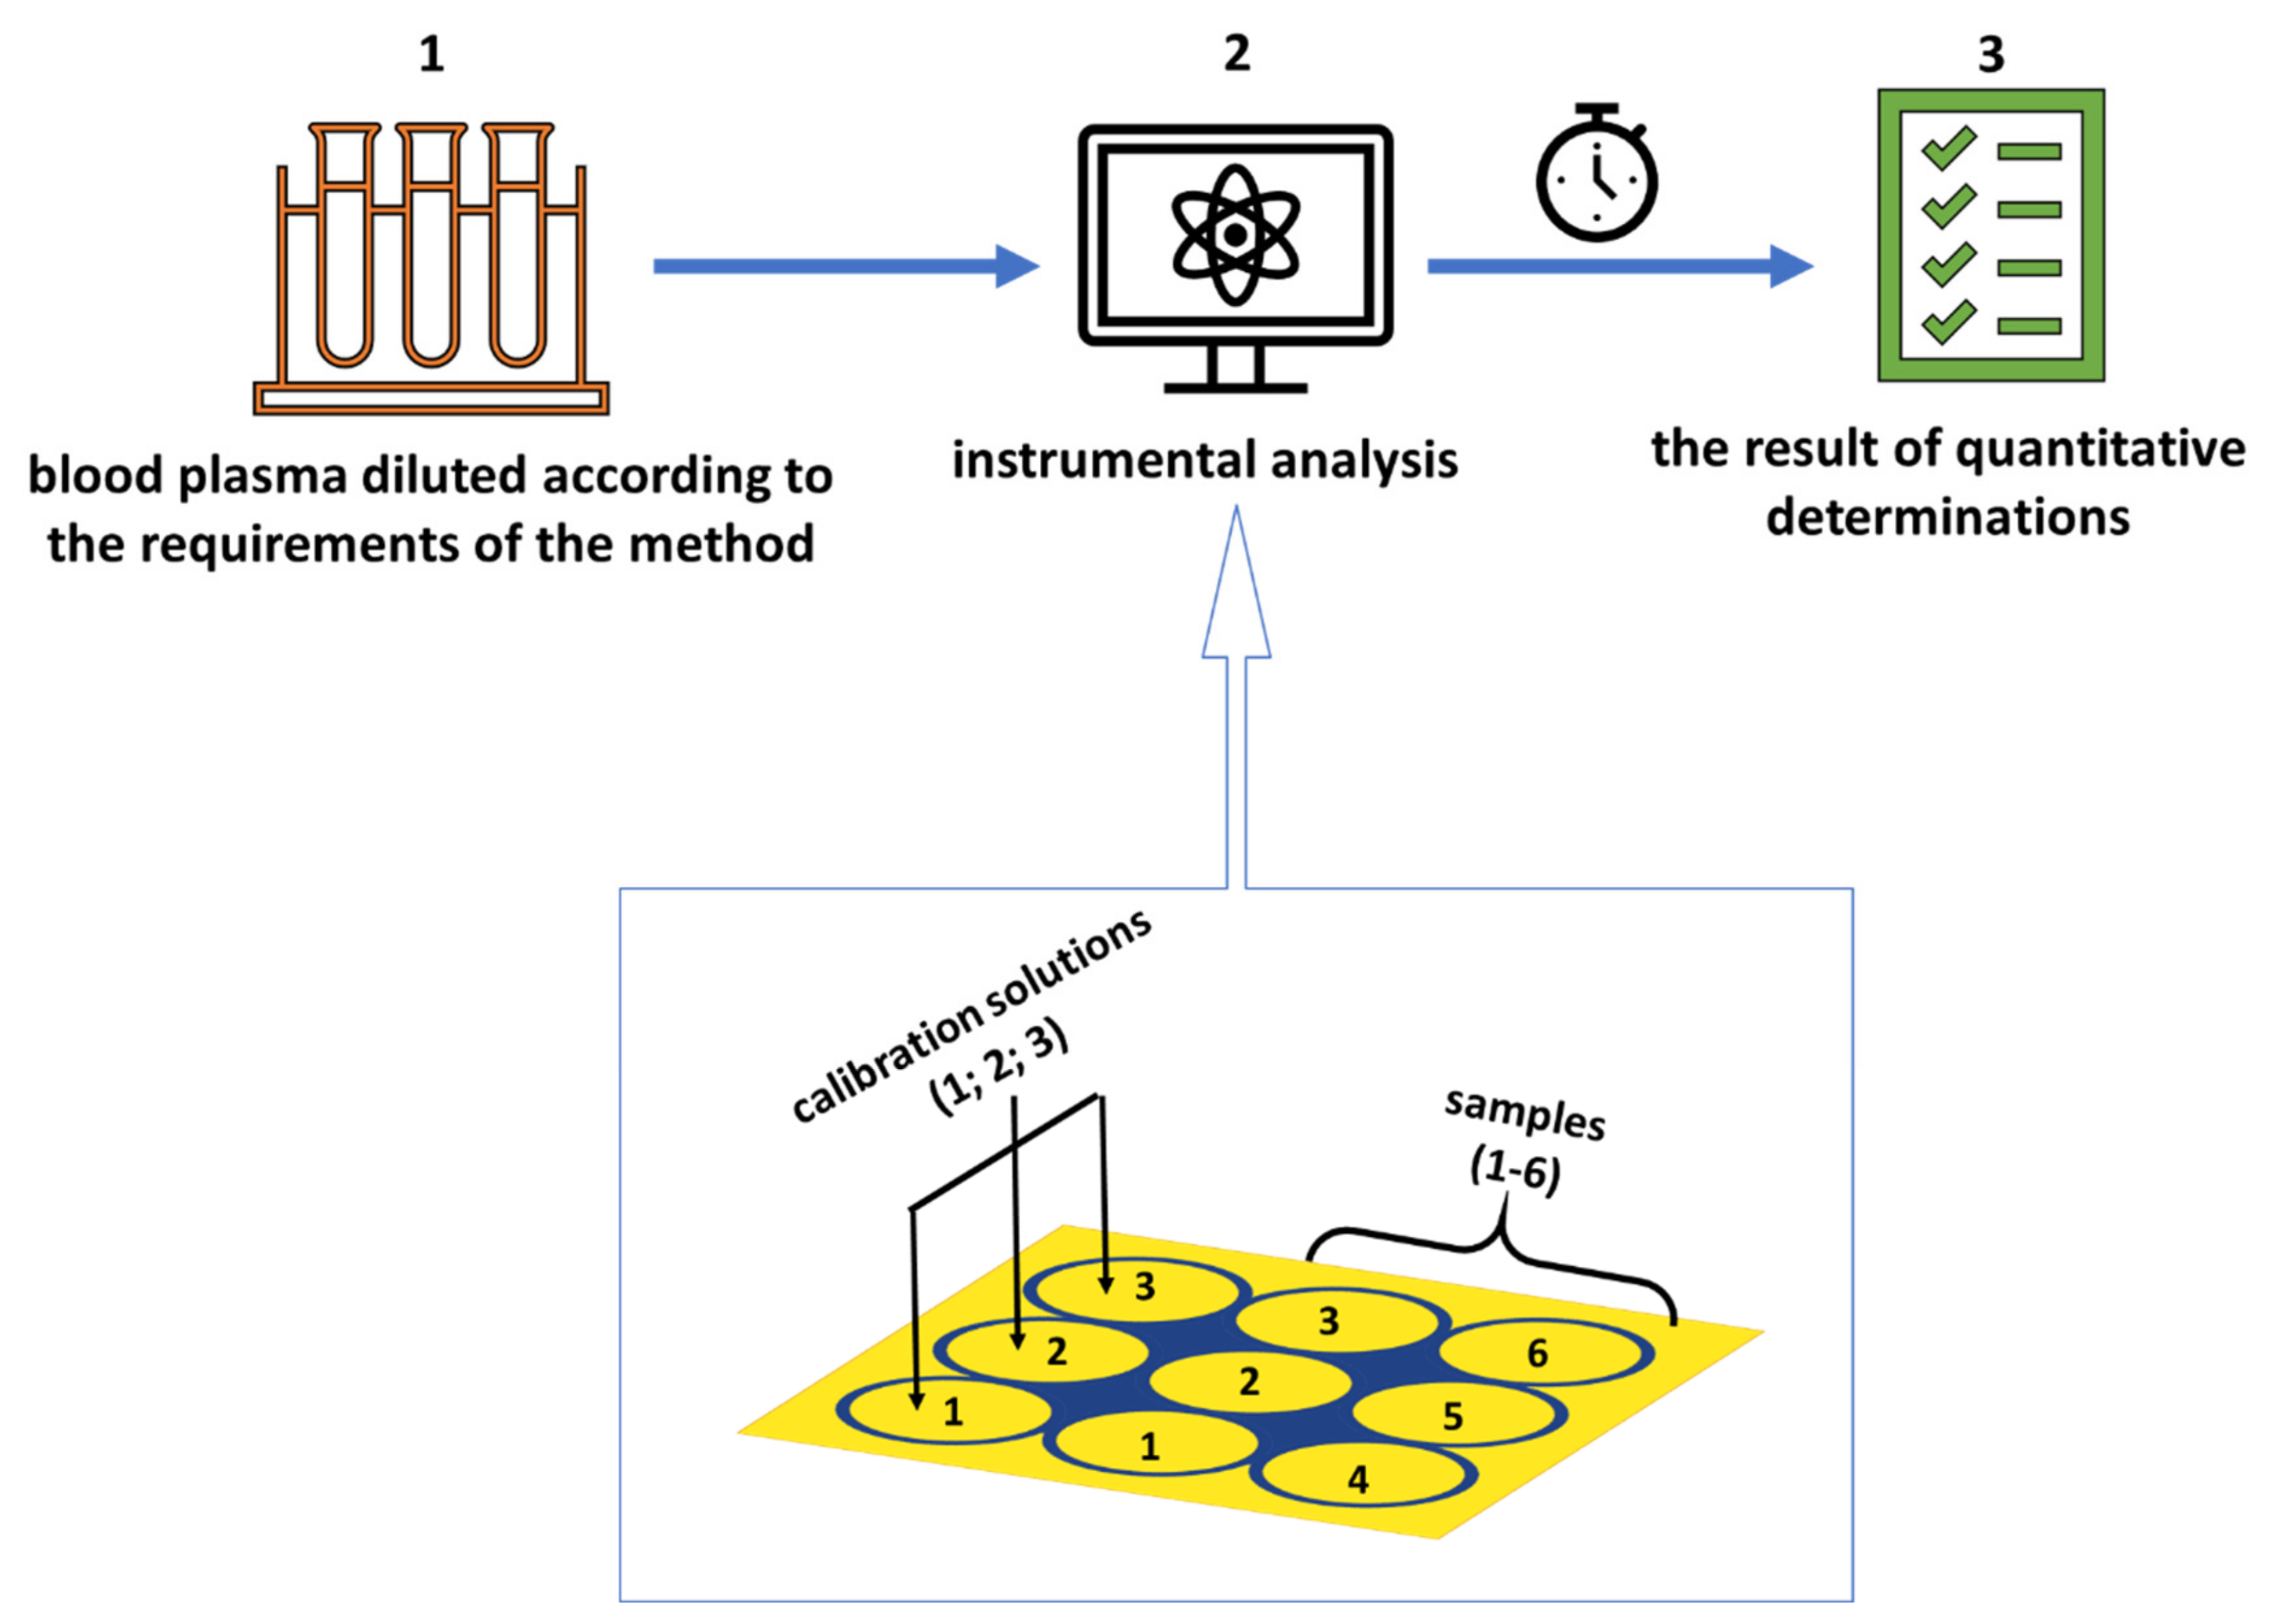
2.3. Procedure for Quantifying MMP-1, UCH-L1, and Proteasome—SPRi Measurements
2.4. IDH 1/2 Mutation, p53 Gene Mutation, and EGFR Expression
3. Results
3.1. Statistical Analysis
3.2. ROC Analysis
3.3. Impact of IDH Status on Biomarkers
4. Discussion and Conclusions
Author Contributions
Funding
Institutional Review Board Statement
Informed Consent Statement
Data Availability Statement
Acknowledgments
Conflicts of Interest
Appendix A
| Control Group/Tumor Grade | |||||||
|---|---|---|---|---|---|---|---|
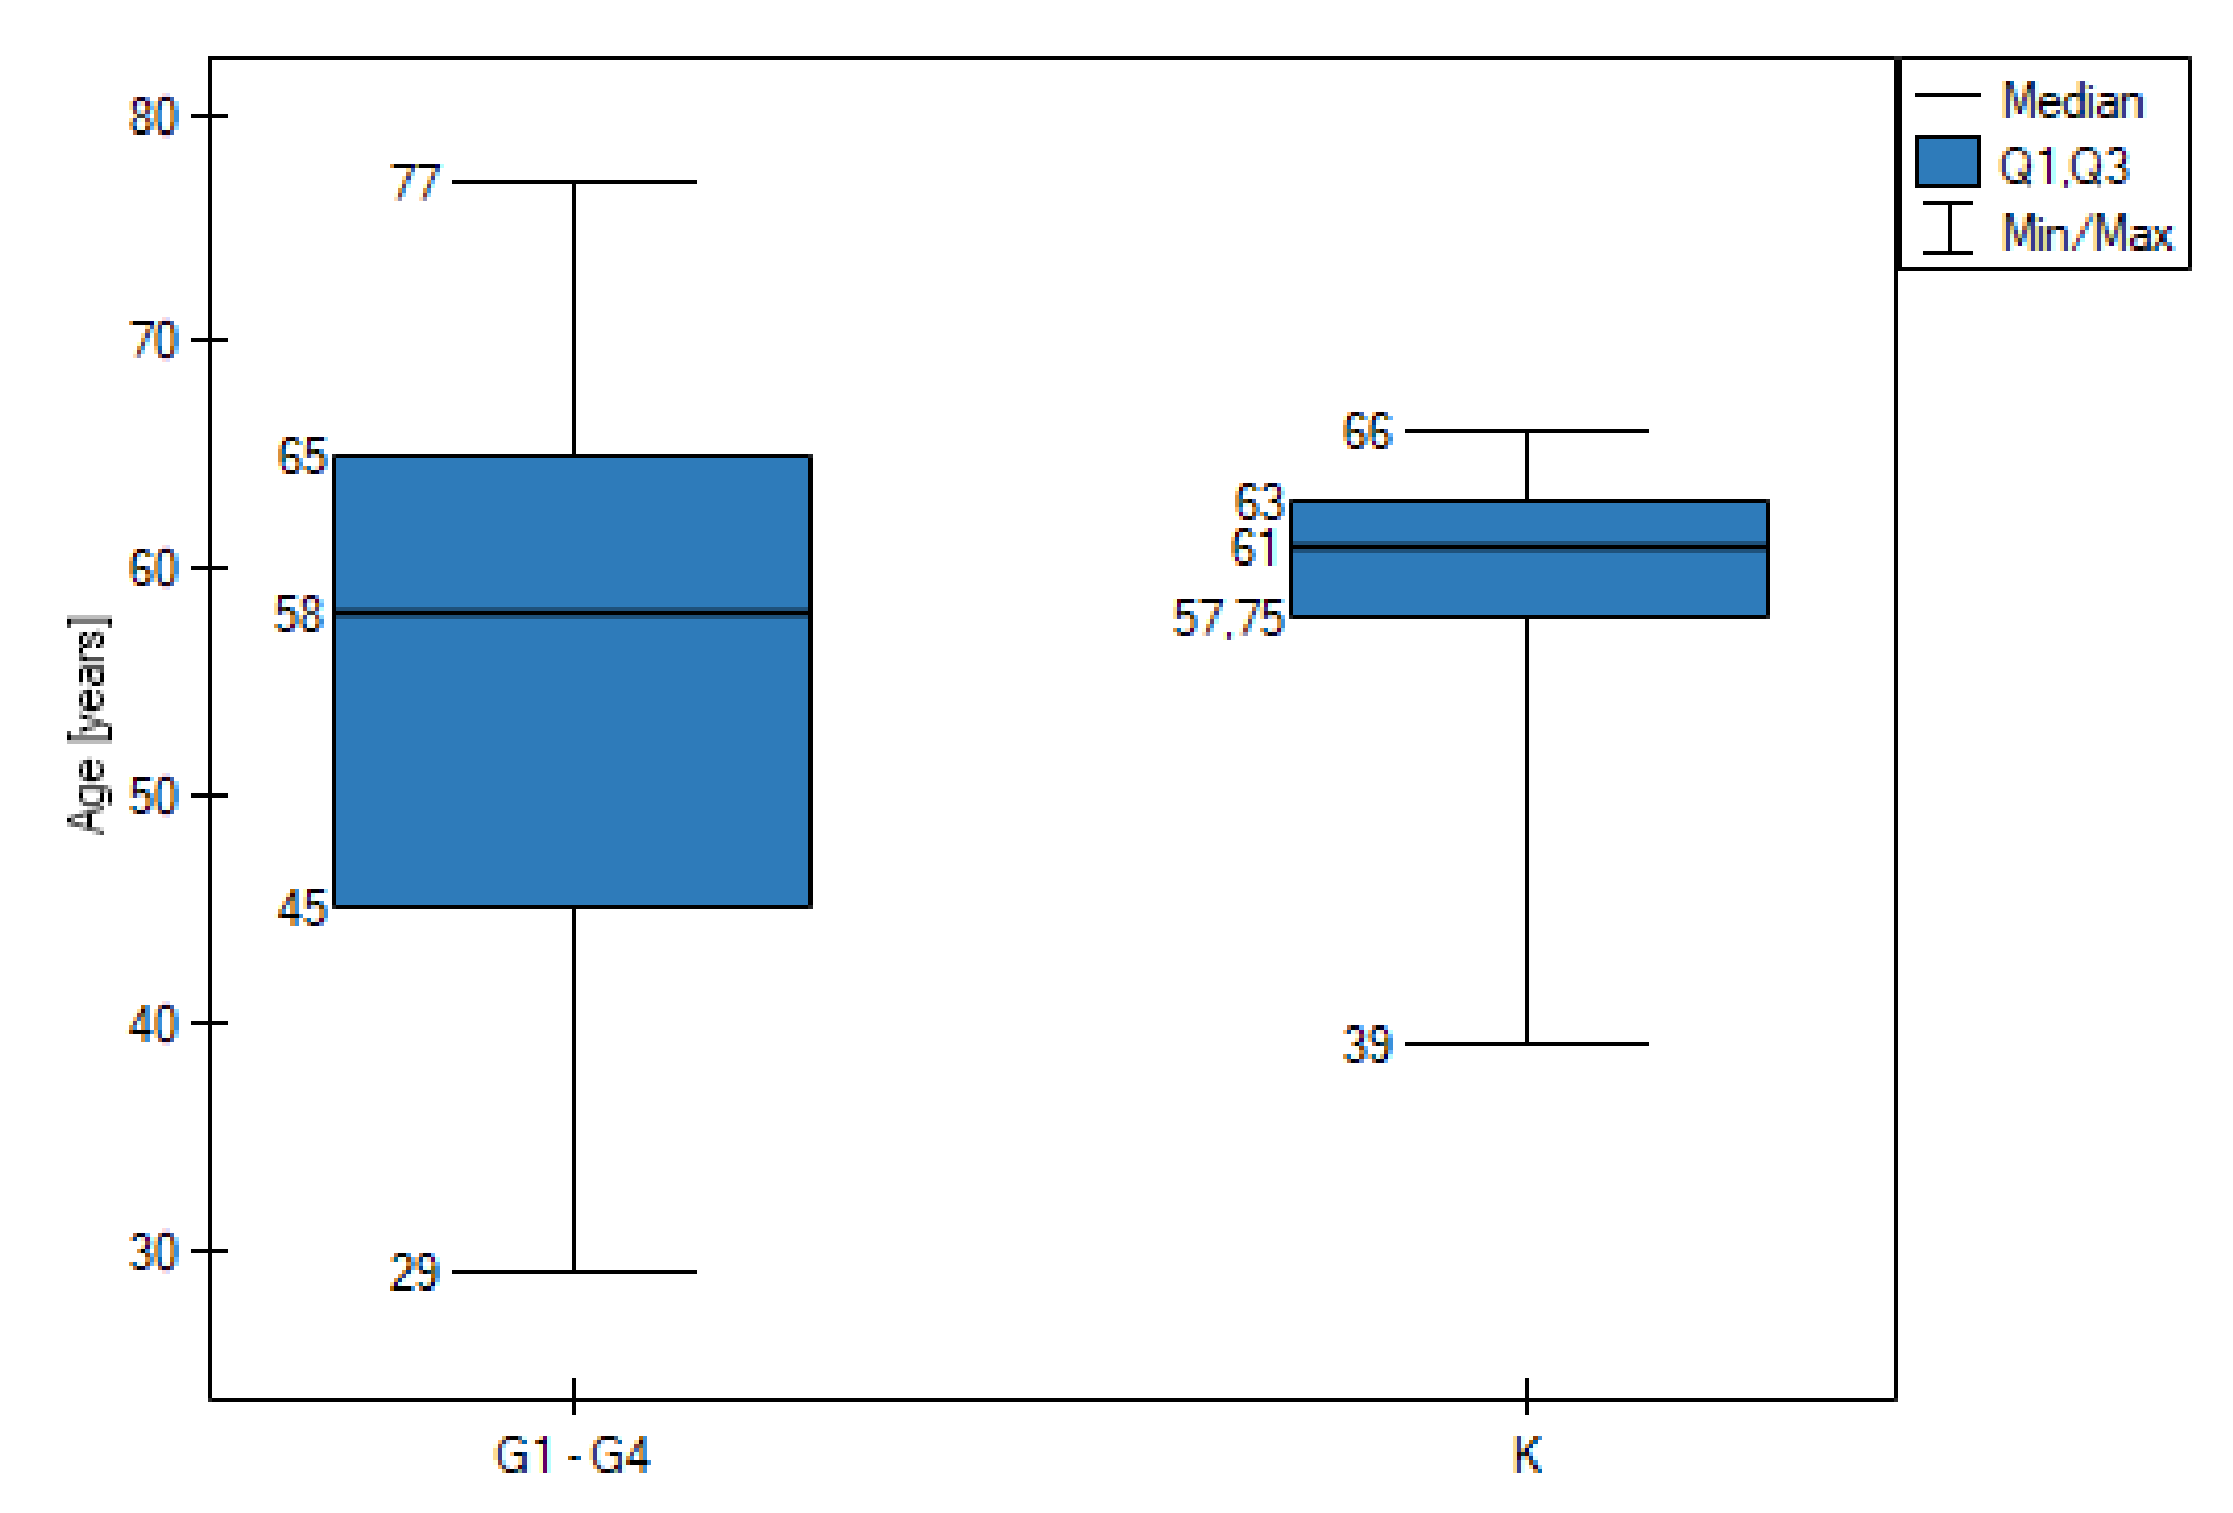
| Variable | K n = 48 | G1 n = 3 | G2 n = 10 | G3 n = 7 | G4 n = 37 | Age Difference Between K and G1–G4 A | |
| Age (years) | range | 39–66 | 29–43 | 30–57 | 38–72 | 33–77 | No statistically significant difference (p > 0.05) |
| median | 61 | 39 | 43.5 | 45 | 60 | ||
| Gender | male | 27 | 1 | 5 | 3 | 26 | |
| female | 21 | 2 | 5 | 4 | 11 | ||
| Tumor size (cm2) | <15 | 2 | 2 | 3 | 10 | ||
| >15 | 1 | 2 | 1 | 10 | |||
| The presence of other neo-plasms in the immediate family | yes | 0 | 6 | 3 | 17 | ||
| no | 3 | 4 | 4 | 20 | |||
| Concomitant non-cancerous diseases | yes | 2 | 3 | 3 | 21 | ||
| no | 1 | 7 | 4 | 16 | |||
| Histological type of tumors | oligodendroglial | 0 | 1 | 3 | 0 | ||
| astrocytic | 3 | 9 | 4 | 37 | |||
| Number of smokers | number of cases | 48 | 1 | 6 | 4 | 22 | Pack-year difference between K and G1–G4 B |
| pack-years (median) | 37.5 | 0 C | 8 | 26 | 38.5 | No statistically significant difference (p > 0.05) | |
| IDH 1/2 mutation | yes | 0 | 10 | 5 | 10 | ||
| no | 3 | 0 | 2 | 27 | |||
| p53 mutation | yes | 1 | 10 | 7 | 34 | ||
| no | 2 | 0 | 0 | 3 | |||
| EGFR expression | yes | 0 | 6 | 2 | 29 | ||
| no | 3 | 4 | 5 | 8 | |||
| Parameter/Biomarker | MMP-1 (ng/mL) | UCH-L1 (ng/mL) | Proteasome (µg/mL) | ||||||||||||
|---|---|---|---|---|---|---|---|---|---|---|---|---|---|---|---|
| K | G1 | G2 | G3 | G4 | K | G1 | G2 | G3 | G4 | K | G1 | G2 | G3 | G4 | |
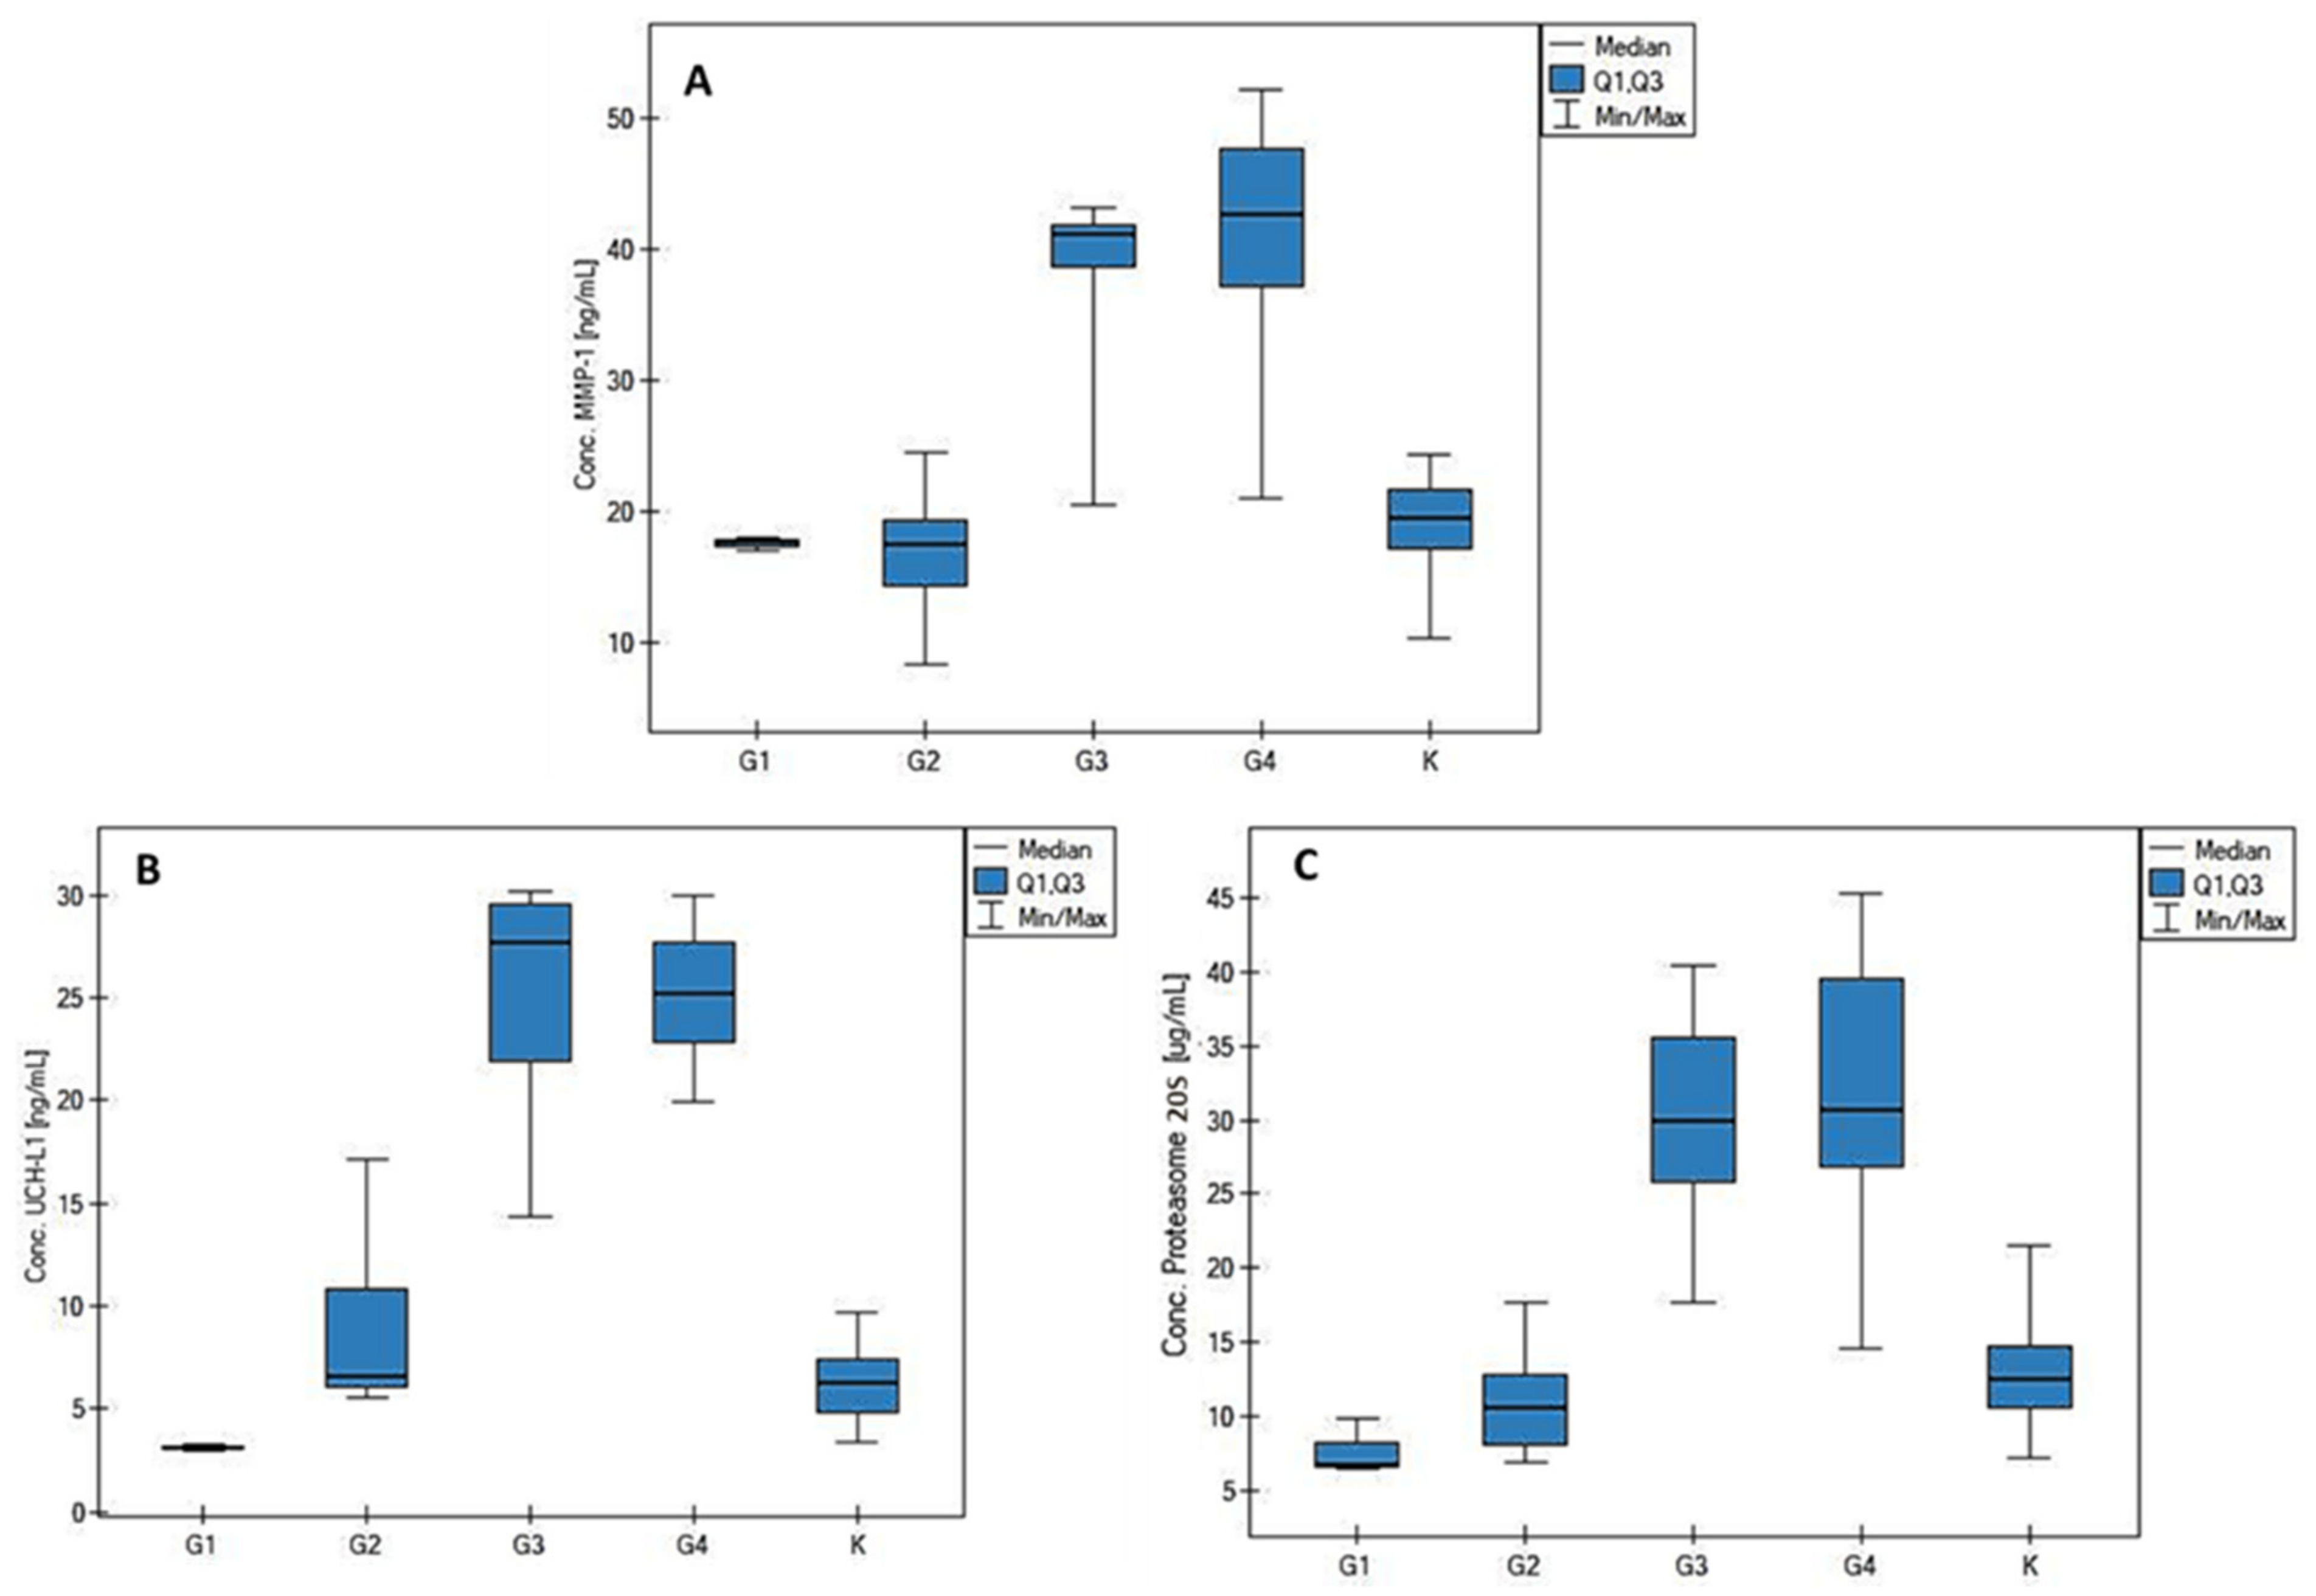
| Median | 19.43 | 17.68 | 17.49 | 41.22 | 42.73 | 6.24 | 3.08 | 6.57 | 27.73 | 25.16 | 12.59 | 6.81 | 10.67 | 29.87 | 30.73 |
| Q1 | 17.22 | 17.33 | 14.28 | 38.69 | 37.16 | 4.83 | 3.03 | 6.06 | 21.89 | 22.83 | 10.66 | 6.66 | 8.08 | 25.81 | 26.77 |
| Q3 | 21.70 | 17.82 | 19.34 | 41.77 | 47.65 | 7.42 | 3.20 | 10.82 | 29.55 | 27.67 | 14.76 | 8.35 | 12.91 | 35.57 | 29.49 |
| MIN | 10.24 | 16.98 | 8.32 | 20.55 | 21.06 | 3.43 | 2.97 | 5.54 | 14.39 | 19.89 | 7.19 | 6.51 | 6.90 | 17.66 | 14.56 |
| MAX | 24.40 | 17.96 | 24.46 | 43.23 | 52.15 | 9.66 | 3.31 | 17.15 | 30.17 | 29.98 | 21.52 | 9.89 | 17.68 | 40.42 | 45.25 |
| Parameter | MMP-1 Concentration (ng/mL) | UCH-L1 Concentration (ng/mL) | 20S Proteasome Concentration (µg/mL) | ||||||
|---|---|---|---|---|---|---|---|---|---|
| Range | Median | p-Value | Range | Median | p-Value | Range | Median | p-Value | |
| Tumor grade (G1–G2 vs. G3–G4) | |||||||||
| G1 (3) | 16.98–17.96 | 17.68 | <<0.01 | 2.97–3.31 | 3.08 | <<0.01 | 6.51–9.89 | 6.81 | <<0.01 |
| G2 (10) | 8.32–24.46 | 17.49 | 5.54–17.15 | 6.56 | 6.90–17.68 | 10.67 | |||
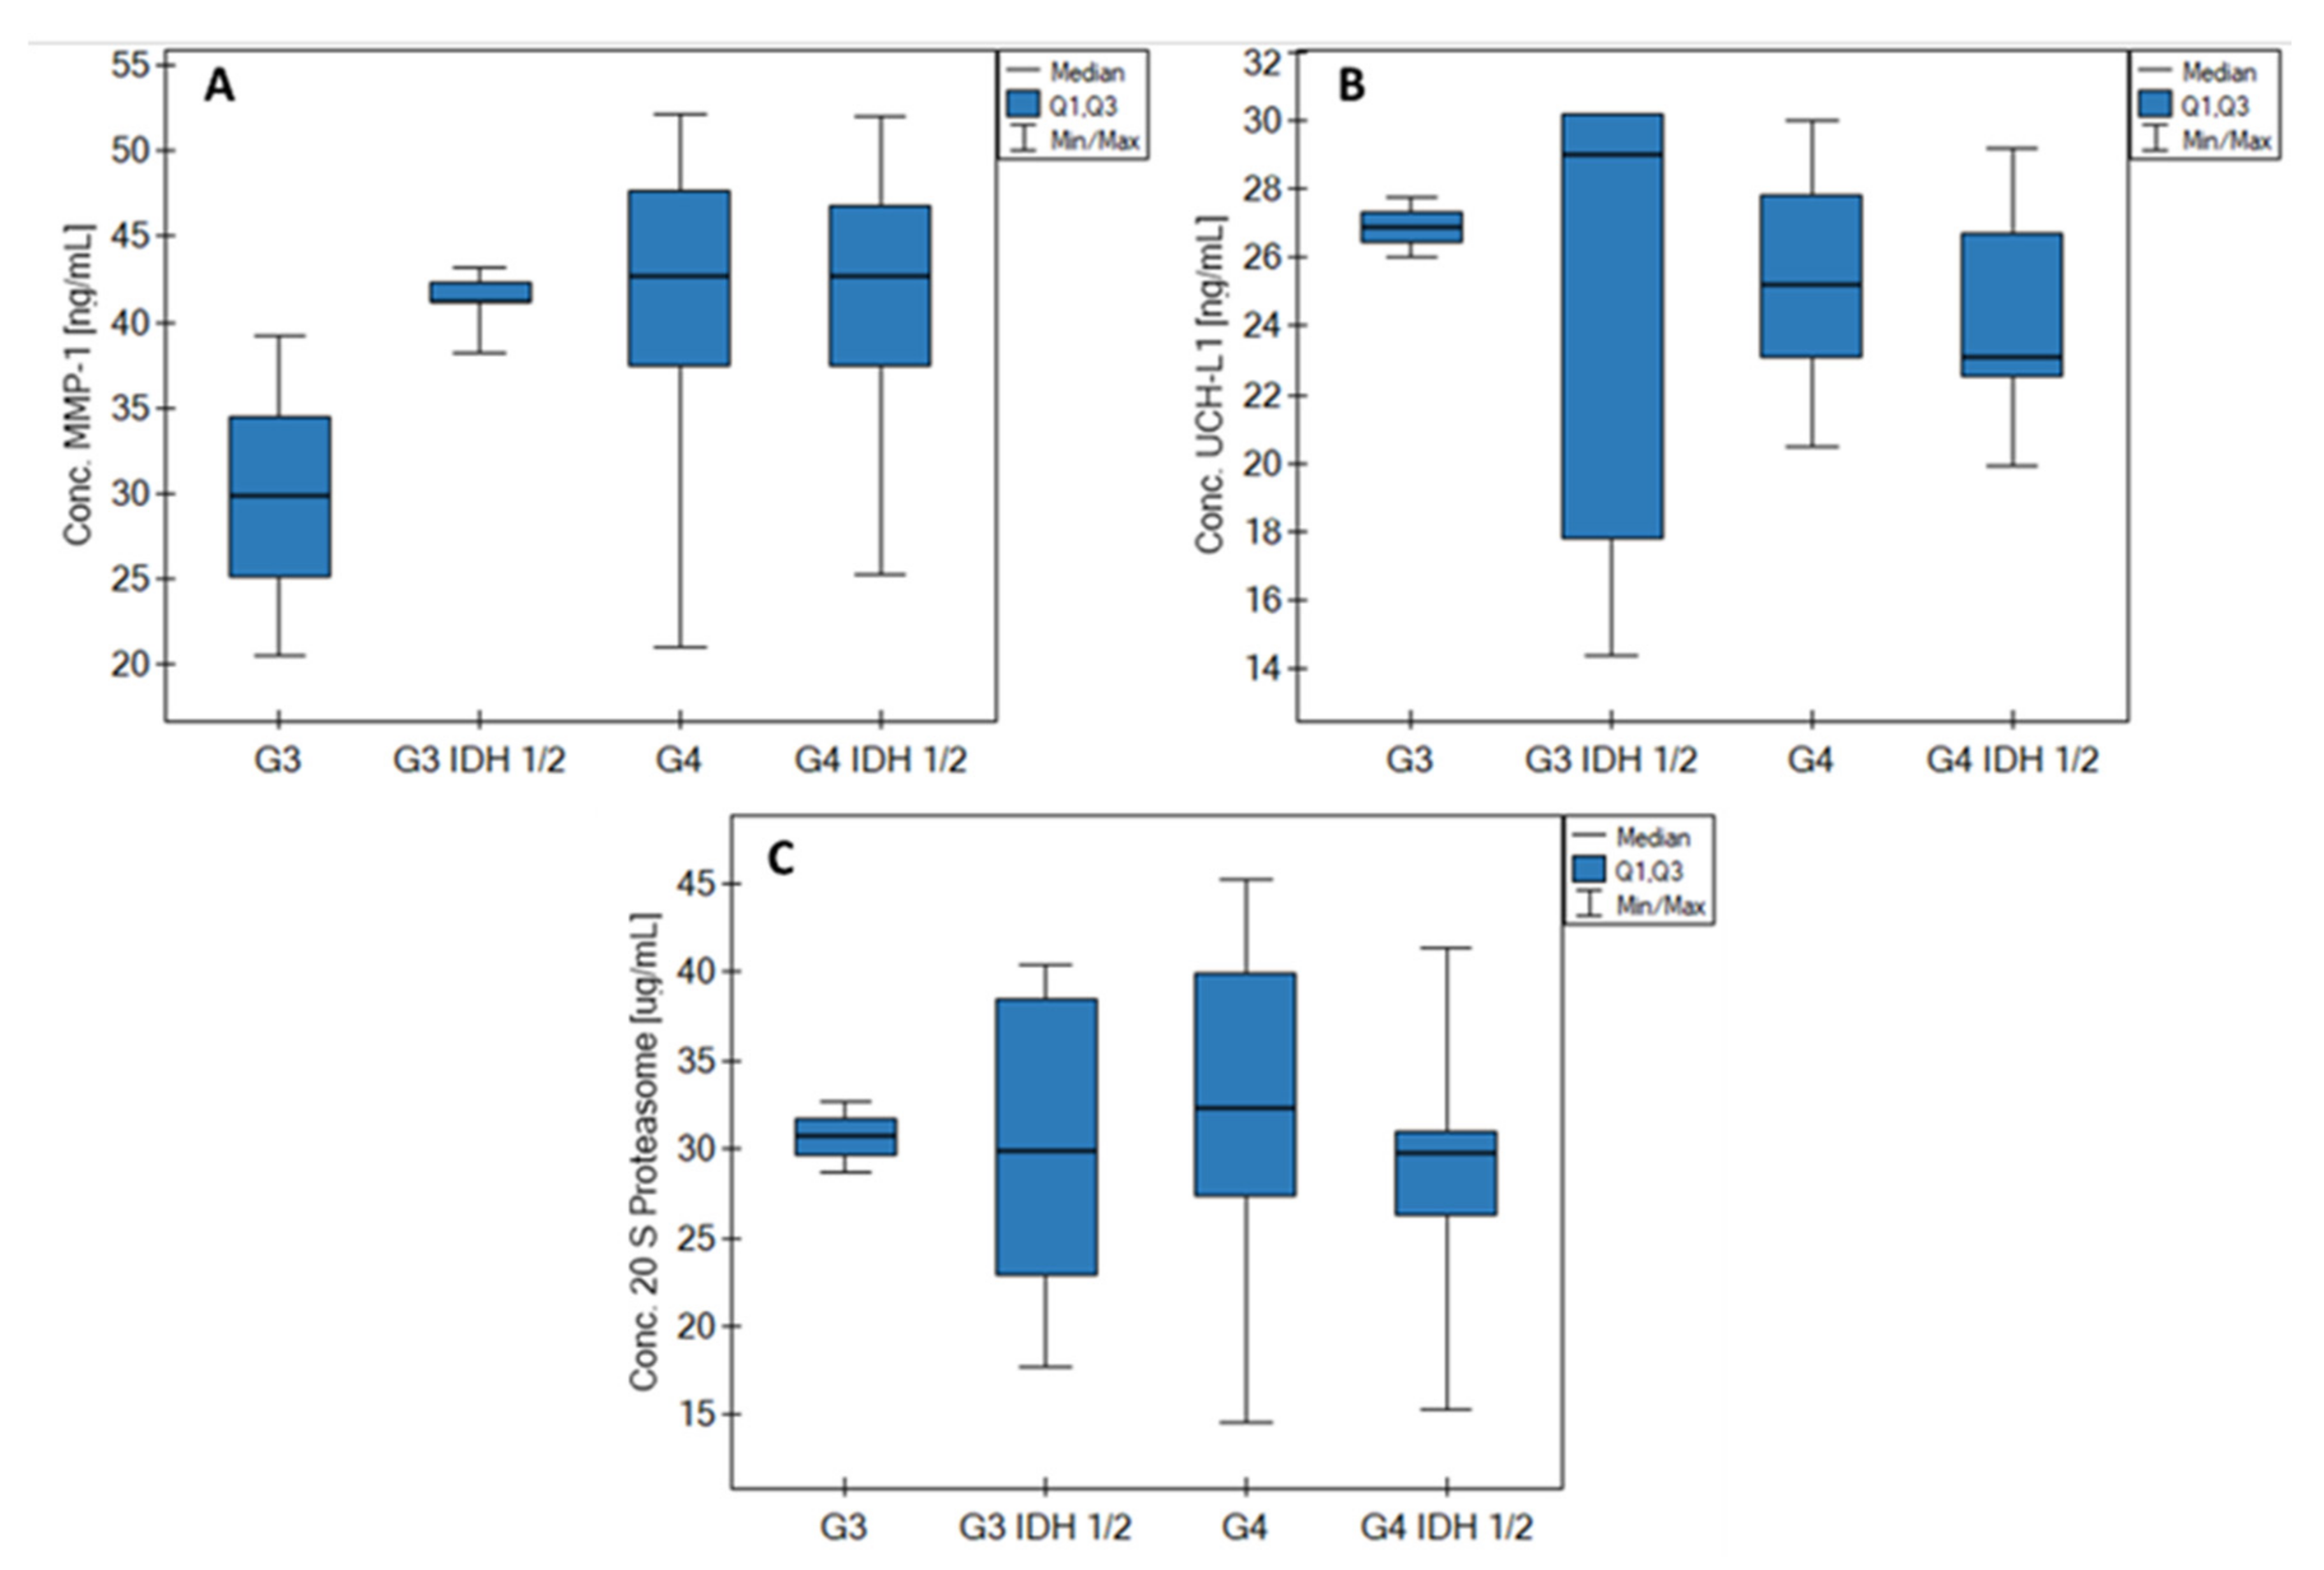
| G3 (7) | 20.55–43.23 | 41.22 | 14.39–30.17 | 27.73 | 17.66–40.42 | 29.87 | |||
| G4 (37) | 21.06–52.15 | 42.73 | 19.89–29.98 | 25.16 | 14.56–45.25 | 30.73 | |||
| Tumor size (cm2) | |||||||||
| <15 (17) | 8.32–47.78 | 36.73 | >0.05 (NS) | 2.97–30.14 | 23.03 | >0.05 (NS) | 6.81–44.28 | 28.74 | >0.05 (NS) |
| >15 (14) | 13.97–51.98 | 42.32 | 3.08–29.38 | 23.24 | 6.51–39.78 | 30.50 | |||
| The presence of other neoplasms in the family | |||||||||
| yes (26) | 8.32–52.15 | 39.67 | >0.05 (NS) | 6.31–30.17 | 22.51 | >0.05 (NS) | 7.21–45.25 | 27.92 | >0.05 (NS) |
| no (29) | 9.03–51.98 | 38.43 | 2.97–30.14 | 24.02 | 6.51–44.28 | 28.34 | |||
| Concomitant non-cancerous diseases | |||||||||
| yes (29) | 9.03–51.23 | 40.46 | >0.05 (NS) | 2.97–29.03 | 23.21 | >0.05 (NS) | 6.51–45.25 | 28.34 | >0.05 (NS) |
| no (28) | 8.32–52.15 | 38.19 | 3.31–30.17 | 24.07 | 6.90–44.77 | 27.92 | |||
| Age–MMP-1 | |||||
| G1 | G2 | G3 | G4 | All Samples | |
| RSpearman | 0.5 | −0.59 | −0.02 | −0.18 | 0.34 |
| p | >0.05 | >0.05 | >0.05 | >0.05 | <0.01 |
| Age–UCH-L1 | |||||
| G1 | G2 | G3 | G4 | All Samples | |
| RSpearman | 0.5 | −0.26 | −0.29 | −0.04 | 0.31 |
| p | >0.05 | >0.05 | >0.05 | >0.05 | <0.05 |
| Age–20S Proteasome | |||||
| G1 | G2 | G3 | G4 | All Samples | |
| RSpearman | 1 | 0.13 | 0.31 | 0.05 | 0.48 |
| p | - | >0.05 | >0.05 | >0.05 | <0.01 |
| Tumor Size–MMP-1 | |||||
| G1 | G2 | G3 | G4 | All Samples | |
| RSpearman | - | - | -0.4 | 0.36 | 0.24 |
| p | - | - | >0.05 | >0.05 | >0.05 |
| Tumor Size–UCH-L1 | |||||
| G1 | G2 | G3 | G4 | All Samples | |
| RSpearman | - | 0.4 | - | 0.09 | −0.11 |
| p | - | >0.05 | - | >0.05 | >0.05 |
| Tumor Size–20S Proteasome | |||||
| G1 | G2 | G3 | G4 | All Samples | |
| RSpearman | - | - | 0.8 | 0.08 | 0.04 |
| p | - | - | >0.05 | >0.05 | >0.05 |
| G1 | |||
| MMP-1–UCH-L1 | MMP-1–Proteasome | UCH-L1–Proteasome | |
| RSpearman | - | 0.5 | 0.5 |
| p | - | >0.05 | >0.05 |
| G2 | |||
| MMP-1–UCH-L1 | MMP-1–Proteasome | UCH-L1–Proteasome | |
| RSpearman | 0.07 | 0.07 | 0.14 |
| p | >0.05 | >0.05 | >0.05 |
| G3 | |||
| MMP-1–UCH-L1 | MMP-1–Proteasome | UCH-L1–Proteasome | |
| RSpearman | 0.32 | - | 0.25 |
| p | >0.05 | >0.05 | >0.05 |
| G4 | |||
| MMP-1–UCH-L1 | MMP-1–Proteasome | UCH-L1–Proteasome | |
| RSpearman | 0.32 | 0.16 | 0.21 |
| p | >0.05 | >0.05 | >0.05 |
| All samples | |||
| MMP-1–UCH-L1 | MMP-1–Proteasome | UCH-L1–Proteasome | |
| RSpearman | 0.63 | 0.59 | 0.61 |
| p | <<0.01 | <<0.01 | <<0.01 |

References
- Weller, M.; van den Bent, M.; Preusser, M.; le Rhun, E.; Tonn, J.C.; Minniti, G.; Bendszus, M.; Balana, C.; Chinot, O.; Dirven, L.; et al. EANO Guidelines on the Diagnosis and Treatment of Diffuse Gliomas of Adulthood. Nat. Rev. Clin. Oncol. 2021, 18, 170–186. [Google Scholar] [CrossRef] [PubMed]
- Ellingson, B.M.; Wen, P.Y.; Cloughesy, T.F. Modified Criteria for Radiographic Response Assessment in Glioblastoma Clinical Trials. Neurotherapeutics 2017, 14, 307–320. [Google Scholar] [CrossRef] [PubMed]
- Albert, N.L.; Weller, M.; Suchorska, B.; Galldiks, N.; Soffietti, R.; Kim, M.M.; la Fougère, C.; Pope, W.; Law, I.; Arbizu, J.; et al. Response Assessment in Neuro-Oncology Working Group and European Association for Neuro-Oncology Recommendations for the Clinical Use of PET Imaging in Gliomas. Neuro Oncol. 2016, 18, 1199–1208. [Google Scholar] [CrossRef] [PubMed]
- Le Rhun, E.; Seoane, J.; Salzet, M.; Soffietti, R.; Weller, M. Liquid Biopsies for Diagnosing and Monitoring Primary Tumors of the Central Nervous System. Cancer Lett. 2020, 480, 24–28. [Google Scholar] [CrossRef] [PubMed]
- Shrivastava, R.; Gandhi, P.; Gothalwal, R. The Road-Map for Establishment of a Prognostic Molecular Marker Panel in Glioma Using Liquid Biopsy: Current Status and Future Directions. Clin. Transl. Oncol. 2022, 24, 1702–1714. [Google Scholar] [CrossRef] [PubMed]
- Cohen, A.L.; Colman, H. Glioma Biology and Molecular Markers. Cancer Treat. Res. 2015, 163, 15–30. [Google Scholar] [PubMed]
- Hofer, S.; Lassman, A.B. Molecular Markers in Gliomas: Impact for the Clinician. Target Oncol. 2010, 5, 201–210. [Google Scholar] [CrossRef] [PubMed][Green Version]
- Ludwig, K.; Kornblum, H.I. Molecular Markers in Glioma. J. Neurooncol. 2017, 134, 505–512. [Google Scholar] [CrossRef] [PubMed]
- Pullen, N.A.; Fillmore, H.L. Induction of Matrix Metalloproteinase-1 and Glioma Cell Motility by Nitric Oxide. J. Neurooncol. 2010, 96, 201–209. [Google Scholar] [CrossRef] [PubMed]
- Popovic, D.; Vucic, D.; Dikic, I. Ubiquitination in disease pathogenesis and treatment. Nat. Med. 2014, 20, 1242–1253. [Google Scholar] [CrossRef] [PubMed]
- McCready, J.; Broaddus, W.C.; Sykes, V.; Fillmore, H.L. Association of a Single Nucleotide Polymorphism in the Matrix Metalloproteinase-1 Promoter with Glioblastoma. Int. J. Cancer 2005, 117, 781–785. [Google Scholar] [CrossRef] [PubMed]
- Stojic, J.; Hagemann, C.; Haas, S.; Herbold, C.; Kühnel, S.; Gerngras, S.; Roggendorf, W.; Roosen, K.; Vince, G.H. Expression of Matrix Metalloproteinases MMP-1, MMP-11 and MMP-19 Is Correlated with the WHO-Grading of Human Malignant Gliomas. Neurosci. Res. 2008, 60, 40–49. [Google Scholar] [CrossRef]
- Anand, M.; van Meter, T.E.; Fillmore, H.L. Epidermal Growth Factor Induces Matrix Metalloproteinase-1 (MMP-1) Expression and Invasion in Glioma Cell Lines via the MAPK Pathway. J. Neurooncol. 2011, 104, 679–687. [Google Scholar] [CrossRef] [PubMed]
- Krabill, A.D.; Chen, H.; Hussain, S.; Feng, C.; Abdullah, A.; Das, C.; Aryal, U.K.; Post, C.B.; Wendt, M.K.; Galardy, P.J.; et al. Ubiquitin C-Terminal Hydrolase L1: Biochemical and Cellular Characterization of a Covalent Cyanopyrrolidine-Based Inhibitor. ChemBioChem 2020, 21, 712–722. [Google Scholar] [CrossRef] [PubMed]
- Kabuta, T.; Furuta, A.; Aoki, S.; Furuta, K.; Wada, K. Aberrant Interaction between Parkinson Disease-Associated Mutant UCH-L1 and the Lysosomal Receptor for Chaperone-Mediated Autophagy. J. Biol. Chem. 2008, 283, 23731–23738. [Google Scholar] [CrossRef]
- Öhrfelt, A.; Johansson, P.; Wallin, A.; Andreasson, U.; Zetterberg, H.; Blennow, K.; Svensson, J. Increased Cerebrospinal Fluid Levels of Ubiquitin Carboxyl-Terminal Hydrolase L1 in Patients with Alzheimer’s Disease. Dement. Geriatr. Cogn. Dis. Extra 2016, 6, 283–294. [Google Scholar] [CrossRef] [PubMed]
- Sanchez-Diaz, P.C.; Chang, J.C.; Moses, E.S.; Dao, T.; Chen, Y.; Hung, J.Y. Ubiquitin Carboxyl-Terminal Esterase L1 (UCHL1) Is Associated with Stem-like Cancer Cell Functions in Pediatric High-Grade Glioma. PLoS ONE 2017, 12, e0176879. [Google Scholar] [CrossRef] [PubMed]
- Maksoud, S. The Role of the Ubiquitin Proteasome System in Glioma: Analysis Emphasizing the Main Molecular Players and Therapeutic Strategies Identified in Glioblastoma Multiforme. Mol. Neurobiol. 2021, 58, 3252–3269. [Google Scholar] [CrossRef]
- Rashid, F.; Niklison-Chirou, M.V. Proteasome Inhibition—A New Target for Brain Tumours. Cell Death Discov. 2019, 5, 147. [Google Scholar] [CrossRef]
- Vlachostergios, P.J.; Voutsadakis, I.A.; Papandreou, C.N. The Ubiquitin-Proteasome System in Glioma Cell Cycle Control. Cell Div. 2012, 7, 18. [Google Scholar] [CrossRef] [PubMed]
- Wang, Q.; Ren, Z.H.; Zhao, W.M.; Wang, L.; Yan, X.; Zhu, A.S.; Qiu, F.M.; Zhang, K.K. Research Advances on Surface Plasmon Resonance Biosensors. Nanoscale 2022, 14, 564–591. [Google Scholar] [CrossRef] [PubMed]
- Gade, A.; Sharma, A.; Srivastava, N.; Flora, S.J.S. Surface Plasmon Resonance: A Promising Approach for Label-Free Early Cancer Diagnosis. Clin. Chim. Acta 2022, 527, 79–88. [Google Scholar] [CrossRef] [PubMed]
- Tokarzewicz, A.; Romanowicz, L.; Sveklo, I.; Gorodkiewicz, E. The Development of a Matrix Metalloproteinase-1 Biosensor Based on the Surface Plasmon Resonance Imaging Technique. Anal. Methods UK 2016, 8, 6428–6435. [Google Scholar] [CrossRef]
- Sankiewicz, A.; Laudanski, P.; Romanowicz, L.; Hermanowicz, A.; Roszkowska-Jakimiec, W.; Debek, W.; Gorodkiewicz, E. Development of Surface Plasmon Resonance Imaging Biosensors for Detection of Ubiquitin Carboxyl-Terminal Hydrolase L1. Anal. Biochem. 2015, 469, 4–11. [Google Scholar] [CrossRef] [PubMed]
- Gorodkiewicz, E.; Ostrowska, H.; Sankiewicz, A. SPR Imaging Biosensor for the 20S Proteasome: Sensor Development and Application to Measurement of Proteasomes in Human Blood Plasma. Microchim. Acta 2011, 175, 177–184. [Google Scholar] [CrossRef] [PubMed]
- Knox, E.G.; Aburto, M.R.; Clarke, G.; Cryan, J.F.; O’Driscoll, C.M. The Blood-Brain Barrier in Aging and Neurodegeneration. Mol. Psychiatry 2022, 27, 2659–2673. [Google Scholar] [CrossRef] [PubMed]
- Sarkaria, J.N.; Hu, L.S.; Parney, I.F.; Pafundi, D.H.; Brinkmann, D.H.; Laack, N.N.; Giannini, C.; Burns, T.C.; Kizilbash, S.H.; Laramy, J.K.; et al. Is the Blood-Brain Barrier Really Disrupted in All Glioblastomas? A Critical Assessment of Existing Clinical Data. Neuro Oncol. 2018, 20, 184–191. [Google Scholar] [CrossRef] [PubMed]
- Payne, L.S.; Huang, P.H. The Pathobiology of Collagens in Glioma. Mol. Cancer Res. 2013, 11, 1129–1140. [Google Scholar] [CrossRef]
- Benitez, J.A.; Finlay, D.; Castanza, A.; Parisian, A.D.; Ma, J.; Longobardi, C.; Campos, A.; Vadla, R.; Izurieta, A.; Scerra, G.; et al. PTEN Deficiency Leads to Proteasome Addiction: A Novel Vulnerability in Glioblastoma. Neuro Oncol. 2021, 23, 1072–1086. [Google Scholar] [CrossRef]

| Preoperative Diagnostic Method/Technique | Application | Ref. |
|---|---|---|
| MRI of the brain with various modifications (including the use of a gadolinium-based contrast agent) | The gold standard in the diagnosis of brain gliomas. | [2] |
| Perfusion MRI and PET | Determination of metabolic hotspots for tumor tissue harvesting when a biopsy is considered, rather than open resection. | [3] |
| Electroencephalography | Monitoring of epilepsy as the cause of the neoplastic tumor; helps in determining the cause of consciousness disorders. | [4] |
| Liquid biopsy | Detection of cell-free DNA of a brain tumor; liquid biopsy methods for screening, early diagnosis, and pre-operative diagnosis require further development to confirm their effectiveness. | [4] |
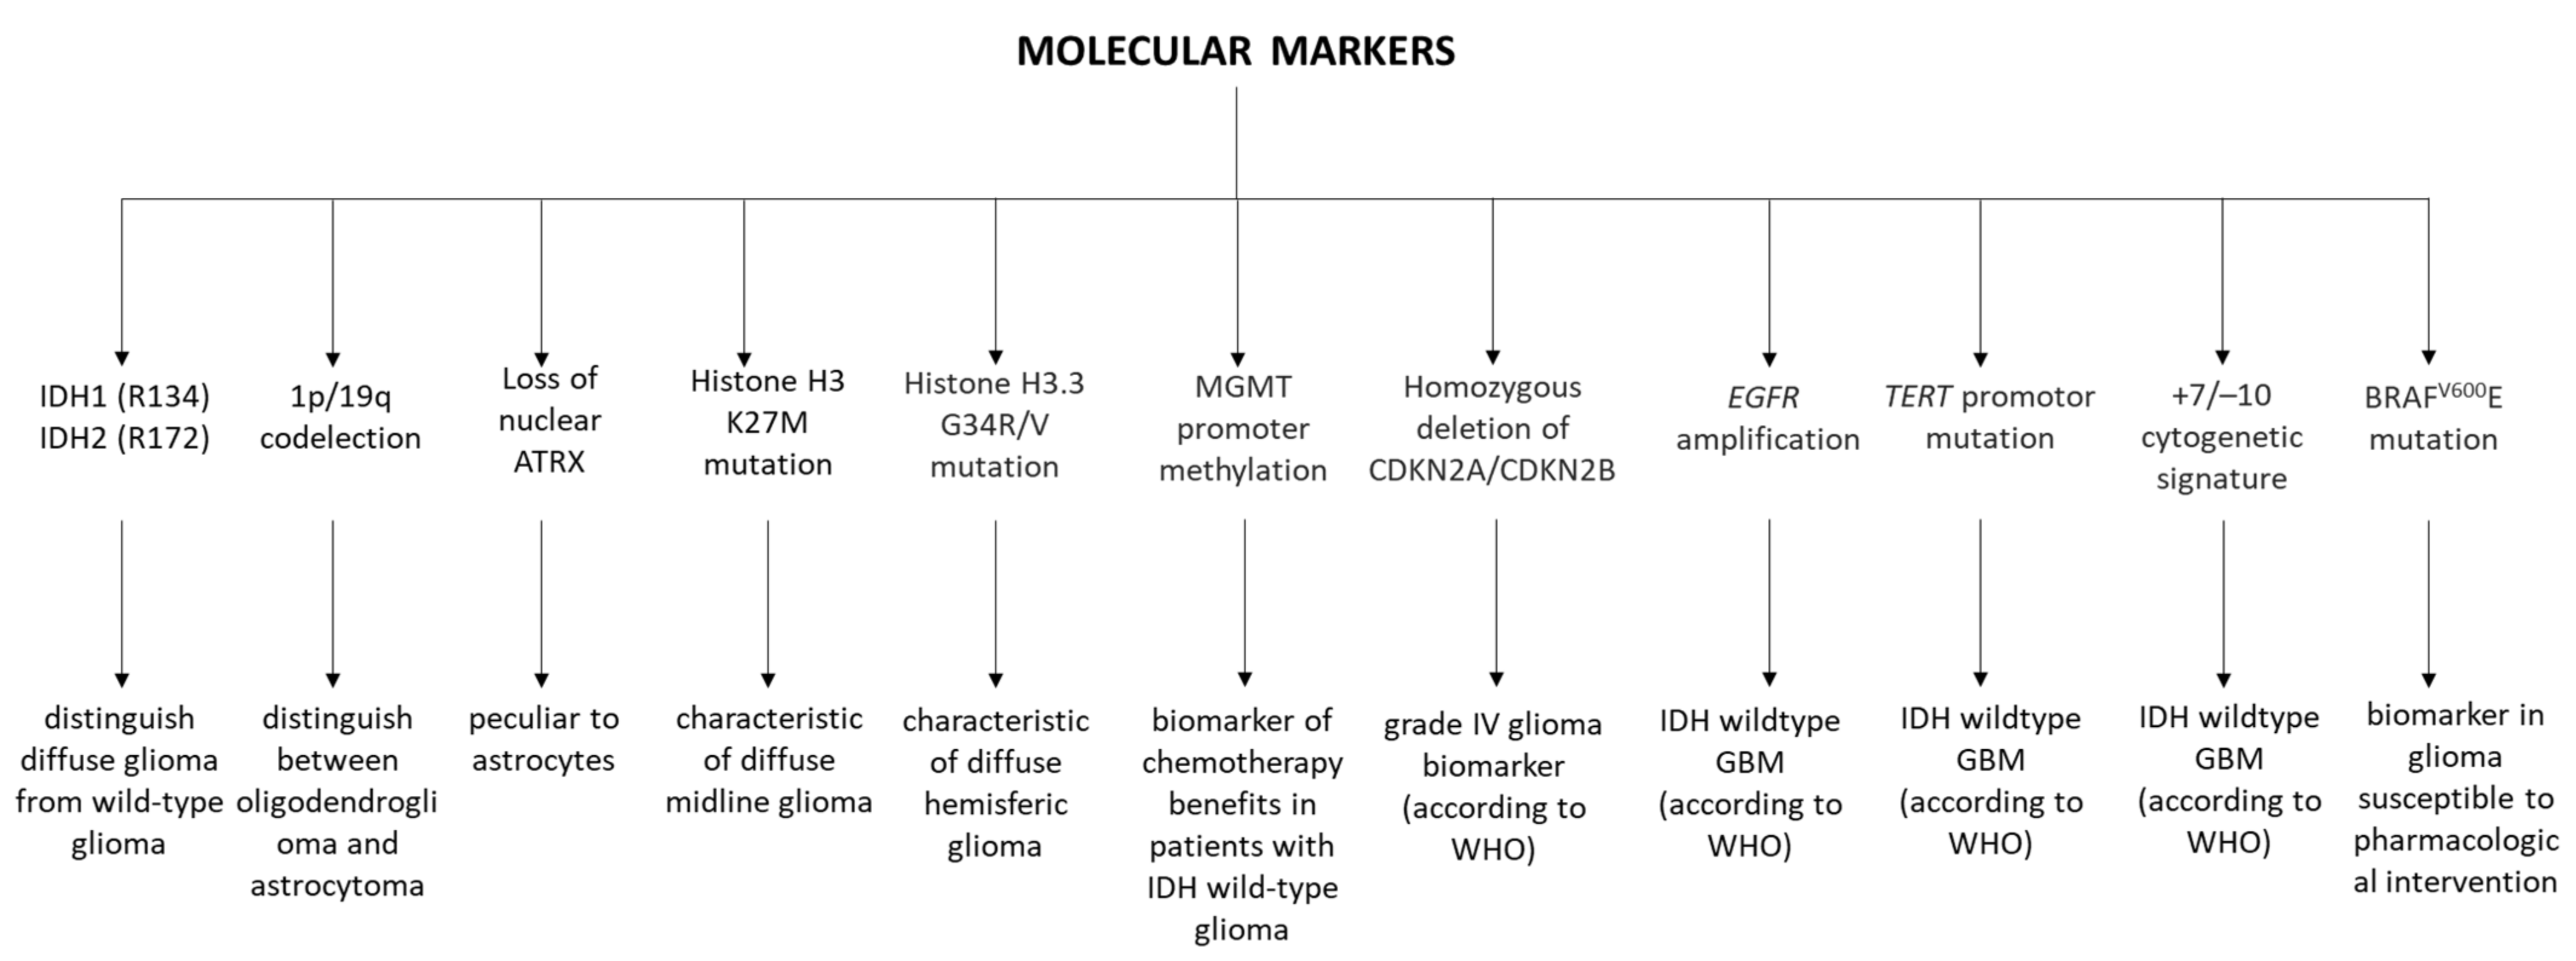
| Marker | Histological Type of Tumor | Characteristics of Marker Changes | Ref. |
|---|---|---|---|
| BRAF | Pilocytic astrocytoma | Mutations or fusions in the BRAF gene. | [6] |
| IDH1 CIC FUBP1 | Oligodendroglioma | The IDH1 mutation and the 1p19q chromosome co-deletion correlate with higher survival during the administration of combined chemotherapy and radiotherapy. Moreover, oligodendrogliomas are characterized by unique mutations of the CIC and FUBP1 genes. | |
| IDH p53 | Astrocytoma, primary glioblastoma | The development of astrocytomas through the IDH mutation followed by p53. EGFR amplification and loss of PTEN and cyclin-dependent kinase inhibitors in primary glioblastoma. | |
| IDH 1p/19q MGMT | Diffuse gliomas | IDH mutation, 1p/19q co-deletion, and MGMT methylation as prognostic markers of diffuse gliomas. | |
| MGMT promoter methylation | Anaplastic glioma, glioblastoma multiforme (GBM) | MGMT promoter methylation is a prognostic marker for low-grade gliomas (about 93%), anaplastic gliomas (50–80%), primary glioblastomas (about 40%), and secondary glioblastomas (about 70%). | [7] |
| ATRX | Secondary glioblastoma, low-grade glioma | Mutation or deletion of the ATRX gene, which is also found in IDH mutant tumors that are not 1p/19q co-deleted. | [8] |
| EGFR | Primary glioblastoma | Amplification, mutation, and mutual exclusion of p53 mutations. EGFR amplification occurs in approximately 40% of GBM patients and correlates with high-grade neoplasm. | |
| HIF-1α | High-grade glioma | Overexpression. | |
| NF1 | Mesenchymal and pilocytic astrocytomas Primary glioblastoma | About 20% mutation or deletion in the primary glioblastoma. Close association of NF1 with the mesenchymal subtype. | |
| VEGF | Mesenchymal glioma | Overexpression correlates with a higher grade of glioma. | |
| ELDT1 | Mesenchymal and high-grade gliomas | Overexpression. |
| Analytical Characteristics of the Methods Used | Characteristics of the Quantification Procedures Used | |||||
|---|---|---|---|---|---|---|
| Biomarker | Method | Analytical Characteristic | Ref. | Biological Material | Dilution | pH |
| MMP-1 | SPRi biosensor (non-fluidic) | Cantibody = 170 ng/mL | [23] | Blood plasma (blood centrifuged at 3000 rpm for 15 min, then stored at −80 °C) | K | 7.40 |
| LOD = 9 pg/mL | G1 ×15 | |||||
| LOQ = 18 pq/mL | G2 | |||||
| pH = 7.40 | G3 ×30 | |||||
| LR: 0.1–2.5 ng/mL | G4 | |||||
| UCH-L1 | Cantibody = 10 µg/mL | [24] | K | |||
| LOD = 0.06 ng/mL | G1 ×10 | |||||
| LOQ = 0.19 ng/mL | G2 | |||||
| pH = 7.40 | G3 ×15 | |||||
| LR: 0.5–3.0 ng/mL | G4 | |||||
| 20S Proteasome | CPSI = 25 µg/mL | [25] | K | |||
| LOD = 0.1 µg/mL | G1 ×5 | |||||
| LOQ = 0.37 µg/mL | G2 | |||||
| pH = 7.40 | G3 ×10 | |||||
| LR: 1.4–7.0 µg/mL | G4 | |||||
| AUC | p-Value | PPV (%) | NPV (%) | Sensitivity (%) | Specificity (%) | Cut-Off Point | |
|---|---|---|---|---|---|---|---|
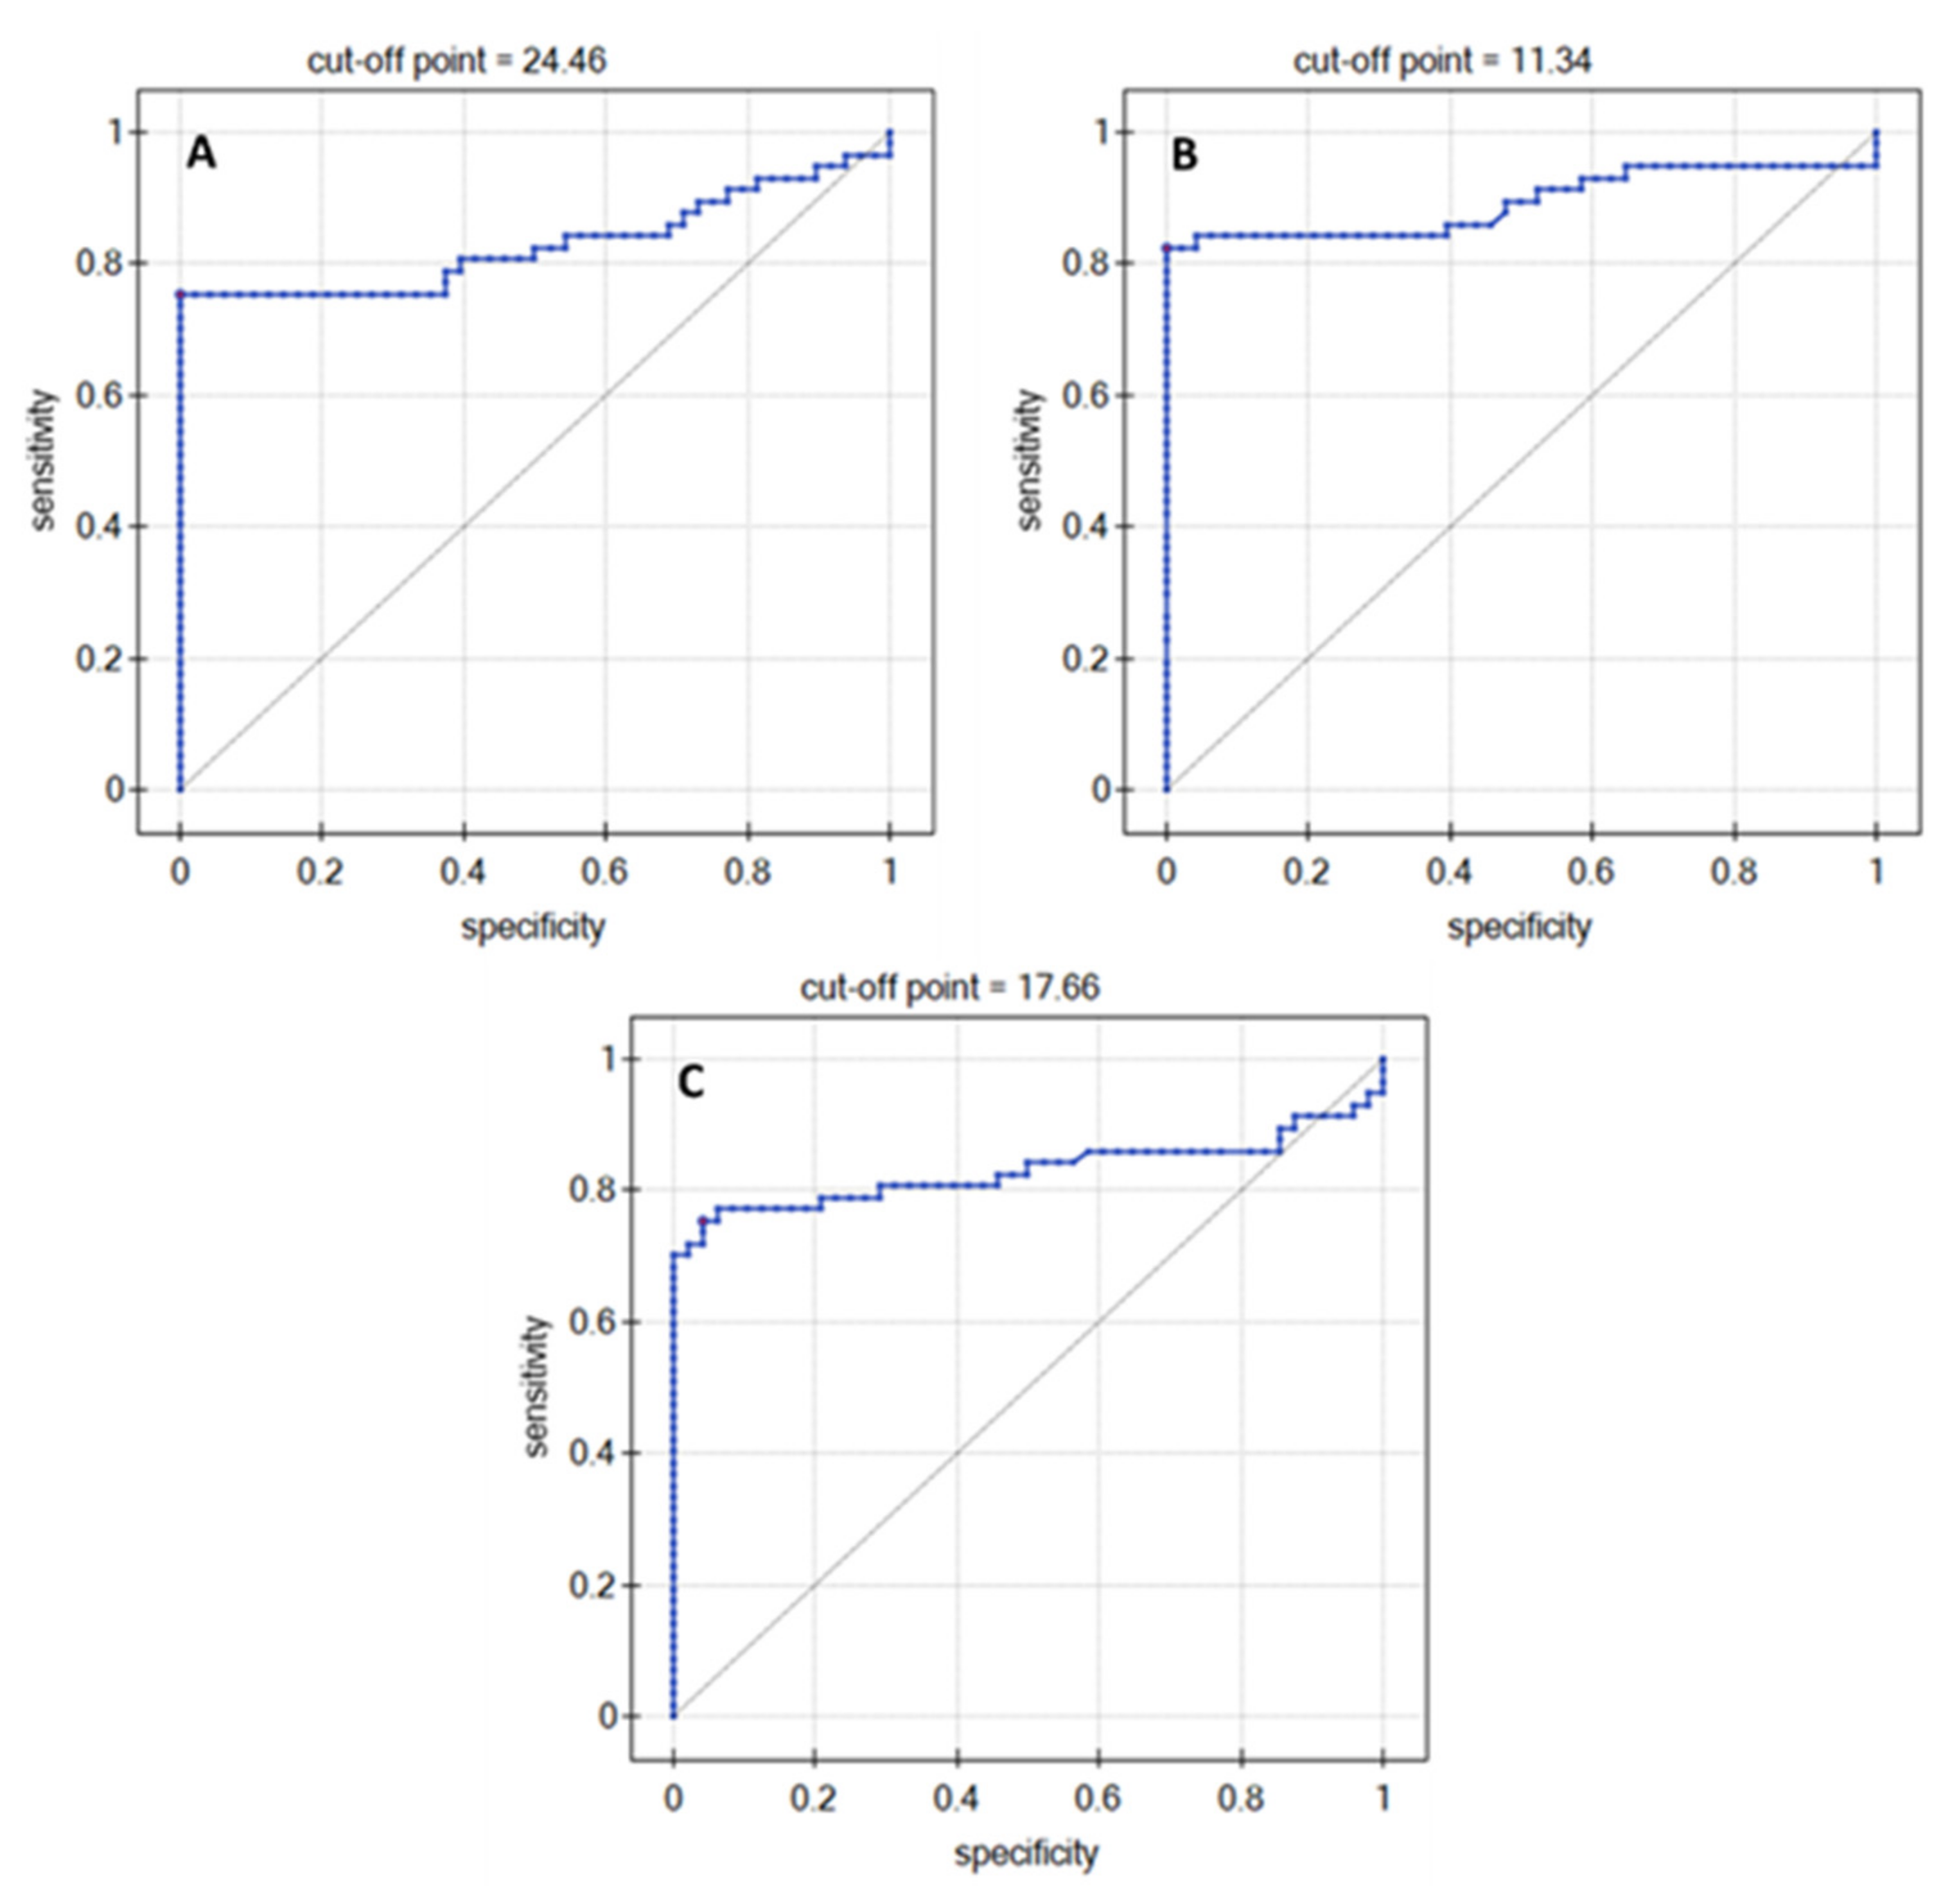
| MMP-1 | 0.83 | <<0.01 | 100 | 77.42 | 75.43 | 100 | 24.46 |
| UCH-L1 | 0.89 | <<0.01 | 100 | 82.76 | 82.46 | 100 | 11.34 |
| 20S Proteasome | 0.83 | <<0.01 | 95.56 | 76.67 | 75.44 | 95.83 | 17.66 |
Publisher’s Note: MDPI stays neutral with regard to jurisdictional claims in published maps and institutional affiliations. |
© 2022 by the authors. Licensee MDPI, Basel, Switzerland. This article is an open access article distributed under the terms and conditions of the Creative Commons Attribution (CC BY) license (https://creativecommons.org/licenses/by/4.0/).
Share and Cite
Oldak, L.; Chludzinska-Kasperuk, S.; Milewska, P.; Grubczak, K.; Reszec, J.; Gorodkiewicz, E. MMP-1, UCH-L1, and 20S Proteasome as Potential Biomarkers Supporting the Diagnosis of Brain Glioma. Biomolecules 2022, 12, 1477. https://doi.org/10.3390/biom12101477
Oldak L, Chludzinska-Kasperuk S, Milewska P, Grubczak K, Reszec J, Gorodkiewicz E. MMP-1, UCH-L1, and 20S Proteasome as Potential Biomarkers Supporting the Diagnosis of Brain Glioma. Biomolecules. 2022; 12(10):1477. https://doi.org/10.3390/biom12101477
Chicago/Turabian StyleOldak, Lukasz, Sylwia Chludzinska-Kasperuk, Patrycja Milewska, Kamil Grubczak, Joanna Reszec, and Ewa Gorodkiewicz. 2022. "MMP-1, UCH-L1, and 20S Proteasome as Potential Biomarkers Supporting the Diagnosis of Brain Glioma" Biomolecules 12, no. 10: 1477. https://doi.org/10.3390/biom12101477
APA StyleOldak, L., Chludzinska-Kasperuk, S., Milewska, P., Grubczak, K., Reszec, J., & Gorodkiewicz, E. (2022). MMP-1, UCH-L1, and 20S Proteasome as Potential Biomarkers Supporting the Diagnosis of Brain Glioma. Biomolecules, 12(10), 1477. https://doi.org/10.3390/biom12101477


