
Selecting Multitarget Peptides for Alzheimer’s Disease


Abstract
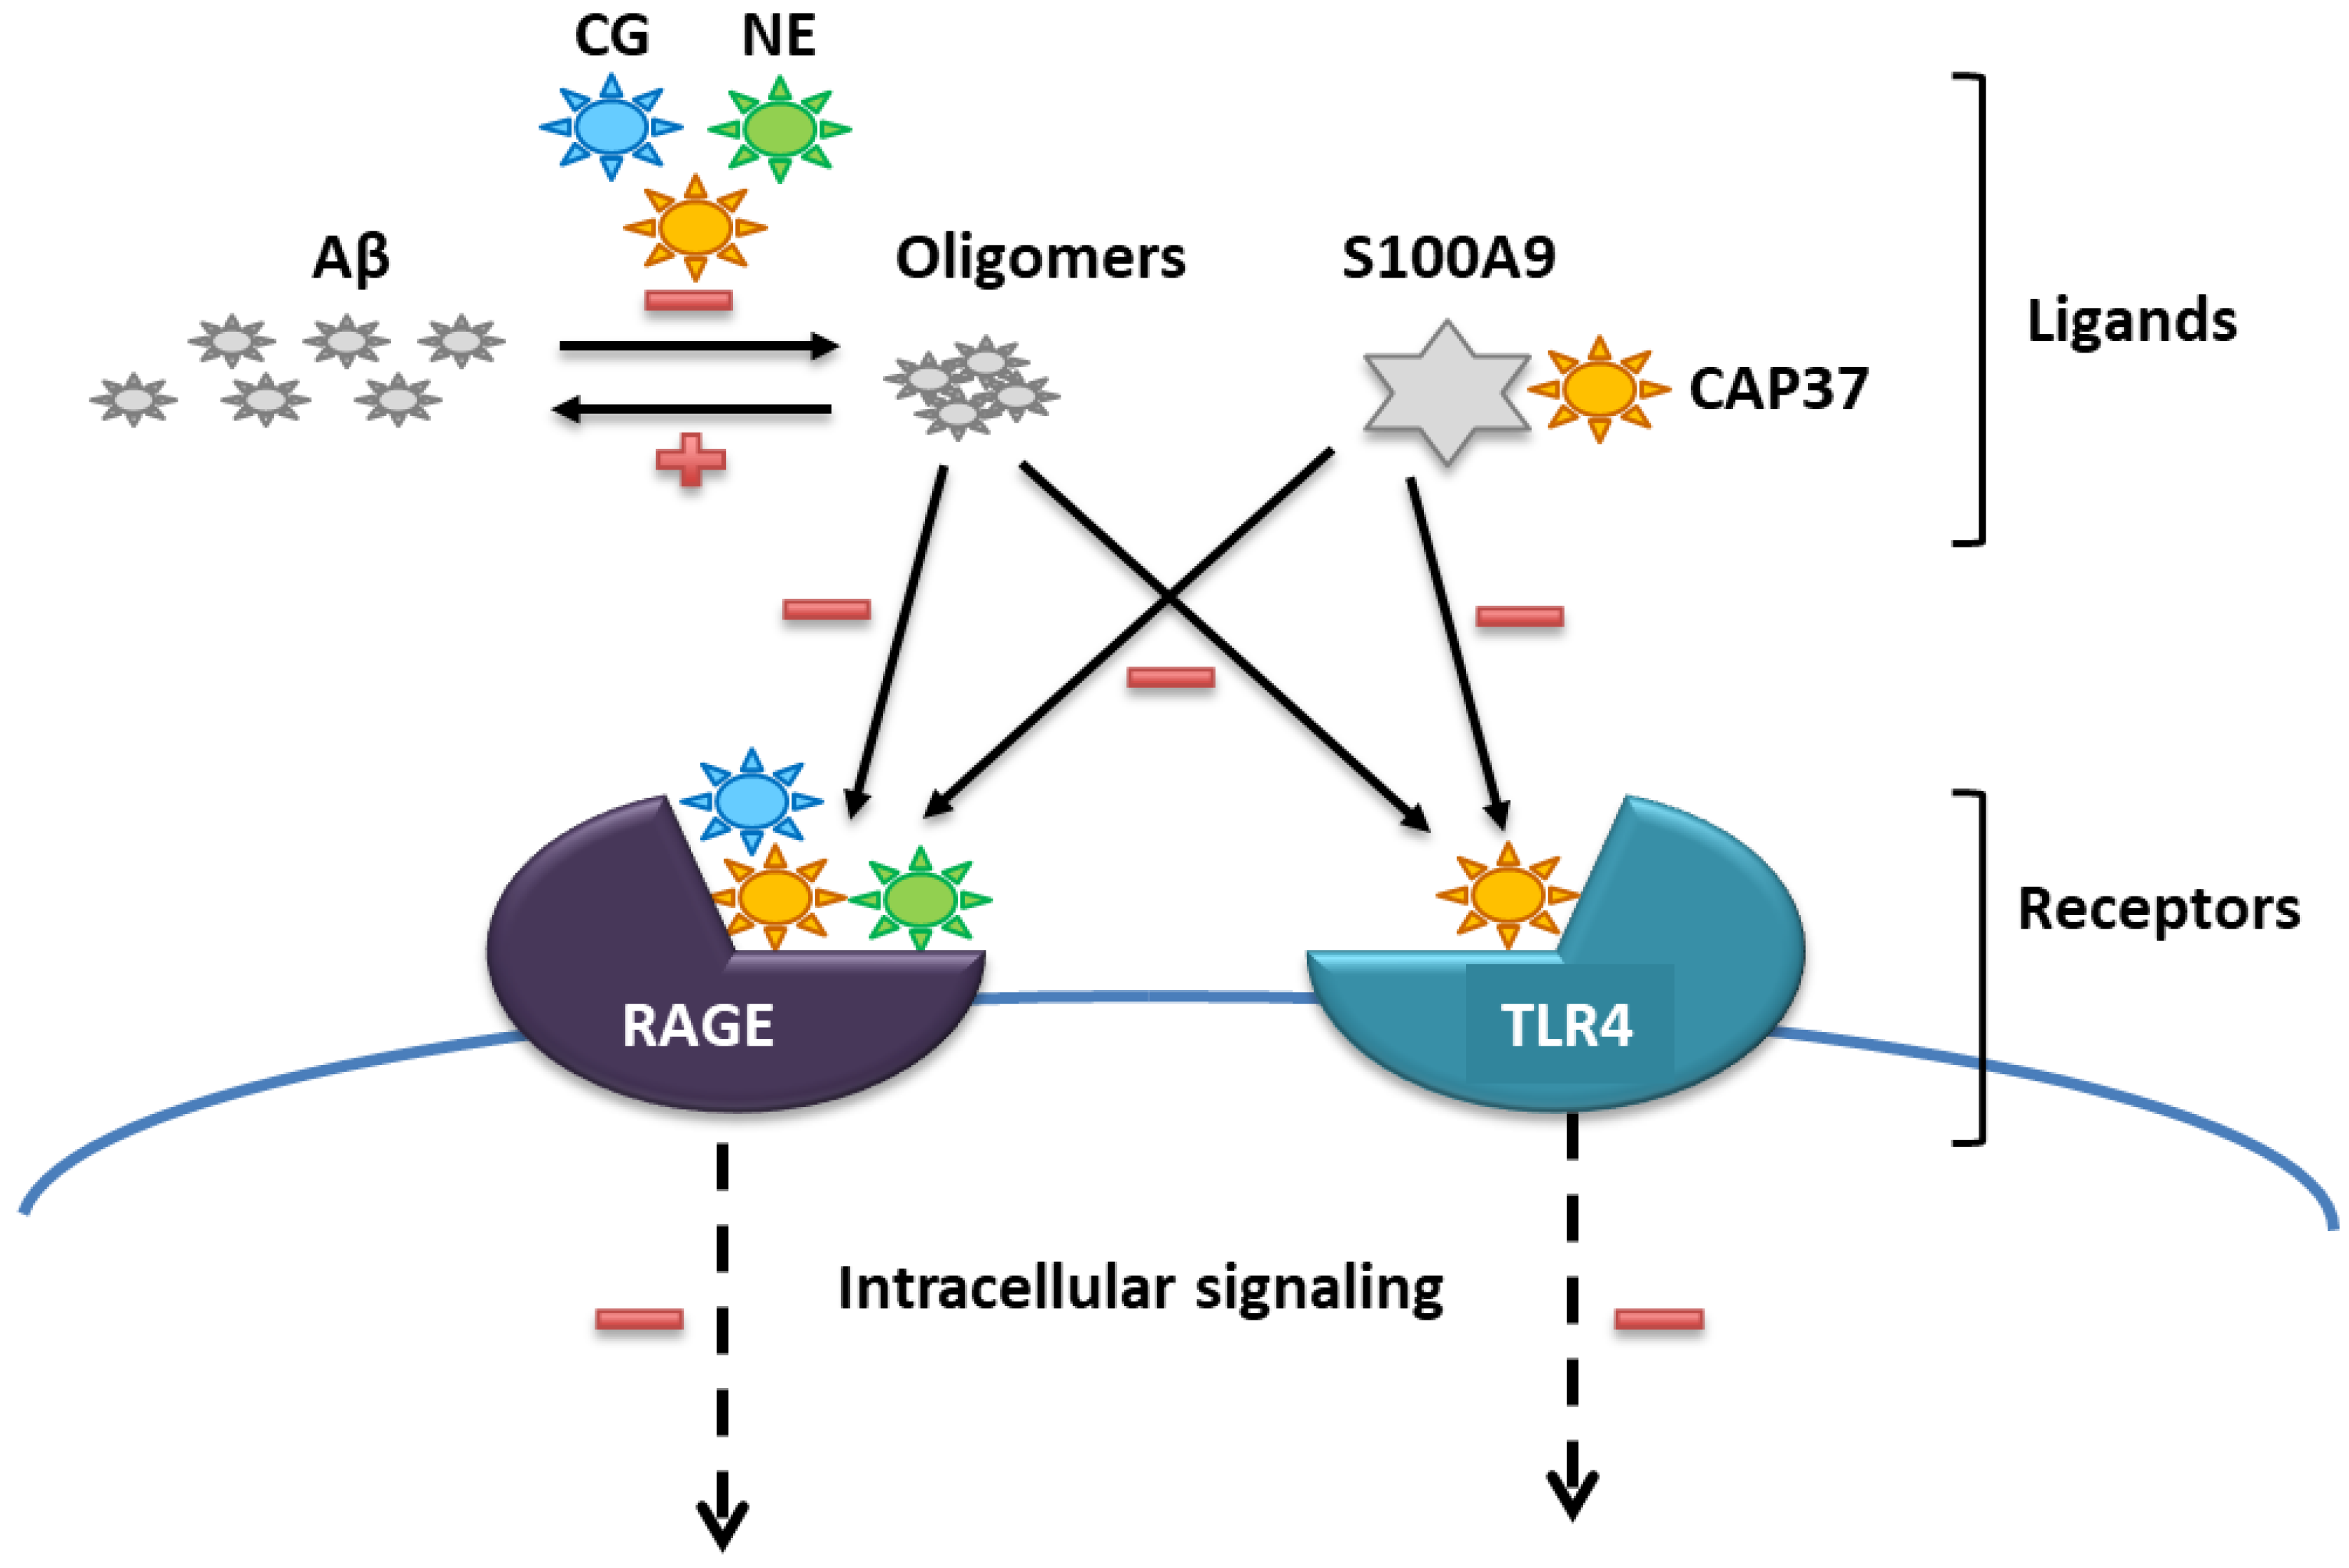
1. Introduction
2. Materials and Methods
2.1. Materials
2.2. Preparation of Aβ1–42 Oligomers
2.3. Enzyme-Linked Immunosorbent Assays
2.4. Cell Culture and Neurotoxicity Assay
2.5. Cell Culture and TLR4 Activation Assay
2.6. Statistical Analysis
3. Results
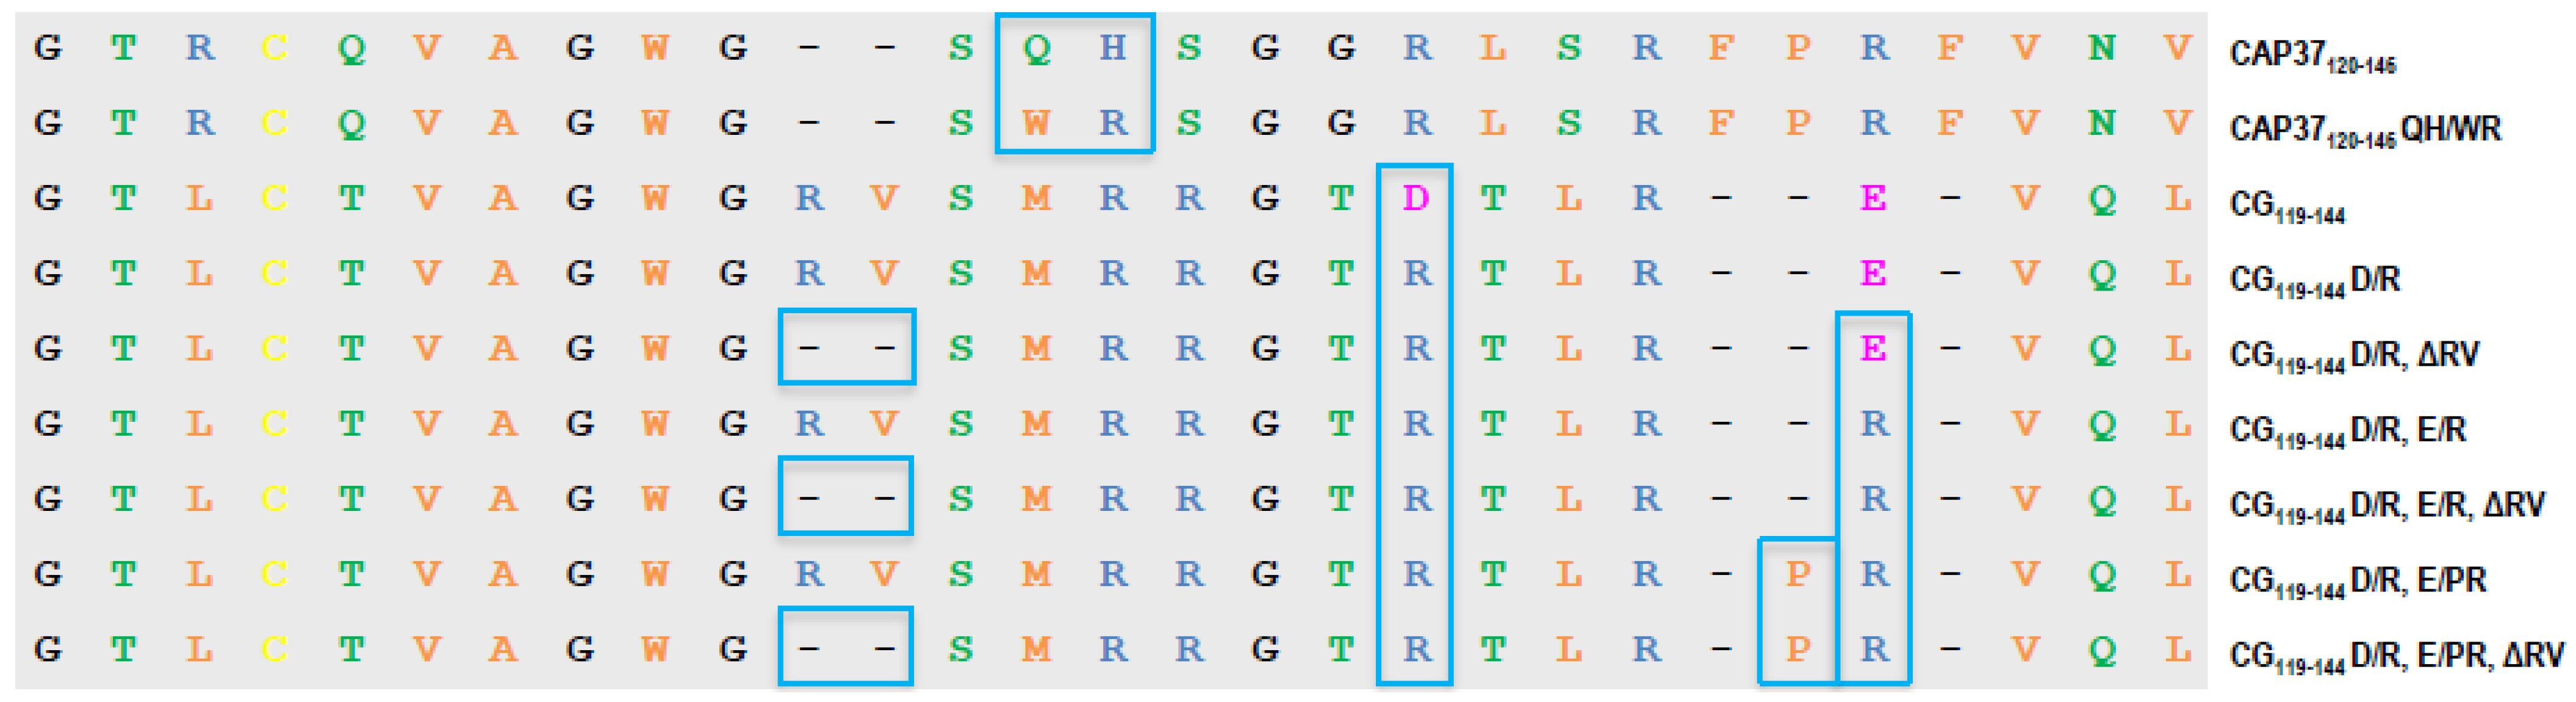
3.1. Design of Peptide Candidates
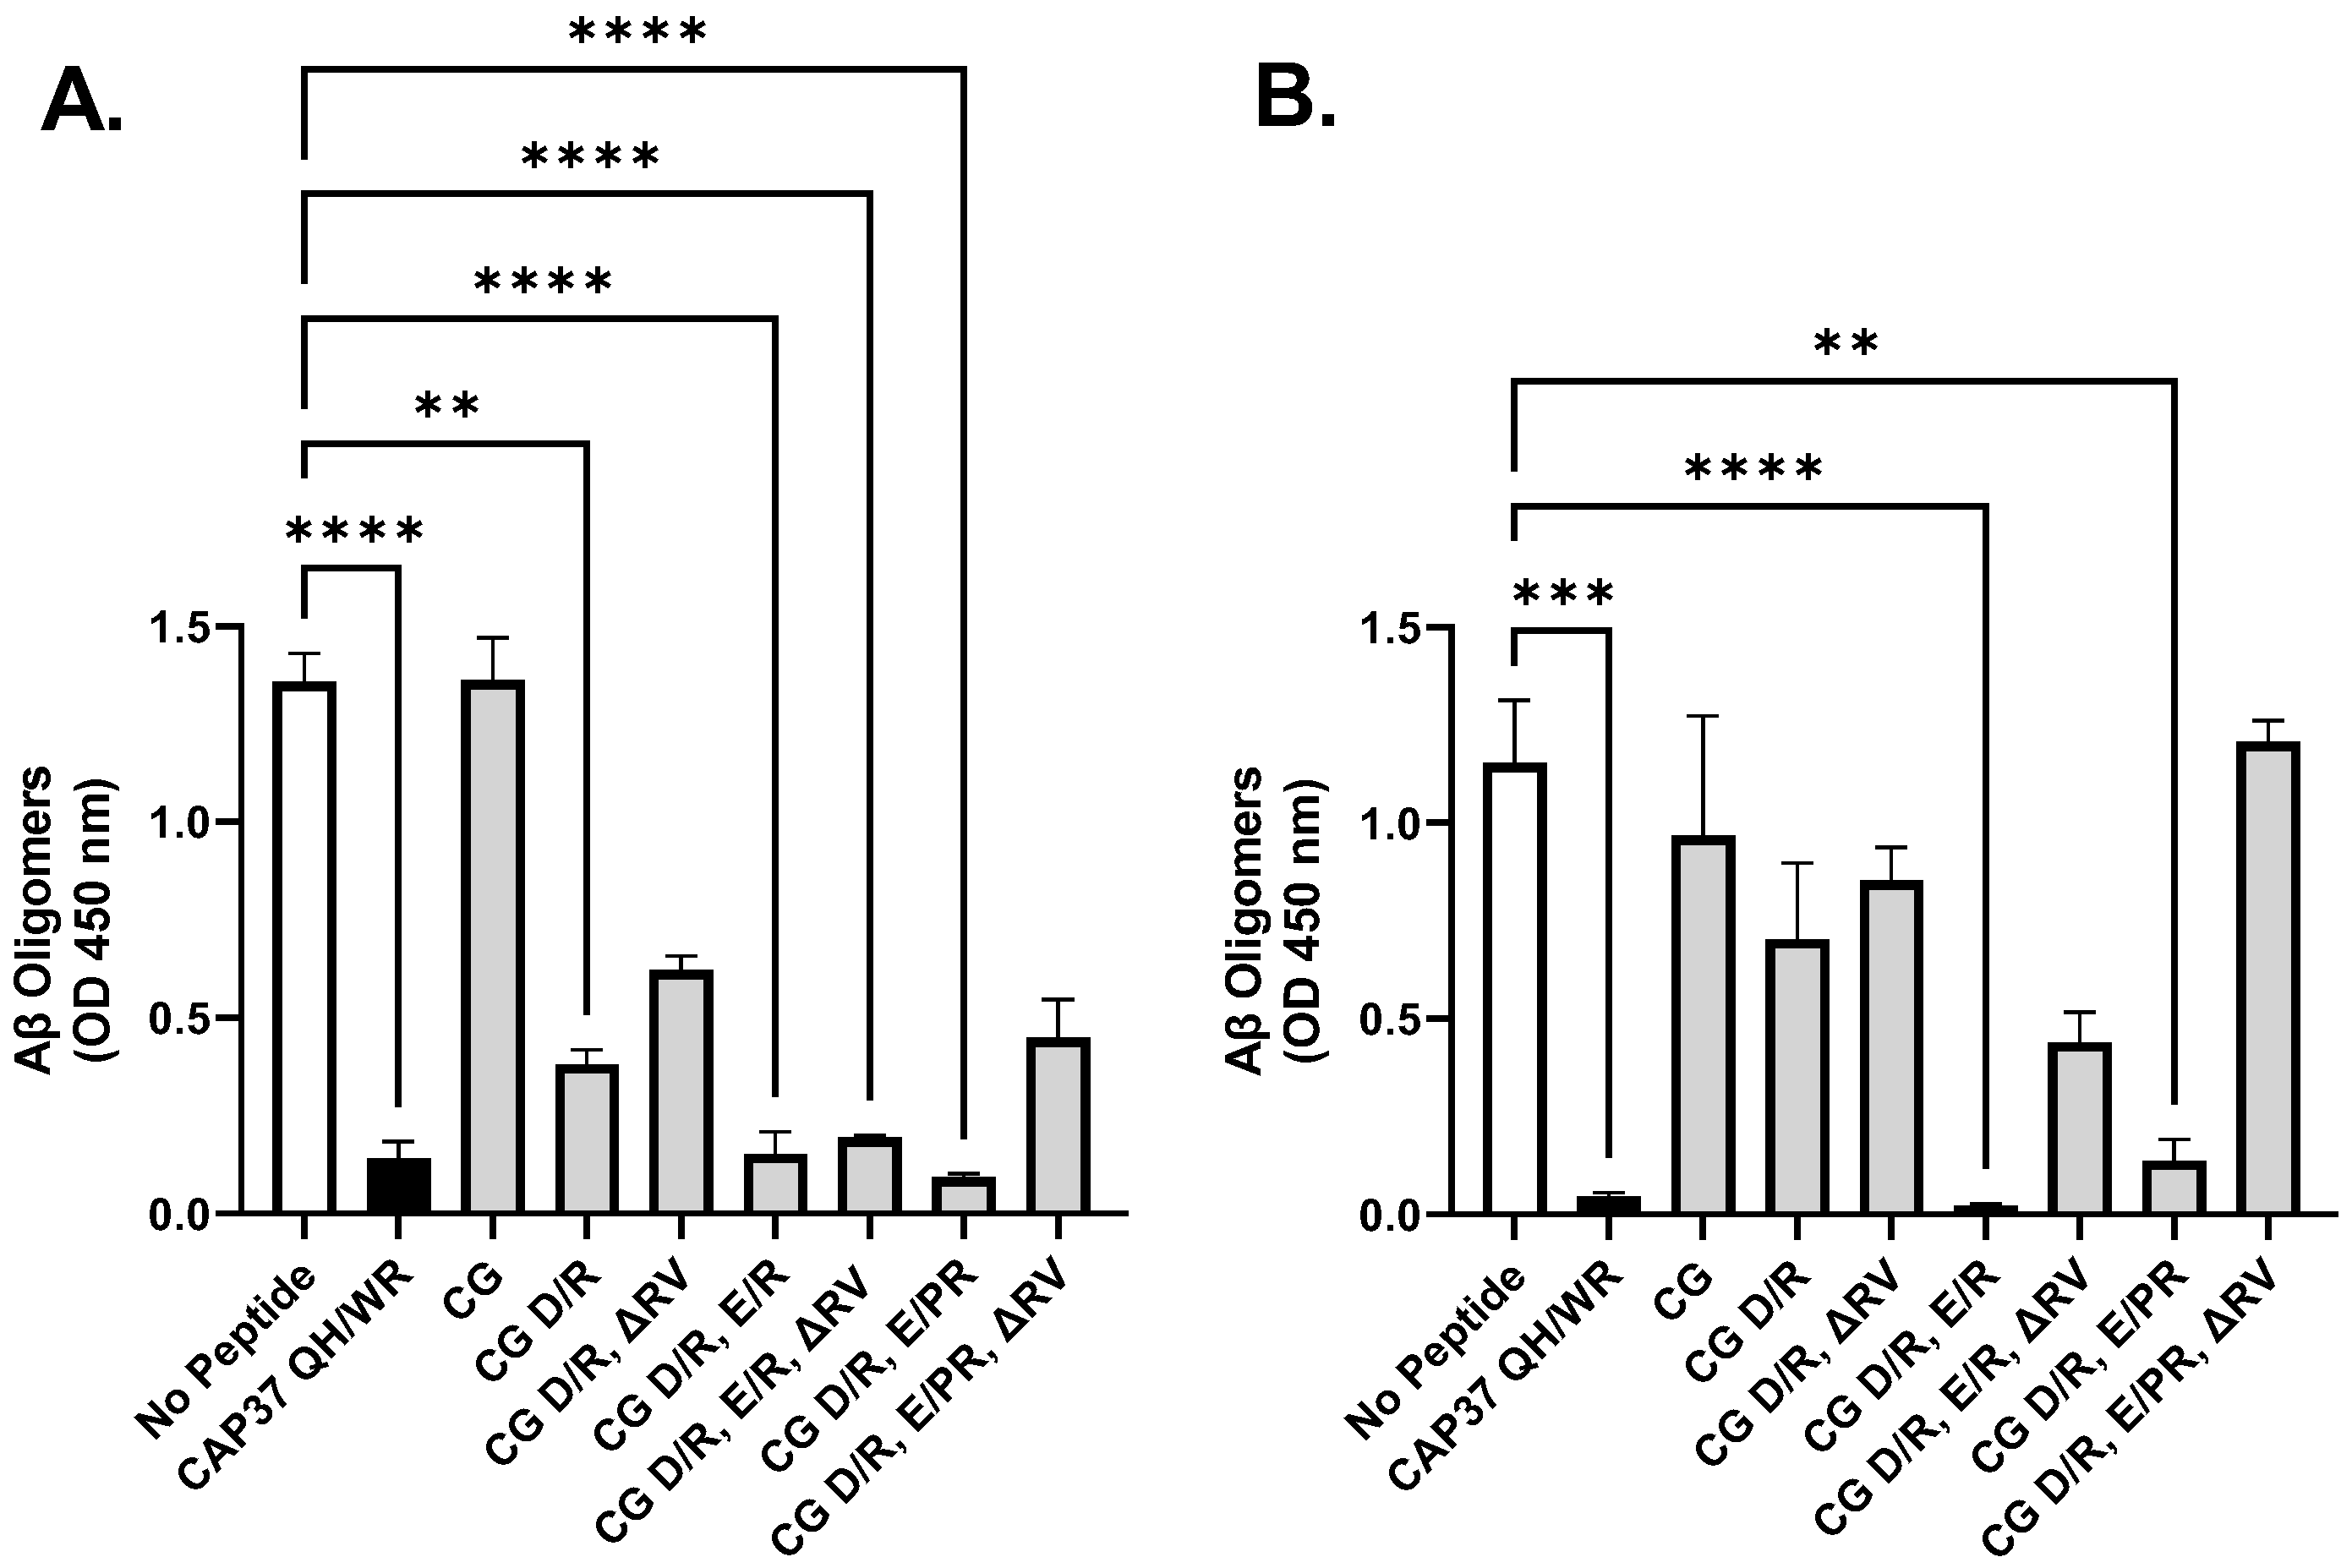
3.2. Effect of Peptide Candidates on Aβ1–42 Oligomerization
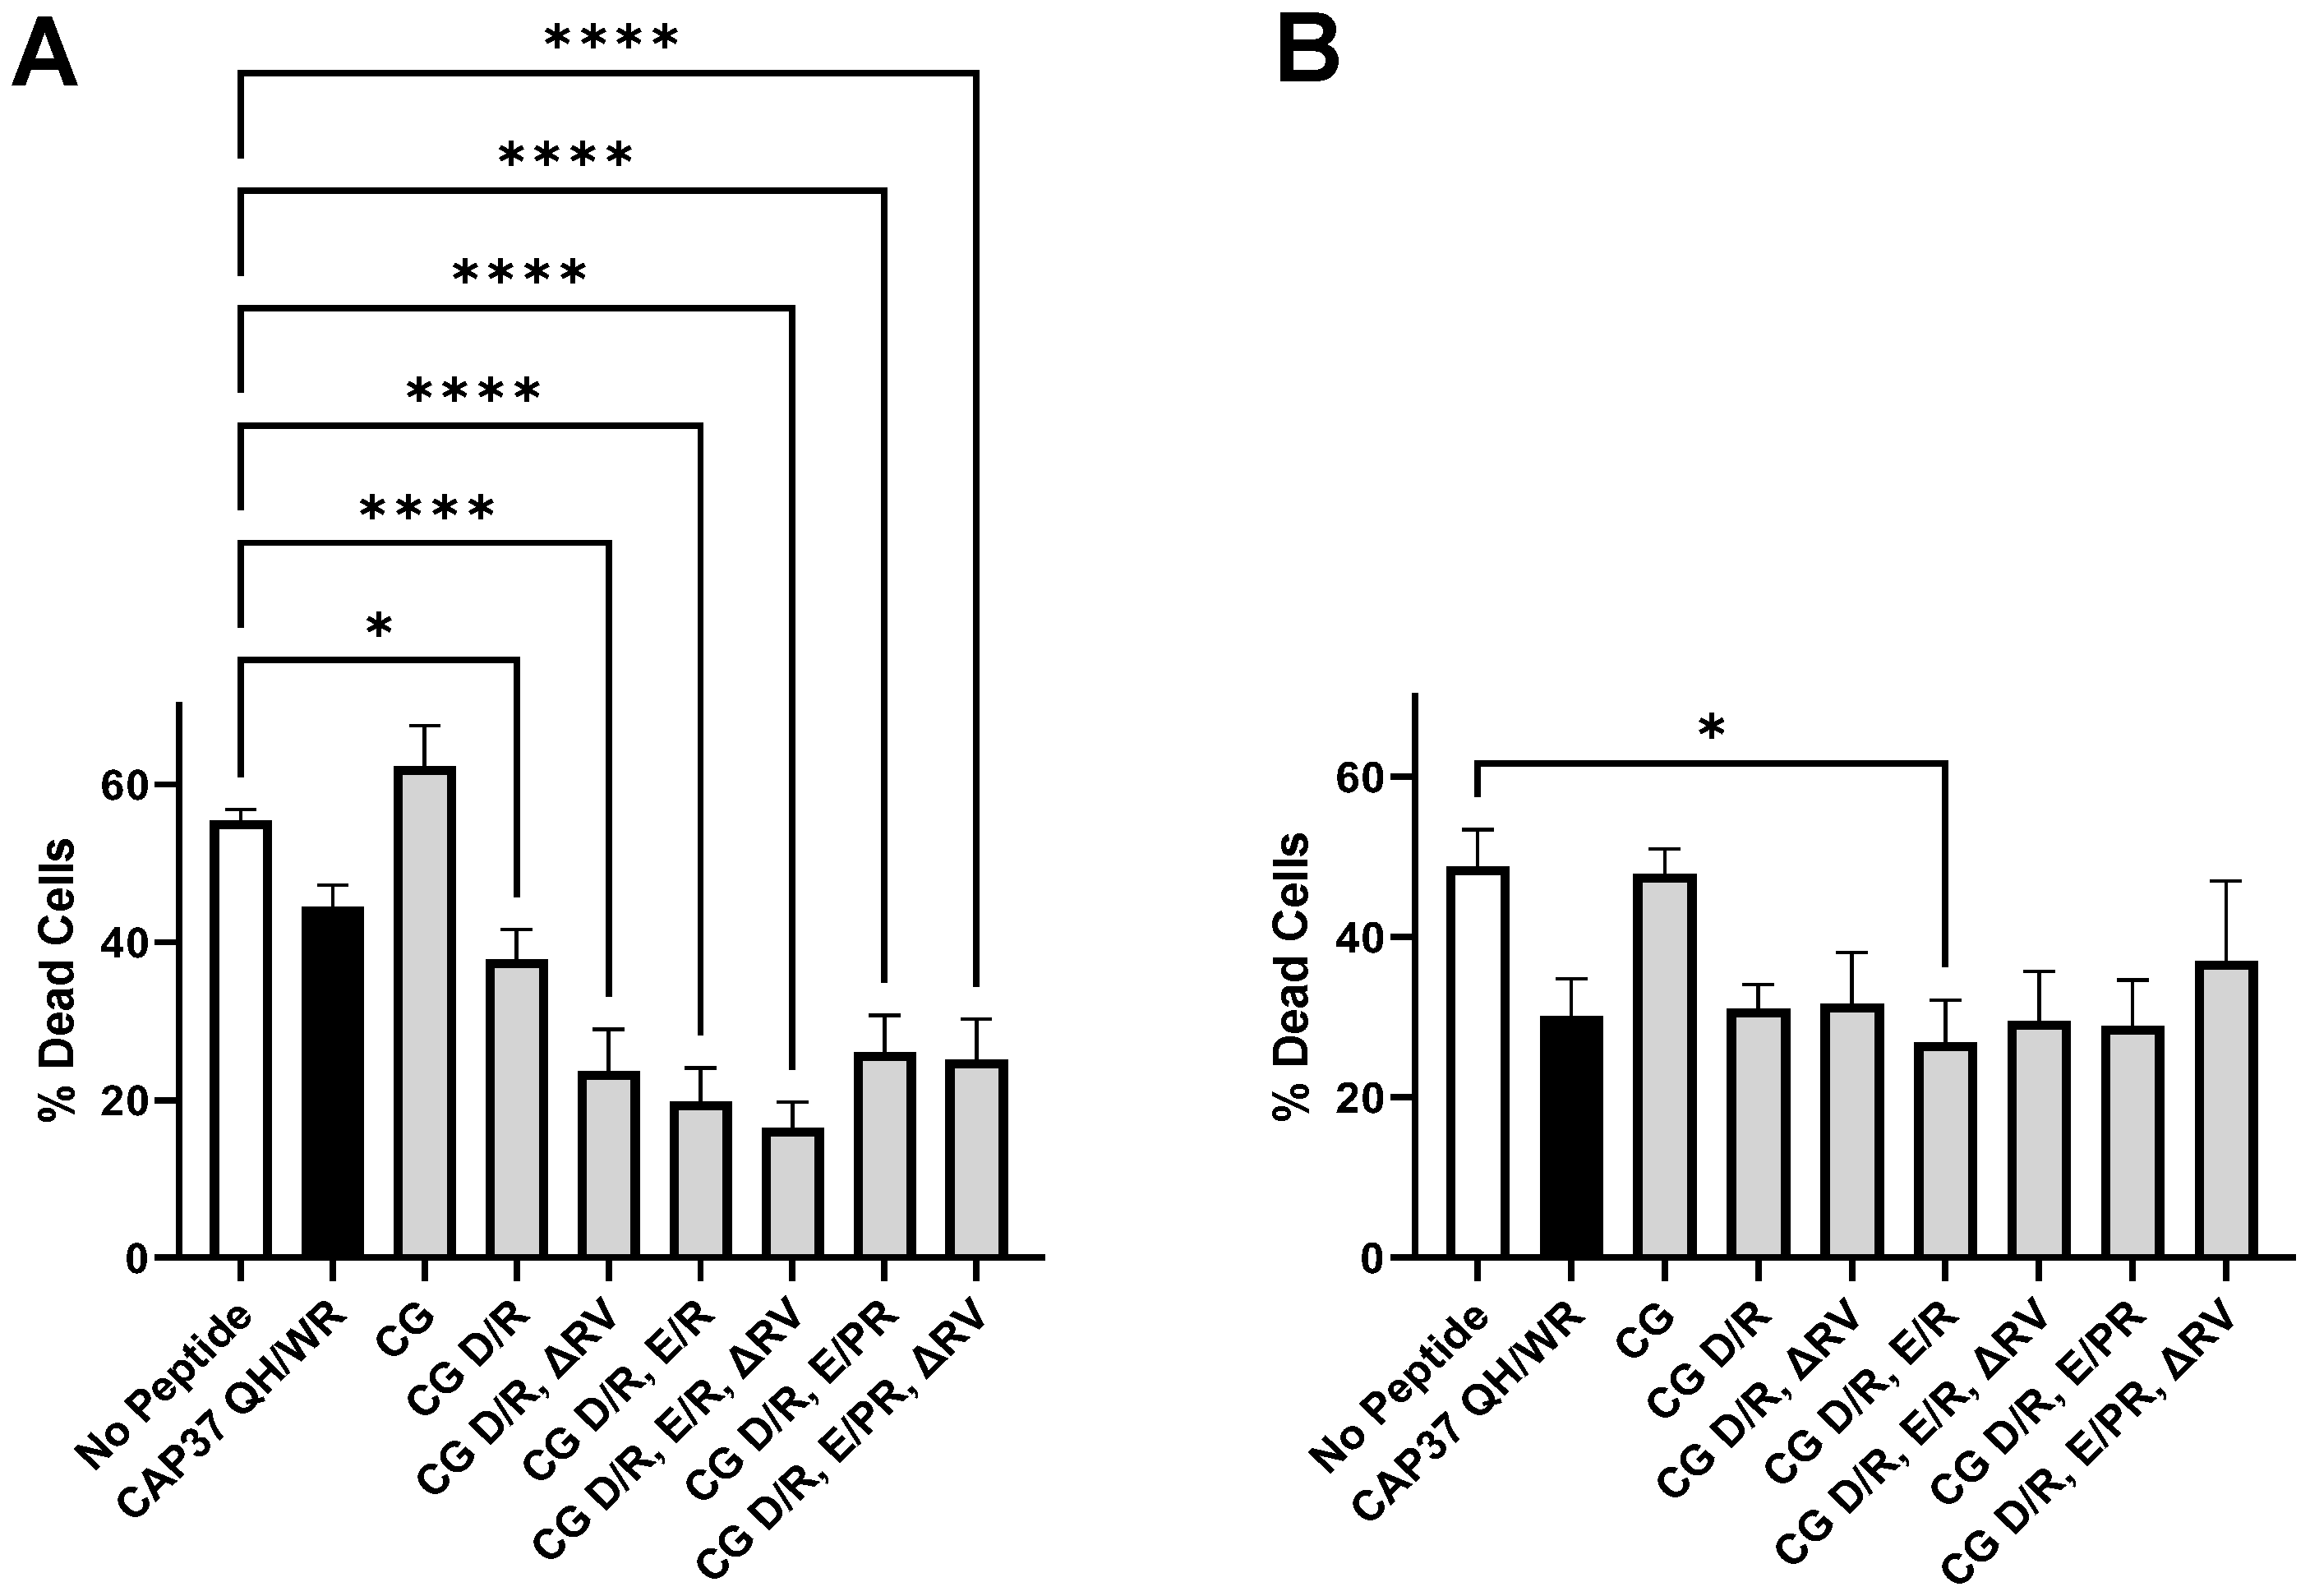
3.3. Inhibition and Reversion of Aβ1–42 Oligomers Neurotoxicity by Peptide Candidates
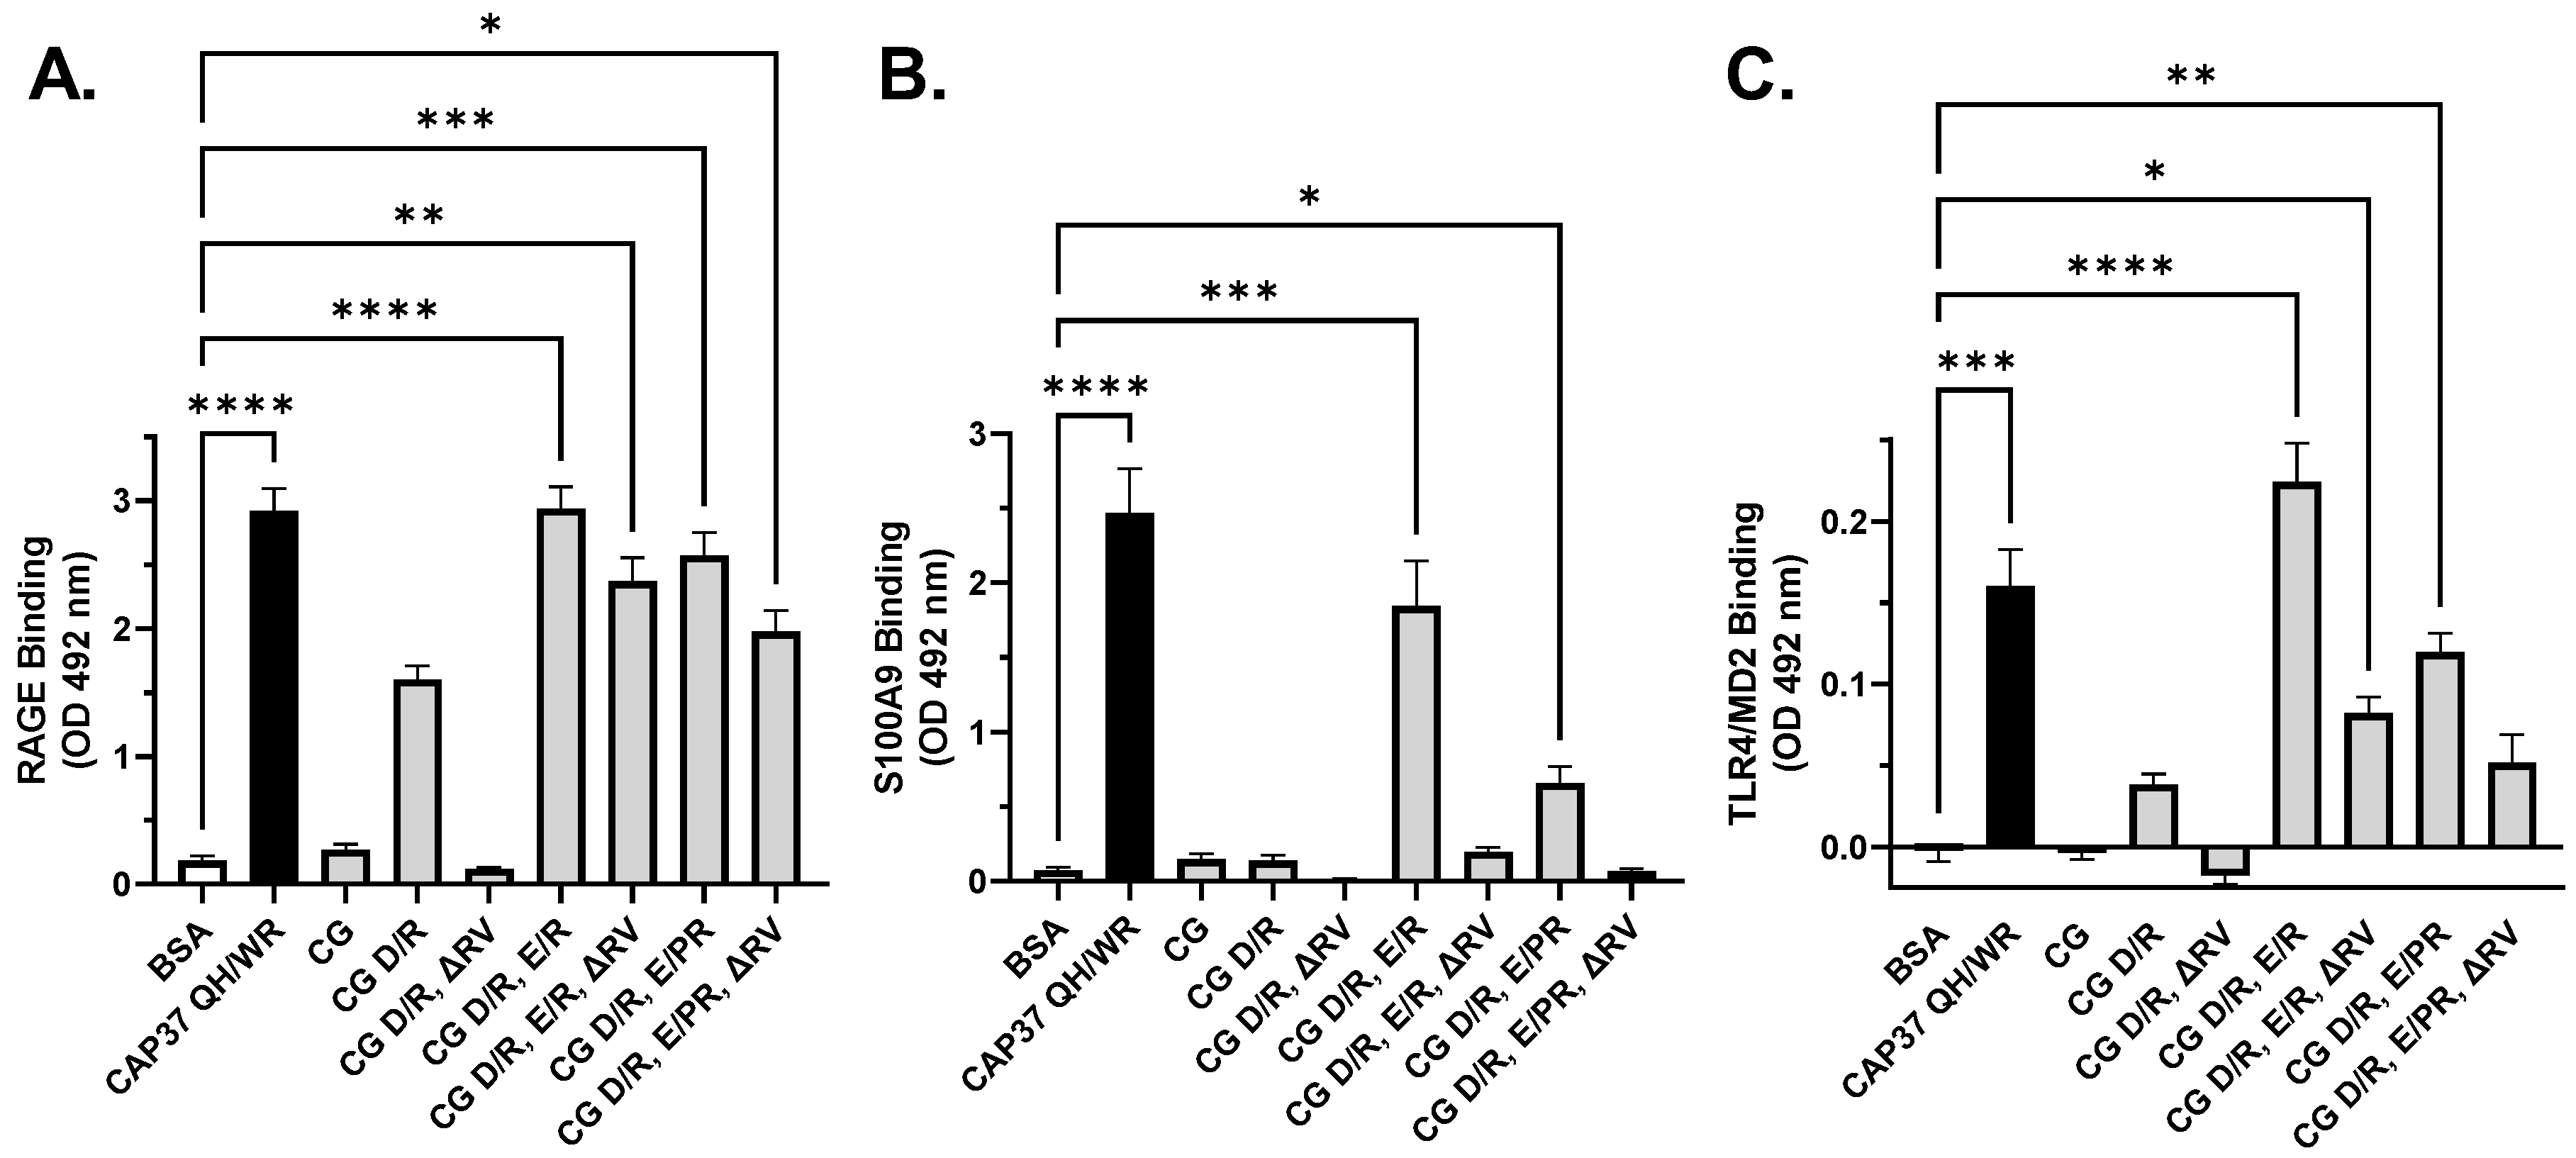
3.4. Interaction of Peptide Candidates with RAGE, S100A9 and TLR4
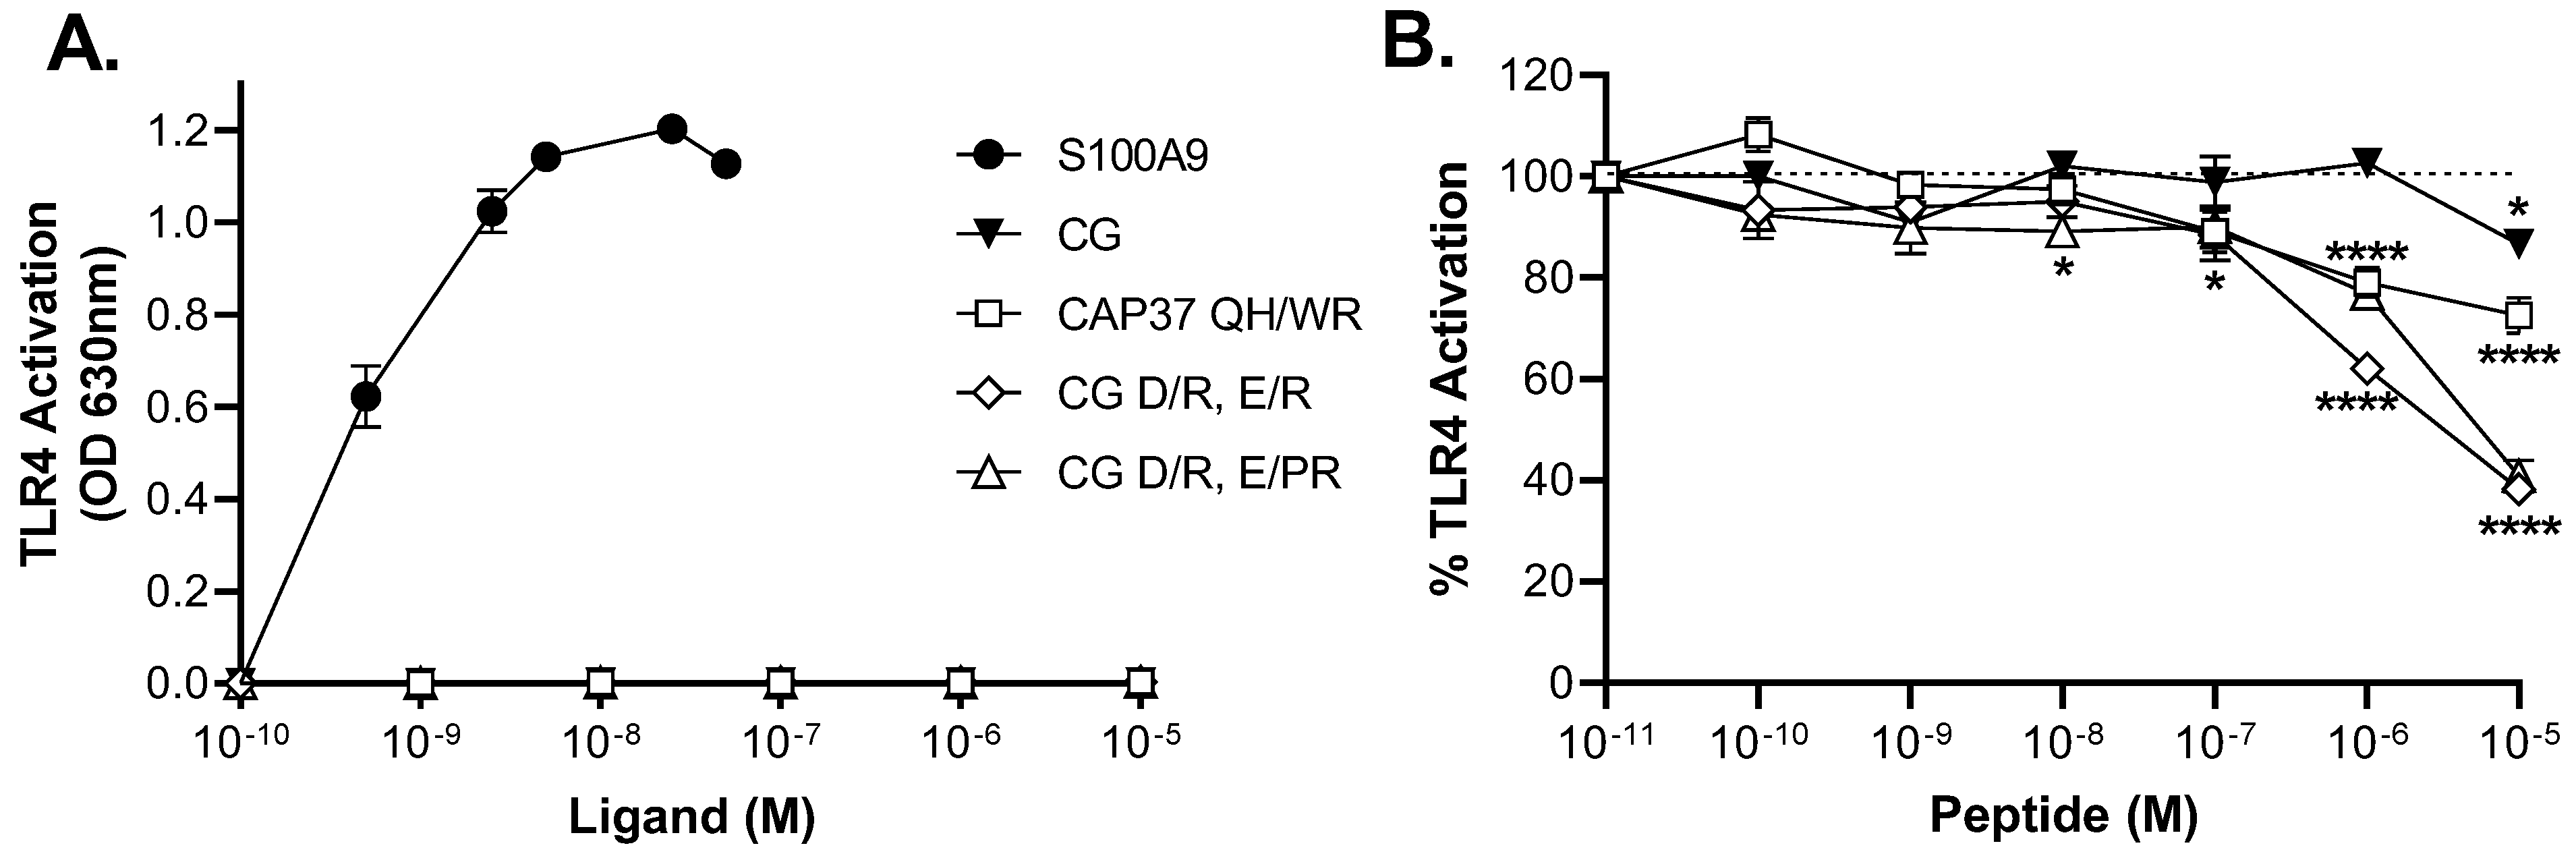
3.5. Inhibitory Effects of Peptide Candidates on TLR4 Activation
4. Discussion
5. Conclusions
6. Patents
Author Contributions
Funding
Institutional Review Board Statement
Informed Consent Statement
Data Availability Statement
Acknowledgments
Conflicts of Interest
References
- Rossi, B.; Constantin, G.; Zenaro, E. The emerging role of neutrophils in neurodegeneration. Immunobiology 2020, 225, 151865. [Google Scholar] [CrossRef] [PubMed]
- Stock, A.J.; Kasus-Jacobi, A.; Pereira, H.A. The role of neutrophil granule proteins in neuroinflammation and Alzheimer’s disease. J. Neuroinflamm. 2018, 15, 240. [Google Scholar] [CrossRef]
- Zenaro, E.; Pietronigro, E.; Bianca, V.D.; Piacentino, G.; Marongiu, L.; Budui, S.; Turano, E.; Rossi, B.; Angiari, S.; Dusi, S.; et al. Neutrophils promote Alzheimer’s disease-like pathology and cognitive decline via LFA-1 integrin. Nat. Med. 2015, 21, 880–886. [Google Scholar] [CrossRef] [PubMed]
- Baik, S.H.; Cha, M.Y.; Hyun, Y.M.; Cho, H.; Hamza, B.; Kim, D.K.; Han, S.H.; Choi, H.; Kim, K.H.; Moon, M.; et al. Migration of neutrophils targeting amyloid plaques in Alzheimer’s disease mouse model. Neurobiol. Aging 2014, 35, 1286–1292. [Google Scholar] [CrossRef] [PubMed]
- Kuyumcu, M.E.; Yesil, Y.; Oztürk, Z.A.; Kizilarslanoglu, M.C.; Etgül, S.; Halil, M.; Ulger, Z.; Cankurtaran, M.; Ariogul, S. The evaluation of neutrophil-lymphocyte ratio in Alzheimer’s disease. Dement. Geriatr. Cogn. Disord. 2012, 34, 69–74. [Google Scholar] [CrossRef]
- Scali, C.; Prosperi, C.; Bracco, L.; Piccini, C.; Baronti, R.; Ginestroni, A.; Sorbi, S.; Pepeu, G.; Casamenti, F. Neutrophils CD11b and fibroblasts PGE(2) are elevated in Alzheimer’s disease. Neurobiol. Aging 2002, 23, 523–530. [Google Scholar] [CrossRef]
- Vitte, J.; Michel, B.F.; Bongrand, P.; Gastaut, J.L. Oxidative stress level in circulating neutrophils is linked to neurodegenerative diseases. J. Clin. Immunol. 2004, 24, 683–692. [Google Scholar] [CrossRef] [PubMed]
- Fiala, M.; Lin, J.; Ringman, J.; Kermani-Arab, V.; Tsao, G.; Patel, A.; Lossinsky, A.S.; Graves, M.C.; Gustavson, A.; Sayre, J.; et al. Ineffective phagocytosis of amyloid-beta by macrophages of Alzheimer’s disease patients. J. Alzheimer’s Dis. JAD 2005, 7, 221–232, discussion 55–62. [Google Scholar] [CrossRef] [PubMed]
- Shad, K.F.; Aghazadeh, Y.; Ahmad, S.; Kress, B. Peripheral markers of Alzheimer’s disease: Surveillance of white blood cells. Synapse 2013, 67, 541–543. [Google Scholar] [CrossRef] [PubMed]
- Le Page, A.; Lamoureux, J.; Bourgade, K.; Frost, E.H.; Pawelec, G.; Witkowski, J.M.; Larbi, A.; Dupuis, G.; Fülöp, T. Polymorphonuclear Neutrophil Functions are Differentially Altered in Amnestic Mild Cognitive Impairment and Mild Alzheimer’s Disease Patients. J. Alzheimer’s Dis. JAD 2017, 60, 23–42. [Google Scholar] [CrossRef] [PubMed]
- Dong, Y.; Lagarde, J.; Xicota, L.; Corne, H.; Chantran, Y.; Chaigneau, T.; Crestani, B.; Bottlaender, M.; Potier, M.C.; Aucouturier, P.; et al. Neutrophil hyperactivation correlates with Alzheimer’s disease progression. Ann. Neurol. 2018, 83, 387–405. [Google Scholar] [CrossRef] [PubMed]
- Sarlus, H.; Heneka, M.T. Microglia in Alzheimer’s disease. J. Clin. Investig. 2017, 127, 3240–3249. [Google Scholar] [CrossRef] [PubMed]
- Heneka, M.T.; Golenbock, D.T.; Latz, E. Innate immunity in Alzheimer’s disease. Nat. Immunol. 2015, 16, 229–236. [Google Scholar] [CrossRef] [PubMed]
- Dansokho, C.; Heneka, M.T. Neuroinflammatory responses in Alzheimer’s disease. J. Neural Transm. 2018, 125, 771–779. [Google Scholar] [CrossRef]
- Stock, A.J.; Kasus-Jacobi, A.; Wren, J.D.; Sjoelund, V.H.; Prestwich, G.D.; Pereira, H.A. The Role of Neutrophil Proteins on the Amyloid Beta-RAGE Axis. PLoS ONE 2016, 11, e0163330. [Google Scholar]
- Kasus-Jacobi, A.; Washburn, J.L.; Land, C.A.; Pereira, H.A. Neutrophil Granule Proteins Inhibit Amyloid Beta Aggregation and Neurotoxicity. Curr. Alzheimer Res. 2021, 18, 414–427. [Google Scholar] [CrossRef]
- Kasus-Jacobi, A.; Land, C.A.; Stock, A.J.; Washburn, J.L.; Pereira, H.A. Antimicrobial Peptides Derived from the Immune Defense Protein CAP37 Inhibit TLR4 Activation by S100A9. Investig. Ophthalmol. Vis. Sci. 2020, 61, 16. [Google Scholar] [CrossRef]
- Clayton, K.A.; Van Enoo, A.A.; Ikezu, T. Alzheimer’s Disease: The Role of Microglia in Brain Homeostasis and Proteopathy. Front. Neurosci. 2017, 11, 680. [Google Scholar] [CrossRef]
- Doens, D.; Fernandez, P.L. Microglia receptors and their implications in the response to amyloid beta for Alzheimer’s disease pathogenesis. J. Neuroinflamm. 2014, 11, 48. [Google Scholar] [CrossRef]
- Venegas, C.; Heneka, M.T. Danger-associated molecular patterns in Alzheimer’s disease. J. Leukoc. Biol. 2017, 101, 87–98. [Google Scholar] [CrossRef]
- Babcock, A.A.; Ilkjær, L.; Clausen, B.H.; Villadsen, B.; Dissing-Olesen, L.; Bendixen, A.T.; Lyck, L.; Lambertsen, K.L.; Finsen, B. Cytokine-producing microglia have an altered beta-amyloid load in aged APP/PS1 Tg mice. Brain Behav. Immun. 2015, 48, 86–101. [Google Scholar] [CrossRef] [PubMed]
- Koenigsknecht, J.; Landreth, G. Microglial phagocytosis of fibrillar beta-amyloid through a beta1 integrin-dependent mechanism. J. Neurosci. Off. J. Soc. Neurosci. 2004, 24, 9838–9846. [Google Scholar] [CrossRef] [PubMed]
- Kamphuis, W.; Kooijman, L.; Schetters, S.; Orre, M.; Hol, E.M. Transcriptional profiling of CD11c-positive microglia accumulating around amyloid plaques in a mouse model for Alzheimer’s disease. Biochim. Biophys. Acta 2016, 1862, 1847–1860. [Google Scholar] [CrossRef] [PubMed]
- Garcia, V.; Perera, Y.R.; Chazin, W.J. A Structural Perspective on Calprotectin as a Ligand of Receptors Mediating Inflammation and Potential Drug Target. Biomolecules 2022, 12, 519. [Google Scholar] [CrossRef]
- Wang, C.; Klechikov, A.G.; Gharibyan, A.; Wärmländer, S.K.T.S.; Jarvet, J.; Zhao, L.; Jia, X.; Shankar, S.K.; Olofsson, A.; Brännström, T.; et al. The role of pro-inflammatory S100A9 in Alzheimer’s disease amyloid-neuroinflammatory cascade. Acta Neuropathol. 2014, 127, 507–522. [Google Scholar] [CrossRef]
- Horvath, I.; Jia, X.; Johansson, P.; Wang, C.; Moskalenko, R.; Steinau, A.; Forsgren, L.; Wågberg, T.; Svensson, J.; Zetterberg, H.; et al. Pro-inflammatory S100A9 Protein as a Robust Biomarker Differentiating Early Stages of Cognitive Impairment in Alzheimer’s Disease. ACS Chem. Neurosci. 2016, 7, 34–39. [Google Scholar] [CrossRef]
- Otazu, G.K.; Dayyani, M.; Badie, B. Role of RAGE and Its Ligands on Inflammatory Responses to Brain Tumors. Front. Cell Neurosci. 2021, 15, 770472. [Google Scholar] [CrossRef]
- Wang, C.; Iashchishyn, I.A.; Pansieri, J.; Nyström, S.; Klementieva, O.; Kara, J.; Horvath, I.; Moskalenko, R.; Rofougaran, R.; Gouras, G.; et al. S100A9-Driven Amyloid-Neuroinflammatory Cascade in Traumatic Brain Injury as a Precursor State for Alzheimer’s Disease. Sci. Rep. 2018, 8, 12836. [Google Scholar] [CrossRef]
- Iashchishyn, I.A.; Gruden, M.A.; Moskalenko, R.A.; Davydova, T.V.; Wang, C.; Sewell, R.D.E.; Morozova-Roche, L.A. Intranasally Administered S100A9 Amyloids Induced Cellular Stress, Amyloid Seeding, and Behavioral Impairment in Aged Mice. ACS Chem. Neurosci. 2018, 9, 1338–1348. [Google Scholar] [CrossRef]
- Calvo-Rodriguez, M.; Garcia-Rodriguez, C.; Villalobos, C.; Nunez, L. Role of Toll Like Receptor 4 in Alzheimer’s Disease. Front. Immunol. 2020, 11, 1588. [Google Scholar] [CrossRef]
- Cristovao, J.S.; Gomes, C.M. S100 Proteins in Alzheimer’s Disease. Front. Neurosci. 2019, 13, 463. [Google Scholar] [CrossRef] [PubMed]
- Balducci, C.; Frasca, A.; Zotti, M.; La Vitola, P.; Mhillaj, E.; Grigoli, E.; Iacobellis, M.; Grandi, F.; Messa, M.; Colombo, L.; et al. Toll-like receptor 4-dependent glial cell activation mediates the impairment in memory establishment induced by beta-amyloid oligomers in an acute mouse model of Alzheimer’s disease. Brain Behav. Immun. 2017, 60, 188–197. [Google Scholar] [CrossRef]
- Kim, H.J.; Chang, K.-A.; Ha, T.-Y.; Kim, J.; Ha, S.; Shin, K.-Y.; Moon, C.; Nacken, W.; Kim, H.-S.; Suh, Y.-H. S100A9 knockout decreases the memory impairment and neuropathology in crossbreed mice of Tg2576 and S100A9 knockout mice model. PLoS ONE 2014, 9, e88924. [Google Scholar] [CrossRef] [PubMed]
- Galasko, D.; Bell, J.; Mancuso, J.Y.; Kupiec, J.W.; Sabbagh, M.N.; Van Dyck, C.; Thomas, R.G.; Aisen, P.S. Clinical trial of an inhibitor of RAGE-Abeta interactions in Alzheimer disease. Neurology 2014, 82, 1536–1542. [Google Scholar] [CrossRef]
- Asher, S.; Priefer, R. Alzheimer’s disease failed clinical trials. Life Sci. 2022, 306, 120861. [Google Scholar] [CrossRef]
- Sampietro, A.; Perez-Areales, F.J.; Martinez, P.; Arce, E.M.; Galdeano, C.; Munoz-Torrero, D. Unveiling the Multitarget Anti-Alzheimer Drug Discovery Landscape: A Bibliometric Analysis. Pharmaceuticals 2022, 15, 545. [Google Scholar] [CrossRef] [PubMed]
- Thakur, S.; Dhapola, R.; Sarma, P.; Medhi, B.; Reddy, D.H. Neuroinflammation in Alzheimer’s Disease: Current Progress in Molecular Signaling and Therapeutics. Inflammation 2022, 1–17. [Google Scholar] [CrossRef]


| Peptide Candidate | Inhib. Neurotox. | Rev. Neurotox. | Bind RAGE | Bind S100A9 | Bind TLR4 | Points | Inhib. TLR4 Activation | Final Points |
|---|---|---|---|---|---|---|---|---|
| CAP37 QH/WR | + | ++ | ++++ | ++++ | +++ | 14 | ++ | 16 |
| CG | - | - | - | - | - | 0 | - | 0 |
| CG D/R | ++ | ++ | ++ | - | + | 7 | ND | ND |
| CG D/R ΔRV | +++ | ++ | - | - | - | 5 | ND | ND |
| CG D/R E/R | +++ | ++ | ++++ | +++ | ++++ | 16 | +++ | 19 |
| CG D/R E/R ΔRV | +++ | ++ | ++++ | - | ++ | 11 | ND | ND |
| CG D/R E/PR | +++ | ++ | ++++ | ++ | +++ | 14 | +++ | 17 |
| CG D/R E/PR ΔRV | +++ | + | +++ | - | ++ | 9 | ND | ND |
Publisher’s Note: MDPI stays neutral with regard to jurisdictional claims in published maps and institutional affiliations. |
© 2022 by the authors. Licensee MDPI, Basel, Switzerland. This article is an open access article distributed under the terms and conditions of the Creative Commons Attribution (CC BY) license (https://creativecommons.org/licenses/by/4.0/).
Share and Cite
Kasus-Jacobi, A.; Washburn, J.L.; Laurence, R.B.; Pereira, H.A. Selecting Multitarget Peptides for Alzheimer’s Disease. Biomolecules 2022, 12, 1386. https://doi.org/10.3390/biom12101386
Kasus-Jacobi A, Washburn JL, Laurence RB, Pereira HA. Selecting Multitarget Peptides for Alzheimer’s Disease. Biomolecules. 2022; 12(10):1386. https://doi.org/10.3390/biom12101386
Chicago/Turabian StyleKasus-Jacobi, Anne, Jennifer L. Washburn, Riley B. Laurence, and H. Anne Pereira. 2022. "Selecting Multitarget Peptides for Alzheimer’s Disease" Biomolecules 12, no. 10: 1386. https://doi.org/10.3390/biom12101386
APA StyleKasus-Jacobi, A., Washburn, J. L., Laurence, R. B., & Pereira, H. A. (2022). Selecting Multitarget Peptides for Alzheimer’s Disease. Biomolecules, 12(10), 1386. https://doi.org/10.3390/biom12101386