
The Sphingolipid Asset Is Altered in the Nigrostriatal System of Mice Models of Parkinson’s Disease

 ,
,  ,
, 

Abstract
:
1. Introduction
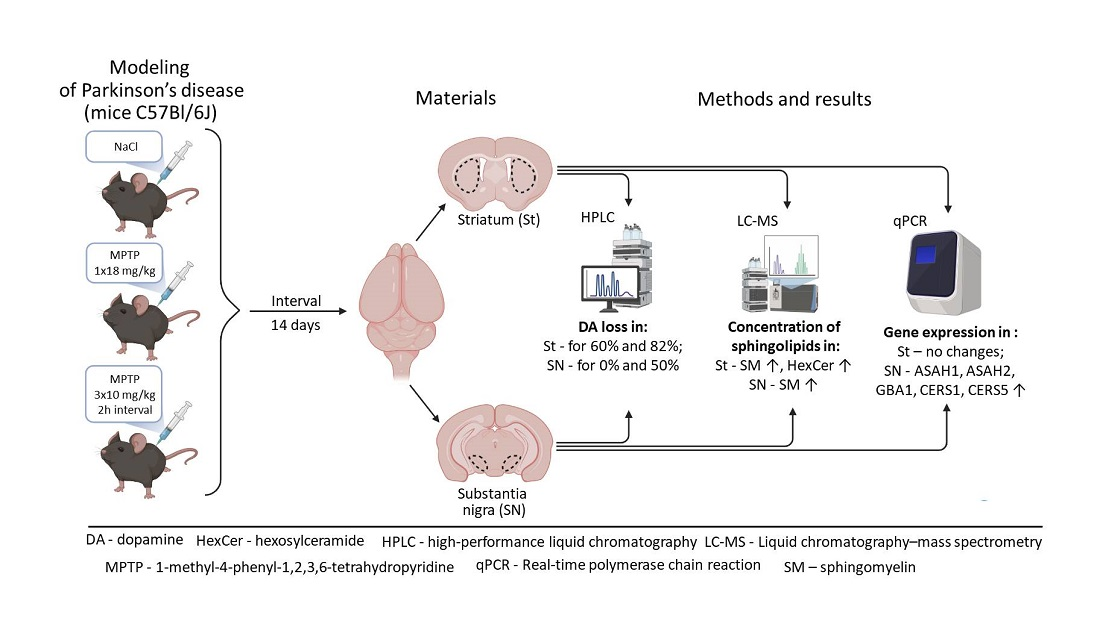
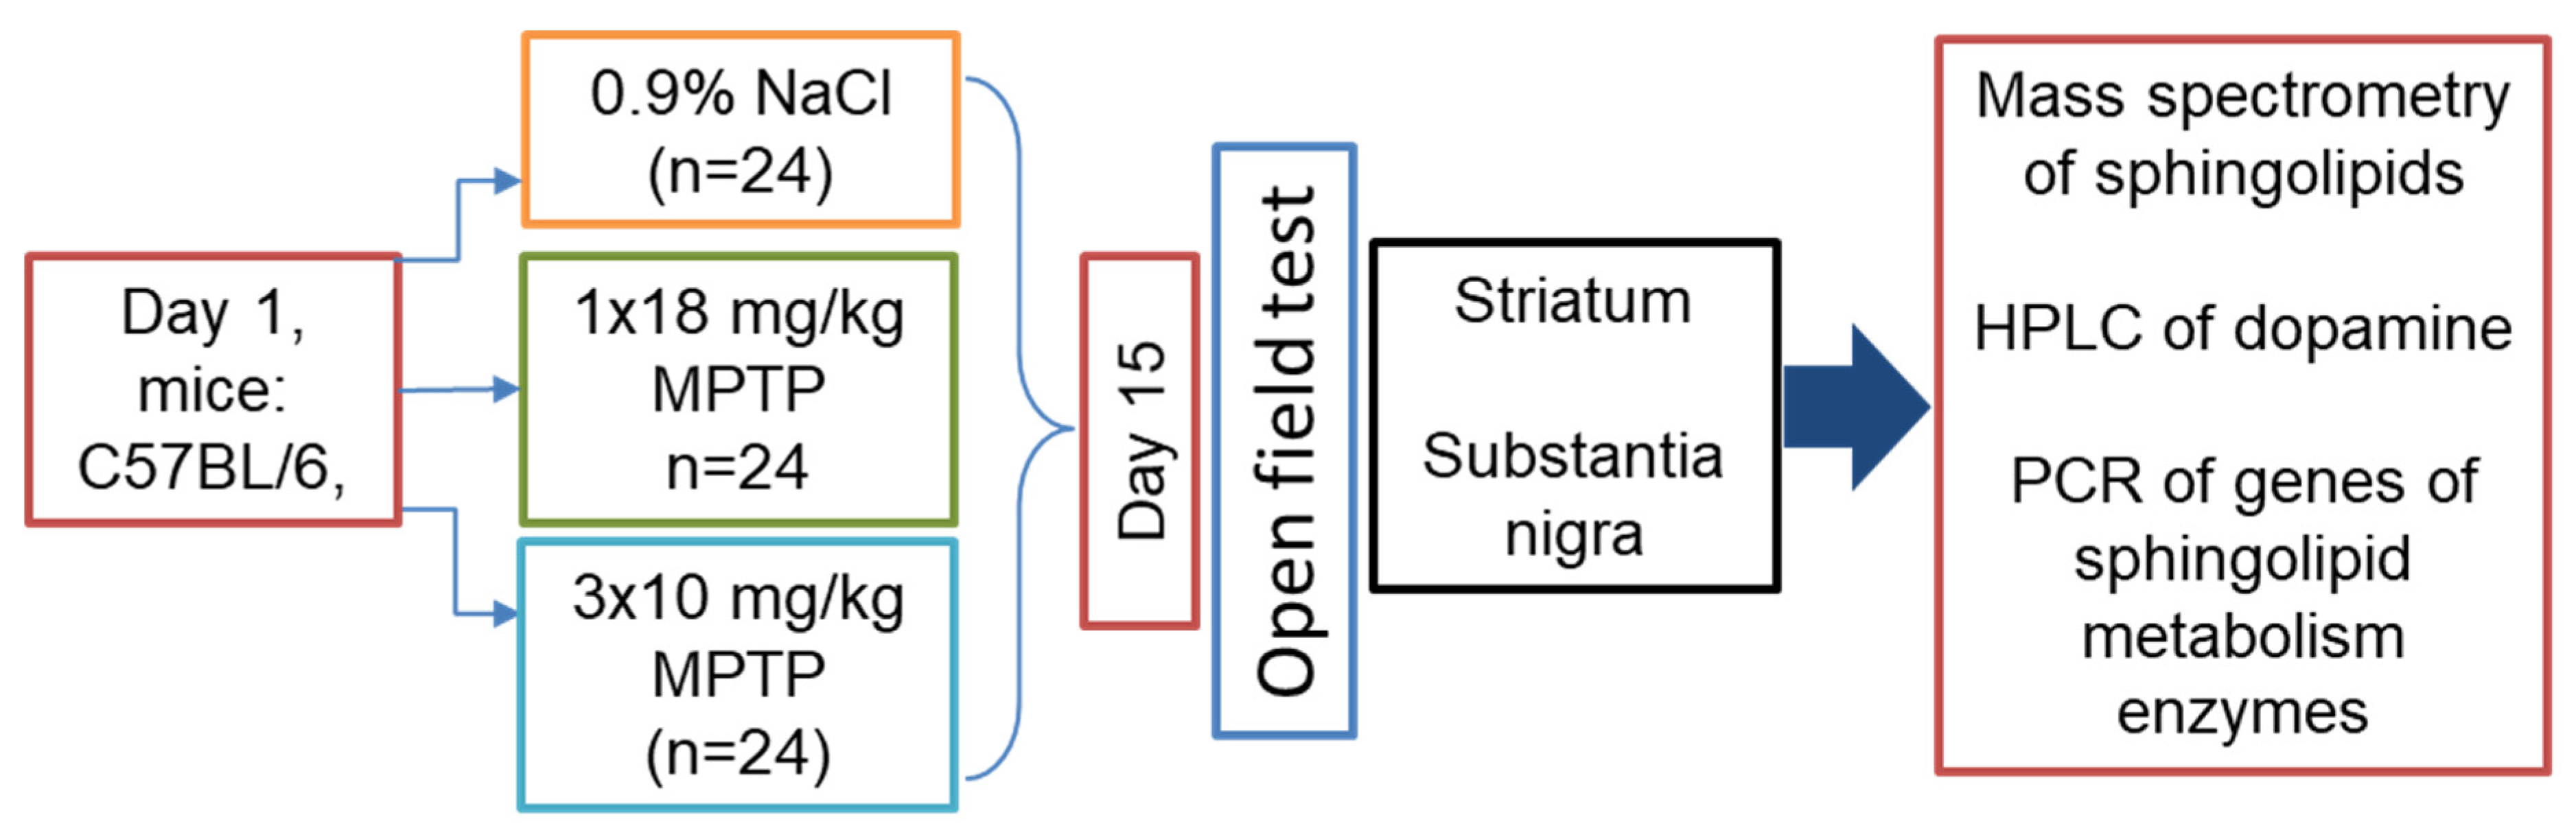
2. Materials and Methods
2.1. Animals and Experiments
2.2. Methods
2.2.1. High-Performance Liquid Chromatography with Electrochemical Detection
2.2.2. Real-Time PCR
2.2.3. Mass Spectrometry of Sphingolipids
2.2.4. Statistical Analysis
3. Results
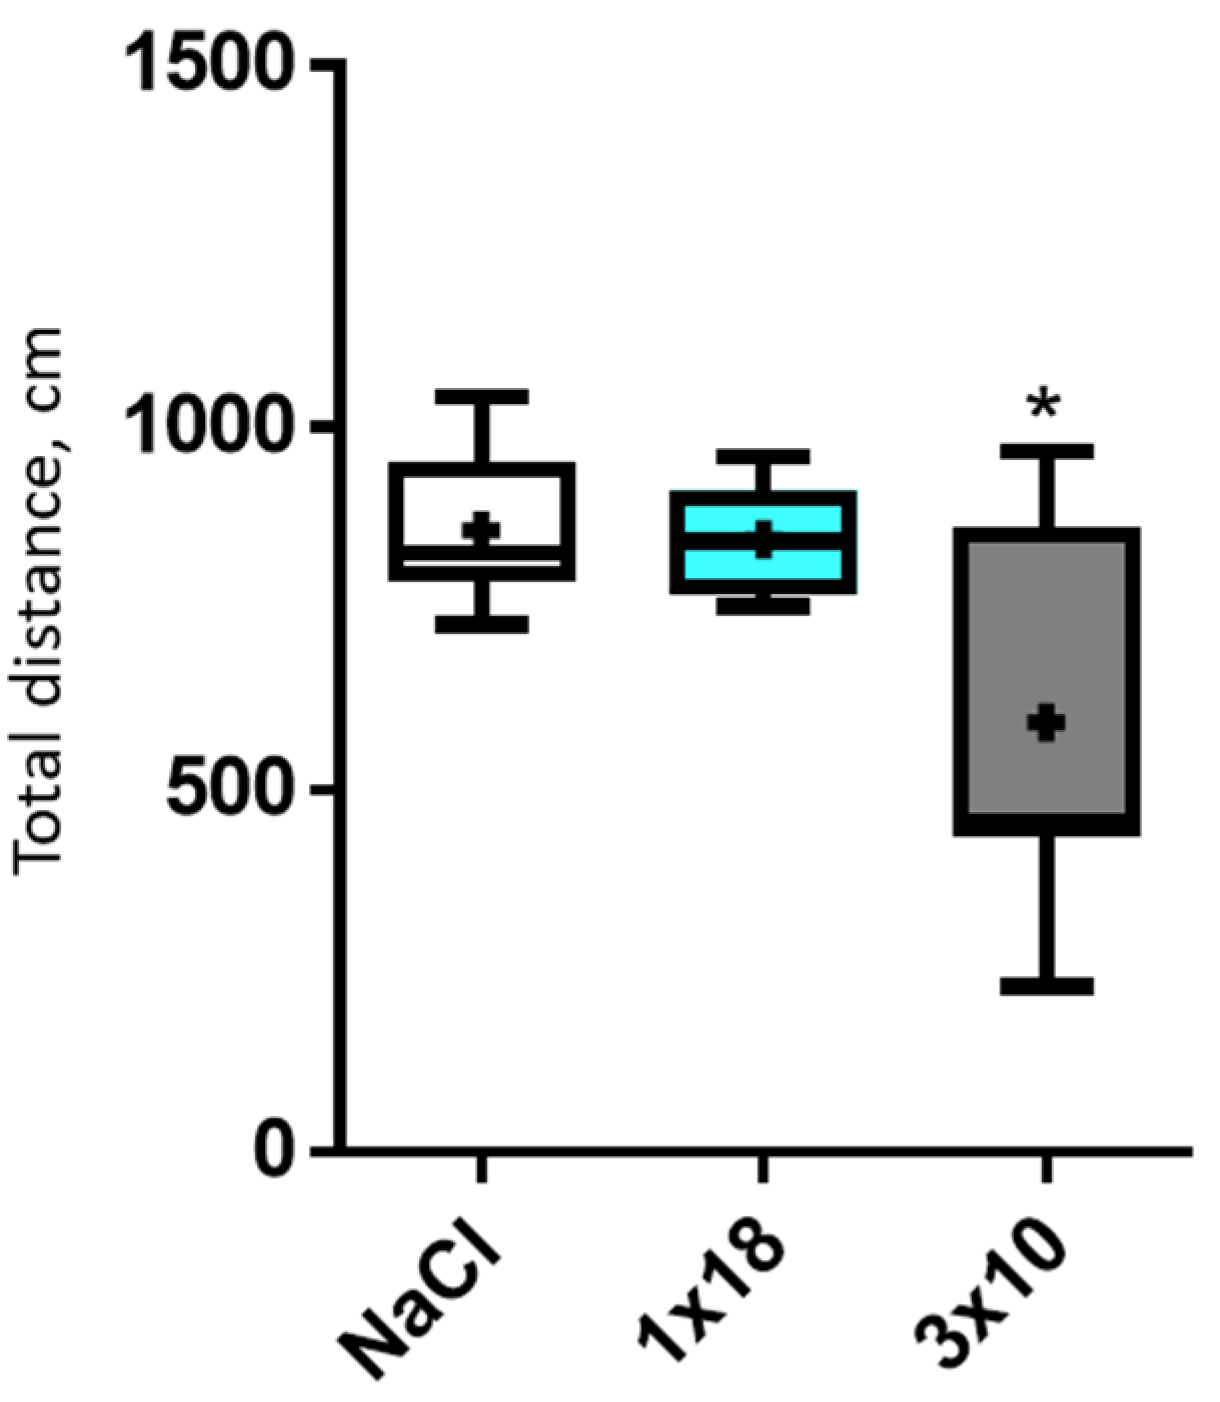
3.1. Motor Behavior
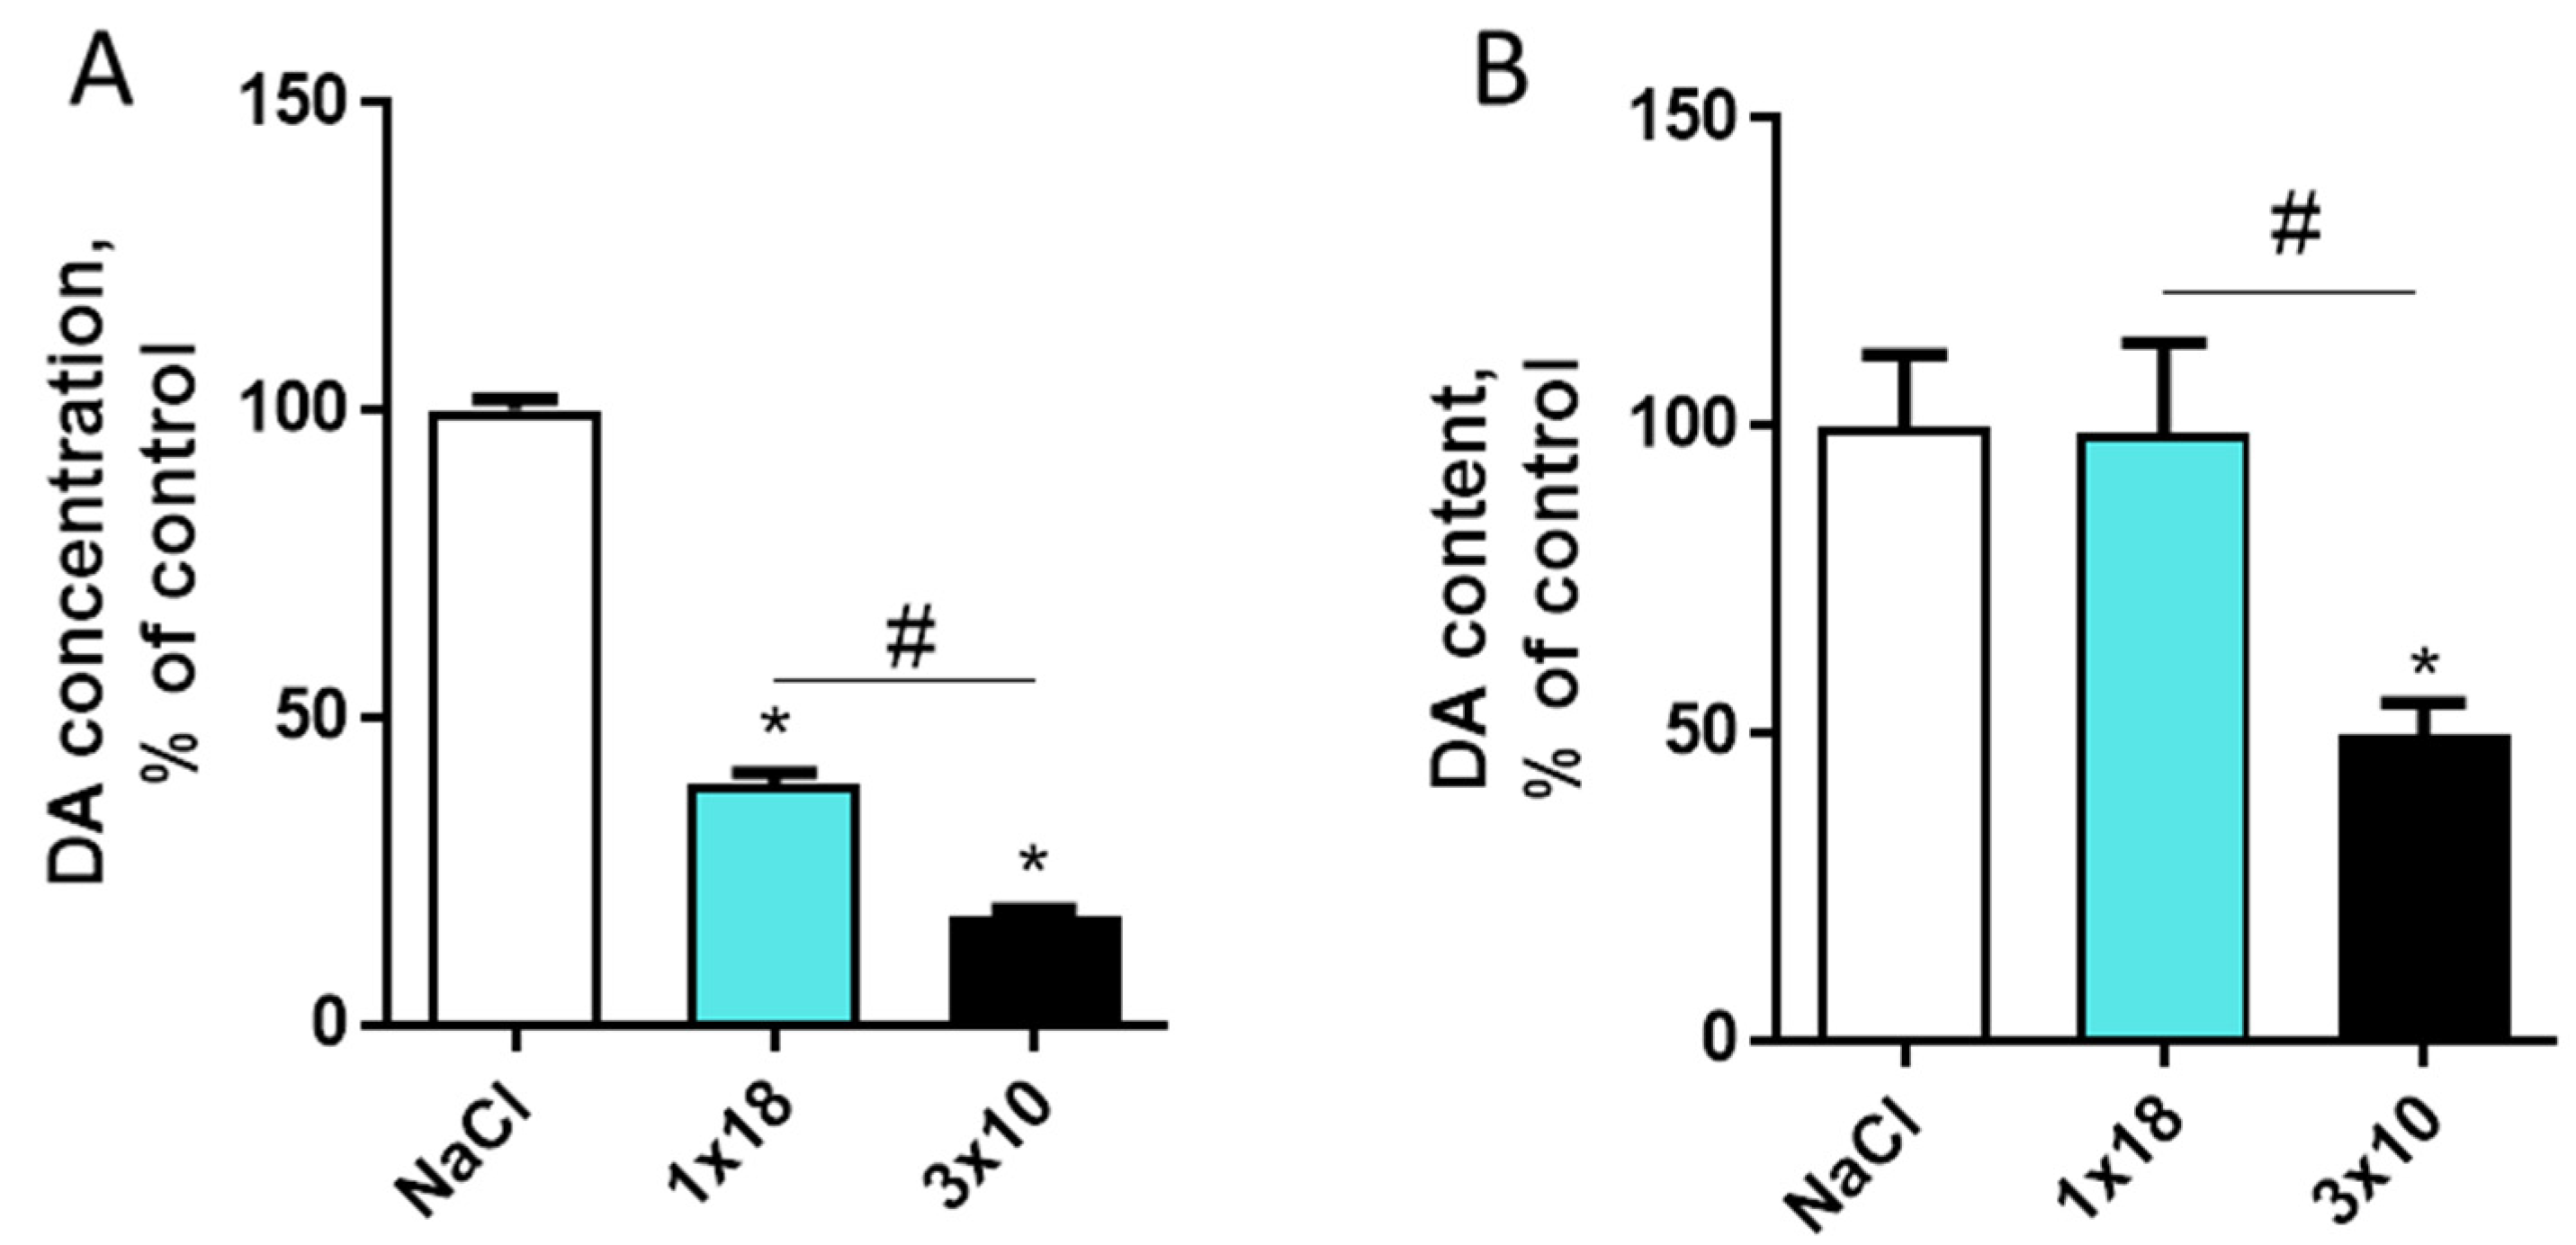
3.2. Dopamine Content in the Striatum and Substantia Nigra in Mice after MPTP Administration
3.3. Concentration of Sphingolipids in the Nigrostriatal System in the Brain in Mice after MPTP Administration
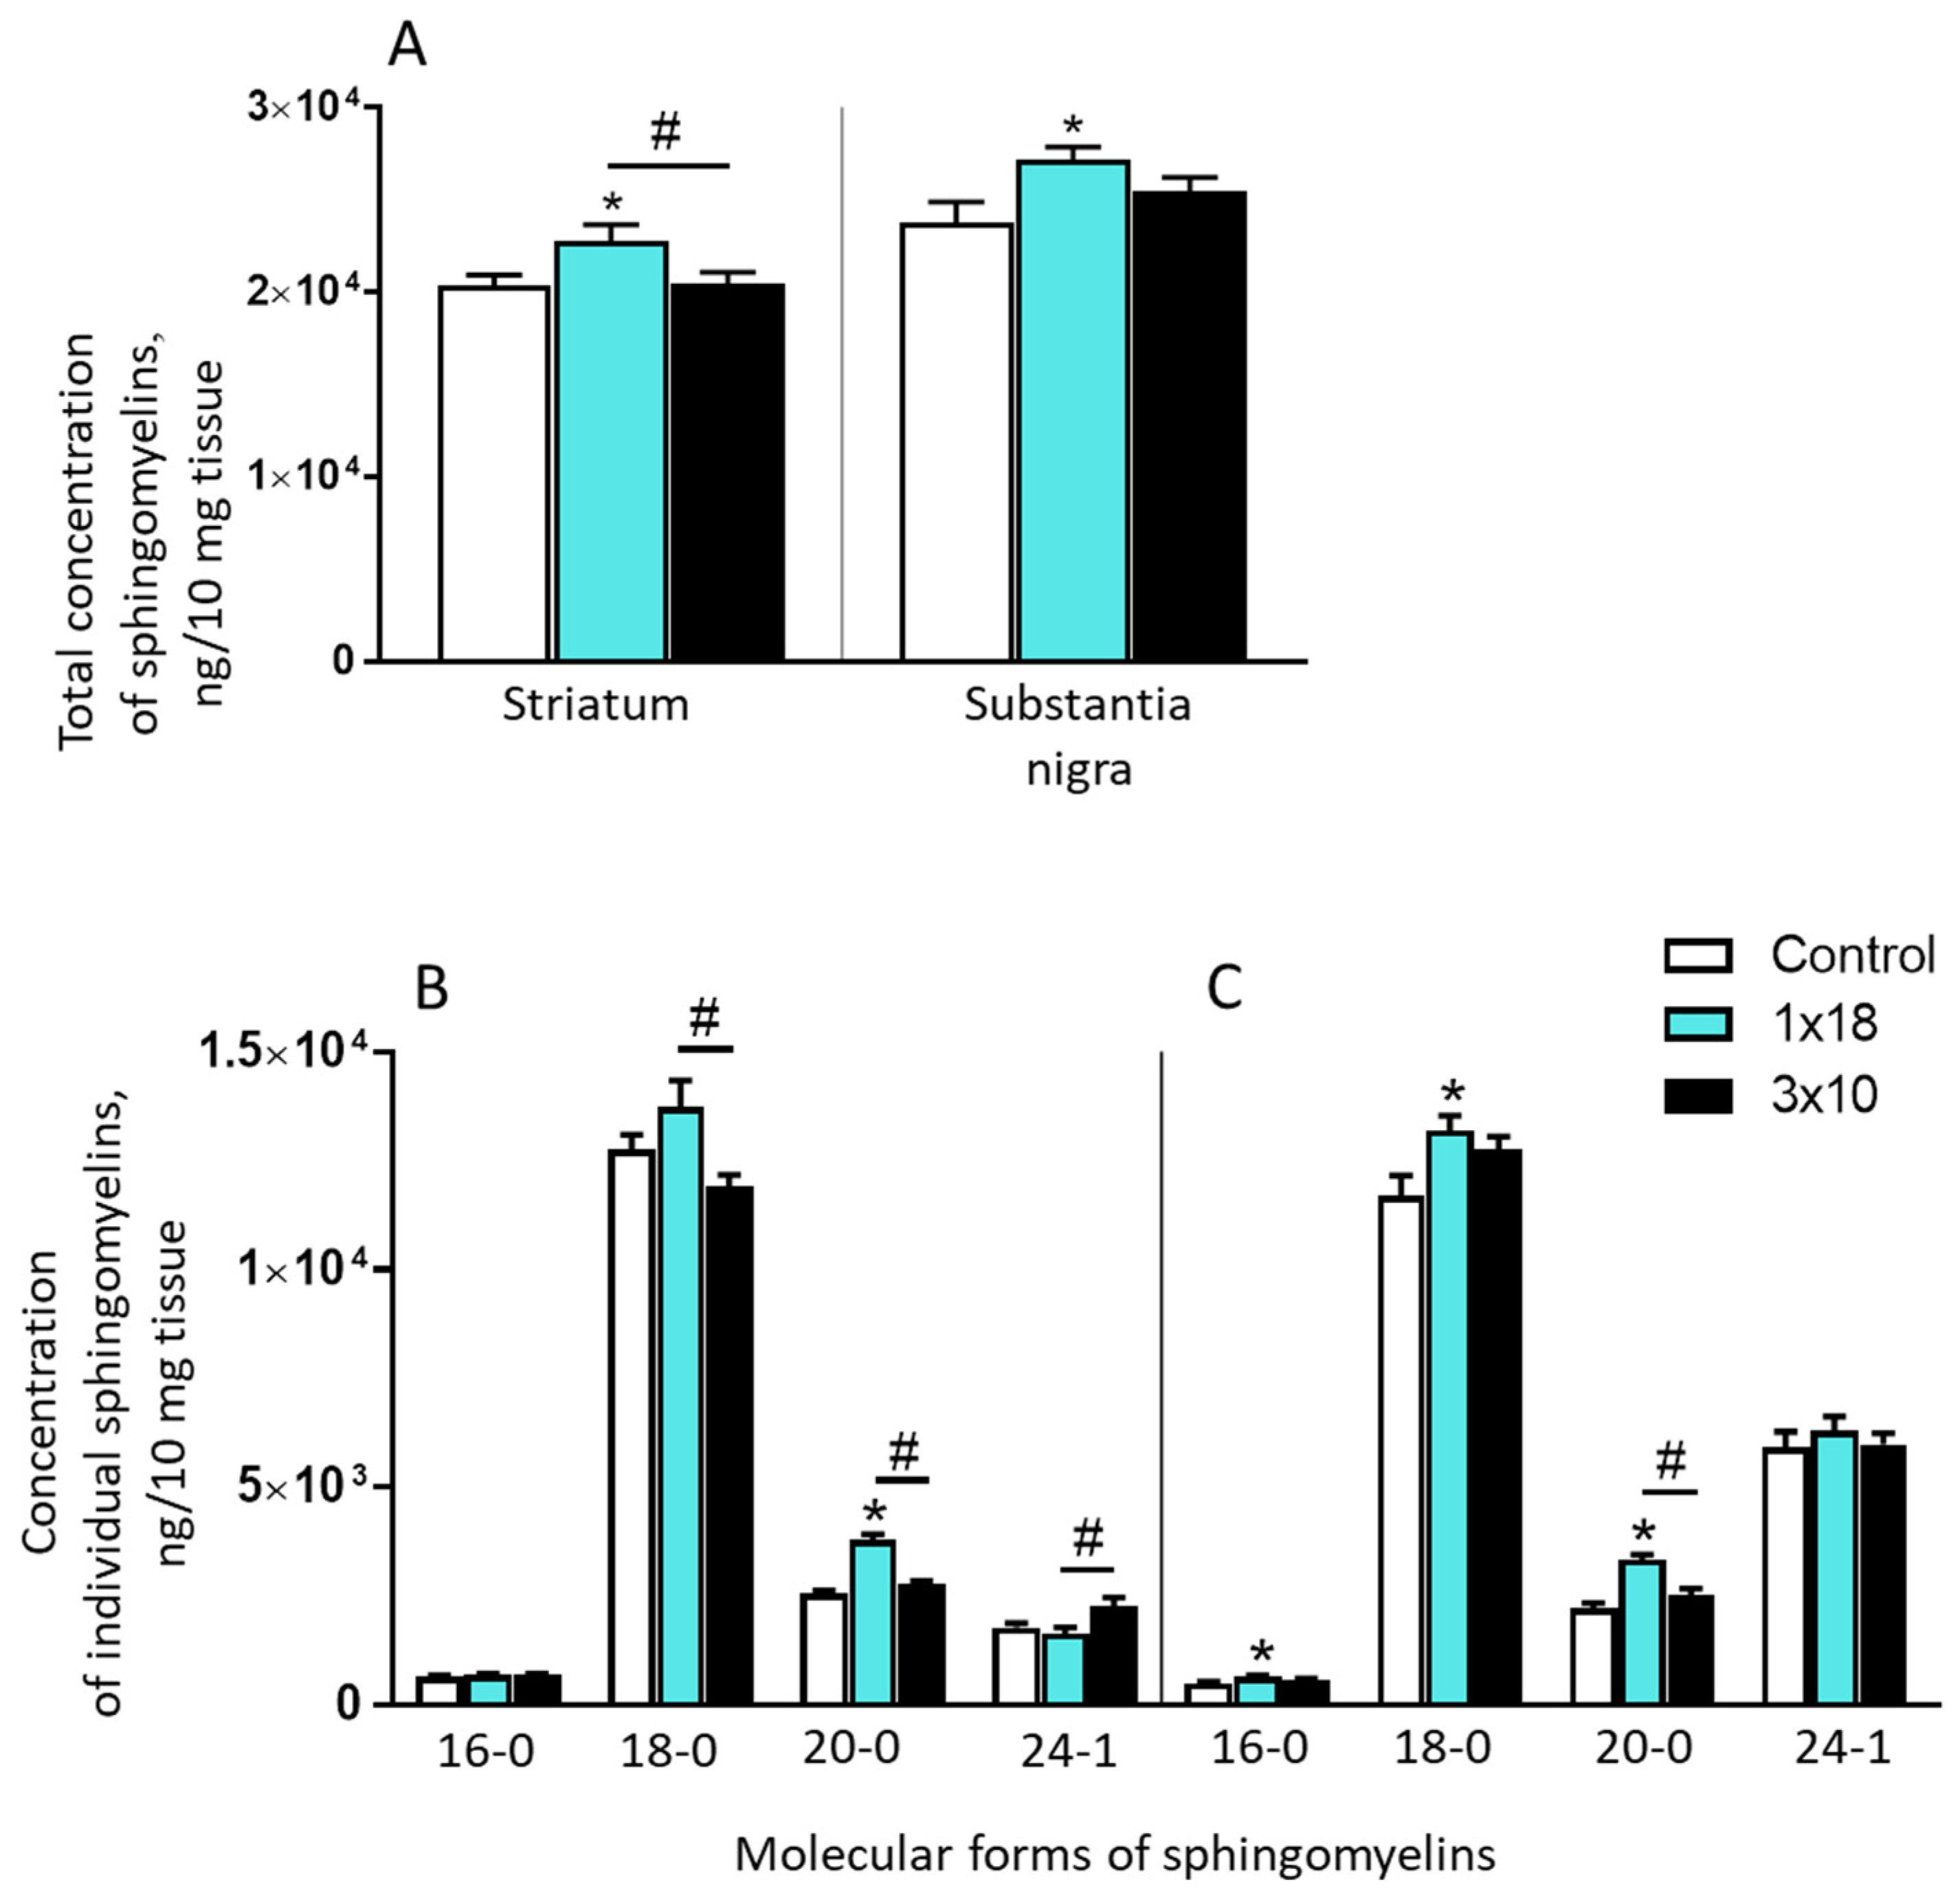
3.3.1. Concentrations of Sphingomyelins in the Striatum and Substantia Nigra in Mice Two Weeks after MPTP Administration
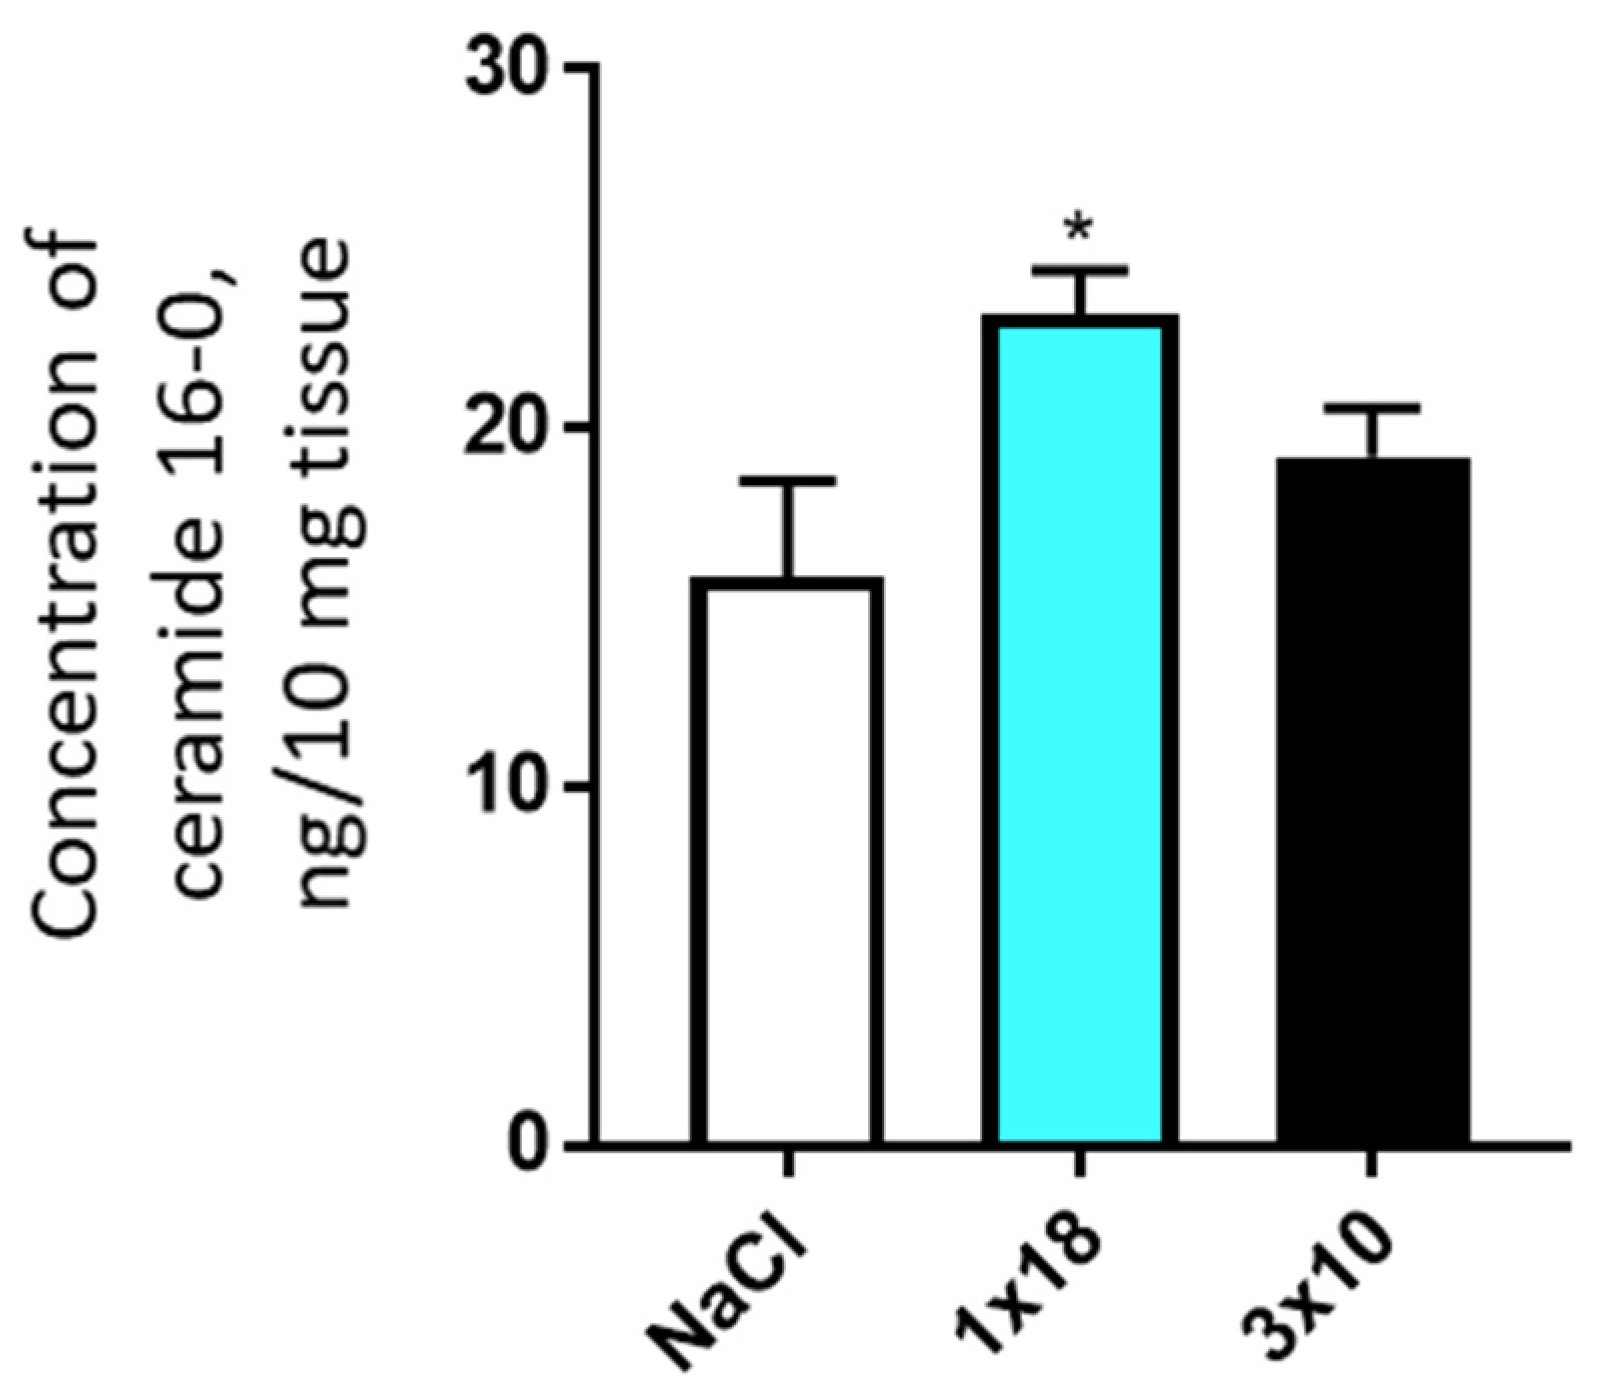
3.3.2. Concentration of Ceramides in the Striatum and Substantia Nigra in Mice after MPTP Administration
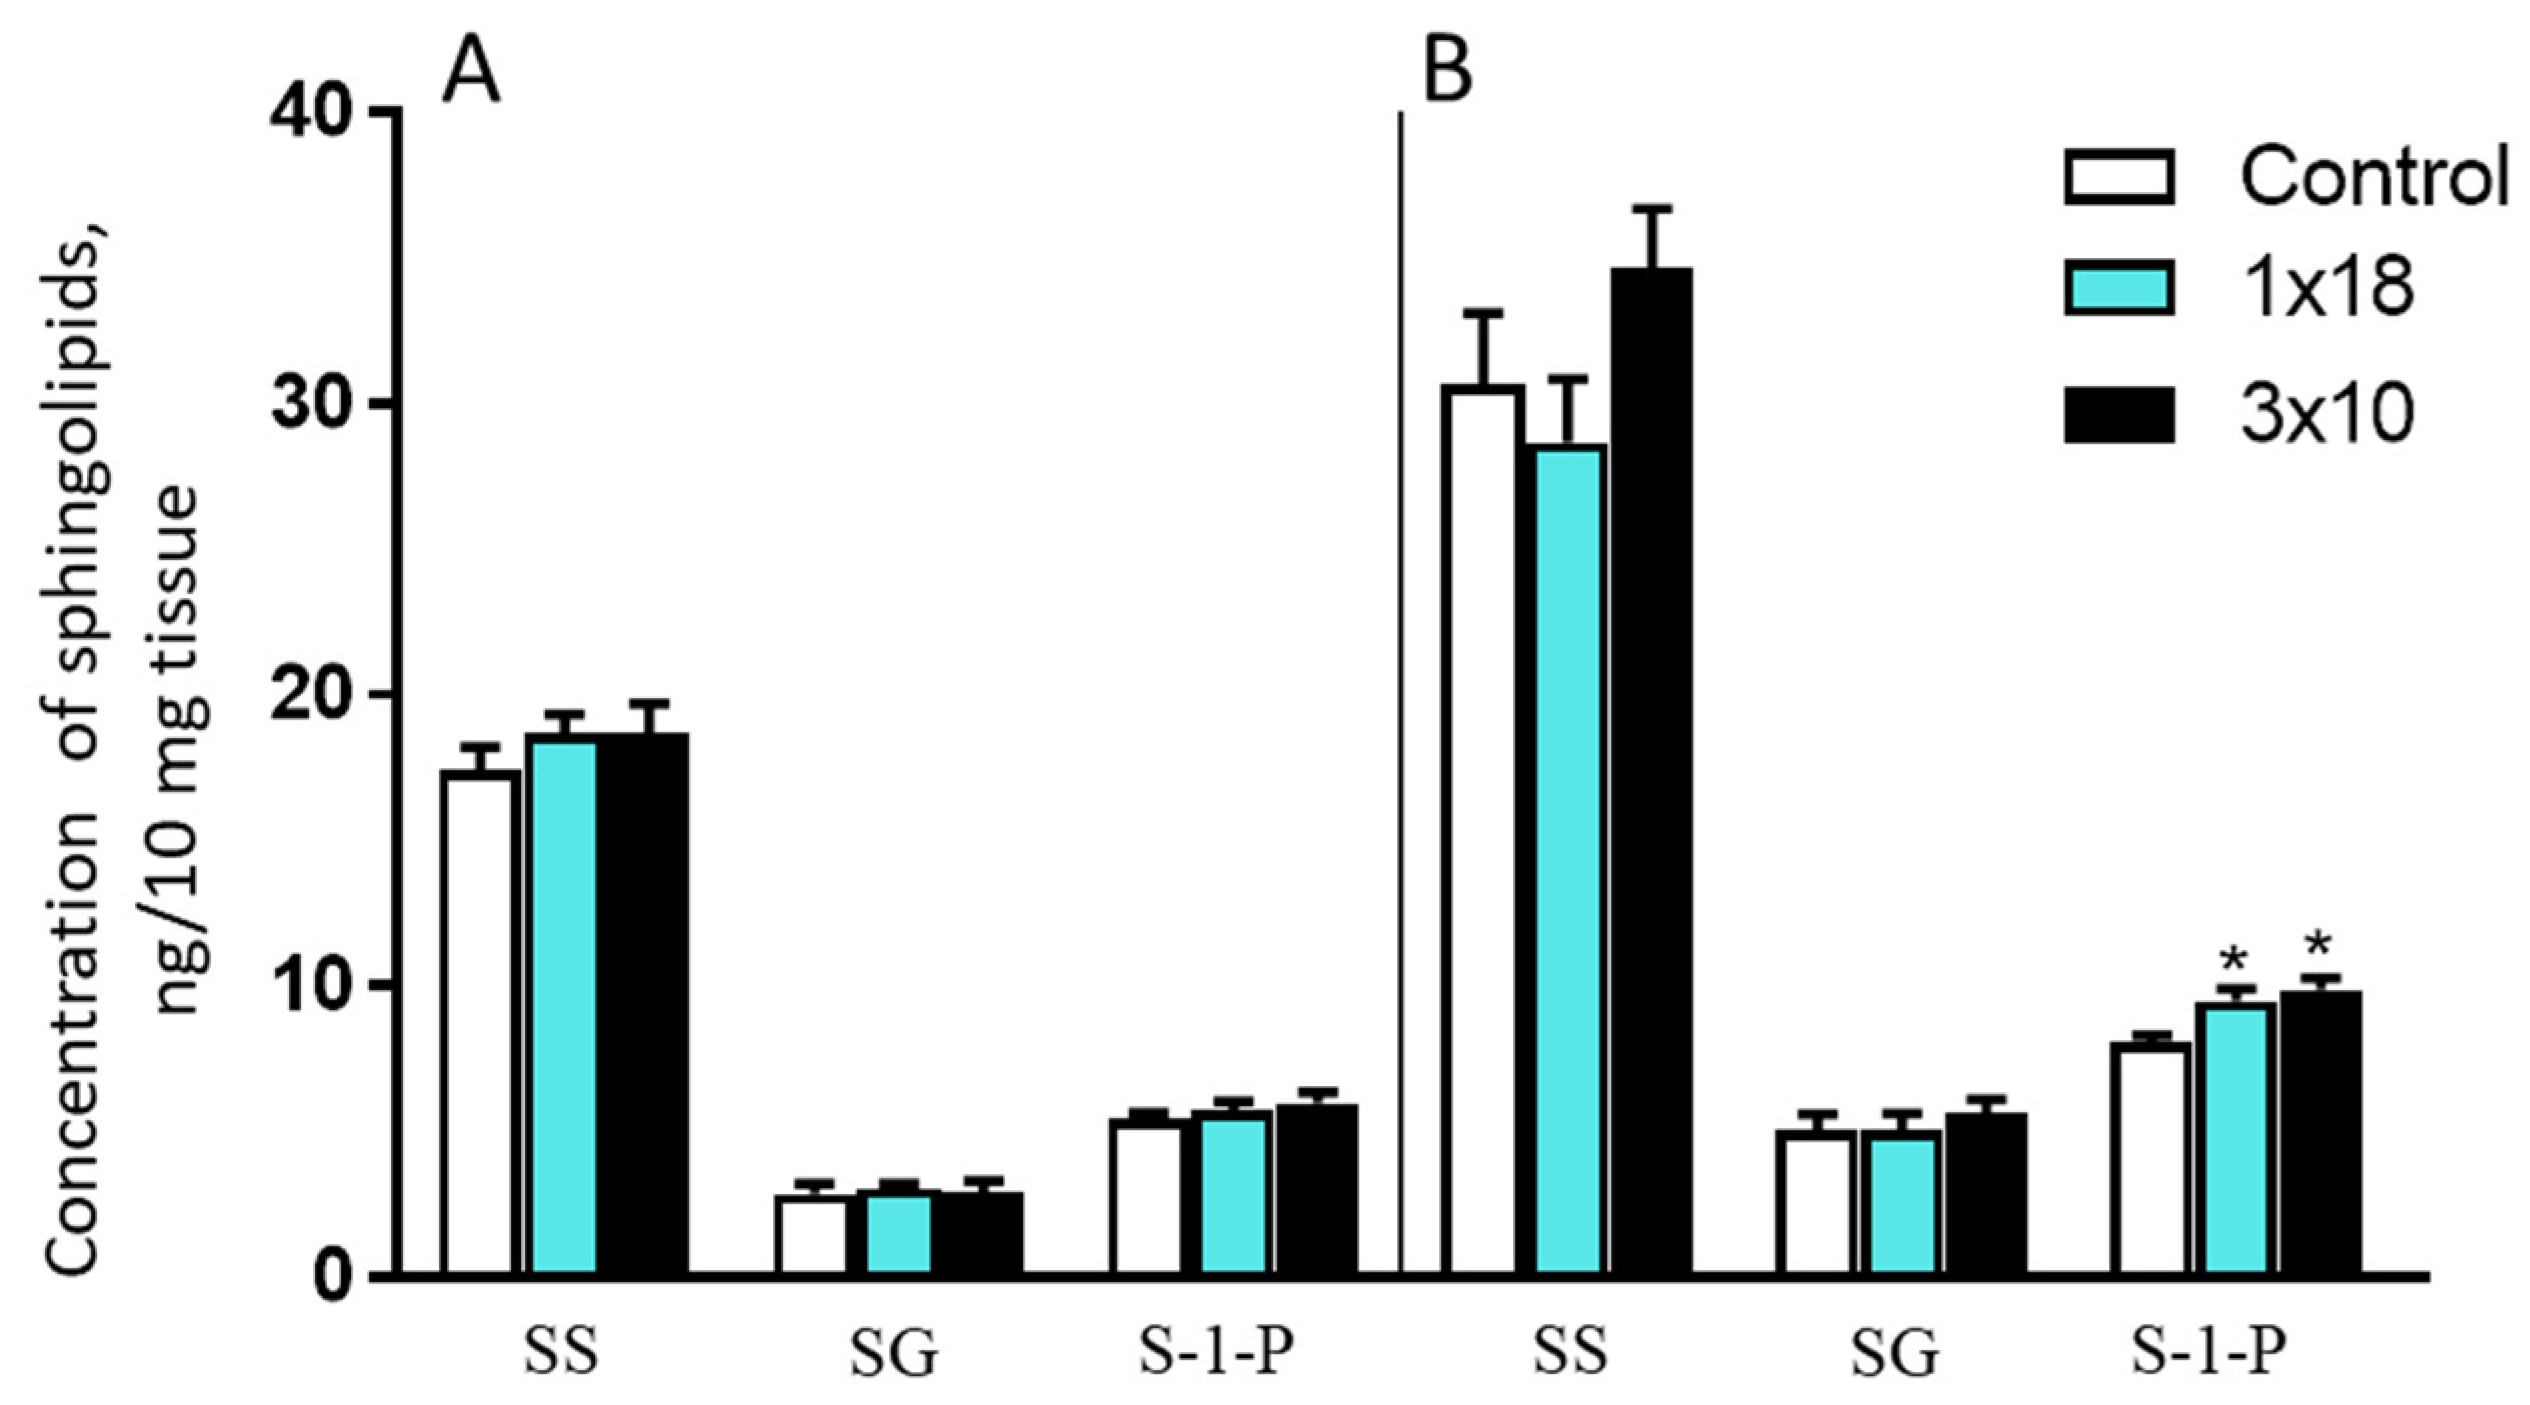
3.3.3. Concentrations of Sphingosine, Sphinganine, and Sphingosine-1-Phosphate in the Striatum and Substantia Nigra in Mice after MPTP Administration
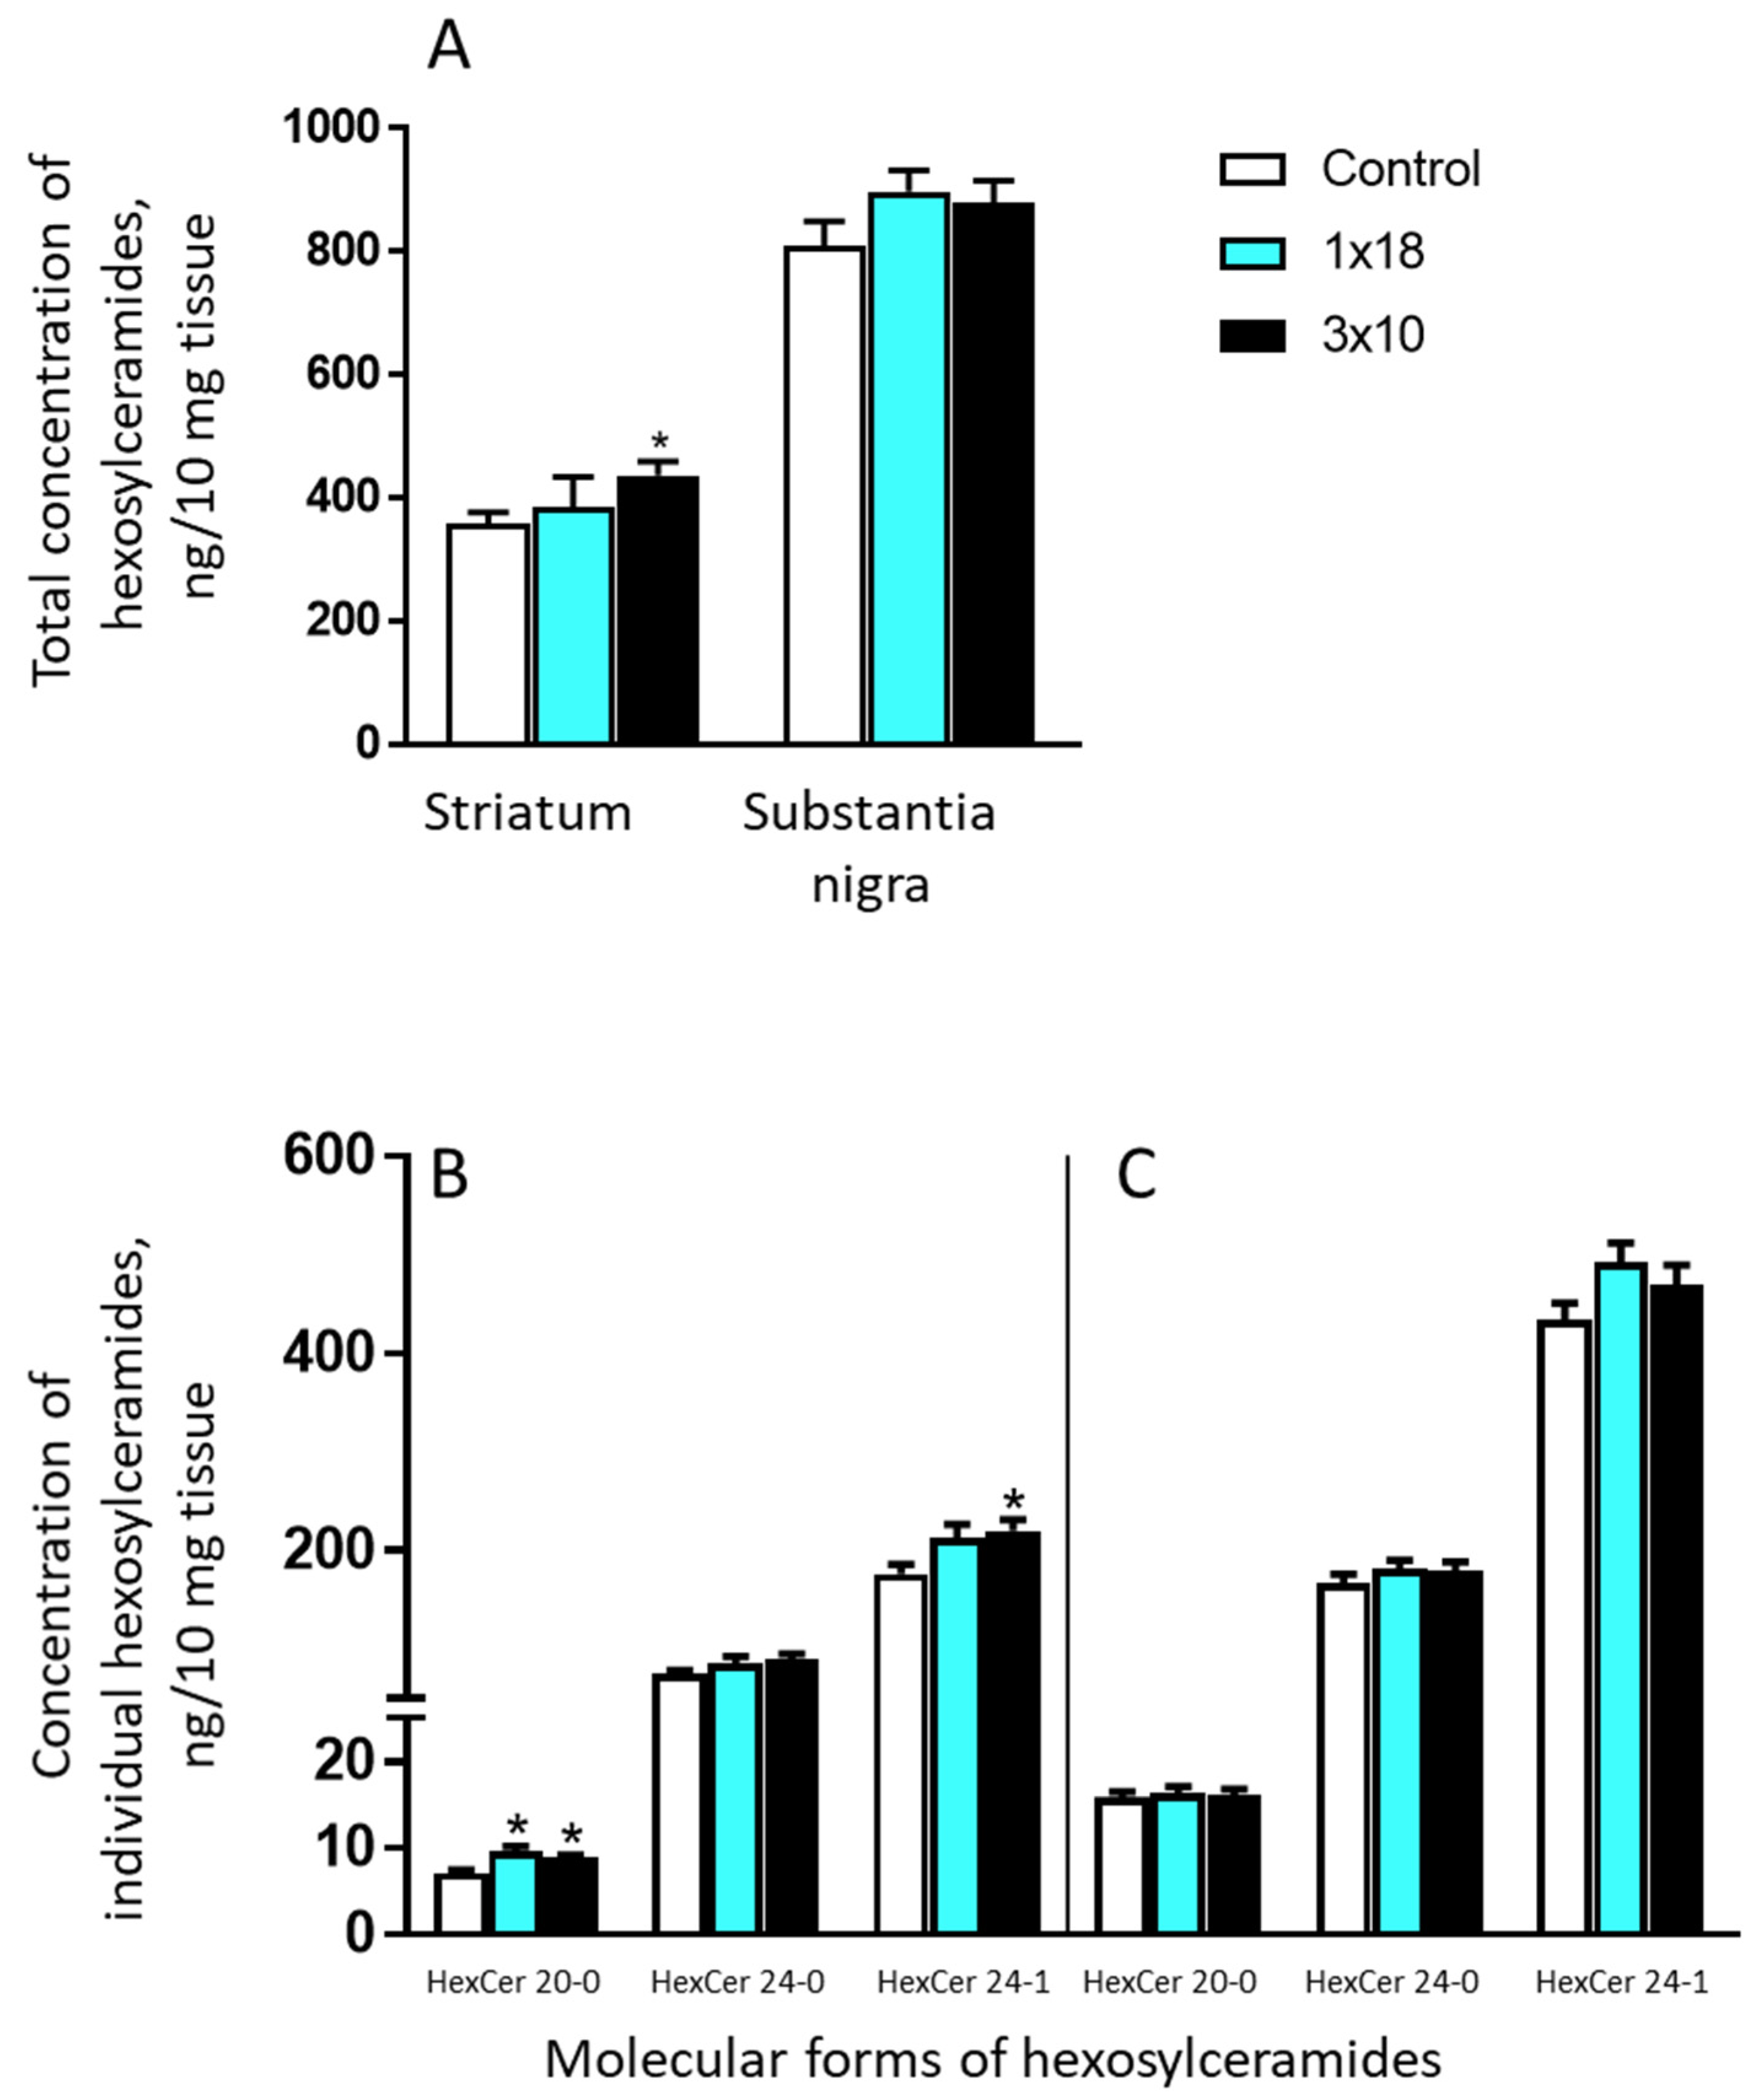
3.3.4. Concentrations of Hexosylceramides in the Striatum and in the Substantia Nigra in Mice after MPTP Administration
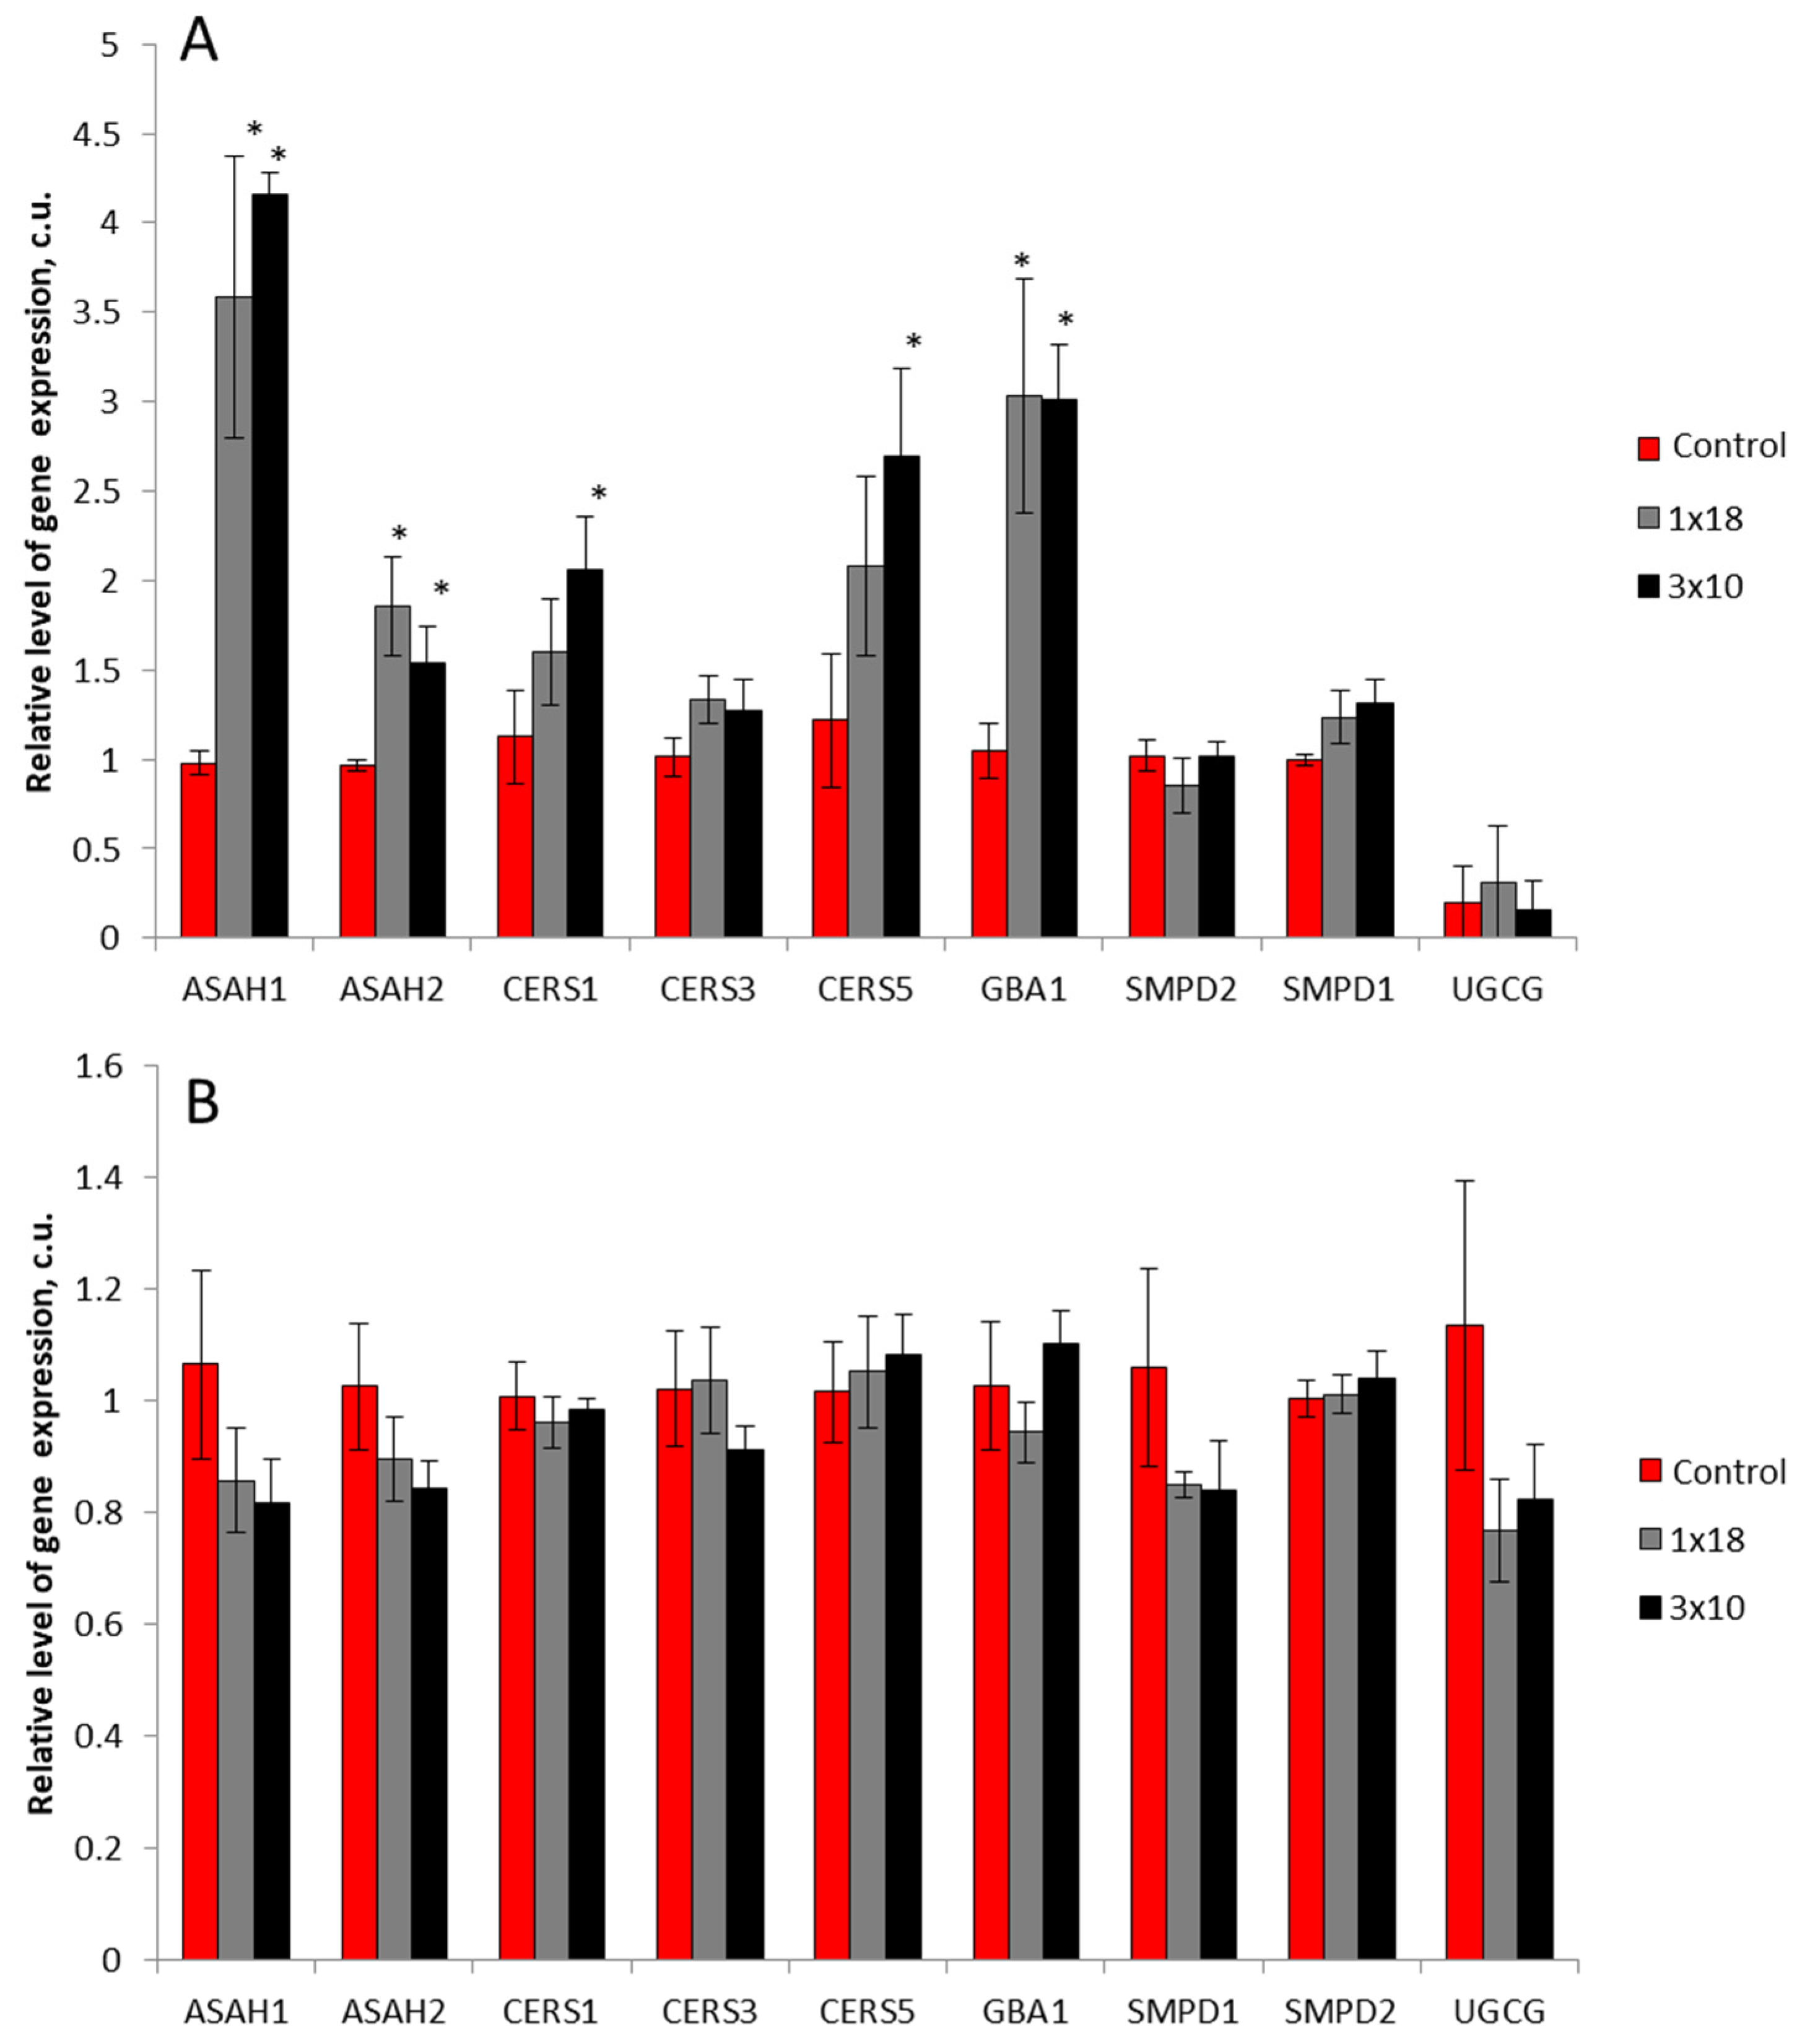
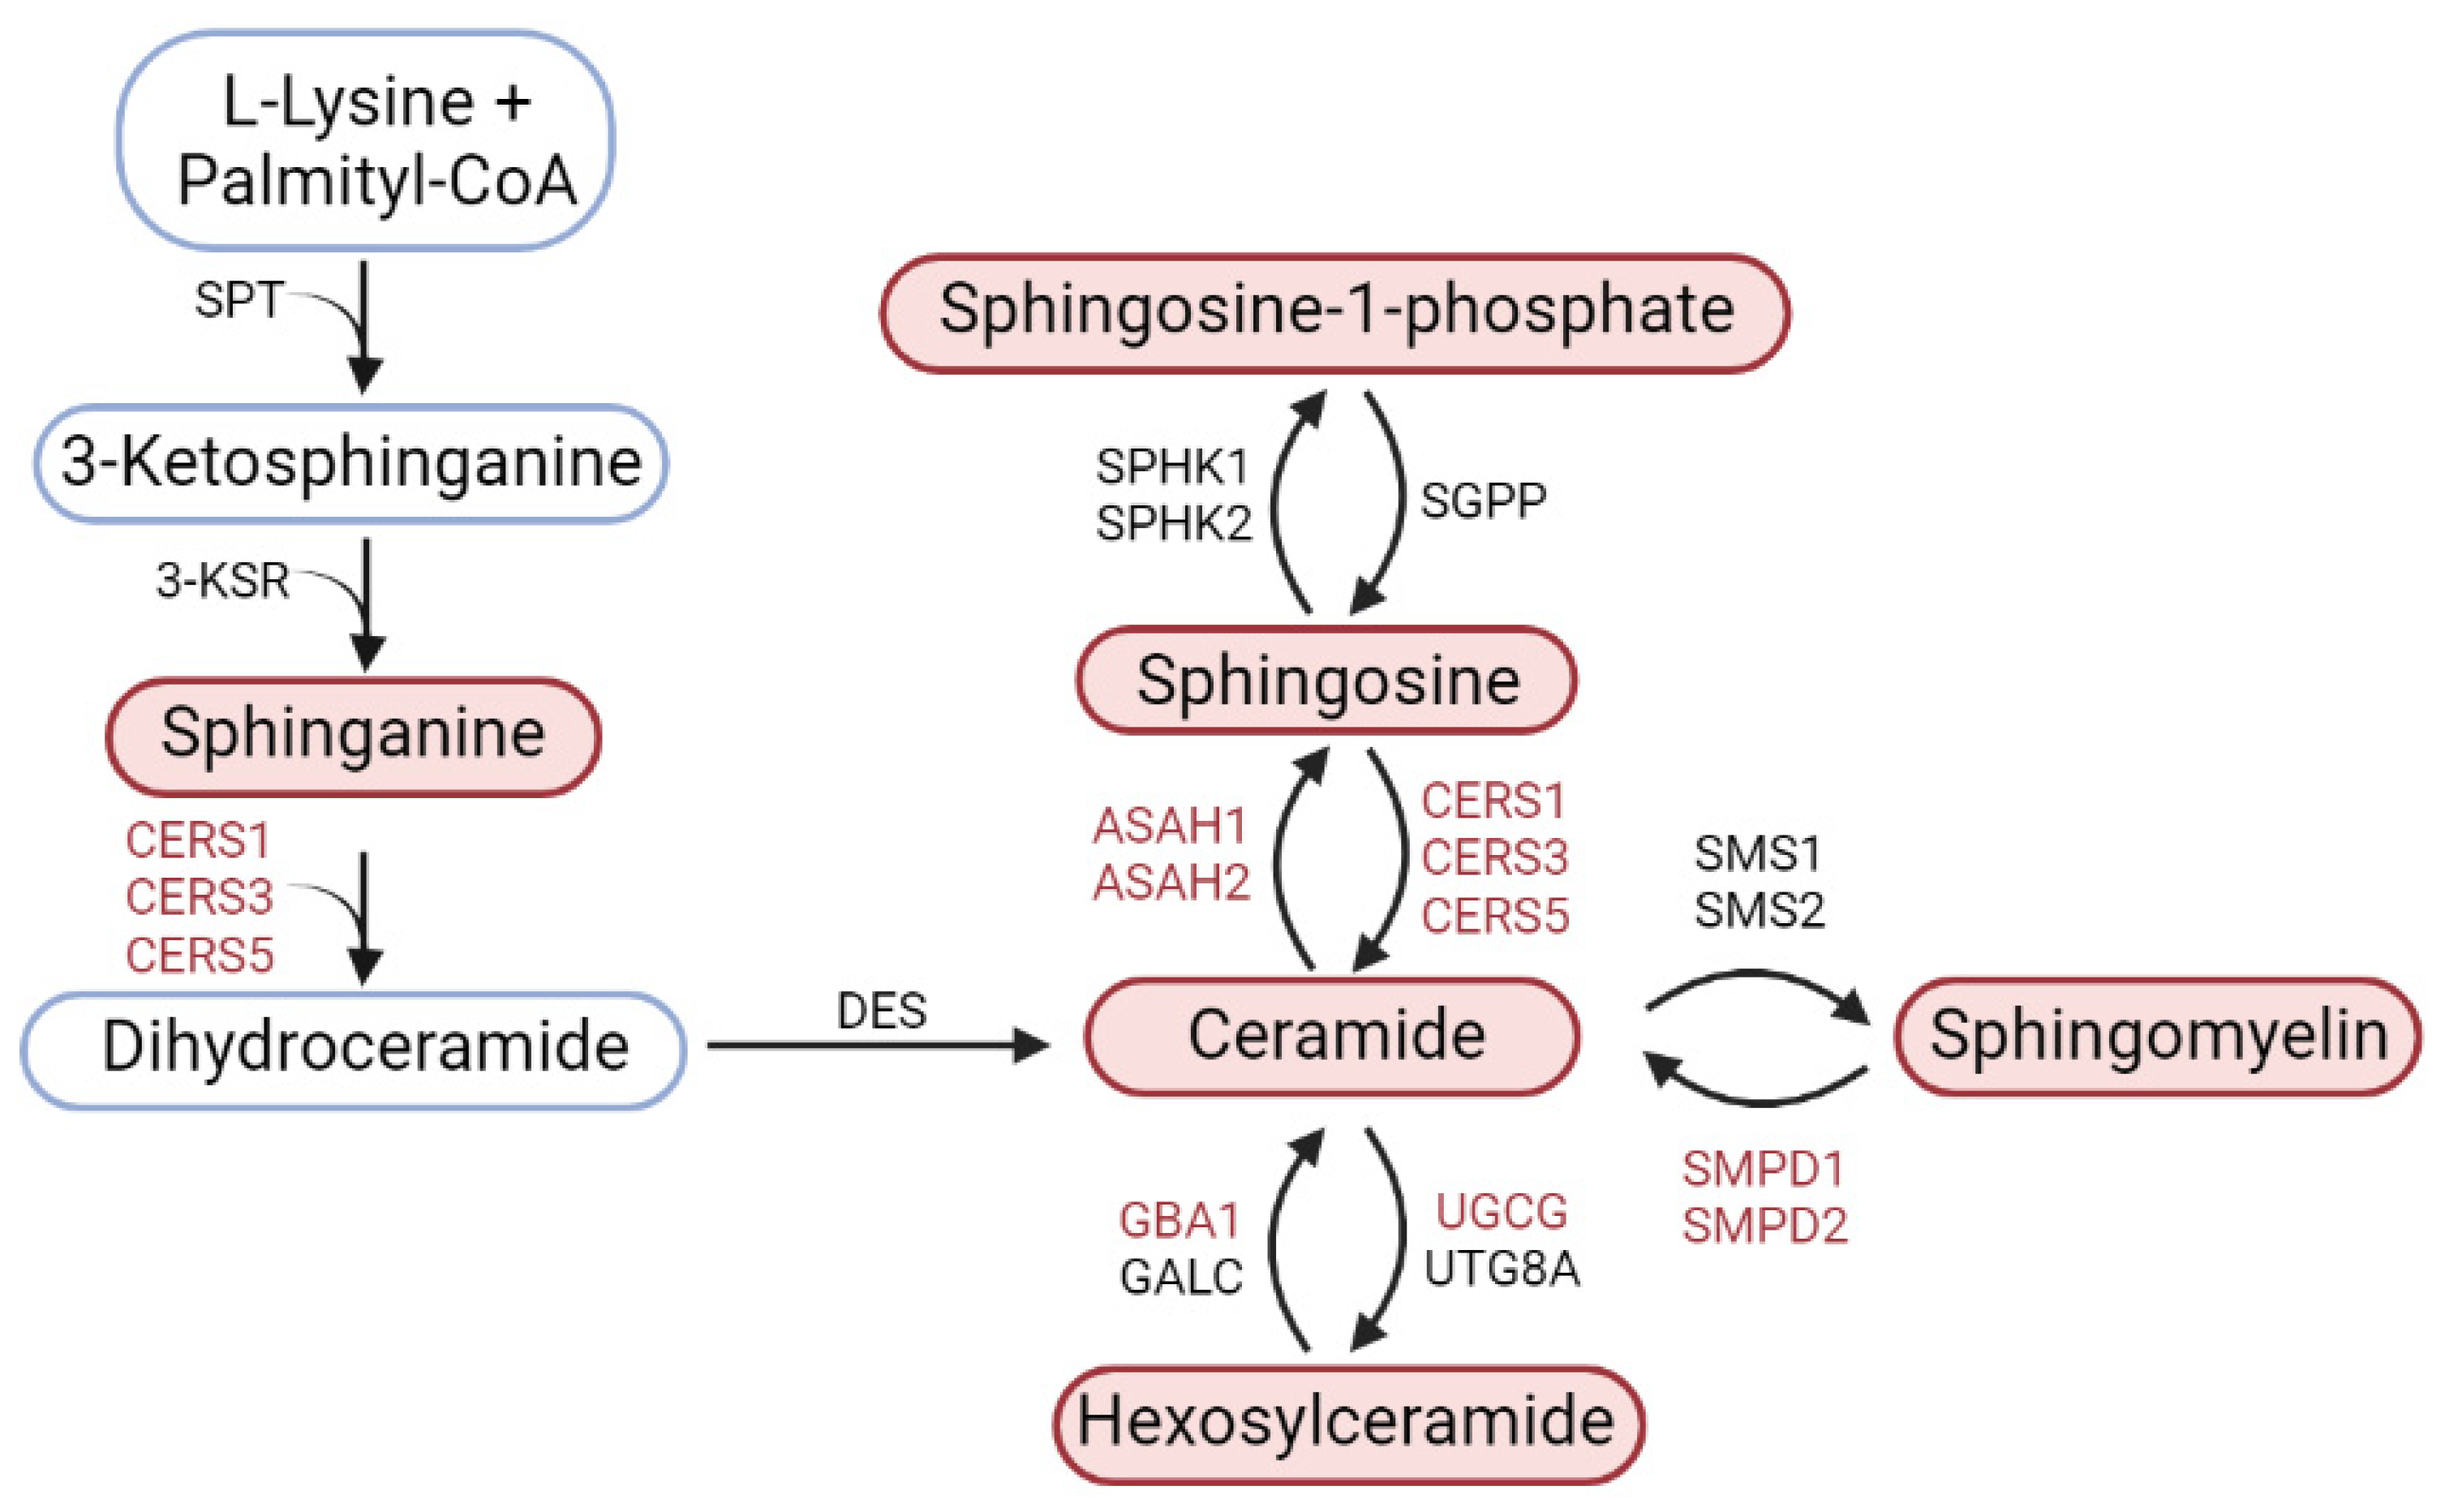
3.4. Expression of Genes of Sphingolipid Metabolism Enzymes in the Striatum and in the Substantia Nigra in Mice after MPTP Administration
4. Discussion
4.1. Modeling Parkinson’s Disease
4.2. The Content of Sphingolipids in the Striatum and Substantia Nigra in Models of Parkinson’s Disease and Assessment of Their Possible Role in the Pathogenesis
4.3. Expression of Genes of Key Sphingolipid Metabolism Enzymes in Models of Parkinson’s Disease
5. Conclusions
Supplementary Materials
Author Contributions
Funding
Institutional Review Board Statement
Informed Consent Statement
Data Availability Statement
Acknowledgments
Conflicts of Interest
Abbreviations
| PD | Parkinson’s disease |
| SN | substantia nigra |
| MPTP | 1-methyl-4-phenyl-1,2,3,6-tetrahydropyridine |
| UGCG | ceramide glucosyltransferase |
| CERS1 | ceramide synthase 1 |
| CERS3 | ceramide synthase 3 |
| CERS5 | ceramide synthase 5 |
| ASAH1 | acid ceramidase |
| ASAH2 | neutral ceramidase |
| GBA1 | glucocerebrosidase |
| SMPD1 | sphingomyelin phosphodiesterase 1 (acid sphingomyelinase) |
| SMPD2 | sphingomyelin phosphodiesterase 2 (neutral sphingomyelinase) |
References
- Savitt, J.M.; Dawson, V.L.; Dawson, T.M. Diagnosis and treatment of Parkinson disease: Molecules to medicine. J. Clin. Investig. 2006, 116, 1744–1754. [Google Scholar] [CrossRef] [Green Version]
- Armstrong, M.J.; Okun, M.S. Diagnosis and Treatment of Parkinson Disease: A Review. JAMA-J. Am. Med. Assoc. 2020, 323, 548–560. [Google Scholar] [CrossRef]
- Ugrumov, M. Development of early diagnosis of Parkinson’s disease: Illusion or reality? CNS Neurosci. Ther. 2020, 26, 997–1009. [Google Scholar] [CrossRef]
- Cheng, H.-C.; Ulane, C.M.; Burke, R.E. Clinical Progression in Parkinson’s Disease and the Neurobiology of Axons. Ann. Neurol. 2010, 67, 715–725. [Google Scholar] [CrossRef] [PubMed]
- Grosch, J.; Winkler, J.; Kohl, Z. Early Degeneration of Both Dopaminergic and Serotonergic Axons—A Common Mechanism in Parkinson’s Disease. Front. Cell. Neurosci. 2016, 10, 293. [Google Scholar] [CrossRef] [PubMed] [Green Version]
- Hustad, E.; Aasly, J.O. Clinical and Imaging Markers of Prodromal Parkinson’s Disease. Front. Neurol. 2020, 11, 395. [Google Scholar] [CrossRef]
- Stefanis, L. α-Synuclein in Parkinson’s Disease. Cold Spring Harb. Perspect. Med. 2012, 2, a009399. [Google Scholar] [CrossRef] [PubMed] [Green Version]
- Wang, Q.; Liu, Y.; Zhou, J. Neuroinflammation in Parkinson’s disease and its potential as therapeutic target. Transl. Neurodegener. 2015, 4, 1–9. [Google Scholar] [CrossRef] [Green Version]
- Lin, G.; Wang, L.; Marcogliese, P.C.; Bellen, H.J. Sphingolipids in the Pathogenesis of Parkinson’s Disease and Parkin-sonism. Trends Endocrinol. Metab. 2019, 30, 106–117. [Google Scholar] [CrossRef] [PubMed]
- Xicoy, H.; Wieringa, B.; Martens, G.J.M. The Role of Lipids in Parkinson’s Disease. Cells 2019, 8, 27. [Google Scholar] [CrossRef] [Green Version]
- Gegg, M.E.; Schapira, A.H.V. The role of glucocerebrosidase in Parkinson disease pathogenesis. FEBS J. 2018, 285, 3591–3603. [Google Scholar] [CrossRef] [Green Version]
- Gomez-Muñoz, A.; Presa, N.; Gomez-Larrauri, A.; Rivera, I.-G.; Trueba, M.; Ordoñez, M. Control of inflammatory responses by ceramide, sphingosine 1-phosphate and ceramide 1-phosphate. Prog. Lipid Res. 2016, 61, 51–62. [Google Scholar] [CrossRef]
- Albeituni, S.; Stiban, J. Roles of Ceramides and Other Sphingolipids in Immune Cell Function and Inflammation. Adv. Exp. Med. Biol. 2019, 1161, 169–191. [Google Scholar] [CrossRef]
- Gomez-Larrauri, A.; Presa, N.; Dominguez-Herrera, A.; Ouro, A.; Trueba, M.; Gomez-Muñoz, A. Role of bioactive sphingolipids in physiology and pathology. Essays Biochem. 2020, 64, 579–589. [Google Scholar] [CrossRef] [PubMed]
- Gangoiti, P.; Camacho, L.; Arana, L.; Ouro, A.; Granado, M.H.; Brizuela, L.; Casas, J.; Fabriás, G.; Abad, J.L.; Delgado, A.; et al. Control of metabolism and signaling of simple bioactive sphingolipids: Implications in disease. Prog. Lipid Res. 2010, 49, 316–334. [Google Scholar] [CrossRef] [PubMed]
- Galvagnion, C. The Role of Lipids Interacting with α-Synuclein in the Pathogenesis of Parkinson’s Disease. J. Park. Dis. 2017, 7, 433–450. [Google Scholar] [CrossRef] [Green Version]
- Rocha, E.M.; Smith, G.A.; Park, E.; Cao, H.; Brown, E.; Hallett, P.; Isacson, O. Progressive decline of glucocerebrosidase in aging and P arkinson’s disease. Ann. Clin. Transl. Neurol. 2015, 2, 433–438. [Google Scholar] [CrossRef]
- Alessenko, A.V.; Albi, E. Exploring Sphingolipid Implications in Neurodegeneration. Front. Neurol. 2020, 11, 437. [Google Scholar] [CrossRef] [PubMed]
- Hannun, Y.A.; Obeid, L.M. Principles of bioactive lipid signalling: Lessons from sphingolipids. Nat. Rev. Mol. Cell Biol. 2008, 9, 139–150. [Google Scholar] [CrossRef]
- Pchelina, S.; Baydakova, G.; Nikolaev, M.; Senkevich, K.; Emelyanov, A.; Kopytova, A.; Miliukhina, I.; Yakimovskii, A.; Timofeeva, A.; Berkovich, O.; et al. Blood lysosphingolipids accumulation in patients with parkinson’s disease with glucocerebrosidase 1 mutations. Mov. Disord. 2018, 33, 1325–1330. [Google Scholar] [CrossRef]
- Stoessel, D.; Schulte, C.; Dos Santos, M.C.T.; Scheller, D.; Rebollo-Mesa, I.; Deuschle, C.; Walther, D.; Schauer, N.; Berg, D.; Da Costa, A.N.; et al. Promising Metabolite Profiles in the Plasma and CSF of Early Clinical Parkinson’s Disease. Front. Aging Neurosci. 2018, 10, 51. [Google Scholar] [CrossRef] [PubMed]
- Custodia, A.; Aramburu-Núñez, M.; Correa-Paz, C.; Posado-Fernández, A.; Gómez-Larrauri, A.; Castillo, J.; Gómez-Muñoz, A.; Sobrino, T.; Ouro, A. Ceramide Metabolism and Parkinson’s Disease—Therapeutic Targets. Biomolecules 2021, 11, 945. [Google Scholar] [CrossRef] [PubMed]
- Mielke, M.M.; Maetzler, W.; Haughey, N.J.; Bandaru, V.V.R.; Savica, R.; Deuschle, C.; Gasser, T.; Hauser, A.-K.; Gräber-Sultan, S.; Schleicher, E.; et al. Plasma Ceramide and Glucosylceramide Metabolism Is Altered in Sporadic Parkinson’s Disease and Associated with Cognitive Impairment: A Pilot Study. PLoS ONE 2013, 8, e73094. [Google Scholar] [CrossRef] [PubMed] [Green Version]
- Franklin, K.; Paxinos, G. The Mouse Brain in Stereotaxic Coordinates, Compact, 3rd ed.; Academic Press: Cambridge, MA, USA, 2008. [Google Scholar]
- Kozina, E.A.; Kim, A.R.; Kurina, A.Y.; Ugrumov, M.V. Cooperative synthesis of dopamine by non-dopaminergic neurons as a compensatory mechanism in the striatum of mice with MPTP-induced Parkinsonism. Neurobiol. Dis. 2017, 98, 108–121. [Google Scholar] [CrossRef]
- Bligh, E.G.; Dyer, W.J. A rapid method of total lipid extraction and purification. Can. J. Biochem. Physiol. 1959, 37, 911–917. [Google Scholar] [CrossRef] [PubMed]
- Alessenko, A.V.; Blokhin, V.E.; Shupik, M.A.; Gutner, U.A.; Lebedev, A.T.; Maloshitskaya, O.A.; Sokolov, S.A.; Ugrumov, M.V. Changes in the Content of Sphingolipids in the Nigrostriatal Dopaminergic System in the Brain of Mice with a Neurotoxic Model of Parkinson’s Disease. Neurochem. J. 2021, 15, 175–180. [Google Scholar] [CrossRef]
- Ugrumov, M.V.; Khaindrava, V.G.; Kozina, E.A.; Kucheryanu, V.G.; Bocharov, E.V.; Kryzhanovsky, G.N.; Kudrin, V.S.; Narkevich, V.B.; Klodt, P.M.; Rayevsky, K.S.; et al. Modeling of presymptomatic and symptomatic stages of parkinsonism in mice. Neuroscience 2011, 181, 175–188. [Google Scholar] [CrossRef] [PubMed]
- Doppler, K.; Ebert, S.; Üçeyler, N.; Trenkwalder, C.; Ebentheuer, J.; Volkmann, J.; Sommer, C. Cutaneous neuropathy in Parkinson’s disease: A window into brain pathology. Acta Neuropathol. 2014, 128, 99–109. [Google Scholar] [CrossRef] [Green Version]
- Kozina, E.A.; Khakimova, G.R.; Khaindrava, V.G.; Kucheryanu, V.G.; Vorobyeva, N.E.; Krasnov, A.N.; Georgieva, S.G.; Goff, L.K.-L.; Ugrumov, M.V. Tyrosine hydroxylase expression and activity in nigrostriatal dopaminergic neurons of MPTP-treated mice at the presymptomatic and symptomatic stages of parkinsonism. J. Neurol. Sci. 2014, 340, 198–207. [Google Scholar] [CrossRef]
- Mingazov, E.R.; Khakimova, G.R.; Kozina, E.A.; Medvedev, A.E.; Buneeva, O.A.; Bazyan, A.S.; Ugrumov, M.V. MPTP Mouse Model of Preclinical and Clinical Parkinson’s Disease as an Instrument for Translational Medicine. Mol. Neurobiol. 2018, 55, 2991–3006. [Google Scholar] [CrossRef]
- Kim, A.; Nigmatullina, R.; Zalyalova, Z.; Soshnikova, N.; Krasnov, A.; Vorobyeva, N.; Georgieva, S.; Kudrin, V.; Narkevich, V.; Ugrumov, M. Upgraded Methodology for the Development of Early Diagnosis of Parkinson’s Disease Based on Searching Blood Markers in Patients and Experimental Models. Mol. Neurobiol. 2019, 56, 3437–3450. [Google Scholar] [CrossRef] [PubMed]
- Bogdanov, V.; Kim, A.; Nodel, M.; Pavlenko, T.; Pavlova, E.; Blokhin, V.; Chesnokova, N.; Ugrumov, M. A Pilot Study of Changes in the Level of Catecholamines and the Activity of α-2-Macroglobulin in the Tear Fluid of Patients with Parkinson’s Disease and Parkinsonian Mice. Int. J. Mol. Sci. 2021, 22, 4736. [Google Scholar] [CrossRef]
- Agid, Y. Parkinson’s disease: Pathophysiology. Lancet 1991, 337, 1321–1324. [Google Scholar] [CrossRef]
- Cruciani-Guglielmacci, C.; López, M.; Campana, M.; Le Stunff, H. Brain Ceramide Metabolism in the Control of Energy Balance. Front. Physiol. 2017, 8, 787. [Google Scholar] [CrossRef] [Green Version]
- Gegg, M.E.; Sweet, L.; Wang, B.H.; Shihabuddin, L.S.; Sardi, S.P.; Schapira, A.H.V. No evidence for substrate accumula-tion in Parkinson brains with GBA mutations. Mov. Disord. 2015, 30, 1085–1089. [Google Scholar] [CrossRef]
- Seyfried, T.N.; Choi, H.; Chevalier, A.; Hogan, D.; Akgoc, Z.; Schneider, J.S. Sex-Related Abnormalities in Substantia Nigra Lipids in Parkinson’s Disease. ASN Neuro 2018, 10, 1759091418781889. [Google Scholar] [CrossRef] [PubMed] [Green Version]
- Gan-Or, Z.; Ozelius, L.J.; Bar-Shira, A.; Saunders-Pullman, R.; Mirelman, A.; Kornreich, R.; Gana-Weisz, M.; Raymond, D.; Rozenkrantz, L.; Deik, A.; et al. The p.L302P mutation in the lysosomal enzyme gene SMPD1 is a risk factor for Par-kinson disease. Neurology 2013, 80, 1606–1610. [Google Scholar] [CrossRef] [Green Version]
- Den Jager, W.A. Sphingomyelin in Lewy Inclusion Bodies in Parkinson’s Disease. Arch. Neurol. 1969, 21, 615–619. [Google Scholar] [CrossRef]
- Kim, W.S.; Halliday, G.M. Changes in Sphingomyelin Level Affect Alpha-Synuclein and ABCA5 Expression. J. Park. Dis. 2012, 2, 41–46. [Google Scholar] [CrossRef]
- Taguchi, Y.V.; Liu, J.; Ruan, J.; Pacheco, J.; Zhang, X.; Abbasi, J.; Keutzer, J.; Mistry, P.K.; Chandra, S.S. Glucosylsphingosine Promotes α-Synuclein Pathology in Mutant GBA-Associated Parkinson’s Disease. J. Neurosci. 2017, 37, 9617–9631. [Google Scholar] [CrossRef] [PubMed] [Green Version]
- Motyl, J.; Wencel, P.L.; Cieślik, M.; Strosznajder, R.P.; Strosznajder, J.B. Alpha-synuclein alters differently gene expression of Sirts, PARPs and other stress response proteins: Implications for neurodegenerative disorders. Mol. Neurobiol. 2018, 55, 727–740. [Google Scholar] [CrossRef] [Green Version]
- Pyszko, J.A.; Strosznajder, J.B. The key role of sphingosine kinases in the molecular mechanism of neuronal cell sur-vival and death in an experimental model of Parkinson’s disease. Folia Neuropathol. 2014, 52, 260–269. [Google Scholar] [CrossRef]
- Pyszko, J.; Strosznajder, J.B. Sphingosine Kinase 1 and Sphingosine-1-Phosphate in Oxidative Stress Evoked by 1-Methyl-4-Phenylpyridinium (MPP+) in Human Dopaminergic Neuronal Cells. Mol. Neurobiol. 2014, 50, 38–48. [Google Scholar] [CrossRef]
- Sivasubramanian, M.; Kanagaraj, N.; Dheen, S.T.; Tay, S.S.W. Sphingosine kinase 2 and sphingosine-1-phosphate pro-motes mitochondrial function in dopaminergic neurons of mouse model of Parkinson’s disease and in MPP+-treated MN9D cells in vitro. Neuroscience 2015, 290, 636–648. [Google Scholar] [CrossRef]
- Zhao, P.; Yang, X.; Yang, L.; Li, M.; Wood, K.; Liu, Q.; Zhu, X. Neuroprotective effects of fingolimod in mouse models of Parkinson’s disease. FASEB J. 2017, 31, 172–179. [Google Scholar] [CrossRef] [Green Version]
- Kim, S.; Yun, S.P.; Lee, S.; Umanah, G.E.; Bandaru, V.V.R.; Yin, X.; Rhee, P.; Karuppagounder, S.S.; Kwon, S.-H.; Lee, H.; et al. GBA1 deficiency negatively affects physiological α-synuclein tetramers and related multimers. Proc. Natl. Acad. Sci. USA 2018, 115, 798–803. [Google Scholar] [CrossRef] [Green Version]
- Hallett, P.J.; Huebecker, M.; Brekk, O.R.; Moloney, E.B.; Rocha, E.M.; Priestman, D.A.; Platt, F.M.; Isacson, O. Glycosphingolipid levels and glucocerebrosidase activity are altered in normal aging of the mouse brain. Neurobiol. Aging 2018, 67, 189–200. [Google Scholar] [CrossRef]
- Gasser, T. Identifying PD-causing genes and genetic susceptibility factors: Current approaches and future prospects. Prog. Brain Res. 2010, 183, 2–20. [Google Scholar]
- Spiegel, S. Sphingosine-1-phosphate: From insipid lipid to a key regulator. J. Biol. Chem. 2020, 295, 3371–3384. [Google Scholar] [CrossRef] [PubMed] [Green Version]
- Rodrigues, P.S.; Kale, P.P. Mini review—The role of Glucocerebrosidase and Progranulin as possible targets in the treatment of Parkinson’s disease. Rev. Neurol. 2021, 177, 1082–1089. [Google Scholar] [CrossRef] [PubMed]
- Cosden, M.; Jinn, S.; Yao, L.; Gretzula, C.A.; Kandebo, M.; Toolan, D.; Hatcher, N.G.; Ma, L.; Lemaire, W.; Adam, G.C.; et al. A novel glucosylceramide synthase inhibitor attenuates alpha synuclein pathology and lysosomal dysfunction in preclinical models of synucleinopathy. Neurobiol. Dis. 2021, 159, 105507. [Google Scholar] [CrossRef] [PubMed]


| Gene | Forward Primer | Reverse Primer |
|---|---|---|
| ASAH1 | GCAGAAAATCAACGTATCCTCC | ATTCCCCTCATTTCCTCTCC |
| ASAH2 | ACACCCTGTCTGCATACATC | TCAACCACTTCTCCCACTC |
| GBA1 | TATCCAACTTCAGCCTCCC | CCCCTTCCCATTCACTCTTC |
| SMPD1 | ATCAGTCAACCACAACGAAG | GTCAAACAGAGCCAGAACC |
| SMPD2 | CATCCACCACACATCCAAG | TACAGCCATCATCAGAGCC |
| CERS1 | TGCCACTCCATCTATGCCAC | GGAACCAGAACCAGCAGAAAC |
| CERS3 | CCCTTCTTCTCCTACATCTTCC | TCCTCTTCCTCCTCCTCTTC |
| CERS5 | ACAACCCACAAAAACAACCTC | CACACACAAAAACCACACAAAC |
| UGCG | TCCTTTCCCCTCCTTTTCC | CATCCACCAAACTCCACTAAAC |
| Sphingomyelins | ||||||||||||||
| Brain Structure | Animal Group | 14-0 | 16-1 | 16-0 | 18-1 | 18-0 | 20-1 | 20-0 | 22-1 | 22-0 | 24-1 | 24-0 | 26-1 | Total (Cumulative) Concentration |
| Striatum | 1 × 18 | ↑ | ↑ | |||||||||||
| 3 × 10 | ||||||||||||||
| SN | 1 × 18 | ↑ | ↑ | ↑ | ↑ | |||||||||
| 3 × 10 | ||||||||||||||
| Ceramides | ||||||||||||||
| Brain Structure | Animal Group | 16-1 | 16-0 | 18-1 | 18-0 | 20-1 | 20-0 | 22-1 | 24-1 | 24-0 | 26-1 | 26-0 | Total (Cumulative) Concentration | |
| Striatum | 1 × 18 | |||||||||||||
| 3 × 10 | ||||||||||||||
| SN | 1 × 18 | ↑ | ||||||||||||
| 3 × 10 | ||||||||||||||
| Hexosylceramides | ||||||||||||||
| Brain Structure | Animal Group | 18-0 | 20-0 | 22-0 | 24-0 | 24-1 | Total (Cumulative) Concentration | |||||||
| Striatum | 1 × 18 | ↑ | ||||||||||||
| 3 × 10 | ↑ | ↑ | ↑ | |||||||||||
| SN | 1 × 18 | |||||||||||||
| 3 × 10 | ||||||||||||||
| Derivatives of Ceramides | ||||||||||||||
| Brain Structure | Animal Group | Sphingosine | Sphinganine | Sphingosine-1-phosphate | ||||||||||
| Striatum | 1 × 18 | |||||||||||||
| 3 × 10 | ||||||||||||||
| SN | 1 × 18 | ↑ | ||||||||||||
| 3 × 10 | ↑ | |||||||||||||
| Changes in Gene Expression | ||||||||||||||
| Brain Structure | Animal Group | ASAH1 | ASAH2 | CERS1 | CERS3 | CERS5 | GBA1 | SMPD1 | SMPD2 | UGCG | ||||
| Striatum | 1 × 18 | |||||||||||||
| 3 × 10 | ||||||||||||||
| SN | 1 × 18 | ↑ | ↑ | ↑ | ||||||||||
| 3 × 10 | ↑ | ↑ | ↑ | ↑ | ↑ | |||||||||
Publisher’s Note: MDPI stays neutral with regard to jurisdictional claims in published maps and institutional affiliations. |
© 2022 by the authors. Licensee MDPI, Basel, Switzerland. This article is an open access article distributed under the terms and conditions of the Creative Commons Attribution (CC BY) license (https://creativecommons.org/licenses/by/4.0/).
Share and Cite
Blokhin, V.; Shupik, M.; Gutner, U.; Pavlova, E.; Lebedev, A.T.; Maloshitskaya, O.; Bogdanov, V.; Sokolov, S.; Alessenko, A.; Ugrumov, M. The Sphingolipid Asset Is Altered in the Nigrostriatal System of Mice Models of Parkinson’s Disease. Biomolecules 2022, 12, 93. https://doi.org/10.3390/biom12010093
Blokhin V, Shupik M, Gutner U, Pavlova E, Lebedev AT, Maloshitskaya O, Bogdanov V, Sokolov S, Alessenko A, Ugrumov M. The Sphingolipid Asset Is Altered in the Nigrostriatal System of Mice Models of Parkinson’s Disease. Biomolecules. 2022; 12(1):93. https://doi.org/10.3390/biom12010093
Chicago/Turabian StyleBlokhin, Victor, Maria Shupik, Ulyana Gutner, Ekaterina Pavlova, Albert T. Lebedev, Olga Maloshitskaya, Vsevolod Bogdanov, Sergey Sokolov, Alice Alessenko, and Michael Ugrumov. 2022. "The Sphingolipid Asset Is Altered in the Nigrostriatal System of Mice Models of Parkinson’s Disease" Biomolecules 12, no. 1: 93. https://doi.org/10.3390/biom12010093
APA StyleBlokhin, V., Shupik, M., Gutner, U., Pavlova, E., Lebedev, A. T., Maloshitskaya, O., Bogdanov, V., Sokolov, S., Alessenko, A., & Ugrumov, M. (2022). The Sphingolipid Asset Is Altered in the Nigrostriatal System of Mice Models of Parkinson’s Disease. Biomolecules, 12(1), 93. https://doi.org/10.3390/biom12010093