
Molecular Biology Networks and Key Gene Regulators for Inflammatory Biomarkers Shared by Breast Cancer Development: Multi-Omics Systems Analysis


Abstract
1. Introduction
2. Materials and Methods
2.1. GWAS Data for CRP and IL6
2.2. Genotyping and CRP/IL6 Phenotypes
2.3. Mergeomics
2.3.1. Mapping SNPs to Genes
2.3.2. Marker-Set Enrichment Analysis (MSEA)
2.3.3. Tissue-Specific Gene Regulatory Networks and Weighted KD Analysis (wKDA)
2.3.4. MSEA and wKDA for BC Development
3. Results
3.1. Phenotype-Specific Pathways and Common Supersets Shared by CRP and IL6
Putative KD Genes for the CRP/IL6–Associated Supersets
4. Discussion
5. Conclusions
Supplementary Materials
Author Contributions
Funding
Institutional Review Board Statement
Informed Consent Statement
Data Availability Statement
Acknowledgments
Conflicts of Interest
References
- Esposito, K.; Giugliano, D. The metabolic syndrome and inflammation: Association or causation? Nutr. Metab. Cardiovasc. Dis. 2004, 14, 228–232. [Google Scholar] [CrossRef]
- Wisse, B.E. The Inflammatory Syndrome: The Role of Adipose Tissue Cytokines in Metabolic Disorders Linked to Obesity. J. Am. Soc. Nephrol. 2004, 15, 2792–2800. [Google Scholar] [CrossRef]
- Coussens, L.M.; Werb, Z. Inflammation and cancer. Nature 2002, 420, 860–867. [Google Scholar] [CrossRef]
- Disis, M.L. Immune Regulation of Cancer. J. Clin. Oncol. 2010, 28, 4531–4538. [Google Scholar] [CrossRef] [PubMed]
- Grivennikov, S.I.; Greten, F.; Karin, M. Immunity, Inflammation, and Cancer. Cell 2010, 140, 883–899. [Google Scholar] [CrossRef]
- Hanahan, D.; Weinberg, R.A. Hallmarks of Cancer: The Next Generation. Cell 2011, 144, 646–674. [Google Scholar] [CrossRef] [PubMed]
- Ollberding, N.J.; Kim, Y.; Shvetsov, Y.B.; Wilkens, L.R.; Franke, A.A.; Cooney, R.V.; Maskarinec, G.; Hernandez, B.Y.; Henderson, B.E.; Le Marchand, L.; et al. Prediagnostic Leptin, Adiponectin, C-Reactive Protein, and the Risk of Postmenopausal Breast Cancer. Cancer Prev. Res. 2013, 6, 188–195. [Google Scholar] [CrossRef] [PubMed]
- Perks, C.M.; Holly, J.M. Hormonal Mechanisms Underlying the Relationship between Obesity and Breast Cancer. Endocrinol. Metab. Clin. N. Am. 2011, 40, 485–507. [Google Scholar] [CrossRef] [PubMed]
- Roberts, D.; Dive, C.; Renehan, A. Biological Mechanisms Linking Obesity and Cancer Risk: New Perspectives. Annu. Rev. Med. 2010, 61, 301–316. [Google Scholar] [CrossRef] [PubMed]
- Pierce, B.; Ballard-Barbash, R.; Bernstein, L.; Baumgartner, R.N.; Neuhouser, M.L.; Wener, M.H.; Baumgartner, K.B.; Gilliland, F.D.; Sorensen, B.E.; McTiernan, A.; et al. Elevated Biomarkers of Inflammation Are Associated With Reduced Survival Among Breast Cancer Patients. J. Clin. Oncol. 2009, 27, 3437–3444. [Google Scholar] [CrossRef] [PubMed]
- Chan, D.S.; Bandera, E.V.; Greenwood, D.C.; Norat, T. Circulating C-Reactive Protein and Breast Cancer Risk—Systematic Literature Review and Meta-analysis of Prospective Cohort Studies. Cancer Epidemiol. Biomark. Prev. 2015, 24, 1439–1449. [Google Scholar] [CrossRef]
- Amaral, W.; Krueger, R.F.; Ryff, C.D.; Coe, C.L. Genetic and environmental determinants of population variation in interleukin-6, its soluble receptor and C-reactive protein: Insights from identical and fraternal twins. Brain Behav. Immun. 2015, 49, 171–181. [Google Scholar] [CrossRef] [PubMed][Green Version]
- Hu, M.; Lee, M.H.; Mak, V.W.; Tomlinson, B. Effect of Central Obesity, Low High-Density Lipoprotein Cholesterol and C-Reactive Protein Polymorphisms on C-Reactive Protein Levels During Treatment With Rosuvastatin (10 mg Daily). Am. J. Cardiol. 2010, 106, 1588–1593. [Google Scholar] [CrossRef]
- Van Gemert, W.A.; May, A.M.; Schuit, A.J.; Oosterhof, B.Y.; Peeters, P.H.; Monninkhof, E.M. Effect of Weight Loss with or without Exercise on Inflammatory Markers and Adipokines in Postmenopausal Women: The SHAPE-2 Trial, A Randomized Controlled Trial. Cancer Epidemiol. Biomarkers Prev. 2016, 25, 799–806. [Google Scholar] [CrossRef] [PubMed]
- Prizment, A.E.; Folsom, A.R.; Dreyfus, J.; Anderson, K.E.; Visvanathan, K.; Joshu, C.E.; Platz, E.A.; Pankow, J. Plasma C-reactive protein, genetic risk score, and risk of common cancers in the Atherosclerosis Risk in Communities study. Cancer Causes Control. 2013, 24, 2077–2087. [Google Scholar] [CrossRef][Green Version]
- Yusuf, N.; Hidalgo, B.; Irvin, M.R.; Sha, J.; Zhi, D.; Tiwari, H.K.; Absher, D.; Arnett, D.K.; Aslibekyan, S.W. An epigenome-wide association study of inflammatory response to fenofibrate in the Genetics of Lipid Lowering Drugs and Diet Network. Pharmacogenomics 2017, 18, 1333–1341. [Google Scholar] [CrossRef] [PubMed]
- Schick, U.M.; Auer, P.L.; Bis, J.C.; Lin, H.; Wei, P.; Pankratz, N.; Lange, L.A.; Brody, J.; Stitziel, N.; Kim, D.S.; et al. Association of exome sequences with plasma C-reactive protein levels in >9000 participants. Hum. Mol. Genet. 2014, 24, 559–571. [Google Scholar] [CrossRef]
- Naitza, S.; Porcu, E.; Steri, A.M.; Taub, D.D.; Mulas, A.; Xiao, X.; Strait, J.; Dei, M.; Lai, S.; Busonero, F.; et al. A Genome-Wide Association Scan on the Levels of Markers of Inflammation in Sardinians Reveals Associations That Underpin Its Complex Regulation. PLoS Genet. 2012, 8, e1002480. [Google Scholar] [CrossRef]
- Zhao, Y.; Jhamb, D.; Shu, L.; Arneson, D.; Rajpal, D.K.; Yang, X. Multi-omics integration reveals molecular networks and regulators of psoriasis. BMC Syst. Biol. 2019, 13, 8. [Google Scholar] [CrossRef]
- Zhong, H.; Yang, X.; Kaplan, L.M.; Molony, C.; Schadt, E.E. Integrating Pathway Analysis and Genetics of Gene Expression for Genome-wide Association Studies. Am. J. Hum. Genet. 2010, 86, 581–591. [Google Scholar] [CrossRef]
- Wang, K.; Li, M.; Bucan, M. Pathway-Based Approaches for Analysis of Genomewide Association Studies. Am. J. Hum. Genet. 2007, 81, 1278–1283. [Google Scholar] [CrossRef] [PubMed]
- Zhong, H.; Beaulaurier, J.; Lum, P.Y.; Molony, C.; Yang, X.; MacNeil, U.J.; Weingarth, D.T.; Zhang, B.; Greenawalt, D.; Dobrin, R.; et al. Liver and Adipose Expression Associated SNPs Are Enriched for Association to Type 2 Diabetes. PLoS Genet. 2010, 6, e1000932. [Google Scholar] [CrossRef] [PubMed]
- Mäkinen, V.-P.; Civelek, M.; Meng, Q.; Zhang, B.; Zhu, J.; Levian, C.; Huan, T.; Segrè, A.V.; Ghosh, S.; Vivar, J.; et al. Integrative Genomics Reveals Novel Molecular Pathways and Gene Networks for Coronary Artery Disease. PLoS Genet. 2014, 10, e1004502. [Google Scholar] [CrossRef]
- Blencowe, M.; Ahn, I.S.; Saleem, Z.; Luk, H.; Cely, I.; Mäkinen, V.-P.; Zhao, Y.; Yang, X. Gene networks and pathways for plasma lipid traits via multitissue multiomics systems analysis. J. Lipid Res. 2021, 62, 100019. [Google Scholar] [CrossRef] [PubMed]
- Presson, A.P.; Sobel, E.M.; Papp, J.C.; Suarez, C.J.; Whistler, T.; Rajeevan, M.S.; Vernon, S.D.; Horvath, S. Integrated Weighted Gene Co-expression Network Analysis with an Application to Chronic Fatigue Syndrome. BMC Syst. Biol. 2008, 2, 95. [Google Scholar] [CrossRef]
- Jung, S.Y.; Scott, P.A.; Papp, J.C.; Sobel, E.M.; Pellegrini, M.; Yu, H.; Han, S.; Zhang, Z.-F. Genome-wide Association Analysis of Proinflammatory Cytokines and Gene–lifestyle Interaction for Invasive Breast Cancer Risk: The WHI dbGaP Study. Cancer Prev. Res. 2021, 14, 41–54. [Google Scholar] [CrossRef]
- GWAS Catalog: GCST90011804. Breast Cancer. Genome-Wide Genotyping Array. NIH. 2021. Available online: https://www.ebi.ac.uk/gwas/studies/GCST90011804. (accessed on 1 January 2021).
- Rashkin, S.R.; Graff, R.E.; Kachuri, L. Pan-cancer study detects genetic risk variants and shared genetic basis in two large cohorts. Nat. Commun. 2020, 11, 4423. [Google Scholar] [CrossRef]
- The Women’s Health Initiative Study Group. Design of the Women’s Health Initiative clinical trial and observational study. Control Clin. Trials 1998, 19, 61–109. [Google Scholar] [CrossRef]
- WHI Harmonized and Imputed GWAS Data. Available online: https://www.ncbi.nlm.nih.gov/projects/gap/cgi-bin/study.cgi?study_id=phs000746.v3.p3 (accessed on 1 January 2021).
- NCBI; WHI. Harmonized and Imputed GWAS Data. A Sub-Study of Women’s Health Initiative. Available online: https://cancerpreventionresearch.aacrjournals.org/content/12/1/31 (accessed on 1 January 2021).
- Shu, L.; Zhao, Y.; Kurt, Z.; Byars, S.G.; Tukiainen, T.; Kettunen, J.; Orozco, L.D.; Pellegrini, M.; Lusis, A.J.; Ripatti, S.; et al. Mergeomics: Multidimensional data integration to identify pathogenic perturbations to biological systems. BMC Genom. 2016, 17, 1–16. [Google Scholar] [CrossRef]
- Joshi-Tope, G.; Gillespie, M.; Vastrik, I. Reactome: A knowledgebase of biological pathways. Nucleic Acids Res. 2005, 33, D428–D432. [Google Scholar] [CrossRef]
- Ogata, H.; Goto, S.; Sato, K.; Fujibuchi, W.; Bono, H.; Kanehisa, M. KEGG: Kyoto Encyclopedia of Genes and Genomes. Nucleic Acids Res. 1999, 27, 29–34. [Google Scholar] [CrossRef] [PubMed]
- Krishnan, K.C.; Kurt, Z.; Barrere-Cain, R. Integration of Multi-omics Data from Mouse Diversity Panel Highlights Mitochondrial Dysfunction in Non-alcoholic Fatty Liver Disease. Cell Syst. 2018, 6, 103–115.e7. [Google Scholar] [CrossRef]
- Greene, C.S.; Krishnan, A.; Wong, A.; Ricciotti, E.; Zelaya, R.; Himmelstein, D.S.; Zhang, R.; Hartmann, B.; Zaslavsky, E.; Sealfon, S.; et al. Understanding multicellular function and disease with human tissue-specific networks. Nat. Genet. 2015, 47, 569–576. [Google Scholar] [CrossRef] [PubMed]
- Peri, S.; Navarro, J.D.; Amanchy, R.; Kristiansen, T.Z.; Jonnalagadda, C.K.; Surendranath, V.; Niranjan, V.; Muthusamy, B.; Gandhi, T.K.B.; Gronborg, M.; et al. Development of Human Protein Reference Database as an Initial Platform for Approaching Systems Biology in Humans. Genome Res. 2003, 13, 2363–2371. [Google Scholar] [CrossRef] [PubMed]
- Yang, X.; Zhang, B.; Molony, C.; Chudin, E.; Hao, K.; Zhu, J.; Gaedigk, A.; Suver, C.; Zhong, H.; Leeder, J.S.; et al. Systematic genetic and genomic analysis of cytochrome P450 enzyme activities in human liver. Genome Res. 2010, 20, 1020–1036. [Google Scholar] [CrossRef] [PubMed]
- Wang, I.; Zhang, B.; Yang, X.; Zhu, J.; Stepaniants, S.; Zhang, C.; Meng, Q.; Peters, M.; He, Y.; Ni, C.; et al. Systems analysis of eleven rodent disease models reveals an inflammatome signature and key drivers. Mol. Syst. Biol. 2012, 8, 594. [Google Scholar] [CrossRef] [PubMed]
- Segrè, A.V.; Groop, L.; Mootha, V.K.; Daly, M.J.; Altshuler, D.; DIAGRAM Consortium. MAGIC Investigators Common. Inherited Variation in Mitochondrial Genes Is Not Enriched for Associations with Type 2 Diabetes or Related Glycemic Traits. PLoS Genet. 2010, 6, e1001058. [Google Scholar] [CrossRef]
- Wang, K.; Li, M.; Hakonarson, H. Analysing biological pathways in genome-wide association studies. Nat. Rev. Genet. 2010, 11, 843–854. [Google Scholar] [CrossRef] [PubMed]
- Dugast, A.S.; Vanhove, B. Immune regulation by non-lymphoid cells in transplantation. Clin. Exp. Immunol. 2009, 156, 25–34. [Google Scholar] [CrossRef]
- Gabay, C. Interleukin-6 and chronic inflammation. Arthritis Res. 2006, 8, S3. [Google Scholar] [CrossRef]
- Kaplanski, G.; Marin, V.; Montero-Julian, F.; Mantovani, A.; Farnarier, C. IL-6: A regulator of the transition from neutrophil to monocyte recruitment during inflammation. Trends Immunol. 2003, 24, 25–29. [Google Scholar] [CrossRef]
- Hu, X.; Chakravarty, S.D.; Ivashkiv, L.B. Regulation of interferon and Toll-like receptor signaling during macrophage activation by opposing feedforward and feedback inhibition mechanisms. Immunol. Rev. 2008, 226, 41–56. [Google Scholar] [CrossRef]
- Hsiao, Y.W.; Liao, K.W.; Chung, T.F.; Liu, C.H.; Hsu, C.D.; Chu, R.M. Interactions of host IL-6 and IFN-gamma and cancer-derived TGF-beta1 on MHC molecule expression during tumor spontaneous regression. Cancer Immunol. Immunother. 2008, 57, 1091–1104. [Google Scholar] [CrossRef]
- Bukowski, R.M.; Rayman, P.; Molto, L.; Tannenbaum, C.S.; Olencki, T.; Peereboom, D.; Tubbs, R.; McLain, D.; Budd, G.T.; Griffin, T.; et al. Interferon-gamma and CXC chemokine induction by interleukin 12 in renal cell carcinoma. Clin. Cancer Res. 1999, 5, 2780–2789. [Google Scholar] [PubMed]
- Yuzawa, E.; Imaizumi, T.; Matsumiya, T. Retinoic acid-inducible gene-I is induced by interferon-gamma and regulates CXCL11 expression in HeLa cells. Life Sci. 2008, 82, 670–675. [Google Scholar] [CrossRef]
- Nagarsheth, N.; Wicha, M.S.; Zou, W. Chemokines in the cancer microenvironment and their relevance in cancer immunotherapy. Nat. Rev. Immunol. 2017, 17, 559–572. [Google Scholar] [CrossRef] [PubMed]
- Vilgelm, A.E.; Richmond, A. Chemokines Modulate Immune Surveillance in Tumorigenesis, Metastasis, and Response to Immunotherapy. Front. Immunol. 2019, 10, 333. [Google Scholar] [CrossRef]
- Schoenborn, J.R.; Wilson, C.B. Regulation of interferon-gamma during innate and adaptive immune responses. Adv. Immunol. 2007, 96, 41–101. [Google Scholar]
- Garcia-Diaz, A.; Shin, D.S.; Moreno, B.H.; Saco, J.; Escuin-Ordinas, H.; Rodriguez, G.A.; Zaretsky, J.M.; Sun, L.; Hugo, W.; Wang, X.; et al. Interferon Receptor Signaling Pathways Regulating PD-L1 and PD-L2 Expression. Cell Rep. 2017, 19, 1189–1201. [Google Scholar] [CrossRef]
- Bellucci, R.; Martin, A.; Bommarito, D. Interferon-gamma-induced activation of JAK1 and JAK2 suppresses tumor cell susceptibility to NK cells through upregulation of PD-L1 expression. Oncoimmunology 2015, 4, e1008824. [Google Scholar] [CrossRef]
- Moshapa, F.; Riches-Suman, K.; Palmer, T.M. Therapeutic Targeting of the Proinflammatory IL-6-JAK/STAT Signalling Pathways Responsible for Vascular Restenosis in Type 2 Diabetes Mellitus. Cardiol. Res. Pract. 2019, 2019, 1–15. [Google Scholar] [CrossRef]
- Hamann, A.; Syrbe, U.L. T-cell trafficking into sites of inflammation. Rheumatology 2000, 39, 696–699. [Google Scholar] [CrossRef]
- Aaronson, D.S.; Horvath, C.M. A road map for those who don’t know JAK-STAT. Science 2002, 296, 1653–1655. [Google Scholar] [CrossRef] [PubMed]
- Shang, H.; Zhou, L.; Luan, H.; Liu, Q.; Jiang, T.; Liang, H.; Dong, X. Activation of PI3K/Akt and ERK signaling pathways antagonized sinomenine-induced lung cancer cell apoptosis. Mol. Med. Rep. 2012, 5, 1256–1260. [Google Scholar] [CrossRef] [PubMed]
- Khajah, M.A.; Mathew, P.M.; Luqmani, Y.A. Inhibitors of PI3K/ERK1/2/p38 MAPK Show Preferential Activity Against Endocrine-Resistant Breast Cancer Cells. Oncol. Res. 2017, 25, 1283–1295. [Google Scholar] [CrossRef] [PubMed]
- Li, X.; Huang, Q.; Wang, S.; Huang, Z.; Yu, F.; Lin, J. HER4 promotes the growth and metastasis of osteosarcoma via the PI3K/AKT pathway. Acta Biochim. Biophys. Sin. 2020, 52, 345–362. [Google Scholar] [CrossRef]
- Febvre-James, M.; Lecureur, V.; Fardel, O. Potent repression of C-reactive protein (CRP) expression by the JAK1/2 inhibitor ruxolitinib in inflammatory human hepatocytes. Inflamm. Res. 2020, 69, 51–62. [Google Scholar] [CrossRef]
- Iyengar, N.M.; Zhou, X.K.; Mendieta, H.; Giri, D.D.; El-Hely, O.; Winston, L.; Falcone, D.J.; Wang, H.; Meng, L.; Landa, J.; et al. Effects of Adiposity and Exercise on Breast Tissue and Systemic Metabo-Inflammatory Factors in Women at High Risk or Diagnosed with Breast Cancer. Cancer Prev. Res. 2021, 14, 541–550. [Google Scholar] [CrossRef]
- D’Eustachio, P.; Earp, H.S.R.; Harris, R.; European Bioinformatics Institute; New York University Langone Medical Center; Ontario Institute for Cancer Research; Oregon Health and Science University. Reactome: Signaling by ERBB4. 2021. Available online: https://reactome.org/content/detail/R-HSA-1236394 (accessed on 1 January 2021).
- Gene Card. Human Gene Database: CD3D Gene (Protein Coding). 2021. Available online: https://www.genecards.org/cgi-bin/carddisp.pl?gene=CD3D&keywords=CD3D (accessed on 1 January 2021).
- Gene Card. Human Gene Database: CD3G Gene (Protein Coding). 2021. Available online: https://www.genecards.org/cgi-bin/carddisp.pl?gene=CD3G&keywords=CD3D (accessed on 1 January 2021).
- Gene Card. Human Gene Database: CD2 Gene (Protein Coding). 2021. Available online: https://www.genecards.org/cgi-bin/carddisp.pl?gene=CD2&keywords=CD2 (accessed on 1 January 2021).
- Gene Card. Human Gene Database: LCK Gene (Protein Coding). 2021. Available online: https://www.genecards.org/cgi-bin/carddisp.pl?gene=LCK&keywords=LCK (accessed on 1 January 2021).
- Gene Card. Human Gene Database: SH2D2A Gene (Protein Coding). 2021. Available online: https://www.genecards.org/cgi-bin/carddisp.pl?gene=SH2D2A&keywords=SH2D2A (accessed on 1 January 2021).
- Gene Card. Human Gene Database: IL2RB Gene (Protein Coding). 2021. Available online: https://www.genecards.org/cgi-bin/carddisp.pl?gene=IL2RB&keywords=IL2RB (accessed on 1 January 2021).
- Gene Card. Human Gene Database: C8A Gene (Protein Coding). 2021. Available online: https://www.genecards.org/cgi-bin/carddisp.pl?gene=C8A&keywords=C8A (accessed on 1 January 2021).
- Gene Card. Human Gene Database: C9 Gene (Protein Coding). 2021. Available online: https://www.genecards.org/cgi-bin/carddisp.pl?gene=C9&keywords=C9 (accessed on 1 January 2021).
- Gene Card. Human Gene Database: CFI Gene (Protein Coding). 2021. Available online: https://www.genecards.org/cgi-bin/carddisp.pl?gene=CFI&keywords=CFI (accessed on 1 January 2021).
- Gene Card. Human Gene Database: CFP Gene (Protein Coding). 2021. Available online: https://www.genecards.org/cgi-bin/carddisp.pl?gene=CFP&keywords=CFP (accessed on 1 January 2021).
- Gene Card. Human Gene Database: HLA-A Gene (Protein Coding). 2021. Available online: https://www.genecards.org/cgi-bin/carddisp.pl?gene=HLA-A&keywords=HLA%5C-A (accessed on 1 January 2021).
- Gene Card. Human Gene Database: HLA-B Gene (Protein Coding). 2021. Available online: https://www.genecards.org/cgi-bin/carddisp.pl?gene=HLA-B&keywords=HLA%5C-A (accessed on 1 January 2021).
- Gene Card. Human Gene Database: HLA-E Gene (Protein Coding). 2021. Available online: https://www.genecards.org/cgi-bin/carddisp.pl?gene=HLA-E&keywords=HLA%5C-A (accessed on 1 January 2021).
- Gene Card. Human Gene Database: HLA-G Gene (Protein Coding). 2021. Available online: https://www.genecards.org/cgi-bin/carddisp.pl?gene=HLA-G&keywords=HLA%5C-A (accessed on 1 January 2021).
- Li, X.; Peng, J.; Pang, Y.; Yu, S.; Yu, X.; Chen, P.; Wang, W.; Han, W.; Zhang, J.; Yin, Y.; et al. Identification of a FOXP3+CD3+CD56+ population with immunosuppressive function in cancer tissues of human hepatocellular carcinoma. Sci. Rep. 2015, 5, 14757. [Google Scholar] [CrossRef] [PubMed]
- Sjödahl, G.; Lövgren, K.; Lauss, M.; Chebil, G.; Patschan, O.; Gudjonsson, S.; Månsson, W.; Fernö, M.; Leandersson, K.; Lindgren, D.; et al. 790 Infiltration of CD3+ and CD68+ cells in bladder cancer is subtype specific and affects outcome of patients with muscle-invasive tumors. Eur. Urol. Suppl. 2014, 13, e790. [Google Scholar] [CrossRef]
- Zhao, X.; Yan, X.; Ju, Y.F.; Yu, H.M.; Jiao, S.C. Expression and clinical significance of CD3, CD4 and COX-2 in non-small cell lung cancer. XI BAO YU FEN ZI MIAN YI XUE ZA ZHI = Chin. J. Cell. Mol. Immunol. 2012, 28, 407–409. [Google Scholar]
- Gene Card. Human Gene Database: RTP4 Gene (Protein Coding). 2021. Available online: https://www.genecards.org/cgi-bin/carddisp.pl?gene=RTP4&keywords=RTP4 (accessed on 1 January 2021).
- Gene Card. Human Gene Database: FCER1G Gene (Protein Coding). 2021. Available online: https://www.genecards.org/cgi-bin/carddisp.pl?gene=FCER1G&keywords=FCER1G (accessed on 1 January 2021).
- Gene Card. Human Gene Database: IRF1 Gene (Protein Coding). 2021. Available online: https://www.genecards.org/cgi-bin/carddisp.pl?gene=IRF1&keywords=IRF1 (accessed on 1 January 2021).
- Cao, W.; Zhang, L.; Rosen, D.B. BDCA2/Fc epsilon RI gamma complex signals through a novel BCR-like pathway in human plasmacytoid dendritic cells. PLoS Biol. 2007, 5, e248. [Google Scholar] [CrossRef] [PubMed]
- Knox, C.; Law, V.; Jewison, T.; Liu, P.; Ly, S.; Frolkis, A.; Pon, A.; Banco, K.; Mak, C.; Neveu, V.; et al. DrugBank 3.0: A comprehensive resource for ’Omics’ research on drugs. Nucleic Acids Res. 2010, 39, D1035–D1041. [Google Scholar] [CrossRef]
- FDA Approved Drug: Tofacitinib. 2021. Available online: https://www.fda.gov/safety/medical-product-safety-information/xeljanz-xeljanz-xr-tofacitinib-drug-safety-communication-initial-safety-trial-results-find-increased#:~:text=In%202018%2C%20FDA%20approved%20the,%2C%20PsA%2C%20and%20ulcerative%20colitis (accessed on 1 January 2021).
- FDA Approved Drug: Ruxolitinib. 2021. Available online: https://www.fda.gov/drugs/resources-information-approved-drugs/fda-approves-ruxolitinib-acute-graft-versus-host-disease#:~:text=On%20May%2024%2C%202019%2C%20the,patients%2012%20years%20and%20older (accessed on 1 January 2021).
- Hirano, T.; Ishihara, K.; Hibi, M. Roles of STAT3 in mediating the cell growth, differentiation and survival signals relayed through the IL-6 family of cytokine receptors. Oncogene 2000, 19, 2548–2556. [Google Scholar] [CrossRef] [PubMed]
- Leslie, K.; Lang, C.; Devgan, G.; Azare, J.; Berishaj, M.; Gerald, W.; Kim, Y.B.; Paz, K.; Darnell, J.E.; Albanese, C.; et al. Cyclin D1 Is Transcriptionally Regulated by and Required for Transformation by Activated Signal Transducer and Activator of Transcription 3. Cancer Res. 2006, 66, 2544–2552. [Google Scholar] [CrossRef] [PubMed]
- Gene Card. Human Gene Database: STAT6 Gene (Protein Coding). 2021. Available online: https://www.genecards.org/cgi-bin/carddisp.pl?gene=STAT6&keywords=STAT6 (accessed on 1 January 2021).
- Papageorgis, P.; Ozturk, S.; Lambert, A.W. Targeting IL13Ralpha2 activates STAT6-TP63 pathway to suppress breast cancer lung metastasis. Breast Cancer Res. BCR 2015, 17, 98. [Google Scholar] [CrossRef] [PubMed]
- Wu, H.-T.; Liu, J.; Li, G.-W.; Shen, J.-X.; Huang, Y.-T. The transcriptional STAT3 is a potential target, whereas transcriptional STAT5A/5B/6 are new biomarkers for prognosis in human breast carcinoma. Oncotarget 2017, 8, 36279–36288. [Google Scholar] [CrossRef]
- Chan, K.H.K.; Huang, Y.-T.; Meng, Q.; Wu, C.; Reiner, A.; Sobel, E.M.; Tinker, L.; Lusis, A.J.; Yang, X.; Liu, S. Shared Molecular Pathways and Gene Networks for Cardiovascular Disease and Type 2 Diabetes Mellitus in Women Across Diverse Ethnicities. Circ. Cardiovasc. Genet. 2014, 7, 911–919. [Google Scholar] [CrossRef] [PubMed]
- Boyle, E.A.; Li, Y.I.; Pritchard, J.K. An Expanded View of Complex Traits: From Polygenic to Omnigenic. Cell 2017, 169, 1177–1186. [Google Scholar] [CrossRef] [PubMed]
- Goh, K.-I.; Cusick, M.E.; Valle, D.; Childs, B.; Vidal, M.; Barabási, A.-L. The human disease network. Proc. Natl. Acad. Sci. USA 2007, 104, 8685–8690. [Google Scholar] [CrossRef]


| Top 10 Key Drivers £ | |||||||
|---|---|---|---|---|---|---|---|
| Module € | Description | Module Size | Adipose | Blood | Liver | Muscle | PPI |
| rctm0567 .. | Immunoregulatory interactions between lymphoid and non-lymphoid cells | 120 **, 70 ¶, 126 ¥, N/A, 126 § | CD3G *, CD2, LCK, STAT4 | CD8B * | C4BPA *, C8A *, C9 *, CFI *, CFP, CSF1R, CFH *, C8B *, C5 *, CFB * | N/A | HLA-A, B2M *, HLA-E, HLA-G, HLA-B, HLA-C, CD28, CD80, C4A, HLA-F |
| M4047 .. | Selective expression of chemokine receptors during T-cell polarization | 76 **, N/A, 80 ¥, N/A, 83 § | CD3D *, M26056, SH2D2A, LCK *, CD2 *, CD3G *, TNFRSF18, CD5, ITGAL, CXCR3 | N/A | CD3G *, IL2RB | N/A | STAT3, LCK *, PTPN11 *, JAK1, PTPN6 *, PIK3CA *, IL4 *, JAK2 *, IL2 *, SHC1 |
| rctm0627 .. | Iron uptake and transport | 62 **, N/A, N/A, N/A, 62 § | DPEP2, PLD3, CD84, ATF3 | N/A | N/A | N/A | TFRC *, INS *, ATP6V1D *, ATP6V0C *, INSR * |
| rctm0854 .. | Peptide hormone metabolism | N/A, N/A, N/A, N/A, 121 § | N/A | N/A | N/A | N/A | INS *, STX4, SLC2A4, GCG *, GCGR, AVPR2, RHO, VAMP2 *, NPS, SNAP23 |
| rctm1368 | Voltage-gated potassium channels | N/A, N/A, N/A, N/A, 54 § | N/A | N/A | N/A | N/A | KCNAB2 * |
| rctm1178 | Striated muscle contraction | 60 **, N/A, 53 ¥, 50 †, 53 § | MYLPF, TTN *, HRC, TPM1 *, TNNT3 *, TNNI2 *, TNNC2 *, MYPN, KBTBD10, TCAP * | N/A | MYL1 *, TTN *, TNNI2 * | TPM3 *, TNNI1 *, MYL2 *, MYL3 *, TNNT1 *, TNNC1 *, MYH3 *, TPM1 *, CYFIP2, ATP2A2, MYH7 | DMD *, TPM1 *, ACTN3 *, TPM4 *, TPM2 *, ACTN2 *, TPM3 *, ACTA1, ITGA1, MYL9 |
| Top 10 Key Drivers £ | |||||||
|---|---|---|---|---|---|---|---|
| Module € | Description | Module Size | Adipose | Blood | Liver | Muscle | PPI |
| M4047 .. | Selective expression of chemokine receptors during T-cell polarization | N/A, N/A, N/A, N/A, 20 § | N/A | N/A | N/A | N/A | STAT3, JAK1, STAT4, STAT1, LCK, IL4, JUN, IL1B, STAT6, JAK2 * |
| rctm0613 | Interferon gamma signaling | 26 **, N/A, 26 ¥, 22 †, 28 § | RTP4, FCER1G | N/A | PTPRC, RAC2, PHF11, AIF1, IFIH1, IFI44, FCGR1A, THEMIS2, CSF1R, ISG15 | RTP4 | SP100, HLA-A, IRF1, HLA-DQA1, IRF2, B2M *, IRF9 *, FCGR1A, IRF7, HLA-F |
| M17411 | JAK-STAT signaling pathway | N/A, N/A, 48 ¥, N/A, 49 § | N/A | N/A | TNFAIP2, TLR2, IRF1, LCP2, EVL, ZFP90, RAC2 | N/A | JAK1 *, JAK2 *, STAT3 *, STAT1, TYK2 *, JAK3, STAT5A, STAT6, IL4, PTPN11 |
| rctm0800 | Nuclear signaling by ERBB4 | N/A, N/A, N/A, N/A, 23 § | N/A | N/A | N/A | N/A | NOTCH1, NOTCH4 |
| rctm0647 | Lipid digestion, mobilization, and transport | N/A, N/A, 25 ¥, N/A, 25 § | N/A | N/A | MTMR11, CD36 | N/A | APOB, APOA1, APOE |
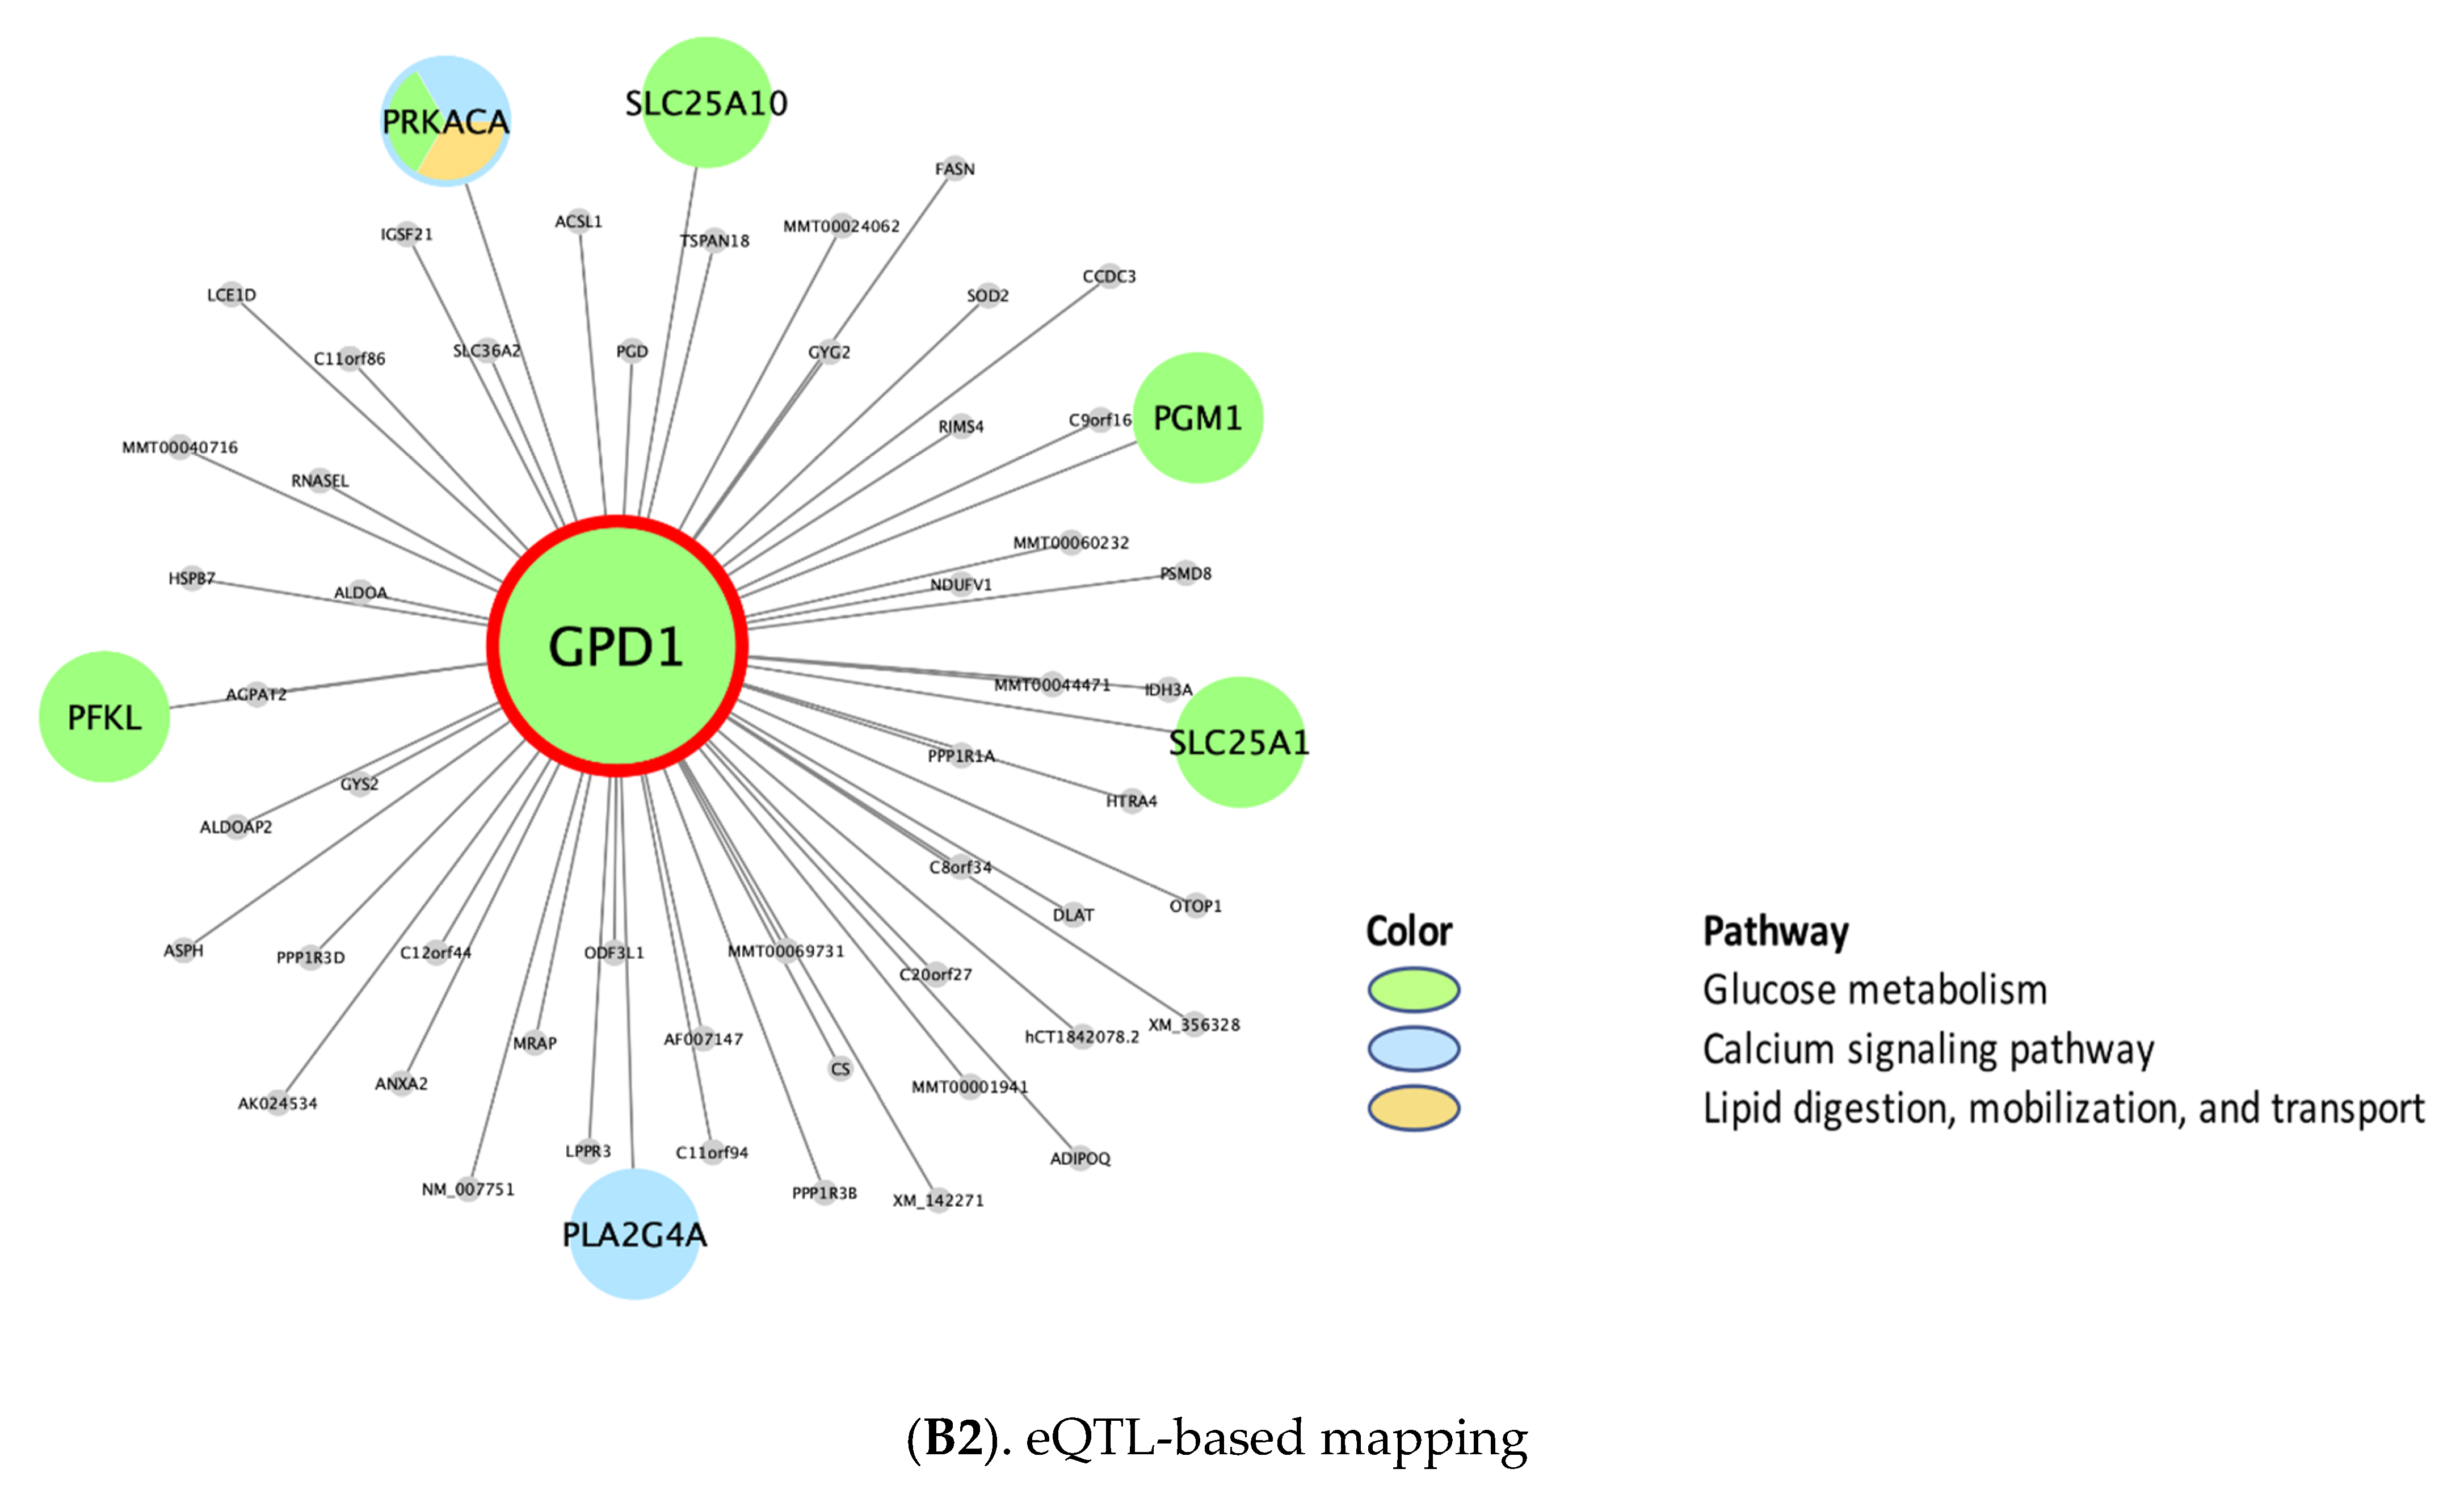
| rctm0501 .. | Glucose metabolism | 31 **, N/A, 30 ¥, N/A, 31 § | GPD1 | N/A | ANXA2, AKR1D1, LYRM5, CYP2C19, S100A10, EHHADH, SLC47A1, ERMP1, SLC10A1, CD36 | N/A | PGM1 *, ENPP1, GSK3B, PYGB *, PPP2R5C, PPP1CA, PPP2CB * |
| M2890 .. | Calcium signaling pathway | N/A, N/A, 67 ¥, N/A, 76§ | N/A | N/A | MAPK7, PLCG2, SYK, P2RY6, GPSM3, ARHGDIB | N/A | PRKCA *, ITPR1 *, GNAZ *, ITPR3 *, GNAI1, ITPR2 *, HRAS *, GNAO1, GNB5, MAPK3 * |
| rctm0475 .. | GPCR downstream signaling | N/A, N/A, 156 ¥, N/A, 183 § | N/A | N/A | PTPRCAP, FPR1 *, NM_011087, TRPM2, AF071180, AK016231, X51547, U96688, X15592, PIK3R5 | N/A | S1PR4, C5AR1, CCL5 *, CXCL10, CX3CR1, GPR18 *, CCR7, GPR183, CCL21, P2RY14 * |
Publisher’s Note: MDPI stays neutral with regard to jurisdictional claims in published maps and institutional affiliations. |
© 2021 by the authors. Licensee MDPI, Basel, Switzerland. This article is an open access article distributed under the terms and conditions of the Creative Commons Attribution (CC BY) license (https://creativecommons.org/licenses/by/4.0/).
Share and Cite
Jung, S.Y.; Papp, J.C.; Pellegrini, M.; Yu, H.; Sobel, E.M. Molecular Biology Networks and Key Gene Regulators for Inflammatory Biomarkers Shared by Breast Cancer Development: Multi-Omics Systems Analysis. Biomolecules 2021, 11, 1379. https://doi.org/10.3390/biom11091379
Jung SY, Papp JC, Pellegrini M, Yu H, Sobel EM. Molecular Biology Networks and Key Gene Regulators for Inflammatory Biomarkers Shared by Breast Cancer Development: Multi-Omics Systems Analysis. Biomolecules. 2021; 11(9):1379. https://doi.org/10.3390/biom11091379
Chicago/Turabian StyleJung, Su Yon, Jeanette C. Papp, Matteo Pellegrini, Herbert Yu, and Eric M. Sobel. 2021. "Molecular Biology Networks and Key Gene Regulators for Inflammatory Biomarkers Shared by Breast Cancer Development: Multi-Omics Systems Analysis" Biomolecules 11, no. 9: 1379. https://doi.org/10.3390/biom11091379
APA StyleJung, S. Y., Papp, J. C., Pellegrini, M., Yu, H., & Sobel, E. M. (2021). Molecular Biology Networks and Key Gene Regulators for Inflammatory Biomarkers Shared by Breast Cancer Development: Multi-Omics Systems Analysis. Biomolecules, 11(9), 1379. https://doi.org/10.3390/biom11091379