Article

Polycationic Monomeric and Homodimeric Asymmetric Monomethine Cyanine Dyes with Hydroxypropyl Functionality—Strong Affinity Nucleic Acids Binders

1
Laboratory for Biomolecular Interactions and Spectroscopy, Division of Organic Chemistry and Biochemistry, Ruđer Bošković Institute, P.O. Box 180, 10002 Zagreb, Croatia
2
Faculty of Chemistry and Pharmacy, Department of Pharmaceutical and Applied Organic Chemistry, Sofia University “St. Kliment Ohridski”, 1000 Sofia, Bulgaria
3
Department of Chemistry, Johannes Gutenberg Universität Mainz, Duesbergweg 10–14, 55128 Mainz, Germany
4
Laboratory of Experimental Therapy, Division of Molecular Medicine, Ruđer Bošković Institute, P.O. Box 180, 10002 Zagreb, Croatia
*
Authors to whom correspondence should be addressed.
These authors contributed equally.
Biomolecules 2021, 11(8), 1075; https://doi.org/10.3390/biom11081075
Submission received: 14 June 2021 / Revised: 15 July 2021 / Accepted: 19 July 2021 / Published: 21 July 2021
(This article belongs to the Special Issue Polynucleotides)

Abstract

:
New analogs of the commercial asymmetric monomethine cyanine dyes thiazole orange (TO) and thiazole orange homodimer (TOTO) with hydroxypropyl functionality were synthesized and their properties in the presence of different nucleic acids were studied. The novel compounds showed strong, micromolar and submicromolar affinities to all examined DNA ds-polynucleotides and poly rA–poly rU. The compounds studied showed selectivity towards GC-DNA base pairs over AT-DNA, which included both binding affinity and a strong fluorescence response. CD titrations showed aggregation along the polynucleotide with well-defined supramolecular chirality. The single dipyridinium-bridged dimer showed intercalation at low dye-DNA/RNA ratios. All new cyanine dyes showed potent micromolar antiproliferative activity against cancer cell lines, making them promising theranostic agents.

1. Introduction

The binding of small molecules to DNA/RNA was of scientific interest for decades because of the enormous biological significance of polynucleotides. Formation of the supramolecular complex of small molecule–DNA/RNA could influence processes in the living cell, like DNA replication, transcription to RNA and consequently protein synthesis [1,2,3]. Thus, many drugs owe their activity to a non-covalent interaction with DNA/RNA [4,5].
Usually, a small molecule is bound to a double-stranded (ds) polynucleotide by intercalation between base pairs, minor or major groove binding and/or external electrostatic binding [5]. There is a challenging task to design and synthesize a small molecule capable of strong binding combined with specific recognition of a certain structure type (e.g., AT-rich sequence or GC-rich sequence, DNA or RNA, single-stranded or double-stranded helix, a different type of helix, like A, B, Z, etc.) and also a specific binding response [6,7]. A combination of different functionalities and structural building blocks within the same ligand molecule could result in an enhanced number of non-covalent interactions, increased affinity and selective recognition of specific DNA/RNA structure. The change in the strength of these non-covalent interactions with the correspondent bioobjects can cause dramatic shifts in the photophysical properties of the fluorochromes. If the aggregation of the dyes on the surface of the target biomacromolecules produce the appearance of new absorption and/or new fluorescent signals or shifts of the existing ones, the commented phenomena are defined as biochromism and can be used as an indicator for the presence of definite bioanalytes.
The cyanine dyes are well known DNA/RNA fluorescent probes, with various bioanalytical applications, due to their strong enhancement of fluorescence upon binding to biomacromolecules [8]. Among cyanines, TOTO dye families showed high sensitivity comparable to radioactive probes [9]. Structural modifications and the introduction of different substituents take advantage to modify binding modes and affinities and signal upon complex formation. These modifications represent a model for studying the structure–function relationship [8].
In our previous work, we investigated the influence of steric restriction on cyanine dyes binding. It was noticed that dyes with bulky substituents on their long axis preferred minor groove binding instead of intercalation [10]. Asymmetric cyanines with large phosphonium substituents showed kinetic differentiation between homo and alternating AT-DNA sequences upon forming dimers within the DNA minor groove. They also discriminated homo and alternating GC-DNA sequences by the selectively induced CD signal [11]. Additional methylation of dyes yielded by the absence of kinetic AT selectivity, but also the appearance of the AT selective fluorescence response [12]. Chloro substitution of the oxazole yellow homodimer (YOYO) resulted in a specific fluorimetric response of ds-RNA compared to ds-DNA, while the chlorinated TOTO analogue revealed specific CD recognition of alternating-DNA sequences concerning homo-DNA and homo-RNA sequences [13]. Monomethine cyanine dyes based on thiazolo [4,5-b]pyridinium and quinolinium chromophores revealed higher sensitivity to DNA when compared to commercial dimeric cyanine dye TOTO-1 [14]. Further, we prepared a new series of monomeric and homodimeric cyanine dyes that represented structural modifications of TO (thiazole orange) and TOTO (thiazole orange homodimer) dyes: thioacetyl substituents and 2-hydroxypropyl substituents [15,16].
In this paper, we present new analogues of monomer TO and homodimer TOTO dyes (Scheme 1, Scheme S1). All new compounds were designed with a bulky 2-hydroxypropyl substituent connected to the benzothiazole nitrogen instead of the more compact methyl group in the molecules of TO and TOTO. The hydroxyl group could enable hydrogen bond formation with the phosphate groups in the nucleic acids chains ensuring various photophysical evinces. Symmetric homodimeric dyes were designed to study the effect of linker flexibility on binding, so three different positively charged linkers between the chromophore units were used: the most flexible trimethylenediammonium (4b), the more rigid aromatic trimethylenediammonium bridge (4c) and the bulky trimethylenediammonium bridge (4d and 4e) to explore the effect of linker flexibility on the binding. Additionally, 4e was more hydrophobic because of the chlorine atom on the 7-th position in the quinoline part.

2. Materials and Methods
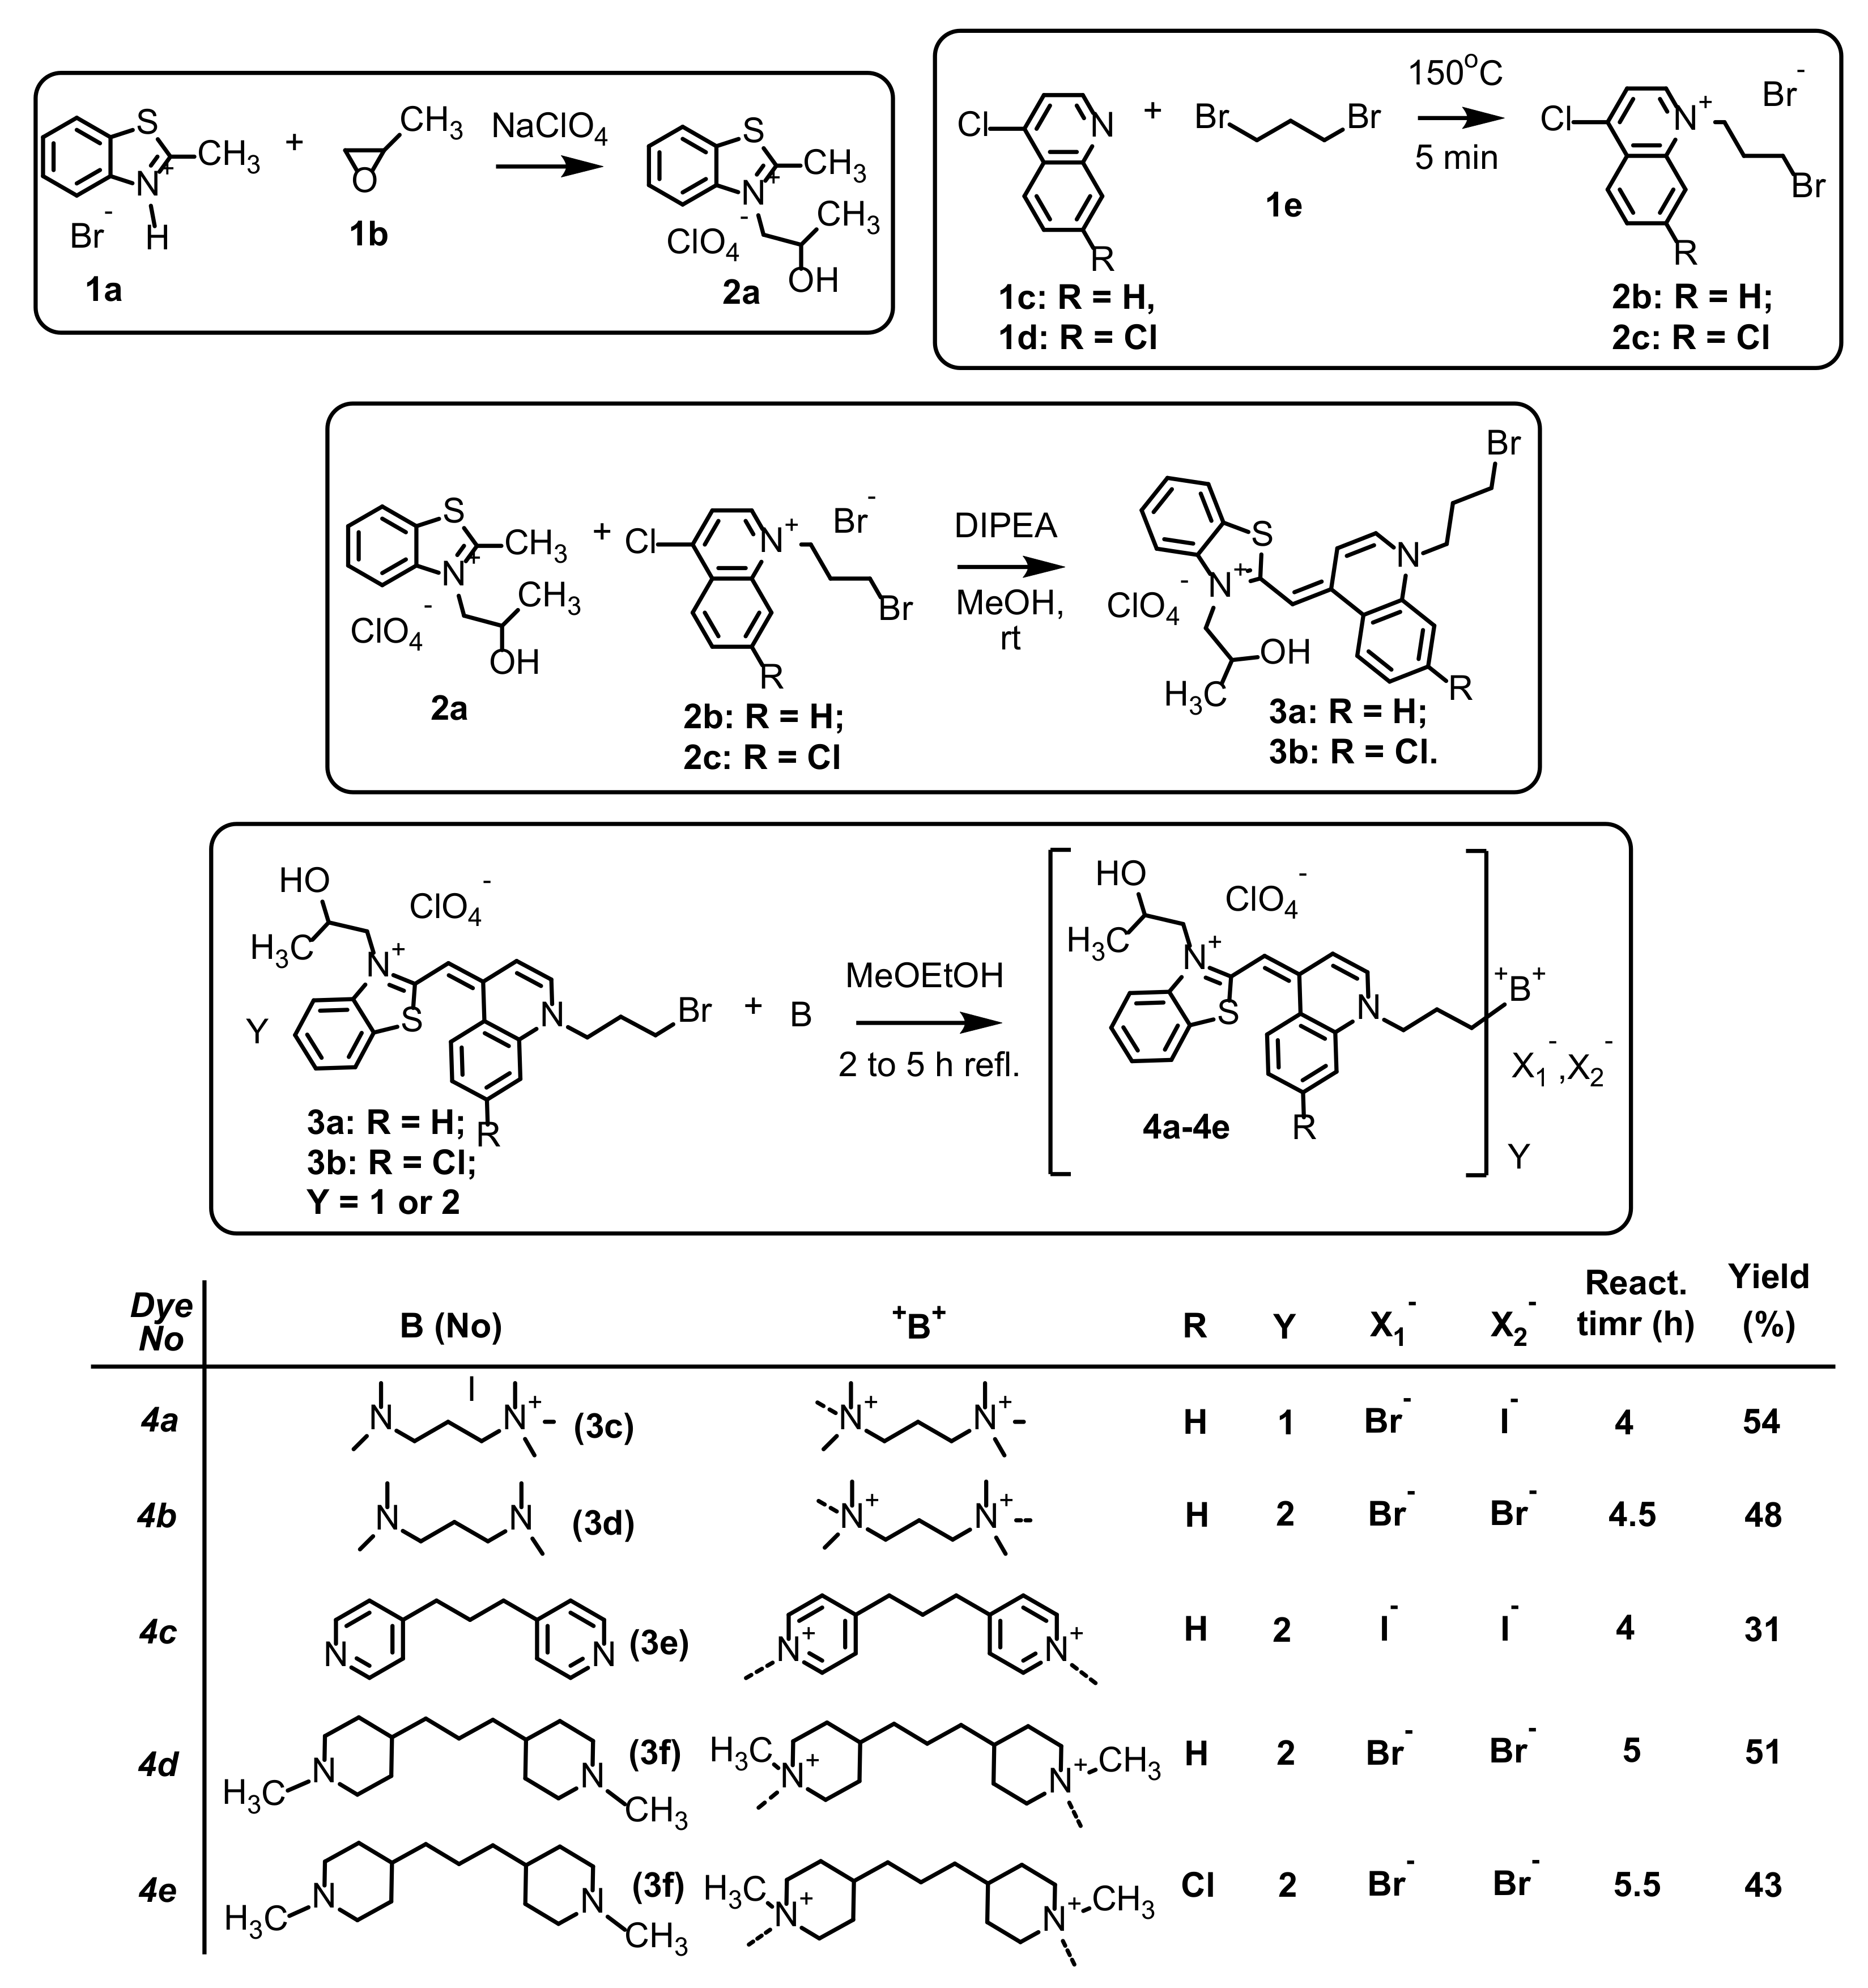
2.1. Synthesis

All solvents used in the present work were commercially available (Sigma, HPLC grade). The starting materials 1b and 1c1e were commercially available and were used as supplied. The intermediates 1a, 2a2c, 3a and 3b were prepared by our previously published procedure [15,17]. Melting points were determined on a Kofler apparatus and are uncorrected. NMR spectra were obtained on a Bruker Avance III 500 DRX 600 MHz (Bruker Biospin GmbH, Rheinstetten, Germany) spectrometer in DMSO-d6.

2.1.1. NMR Spectroscopy

Prior to the NMR experiments the samples were dissolved in a deuterated DMSO. The characterization of the TO derivatives was conducted on a DRX 400 Avance Bruker NMR spectrometer (Bruker Biospin GmbH, Rheinstetten, Germany) operating at the 1H frequency of 400.31 MHz and a 13C frequency of 100.66 MHz using a commercial Bruker 5 mm BBO dual channel probe head equipped with z-gradients. A Eurotherm 847 temperature controller with a ± 0.1° precision controlled the temperature. Variable temperature (VT) 1H experiments were conducted in the temperature range 25–60 °C with 2 min in each temperature step for equilibration in order to reduce aggregation, resp. increase the spectral resolution. All 1H NMR spectra were recorded using a 30° excitation pulse averaging 32 scans with a 2 s recycle delay. The 13C NMR spectra were acquired applying power gated decoupling scheme and 1k scans. 13C DEPT 135 (distortionless enhancement by polarization transfer) was recorded with 2k scans and 2 s repetition time. 13C APT (attached proton test) recorded with 10k scans and 2 s recycle delay experiments was used in some cases to help assign the 13C NMR resonances. The sequence was optimized on long-range couplings. The spectrometer was operated by Topspin 1.3 patchlevel 8 (Bruker Biospin GmbH, Rheinstetten, Germany). The 1H and 13C NMR spectra were referenced to external TMS at 0 ppm. All spectra were evaluated using Mestrec.

2.1.2. Synthesis of Dyes 4a–4e

In a 50 mL round bottom flask equipped with a reflux condenser and an electromagnetic stirrer were added 1 molar equivalent of the starting dye 3a (or 3b) and 1 molar equivalent for dye 4a or 2.2 molar equivalents for the dyes 4b4e the appropriate basic reagent (B, Scheme 1). The progress of the quaternization (in case of dye 4a) or bisquaternization in case of dyes 4b4e was monitored by TLC.
4a: Dark red amorphous solid, Mp > 300 °C. Yield 54%. 1H-NMR (δ(ppm), 50 °C, 2 min): 1.34 d (3H, CH3, 3JHH = 6.2 Hz), 2.19–2.22 m (2H, CH2), 2.28-2.34 m (2H, CH2), 3.09 s (6H, N+(CH3)2), 3.12 s (9H, N+(CH3)3), 3.29 t (2H, N+CH2, 3JHH = 8.3 Hz), 3.54 t (4H, N+CH2, 3JHH = 7.9 Hz), 4.15–4.29 brs (2H, N+CH2), 4.50 d (1H, N+CH, 3JHH = 7.9 Hz), 4.60 d (1H, N+CH, 3JHH = 7.8 Hz), 4.78–4.81 m (1H, CH), 5.19 brs (2H, N+CH2,) 7.06 s (1H, CH), 7.14 s (1H, CH), 7.77 dd (1H, CH, 3JHH = 7.2 Hz), 7.82 dd (1H, CH, 3JHH = 8.5 Hz), 8.06 d (1H, 3JHH = 7.8 Hz), 8.19 d (1H, 3JHH = 8.7 Hz), 8.56 d (1H, 3JHH = 6.0 Hz), 8.68 d (1H, 3JHH = 8.5 Hz). 13C-NMR: 16.65, 21.04, 22.36, 22.39, 50.38, 50.44, 50.70, 51.48, 52.54, 53.19, 53.22, 59.87, 60.52, 60.76, 61.76, 61.79, 64.40, 64.45, 89.27, 89.28, 107.74, 114.11, 117.87, 122.71, 123.86, 123.97, 124.18, 124.54, 124.69, 125.71, 126.85, 128.03, 133.31, 137.06, 140.75, 144.02, 148.28, 148.43, 161.17. 13C-NMR DEPT 135 (CH, CH3 positive, CH2—negative): 16.40 CH2, 20.79 CH3, 22.14 CH2, 50.19 CH3, 50.44 CH2, 52.29 CH3, 52.97 CH2, 52.62 CH2, 62.27 CH2, 61.50 CH2, 64.20 CH, 89.03 CH, 107.48 CH, 113.85 CH, 117.62 CH, 122.45 CH, 124.44 CH, 125.46 CH, 126.59 CH, 127.78 CH, 143.77 CH. Mw = 828.04. Chemical Formula: C31H45BrClIN4O5S. Elemental analysis: calc.; C 44.97; H 5.48; N 6.77; found: C 44.21; H 5.40; N 6.74.
4b: Dark red amorphous solid, Mp > 300 °C. Yield 48%. 1H-NMR (δ(ppm), 50 °C, 2 min): 1.34 d (6H, CH3, 3JHH = 6.2 Hz), 1.66–1.70 m (6H, CH2), 1.93 brs (4H, N+CH2), 3.12 brs (6H, N+CH3), 3.16 brs (6H, N+CH3), 3.34 brs (4H, N+CH2), 4.24 brs (4H, N+CH2), 4.66 t (4H, N+CH2, 3JHH = 6.9 Hz), 4.78 d (2H, N+CH, 3JHH = 7.0 Hz), 5.17 d (2H, N+CH, 3JHH = 7.1 Hz), 5.41–5.62 m (2H, CH), 7.06 s (2H, CH), 7.11 d (2H, CH, 3JHH = 9.0 Hz), 7.41 d (2H, CH, 3JHH = 7.04 Hz), 7.44 s (2H, CH, 3JHH = 7.29 Hz), 7.51 dd (2H, CH, 3JHH = 7.04 Hz), 7.60 d (2H, CH, 3JHH = 8.5 Hz), 7.62 d (2H, CH, 3JHH = 8.0 Hz), 7.67 d (2H, CH, 3JHH = 9.0 Hz), 7.71 dd (2H, CH, 3JHH = 7.1 Hz), 7.96 d (2H, 3JHH = 7.5 Hz), 8.01 dd (2H, 3JHH = 8.3 Hz), 8.57 d (2H, CH, 3JHH = 7.0 Hz), 8.63 dd (2H, CH, 3JHH = 8.8 Hz). 13C-NMR: 19.37, 20.44, 20.83, 21.05, 41.53, 50.56, 51.60, 52.25, 53.18, 56.62, 57.44, 64.37, 73.07, 79.83, 107.77, 108.23, 113,86, 114.06, 117.26, 117.32, 117.92, 117.98, 121.38, 122.66, 122.69, 123.73, 123.82, 123.93, 124.17, 124.28, 124.41, 124.65, 125.68, 126.68, 128.01, 129.25, 129.28, 129.35, 129.41, 131.24, 133.01, 133.16, 133.34, 133.53, 136.06, 136.11, 136.32, 140.72, 141.81, 144.07, 148.39, 165.34, 165.37. 13C-NMR DEPT 135 (CH, CH3 positive, CH2—negative): 19.11 CH3, 22.12 CH2, 28.07 CH2, 51.80 N+CH2, 52.00 N+CH2, 54.96 N+CH2, 56.40 N+CH2, 64.17 CHOH, 79.62 CH, 107.50 CH, 108.00 CH, 113.70 CH, 117.42 CH, 124.37 CH, 126.46 CH, 128.90 CH, 130.37 CH, 132.90 CH, 141.56 CH. Mw = 1241.97. Chemical Formula: C53H66Br2Cl2N6O10S2. Elemental analysis: calc.; C 51.26; H 5.36; N 6.77; found: C 49.01; H 5.33; N 6.73.
4c: Dark red amorphous solid, Mp > 300 °C. Yield 31%. 1H-NMR (δ(ppm), 50 °C, 2 min): 1.32 d (6H, CH3, 3JHH = 6.2 Hz), 2.04–2.08 m (2H, CH2), 2.57 t (2H, N+CH2, 3JHH = 6.7 Hz), 2.93 t (2H, N+CH2, 3JHH = 7.4 Hz), 4.21–4.25 m (4H, CH), 4.54 d (2H, 3JHH = 5.8 Hz), 4.66-4.75 m (4H, N+CH2), 7.08 s (2H, CH), 7.39–7.48 m (2H, CH), 7.58-7.61 m (2H, CH), 7.75-7.77 m (2H, CH), 7.96–7.99 m (2H, CH), 8.47 d (2H, CH, 3JHH = 7.2 Hz), 8.60 d (2H, CH, 3JHH = 8.3 Hz), 8.89 d (2H, CH, 3JHH = 8.3 Hz). 13C-NMR: 21.04, 22.39, 50.44, 52.54, 53.22, 59.87, 60.52, 60.76, 61.79, 64.45, 89.28, 107.74, 114.11, 117.87, 122.71, 123.86, 123.97, 124.18, 124.54, 124.69, 125.71, 126.85, 128.03, 133.31, 137.06, 140.75, 144.02, 148.28, 148.43, 161.17. 13C-NMR DEPT 135 (CH, CH3 positive, CH2—negative): 20.73 CH3, 29.81 CH2, 33.65 CH2, 50.66 N+CH2, 52.87 CH2, 57.04 N+CH2, 64.20 N+CH2, 88.85 CH, 107.56 CH, 113.68 CH, 117.56 CH, 122.38 CH, 124.44 CH, 125.29 CH, 126.63 CH, 127.42 CH, 127.82 CH, 133.04 CH, 143.58 CH, 143.68 CH. Mw = 1404.01. Chemical Formula: C59H62Cl2I2N6O10S2. Elemental analysis: calc.; C 50.47; H 4.45; N 5.99; found: C 50.49; H 4.31; N 5.72.
4d: Dark red amorphous solid, Mp > 300 °C. Yield 51%. 1H-NMR (δ(ppm), 50 °C, 2 min): 1.30–1.31 m (2H, CH2), 1.34 d (6H, CH3, 3JHH = 6.0 Hz), 1.60-1.65 m (4H, CH2), 1.66–1.71 m (4H, CH2), 2.06–2.13 m (2H, CH2), 3.10–3.28 m (4H, CH2), 4.22–4.28 m (4H, CH2), 4.59–4.70 m (4H, N+CH2), 4.87–4.97 m (4H, N+CH2), 5.18 d (2H, N+CH, 3JHH = 6.0 Hz), 5.39–5.41 m (2H, CH), 5.48–5.51 m (2H, N+CH), 6.71 s (2H, CH), 7.43–7.44 m (2H, CH), 7.60–7.66 m (2H, CH), 7.97–8.01 m (2H, CH), 8.27–8.38 m (2H, CH), 8.56–8.61 m (2H, CH). 13C-NMR: 19.78, 20.92, 21.54, 25.88, 27.91, 28.58, 51.27, 53.36, 55.68, 60.56, 64.92, 73.44, 79.94, 80.37, 89.45, 109.82, 114.44, 118.29, 123.12, 125.19, 126.19, 127.33, 129.34, 135.47, 135.88, 137.54, 141.22, 144.51, 151.87, 161.26, 166.10. Mw = 1350.16. Chemical Formula: C61H78Br2Cl2N6O10S2. Elemental analysis: calc. C 54.27; H 5.82; N 6.22; found C 53.29; H 5.38; N 5.95.
4e: Dark red amorphous solid, Mp > 300 °C. Yield 51%. 1H-NMR (δ(ppm), 50 °C, 2 min): 1.22–1.31 m (8H, 6CH3 + 2CH2), 1.61–1.68 m (4H, CH2), 2.28–2.31 brs (2H, CH2), 3.20–3.24 m (8H, CH2), 4.16–4.19 brs (4H, N+CH2), 4.50 t (4H, N+CH2, 3JHH = 5.2 Hz), 4.51–4.58 m (4H, N+CH2), 4.73 t (4H, N+CH2, 3JHH = 6.3 Hz), 5.22–5.43 brs (4H, N+CH2), 5.41–5.44 m (1H, CH), 5.48–5.52 m (1H, CH), 7.26–7.28 m (4H, CH), 7.55–7.61 m (2H, CH), 7.71 brs (2H, CH), 7.99 dd (2H, CH, 3JHH = 7.0 Hz), 8.05 dd (2H, CH, 3JHH = 8.3 Hz), 8.25 s (2H, CH), 8.43 dd (2H, CH, 3JHH = 5.5 Hz), 8.48 d (2H, CH, 3JHH = 7.1 Hz), 8.58 d (2H, CH, 3JHH = 7.1 Hz). 13C-NMR: 21.48, 51.85, 53.60, 53.70, 64.94, 90.08, 90.13, 108.42, 114.71, 117.62, 120.52, 123.12, 123.21, 123.31, 123.58, 124.52, 125.31, 127.32, 127.67, 128.02, 128.12, 128.17, 128.55, 130.07, 138.46, 138.69, 141.19, 148.07, 148.14, 148.23, 161.94. 13C-NMR DEPT: 16.57 CH2, 21.49 CH3, 27.61 CH2, 27.79 CH2, 28.26 CH2, 39.82 CH2, 51.41 N+CH2, 51.85 N+CH2, 53.58 N+CH3, 53.62 N+CH3, 64.92 N+CH3, 90.67 CH, 108.28 CH, 114.69 CH, 117.61 CH, 120.46 CH, 123.01 CH, 125.29 CH, 127.29 CH, 128.013 CH, 128.51 CH, 130.04 CH. Mw = 1419.04. Chemical Formula: C61H76Br2Cl2N6O10S2. Elemental analysis: calc.; C 51.63; H 5.40; N 5.92; found: C 51.55; H 5.42; N 5.93.

2.2. Study of DNA/RNA Interactions

2.2.1. General Procedures

The electronic absorption spectra of newly prepared compounds, UV–Vis titration and thermal melting experiments were measured on a Varian Cary 100 Bio spectrometer (Agilent, Santa Clara, CA, United States). Fluorescence spectra were recorded on a Varian Cary Eclipse fluorimeter (Agilent, Santa Clara, CA, United States). CD spectra were recorded on a JASCO J815 spectrophotometer (ABL&E Handels GmbH, Wien, Austria). UV–Vis, fluorescence and CD spectra were recorded using the appropriate 1 cm path quartz cuvettes. Polynucleotides were purchased as noted: calf thymus (ct)-DNA, poly dAdT–poly dAdT, poly dGdC–poly dGdC, poly dA–poly dT, poly dG–poly dC, poly rA–poly rU and poly rG–poly rC (Sigma) and dissolved in sodium cacodylate buffer, I = 0.05 mol dm−3, pH=7.0. The calf thymus (ct-) DNA was additionally sonicated and filtered through a 0.45 µm filter [18]. The polynucleotide concentration was determined spectroscopically and expressed as the concentration of phosphates [19,20,21]. Stock solutions of 4a4e compounds were prepared by dissolving compounds in H2O or DMSO; total DMSO content was below 1% in UV–Vis and below 0.1% in fluorimetric measurements. All measurements were performed in sodium cacodylate buffer, I = 0.05 mol dm−3, pH = 7.0. 4a4e concentrations below 2 × 10⁻⁵ M were used for the UV–Vis absorbance measurement to avoid intermolecular association.

2.2.2. UV/Vis, CD and Fluorescence Titrations

UV–Vis and fluorimetric titrations were performed by adding portions of polynucleotide solution into the solution of the studied compound. After mixing polynucleotides with studied compounds it was observed that equilibrium was reached in less than 120 s. UV–Vis titrations were measured in wavelengths between 400 and 600 nm. In fluorimetric titrations, the concentration of studied 4a4e compounds was 1–2 × 10⁻⁷ M. Although 4a4e compounds do not show intrinsic fluorescence, they show a significant fluorescence increase upon binding to polynucleotides. The excitation wavelength of λexc > 400 nm was used to avoid absorption of the excitation light caused by increasing absorbance of the polynucleotide. Emission was collected in the range λem = 550–650 nm. UV–Vis and fluorescence spectra were collected at r < 0.3 (r = [compound]/[polynucleotide]) to assure one dominant binding mode. Titration data obtained for ds-DNA and ds-RNA were processed using the Scatchard equation [22,23]. Calculations mostly gave values of ratio n = 0.2 ± 0.05, but for easier comparison, all Ks values were recalculated for fixed n = 0.2. Values for Ks have satisfactory correlation coefficients (>0.98). In the Scatchard equation [22,23] values of apparent stability constant (Ks) and ratio (n = [bound compound]/[polynucleotide]) are highly mutually dependent and a similar quality of fitting calculated to experimental data is obtained for ± 20% variation for Ks and n; this variation can be considered as an estimation of the errors for the given apparent binding constants. CD experiments were performed by adding portions of 4a4e compound stock solution into the solution of the polynucleotide (c = 1–2 × 10⁻⁵ mol dm−3). Examined 4a4e compounds were achiral and therefore do not possess intrinsic CD spectra. CD spectra were recorded with a scanning speed of 200 nm/min. Buffer background was subtracted from each spectrum, while each spectra was the result of five accumulations.

2.2.3. Thermal Melting Experiments

Thermal melting curves for ds-DNA, ds-RNA and their complexes with studied compounds were determined by following the absorption change at 260 nm as a function of temperature. The absorbance scale was normalized. Tm values are the midpoints of the transition curves determined from the maximum of the first derivative and checked graphically by the tangent method. The ΔTm values were calculated by subtracting Tm of the free nucleic acid from Tm of the complex. Every ΔTm value reported here was the average of at least two measurements. The error in ΔTm was ± 0.5 °C.

2.3. Evaluation of the Antiproliferative Effect

The growth inhibition activity was assessed according to the slightly modified procedure performed at the National Cancer Institute, Developmental Therapeutics Program [24].

2.3.1. Cell Lines and Culturing

Examined 4a4e compounds were dissolved in DMSO (1 × 10⁻² mol dm−3). The experiments were carried out on 4 human cell lines. The cell lines purchased from the American Type Culture Collection (ATCC, Poland) were used: H460 (lung carcinoma, large cell lung cancer (ATCC®HTB-177™)), MCF-7 (breast adenocarcinoma, ATCC® HTB-22™), HCT116 (colorectal carcinoma ATCC® CCL-247™) and HEK 293 (embryonic kidney cells); ATCC® CRL-1573™).
Cells were cultured as monolayers and maintained in Dulbecco’s modified Eagle medium (DMEM), supplemented with 10% fetal bovine serum (FBS), 2 mM of L-glutamine, 100 U/mL of penicillin and 100 μg/mL of streptomycin in a humidified atmosphere with 5% CO2 at 37 °C.

2.3.2. Proliferation Assays

The panel cell lines were inoculated onto a series of standard 96-well microtiter plates on day 0, at 1 × 10⁴ to 3 × 10⁴ cells/mL, depending on the doubling times of a specific cell line. Test agents were then added in five 10-fold dilutions (10−8 to 10−4 M) and incubated for a further 72 h. Working dilutions were freshly prepared on the day of testing. The solvent was also tested for eventual inhibitory activity by adjusting its concentration to be the same as in working concentrations. After 72 h of incubation, the cell growth rate was evaluated by performing the MTT assay, which detects dehydrogenase activity in viable cells [25]. The MTT cell proliferation assay is a colorimetric assay system, which measures the reduction of a tetrazolium component (MTT) into an insoluble formazan product by the mitochondria of viable cells. For this purpose, the substance treated medium was discarded and MTT was added to each well at a concentration of 20 μg/40 μL. After four hours of incubation, the precipitates were dissolved in 160 μL of dimethyl-sulfoxide (DMSO). The absorbance (OD, optical density) was measured on a microplate reader at 570 nm. The absorbance is directly proportional to the cell viability. The percentage of growth (PG) of the cell lines was calculated according to one or the other of the following two expressions:
If (mean ODtest − mean ODtzero) ≥ 0 then
PG = 100 × (mean ODtest − mean ODtzero)/(mean ODctrl − meanODtzero).
If (mean ODtest − mean ODtzero) < 0 then:
PG = 100 × (mean ODtest − mean ODtzero)/ODtzero.
where:
Mean ODtzero = the average of optical density measurements before exposure of cells to the test compound.
Mean ODtest = the average of optical density measurements after the desired period.
Mean ODctrl = the average of optical density measurements after the desired period with no exposure of cells to the test compound.
Each test point was performed in quadruplicate in two individual experiments. The results were expressed as GI50, a concentration necessary for 50% inhibition. Each result was a mean value from at least two separate experiments. The GI50 values for each compound were calculated from dose–response curves using the linear regression analysis by fitting the test concentrations that give PG values above and below the respective reference value (e.g., 50 for GI50). Therefore, a “real” value for any of the response parameters is obtained only if at least one of the tested drug concentrations falls above, and likewise at least one falls below the respective reference value. If however, for a given cell line all of the tested concentrations produce PGs exceeding the respective reference level of effect (e.g., PG value of 50), then the highest tested concentration is assigned as the default value. In the screening data report, that default value is preceded by a “>” sign.

2.3.3. Confocal Microscopy

H460 cells were treated with 1 µM of 4c compound for 60 min at 37 °C, 5% CO2 and incubated with 100 nM MitoTracker® (Thermo Fisher Scientific Inc.) and 20 mM Hoechst 33342 solution for 20 min at 37 °C (Thermo Fisher Scientific Inc.). Cells were analyzed by confocal microscopy (Leica SP8 X confocal microscope, Wetzlar, Germany). Excitation and emission wavelengths were as followed: λexc = 484 nm and λem = 538 nm for 4c; λexc = 644 nm and λem = 665 nm for MitoTracker® Deep Red; λexc = 361 nm and λem = 497 nm for Hoechst 33342.

3. Results and Discussion

3.1. Synthesis

The starting compounds 2-methylbenzo [d]thiazol-3-ium bromide 1a, 3-(2-hydroxypropyl)-2-methylbenzo [d]thiazol-3-ium perchlorate 2a, 1-(3-bromopropyl)-4-chloroquinolin-1-ium bromide 2b and 1-(3-bromopropyl)-4,7-dichloroquinolin-1-ium bromide 2c and the initial dyes (E)-2-((1-(3-bromopropyl)quinolin-4(1H)-ylidene)methyl)-3-(2-hydroxypropyl)benzo [d]thiazol-3-ium perchlorate 3a and (E)-2-((1-(3-bromopropyl)-7-chloroquinolin-4(1H)-ylidene)methyl)-3-(2-hydroxypropyl)benzo [d]thiazol-3-ium perchlorate 3b were prepared according to the procedures previously published by our group (Scheme 1) [15,16,17].
The quaternization of 2-((1-(3-bromopropyl)quinolin-4(1H)-ylidene)methyl)-3-(2-hydroxypropyl)benzo [d]thiazol-3-ium perchlorate 3a with 3-(dimethylamino)-N,N,N-trimethylpropan-1-aminium iodide 3c for the preparation of dye 2-((1-(3-(dimethyl(3-(trimethylammonio)propyl)ammonio)propyl)quinolin-4(1H)-ylidene)methyl)-3-(2-hydroxypropyl)benzo [d]thiazol-3-ium diiodide perchlorate 4a was performed in 2-methoxyethanol. Similarly, the bisquaternization of 3a and 3b (Scheme 1) with N,N,N,N-tetramethyl-1,3-propanediamine 3d, 1,3-di(4-pyridyl)propane 3e and 4,4′-Trimethylenebis(1-methylpiperidine) 3f were carried out in the same solvent and the reaction progress was followed by TLC monitoring. The reaction yields are from moderate to relatively low probably because of reactions of the Hoffmann elimination illustrated as mobile red spots on the TLC chromatogram. The chemical structures were proved by 1H-NMR, 13C-NMR and DEPT at different temperatures because of the solubility issues and elemental analysis. In the 1H-NMR spectra of the final dyes, the most characteristic are the ABX-protons from the 2-hydroxypropyl fragment (N+CH2CHOH) appearing as multiplets in the range 4.5–5.7 ppm (Materials and Methods). The NMR spectra were measured at different temperatures to increase the solubility of the dyes and avoiding aggregate formation. The best resolution was obtained at 50 °C.

3.2. Characterization of the Photophysical Properties of Dyes 4a4e in the Aqueous Medium

The compounds 4a4c were moderately soluble in water (about c = 1 × 10⁻⁴ mol dm−3), while 4d and 4e stock solutions were prepared in DMSO (about c = 5 × 10⁻³ mol dm−3). Thiazole orange (TO) and its homodimer TOTO had a strong tendency to aggregate in an aqueous solution and also on biological surfaces [26,27,28]. Oppositely, absorbencies of aqueous solutions of all studied compounds were proportional to their concentrations up to c = 2–4 × 10⁻⁵ mol dm−3, indicating that there was no significant intermolecular stacking, which would result in hypochromic effects. UV–Vis spectra of aqueous solutions of all examined compounds did not change significantly during heating up to 90 °C; all minor changes were reversible after cooling back to room temperature. Absorption maxima and corresponding molar extinction coefficients (ε) were given in the Supplementary Materials, Figure S1. TOTO (thiazole orange homodimer) showed a strong absorption peak at 480 nm and a somewhat weaker absorption peak at 512 nm. [9] Many monomethine cyanines manifested multiple bands, which were attributed to different vibronic bands of the same electronic transition [29]. New homodimer compounds 4b4d, analogues of TOTO, showed very similar absorption spectra: the strong signal at 480 ± 4 nm and the weaker signal at 515 ± 5 nm (Table S1, Figure S1) indicating the formation of a stable intramolecular H-aggregate. Aqueous solutions of compounds 4a4e at concentrations c = 1 × 10⁻⁶ mol dm−3 did not show any fluorescence even at the highest sensitivity of the instrument.

3.3. Interactions of 4a4e with ds-Polynucleotides in an Aqueous Medium

Synthetic ds-polynucleotides with different base compositions and/or types of helical structures were chosen for the assay to examine the binding of dyes to different types of DNA/RNA binding sites (intercalation or groove binding). For example, poly dAdT–poly dAdT represented the typical B-helical structure (having an ideal minor groove for small molecule binding), while poly rA–poly rU was a classic A-helical structure with a major groove more suited for small molecules (Table S2).

3.3.1. Thermal Melting Studies

Non-covalent binding of small molecules to ds-polynucleotides usually has a certain effect on the thermal stability of helices thus giving different Tm values (temperature of dissociation of the double-stranded helix into two single-stranded polynucleotides) [30]. Thermal denaturation experiments (Table 1, Figures S2–S9) revealed that all examined compounds stabilized the double helices of the examined DNA polynucleotides.
Monomer compound 4a showed strong stabilization of both DNA and RNA double helixes. It also demonstrated the strong nonlinear dependence of ΔTm values on the ratio r ([compound]/[polynucleotide]), suggesting saturation of binding sites at r ≈ 0.2 for DNA and r ≈ 0.15 for RNA (Figures S2–S9).
Surprisingly, the foreseen synergistic effect in dimer failed, so dimer compounds 4b, 4d and 4e showed significantly weaker stabilization of DNA polynucleotides than monomer 4a and negligible/no stabilization of RNA. The weaker stabilization of ds-polynucleotides by 4d and 4e was probably the consequence of their binding/aggregation within polynucleotide hydrophobic grooves with a weaker impact on double helix stability. Additionally, no difference in ΔTm values for 4d and 4e was observed, indicating no influence of the chloro-substituent to double helix stabilization. Considering the A-helix structure of poly rA–poly rU, the lack of RNA stabilization suggested no intercalation or only partial intercalation of examined dyes.
Among all dimer compounds, 4c with an aromatic di-pyridinium linker between dye units showed the strongest ds-DNA stabilization, which was similar as obtained for the monomer in the case of ct-DNA and even stronger in the case of poly dAdT–poly dAdT (Table 1). Surprisingly, 4c stabilized poly rA–poly rU at lower r ratios (r < 0.2) but strongly destabilized it at higher ratios (r ≥ 0.2). High stabilizations observed for poly rA–poly rU caused by 4c could indicate intercalation and possible bisintercalation as a main binding mode. 4c might have stabilized polynucleotide by intercalation according to the neighbor exclusion principle [31,32] at lower r ratios (r < 0.2). At higher ratios, all intercalation binding sites were occupied, while the RNA groove was not suitable for binding. Consequently, ds-polynucleotide was destabilized. This destabilization could cause RNA uncoiling or formation of the colloid particles upon complex aggregation followed by absorbance increase.

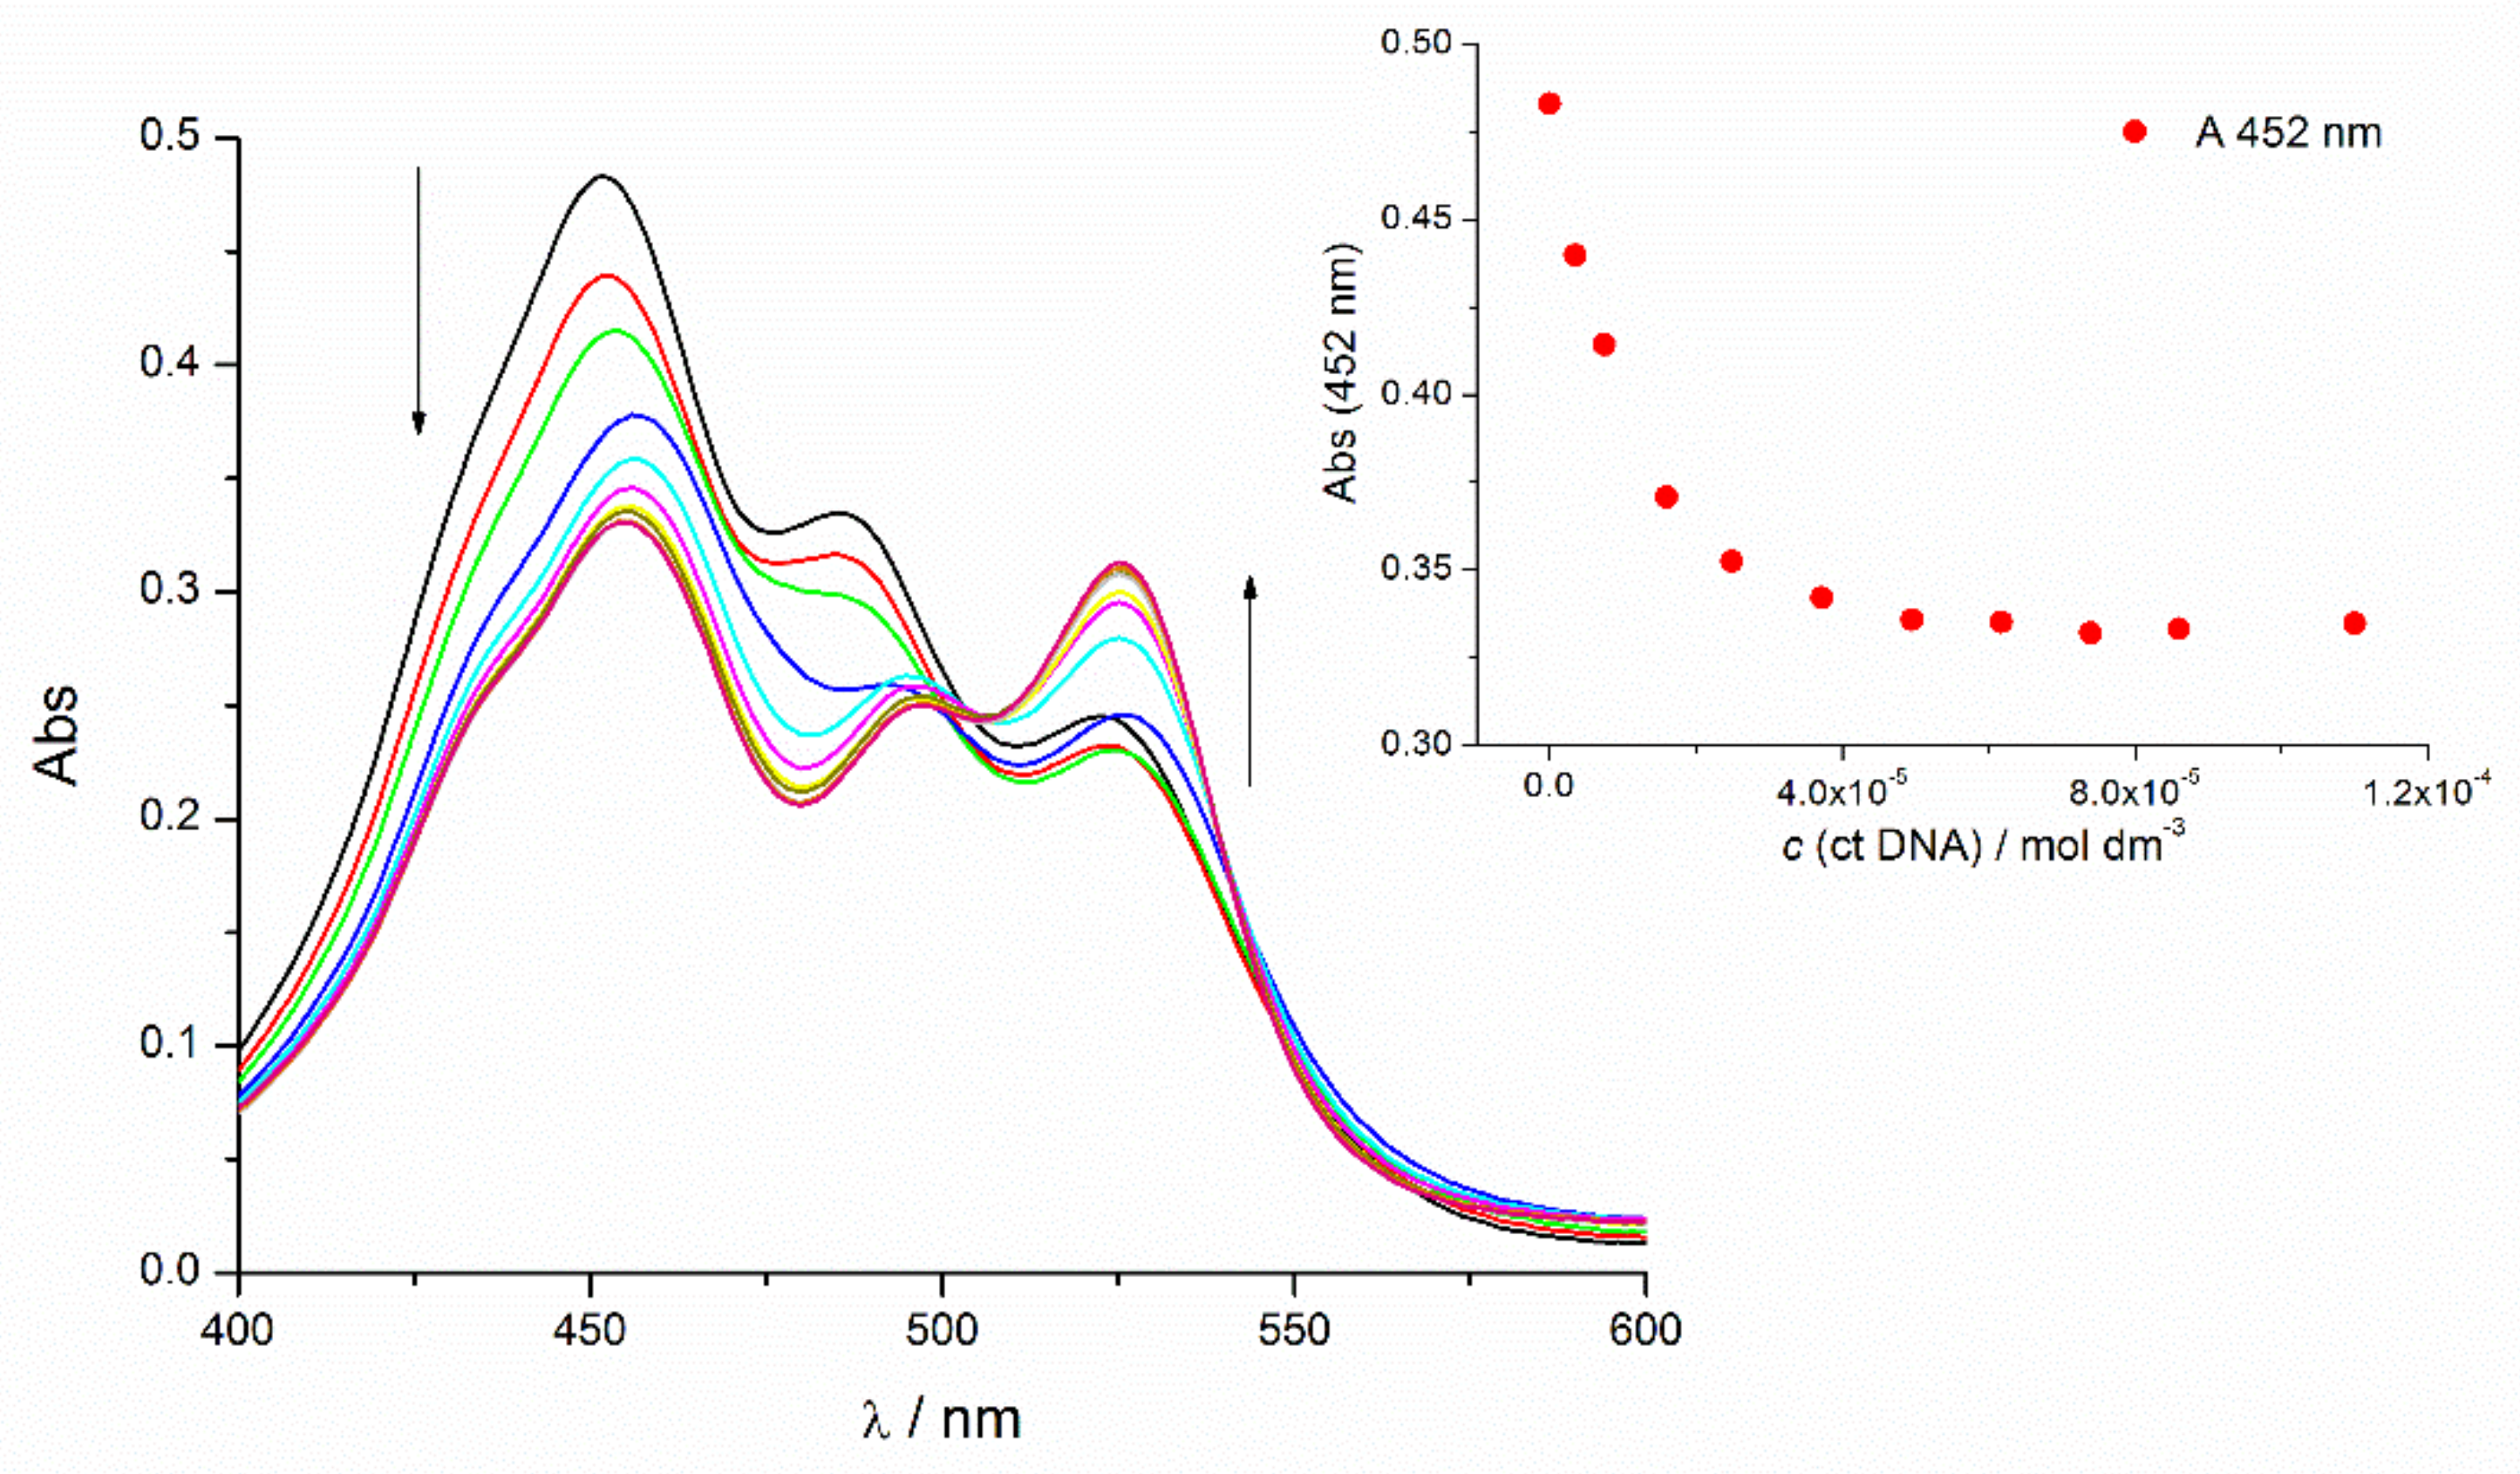
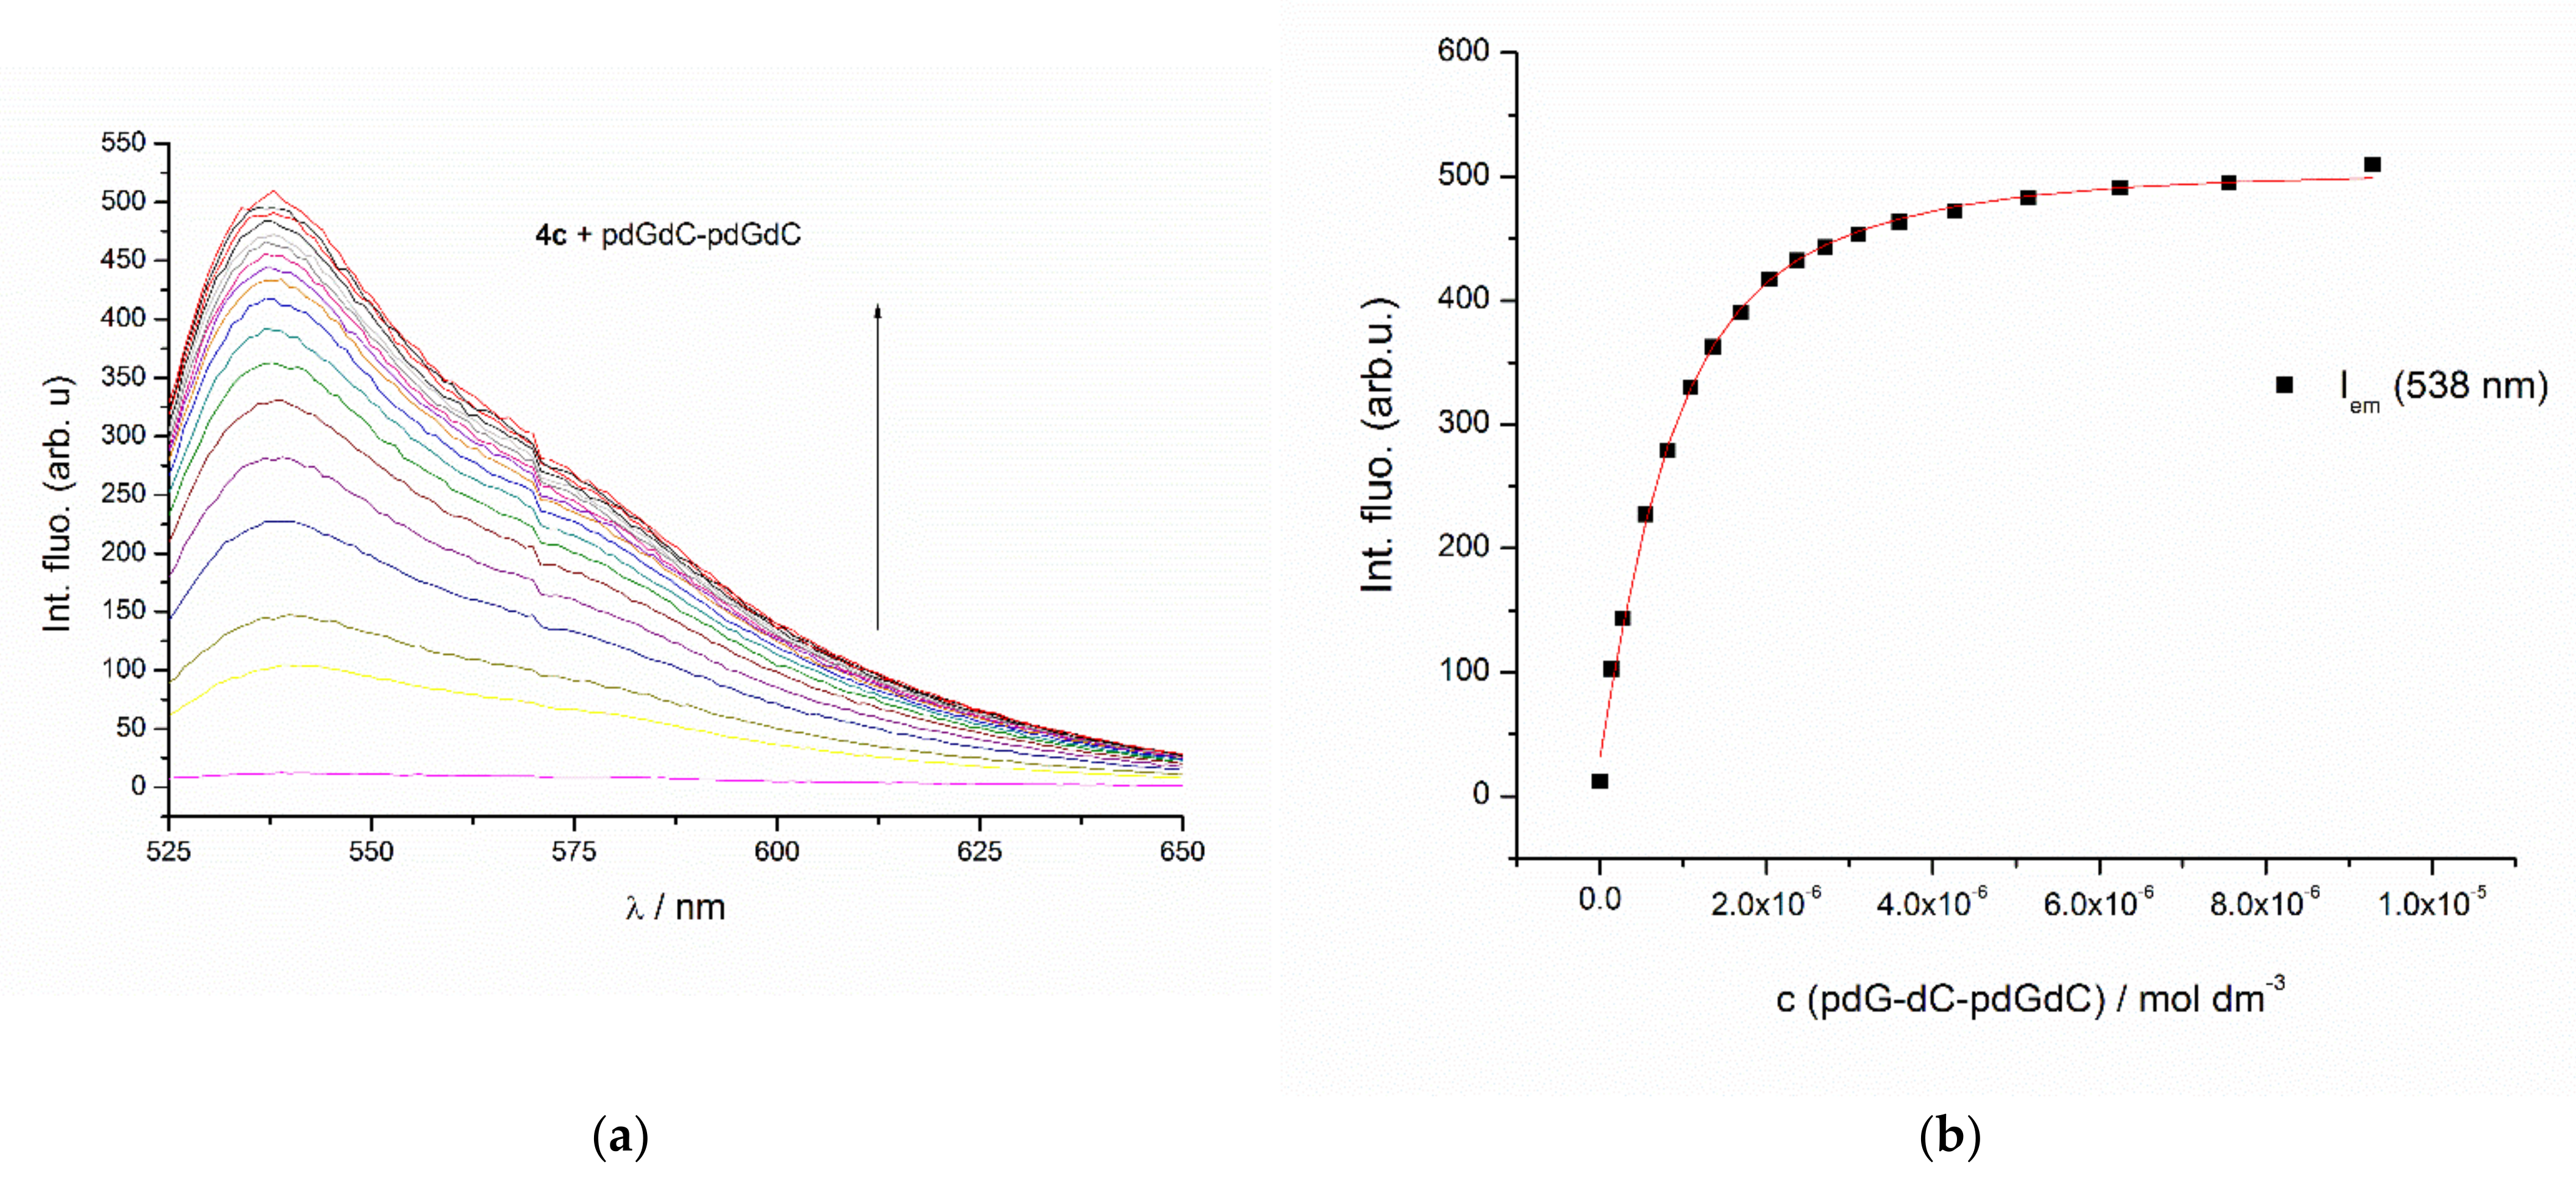
3.3.2. Spectrophotometric Titrations

The addition of ct-DNA to the solution of 4a caused the hypochromic effect typical for the monomeric TO and bathochromic shift of the compound’s UV–Vis spectra. As a result of the titration of dimer compounds 4b4e with ct-DNA, the hypochromic effect and the small bathochromic shift occurred for the signal at 480 ± 4 nm indicating an interaction of the ct-DNA and intramolecular H-aggregate. The absorption peak at 515 ± 5 nm increased significantly, with a bathochromic shift combined with a hyperchromic effect typical for TO monomer intercalation (Figure 1, Figure S10, Table S3). The longer wavelength absorption maximum at 525 nm appeared increasing ratiometrically with an increase of ct-DNA concentration. This systematic deviation of the isosbestic points in the Vis region (e.g., about 500 nm, Figure 1) and pointed out more spectroscopically active species and more than one dominant binding mode: probably J-aggregation on the ct-DNA surface.
Cyanine dyes were usually non-fluorescent in water due to the non-radiative torsional angle rotation and vibrational relaxation about the semi-single bond. It was characteristic for cyanines to increase their fluorescence emission significantly upon binding to the protein or polynucleotide, due to restricted internal rotation and conformational mobility of the dye within the binding site [8]. The H-aggregates of the monomeric and homodimeric asymmetric monomethine cyanine dyes also demonstrated insignificant intrinsic fluorescence in water solutions caused by structure rigidity. Surprisingly compounds 4a4e did not show any intrinsic fluorescence, but their complexes with polynucleotides showed a notable one (Figure 2, Figures S12–S18)—a behavior typical for the acridine orange analogues (EvaGreen for example) [33]. As a result of fluorimetric titrations of 4a4e with natural (ct-DNA) and synthetic double-stranded DNA and RNA, apparent stability constants of dye-DNA (RNA) complexes were calculated using the Scatchard equation [22,23]. All examined compounds showed a strong, micromolar and submicromolar affinities for most examined ds-polynucleotides (Table 2).
It was interesting to note no significant differences in apparent stability constants for monomer 4a and dimer–polynucleotide complexes occurred. These similar constants probably excluded bisintercalation of dimer dyes as their dominant binding mode, because bisintercalation would cause stability constants at least one order higher compared to the monomer dye. Additionally, in most cases, affinities for different ds-polynucleotides were very similar. However, there were a few exceptions. All compounds showed a more than one magnitude lower stability constant for poly rG–poly dC than for other polynucleotides, including RNA poly rA–poly rU. Further, TOTO structural analogue 4b revealed one magnitude higher affinity for RNA poly rA–poly rU compared to other dimer dyes. Dimer molecules with the di-pyridinium (4c) and di-piperidinium linker between cyanine units (4d and 4e) showed higher stability constants for GC-DNA-polynucleotides over the AT-DNA-polynucleotide (Table 2). All dimers also revealed a significant fluorescence increase upon binding to GC sequences (Figure 3), with a noticeable higher response for GC than AT base pairs, which was probably influenced by interactions of the positively charged linker with GC base pairs positioned within the polynucleotide groove.

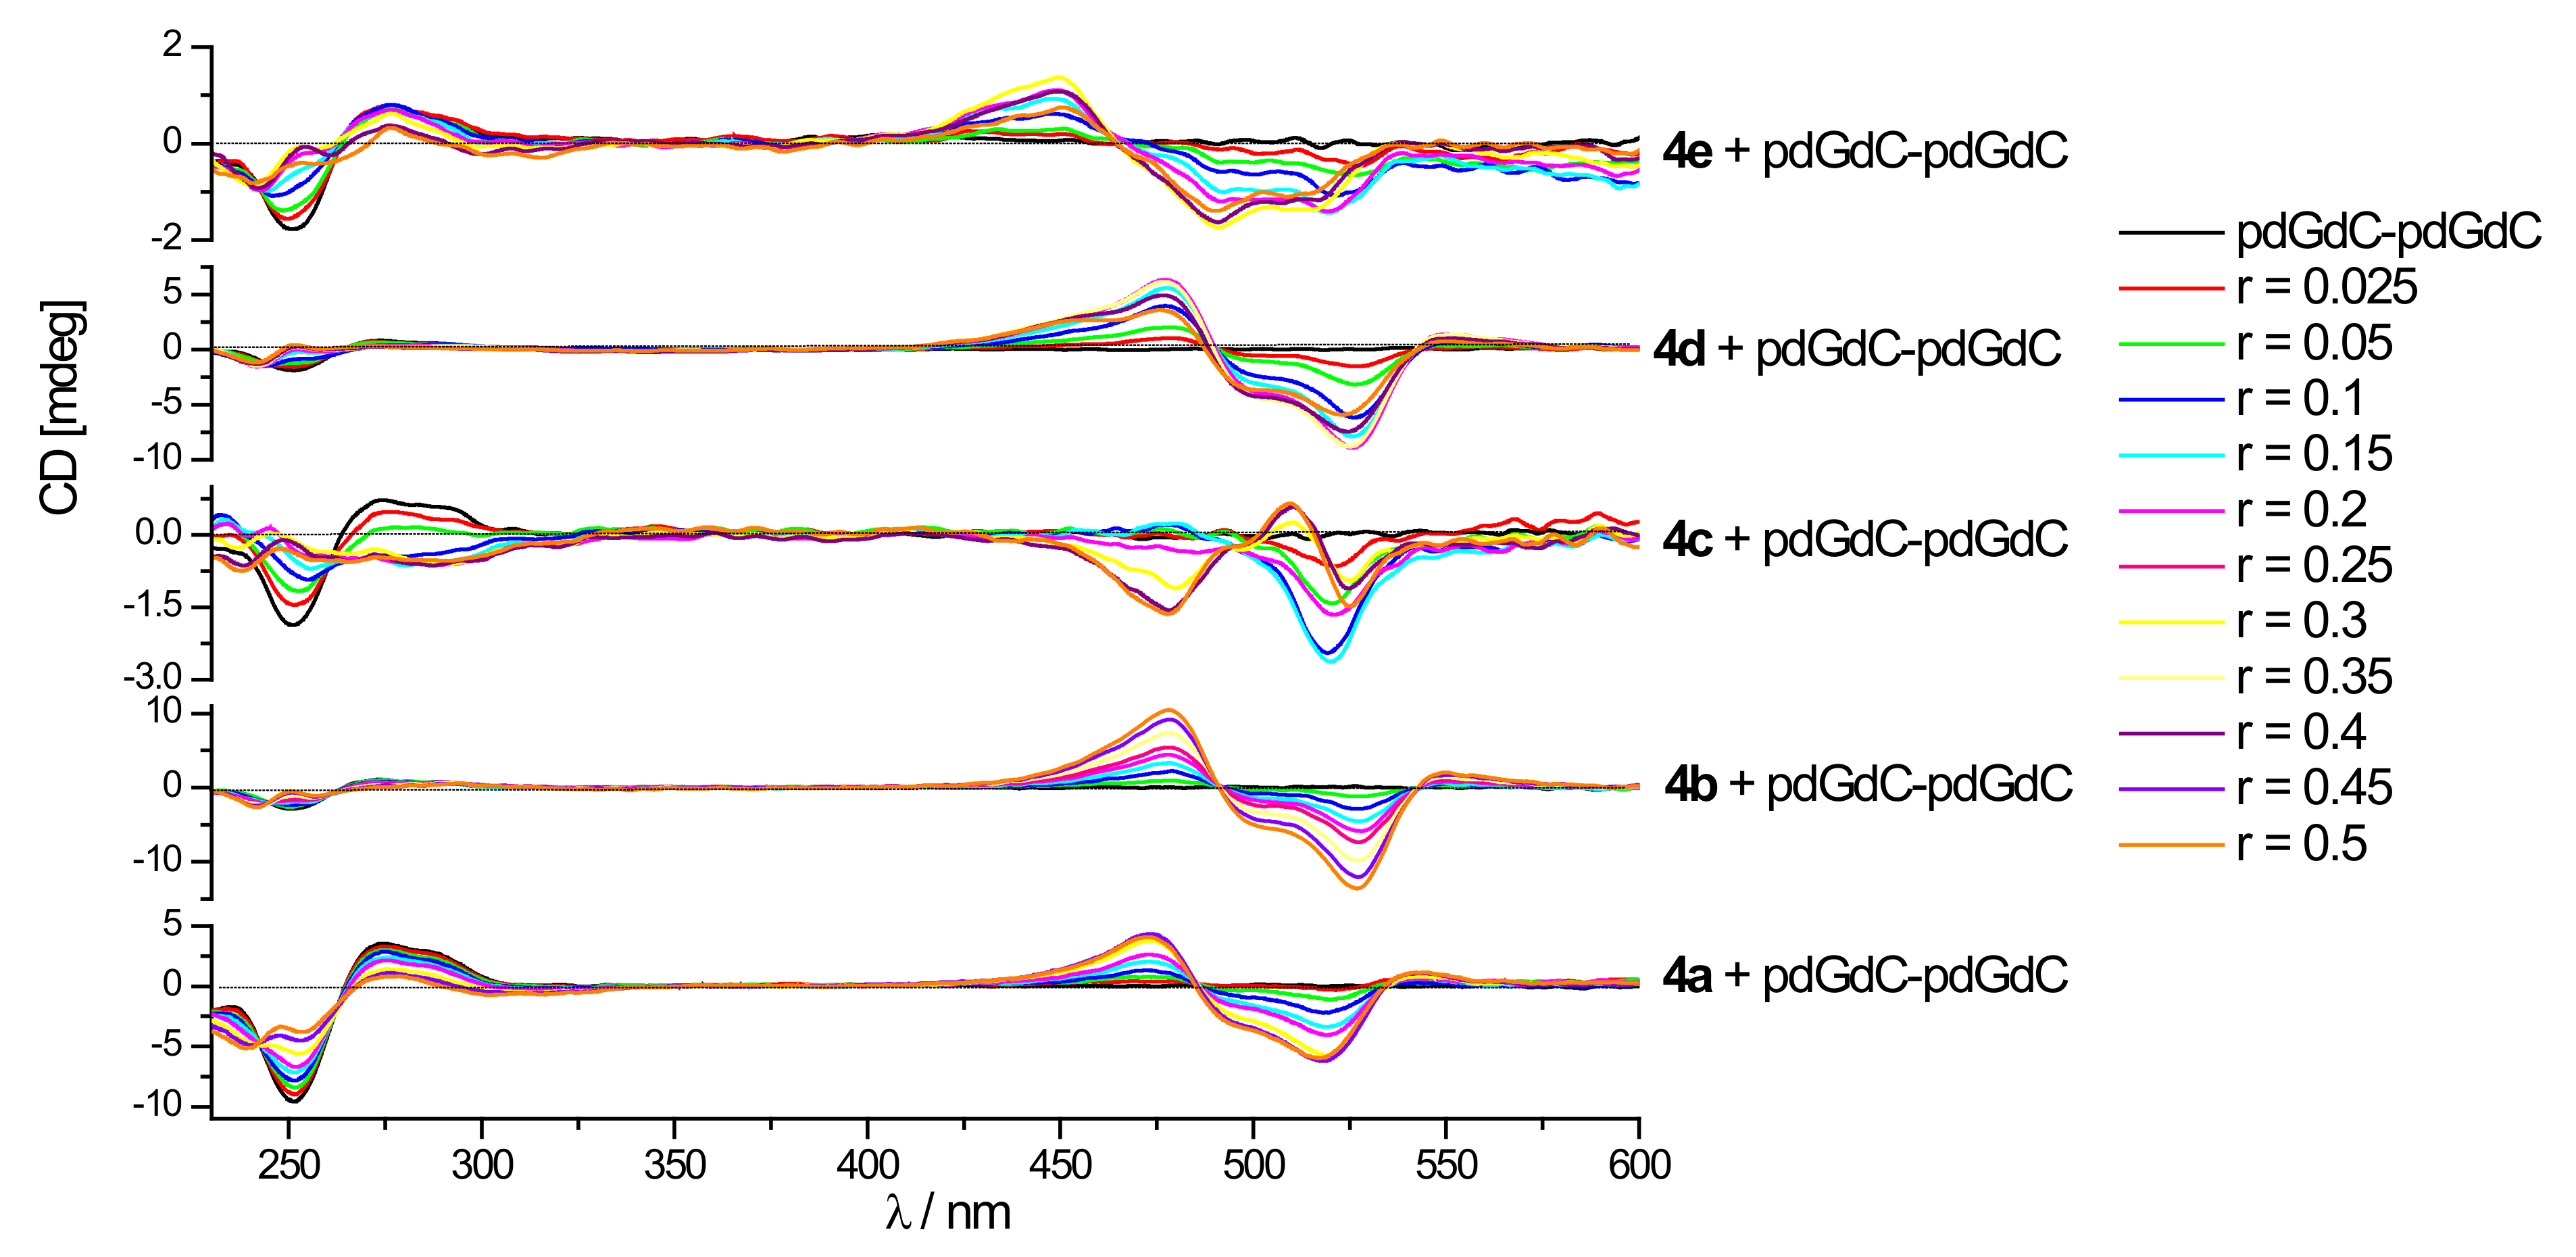
3.3.3. Circular Dichroism (CD) Experiments

CD spectroscopy was performed to observe conformational changes of polynucleotide secondary structure induced by the complexation of cyanine dyes. It is important to note that 4a4e were achiral and without intrinsic CD spectra. It was well known that the binding of a small molecule to chiral polynucleotide could induce the CD signal (ICD) of achiral dye. Induced CD spectra pointed specific, uniform orientation of dye concerning the helical axis and pseudo dyad axis, indicating the mode of interaction (intercalation, groove binding, agglomeration, etc.) [33,34,35,36,37].
The addition of cyanine dyes to polynucleotide solutions decreased the CD spectra of all examined polynucleotides (240–300 nm range) and produced intense ICD spectra in the region corresponding to the compound’s absorption (400–550 nm range, Figure 4, Figures S19–S23). A significant decrease of polynucleotide CD spectrum usually indicated impairment of helical chirality due to intercalation of the dye or binding of bulky molecules within the polynucleotide groove [38]. Strongly pronounced non-linear dependence of changes in CD spectra on the ratio r pointed toward saturation of dominant binding sites at about r = 0.2 in most of the cases. These r values were in good agreement with the non-linear dependence of ΔTm values on the ratio r in thermal melting experiments (Table 1).
These different ICD signals obtained for different polynucleotides were the consequence of the adaptation of both dimer dye and structurally different polynucleotides. For example, DNA B-helices had different dimensions of their deep/narrow minor groove (Table S2) and/or different steric restrictions (e.g., guanine amino groups that were interchangeably spaced within the minor groove of poly dGdC–poly dGdC). Further, RNA A-helices had a shallow minor groove, deep/narrow major groove, etc.
The TO analogue, monomer 4a, mostly gave strong bisignate ICD signals at 470 and 520 nm upon binding, indicating aggregation of the dye within the polynucleotide groove, that was used as a template (minor groove for DNA polynucleotides or major groove for poly rA–poly rU, Table S2). Well-defined isodichroic points in ICD bands suggest only one type of aggregate formed, most likely dimeric. The binding of 4a to GC RNA caused only a negligible change of the polynucleotide and weak negative ICD (Figure S19).
The TOTO analogue, dimer 4b showed a similar pattern upon binding to all examined DNA: a decrease of the polynucleotide CD signal and very strong bisignate signals at 478 and 525 nm (triple or more times stronger than DNA CD signal) combined with an additional small positive ICD band at 552 nm, which supported uniform aggregation of ligand chromophores along the polynucleotide chiral helix with well-defined supramolecular chirality [38]. Binding to RNA poly rA–poly rU resulted in a small negative ICD that suggested intercalation of the dye, while the change of poly rG–poly rC was negligible (Figure S20). The flexible propylene-ammonium linker of 4b probably enabled the best fitting into polynucleotides grooves among all examined dyes. This resulted in the uniform binding pattern and rarely strong ICD signals.
Dimer 4c had an aromatic bispyridinium linker between two cyanine units, which was sterically more demanding, more bulky and rigid than the TOTO polypropylene-ammonium linker. This linker also enabled additional hydrophobic π–π interactions with polynucleotide bases within the groove. It was interesting to note a change of DNA CD spectra upon titration with 4c: homo DNA polynucleotides strongly decreased their spectra, while alternating polynucleotides, including ct-DNA, inverted their CD spectra that demonstrated a significant influence of the 4c linker and very strong perturbation of polynucleotide helicity (Figure S21). This was a unique CD response among other examined compounds. The ICD spectra of 4c (Figure 4, Figures S19–S23) showed a rather complicated pattern with systematic deviation from isodichroic points, probably because of different binding modes. ct-DNA and alternating AT DNA represented the typical B-helix having a deep and narrow minor groove. Binding of 4c to these DNA polynucleotides induced a small negative CD band at 525 nm for r ≤ 0.1 that agreed well with the intercalation or eventual bisintercalation. With an excess of ligand over polynucleotide binding sites (r > 0.2), strong bisignate ICD bands at 480 and 535 nm appeared as a result of uniform aggregation/dimerization within the B helix groove. 4c showed strong negative ICD signals at 480 and 530 nm upon binding to both alternating and homo GC DNA up to r ≤ 0.2 probably related to the intercalation. Bisignate bands showed up at r ≥ 0.3. CD titration of RNA with 4c resulted in a decrease of the polynucleotide signal for both AU and GC RNA. Negative ICD signals at r < 0.15 related to intercalation and bisignate signals related to aggregation were much more pronounced with AU than GC RNA.
Dimer dyes 4d and 4e possessed an aliphatic bulky di-piperidinium linker, while 4e had additional chloro-substitution on the quinoline unit. Both of these dyes caused a decrease in the CD spectra of all examined ds-polynucleotides (Figures S22–S23). The piperidine linker of 4d was more voluminous than the polypropylene-ammonium linker of the closest TOTO analogue 4b. However, their complexes with polynucleotides showed quite a similar CD response and very strong ICD signals, indicating aggregation of the ligand within the chiral axis. CD responses and shapes of spectra and ICD signals of chloro-analogue 4e obtained in titrations with both GC DNA and both RNA were very similar to 4b and 4d. Titrations of ct DNA and both AT DNA with 4d and 4e showed a different response. Bisignate ICD signals of 4e had different shape and intensity compared to 4d. That observation stressed the importance of the electron–donor chloro-substituent. For both compounds, no negative ICD signals at low r values, characteristic for intercalation were obtained, which was in agreement with no thermal stabilization of RNA.

3.3.4. Discussion of the Spectroscopic Results

Cyanine dyes TO and TOTO were modified by replacing the benzothiazole methyl group with by hydroxypropyl group. Further, the quinoline unit was substituted with chlorine and the piperidine/pyridine linker was introduced. Our goal was to explore the influence of the additional monomethine cyanine unit, chlorine substituent and steric/electronic properties of the linker on DNA/RNA binding affinities and fluorescence/CD response.
UV–Vis titrations of compounds with ct DNA showed a decrease of the absorption band at 480 ± 4 nm and a strong increase of absorption peak at 515 ± 5 nm, combined with the bathochromic shift of both bands. Bathochromic shifts together with bisignate ICD bands observed in CD titrations, indicated assembling of examined dyes to the supramolecular J-aggregate on the polynucleotide template [39]. We call that photophysical phenomenon a bioaggregachromism [40].
Despite the additional cyanine unit, dimer dyes 4b4e did not show significantly higher stability constants or thermal stabilizations of the double helix than monomer 4a that excluded bisintercalation of dimers as a dominant binding mode. For binding of all compounds on RNA, a strong preference for AU over GC RNA was observed, which was apparent from fluorimetric and also CD titrations. Based on thermal melting, fluorimetric titrations and ICD signals, 4b and 4c bound to pApU by intercalation and possibly by aggregation within a major groove at a higher dye/DNA ratio. 4d and 4e showed no intercalation into poly rA–poly rU. A lack of intercalation in most cases could be a consequence of steric hindrance of the hydroxypropyl group. Among all compounds, 4b showed the strongest affinities over polynucleotides (Table 2) and particularly strong ICD bands, probably because its flexible polypropylene-ammonium linker accommodated well into polynucleotides grooves and enabled an optimal and uniform interaction of the dye and polynucleotide.
All compounds revealed as bisignate ICD signals of different intensity that implied the formation of J-aggregates of dyes in the unique pattern concerning the polynucleotide chiral axis. Among all compounds, only 4c showed a strong negative ICD band characteristic for intercalation at very low r values (0.15) that corresponded to an excess of binding sites. Although apparent stability constants for all compounds and DNA polynucleotides were similar, there was a noticeable preference for GC over AT DNA. This recognition was revealed also in the stronger fluorescence response in fluorimetric titrations (Figure 3, Figure S18), stressing the importance of additional possibly hydrogen bonding interactions of GC base pairs with examined dyes. A different pattern (intensity, shape and direction of ICD signals and a decrease of the polynucleotide CD signal) of the CD response induced by examined dyes indicated the influence of small structural differences (Figure 4). 4b revealed the strongest ICD bands upon binding to polynucleotides. 4c yielded the strongest change and inversion of alternating GC DNA CD spectra related to the interruption of helical chirality. This observation pointed out the significant role of the rigid, aromatic pyridine linker.

3.4. Antiproliferative Effect of Compounds In Vitro

The biological experiments aimed to verify the capability of these DNA/RNA binders to penetrate cells estimated their intracellular location and subcellular targets and evaluated their antiproliferative effect. Based on these experiments, we could identify their further prospective application as either theranostic agents [41] (combining fluorescent probing with antiproliferative action) or as non-cytotoxic dyes suitable for intracellular applications [42,43].
Firstly, 4a4e compounds were tested for their antiproliferative activity against three human cancer cell lines: HCT 116 (colorectal carcinoma), MCF-7 (breast carcinoma) and H460 (large cell lung cancer), while 4c was additionally tested against the healthy cell line HEK 293. Examined compounds showed micromolar growth-inhibiting activity against cancer cell lines (Table 3, Figure S24).
Dimer dyes 4b–4e revealed similar affinities to polynucleotides and also similar antitumor activities compared to monomer 4a. Generally, compound 4c (dimer dye with the bipyridine linker) showed the strongest inhibitory potency on a tumor cell growth among all tested compounds, but without selectivity for the certain cell line. Cytotoxic activity of 4c against the healthy cell line HEK 293 was determined and the GI50 value was 20 ±2 μM. This value was approximately 10 times higher compared to tumor cells, revealed lower cytotoxicity for healthy cells and indicated the therapeutic potential of the dye. Since 4c showed a distinct cytotoxic effect, we studied its cellular uptake and intracellular distribution in H460 cells by confocal microscopy. The 4c (1 µM) entered live cells within 60 min incubation at 37 °C, 5% CO2 (Figure 5). Once in the cells, 4c accumulated in the cytoplasm, contrary to the expected subcellular localization in DNA-rich organelles, the nucleus or mitochondria, where cytotoxic DNA intercalators usually accumulate. The grain-like distribution of green spots in the vicinity of the nucleus (Figure 5) suggests lysosomal or endosomal vesicles as possible targets. However, detailed biological studies are needed for the accurate determination of the cellular target and the biological mechanism of cytotoxic action.

4. Conclusions

New cyanine dyes were synthesized according to previously published procedures and quaternized to afford the monomer and dimer water-soluble dyes. Analogues of the TO and TOTO dye were substituted by the hydroxypropyl on benzothiazole group instead of methyl, while cyanine units were linked by polypropylene-ammonium, dipyridinium or the dipiperidinium bridge. All compounds, dimer dyes and monomers showed a strong fluorescence increase upon binding to polynucleotides and high micromolar and submicromolar affinities toward DNA ds-polynucleotides and poly rA–poly rU.
Higher affinities and a fluorimetric response revealed a preference of all dyes for GC DNA over AT DNA. Unlike TO and TOTO, the additional cyanine unit did not yield higher affinities of dimers compared to the monomer that excluded bisintercalation as the dominant binding mode, probably because of the steric influence of the hydroxypropyl group. All compounds revealed a bathochromic shift of electronic absorption bands and strong bisignate ICD signals upon titrations with DNA ds-polynucleotides that indicated uniform J-aggregation of dye chromophores along the polynucleotide chiral helix with well-defined supramolecular chirality. 4b showed the strongest ICD signals among all ligands, possibly because its flexible polypropylene-ammonium linker enabled good accommodation of the dye and unique arrangement. The bispyridine linked dimer 4c showed unique behavior upon thermal stabilization of prA–prU: it stabilized RNA at r values below 0.2 and destabilized it at higher ratios. This indicated possible bisintercalation at a low concentration of dye/RNA ratios. Further, 4c strongly decreased the CD spectra of DNA polynucleotides and even changed the direction of its CD spectra. This significant perturbation of polynucleotide helicity was probably additionally influenced by a rigid aromatic di-pyridine linker. 4d and 4e with the piperidine linker differed the absence and presence of chloro-substitution on quinoline units, respectively. They both showed similar stabilizations of a double helix and similar stability constants, although 4d revealed somewhat higher affinities for AT DNA compared to 4e. However, differences in intensity and direction of their ICD signals stressed the importance of chloro-substitution, although detailed explanations were out of the scope of this paper.
In vitro studies of antiproliferative activities toward three cancer cell lines (colorectal carcinoma, breast carcinoma and large cell lung cancer) revealed that novel compounds inhibited cell growth in micromolar concentrations. Additionally, confocal microscopy demonstrated that the novel dye (4c) had selective antiproliferative affinity for tumor cells compared to healthy cells and efficiently entered cells, emitting a strong green fluorescence, when accumulated in cytoplasm organelles. Thus, novel dyes combine highly selective fluorescent intracellular probing with strong antiproliferative activity. This result makes them promising theragnostic candidates for further studies of the mechanism of their biological activity.

Supplementary Materials

The following are available online at https://www.mdpi.com/article/10.3390/biom11081075/s1, Scheme S1: Structures of examined 4a4e compounds, Figure S1: UV/Vis spectra of 4a4e at pH = 7, sodium cacodylate/HCl buffer, I = 0.05 mol dm−3, Table S1: Electronic absorption data of 4a4e (sodium cacodylate buffer, I = 0.05 mol dm−3, pH = 7.), Table S2: Groove widths and depths for selected nucleic acid conformations, Figure S2: Normalized melting curves of ct DNA (left) and poly dAdT–poly dAdT (right) upon addition of 4a (ratios r = [compound]/[polynucleotide] indicated in the graph legend, Figure S3: Normalized melting curves of ct DNA (left) and poly dAdT–poly dAdT (right) upon addition of 4b (ratios r=[compound]/[polynucleotide] indicated in the graph legend, Figure S4: Normalized melting curves of ct DNA (left) and poly dAdT–poly dAdT (right) upon addition of 4c (ratios r = [compound]/[polynucleotide] indicated in the graph legend, Figure S5: Normalized melting curves of ct DNA (left) and poly dAdT–poly dAdT (right) upon addition of 4d (ratios r = [compound]/[polynucleotide] indicated in the graph legend, Figure S6: Normalized melting curves of ct DNA (left) and poly dAdT–poly dAdT (right) upon addition of 4e (ratios r = [compound]/[polynucleotide] indicated in the graph legend, Figure S7: Normalized melting curves of poly rA–poly rU upon addition of 4a (left) and 4b (right) (ratios r = [compound]/[polynucleotide] indicated in the graph legend, Figure S8: Normalized melting curves of poly rA–poly rU upon addition of 4c (left) and 4d (right) (ratios r = [compound]/[polynucleotide] indicated in the graph legend, Figure S9: Left: Normalized melting curves of poly rA–poly rU upon addition of 4e (ratios r=[compound]/[polynucleotide] indicated in the graph legend. Right: Correlation of ΔTm values and ratios r[compound]/[polynucleotide] for complexes of examined compounds with different polynucleotides, Figure S10: Changes in UV–Vis spectra upon addition of ct-DNA: (a1) UV/Vis titration of 4a (c = 1.11 × 10⁻⁵ mol dm−3); (a2) changes in UV/Vis spectra of 4a at λ = 480 nm; (b1) UV/Vis titration of 4b (c = 8.03 × 10⁻⁶ mol dm−3); (b2) changes in UV/Vis spectra of 4b at λmax = 519 nm; (c1) UV/Vis titration of 4c (c= 7.41 × 10⁻⁶ mol dm−3); (c2) changes in UV/Vis spectra of 4c at λmax = 484 nm; d1) UV/Vis titration of 4d (c = 8.03 × 10⁻⁶ mol dm−3); (d2) changes in UV/Vis spectra of 4d at λmax = 478 nm; (e1) UV/Vis titration of 4e (c = 9 × 10⁻⁶ mol dm−3); (e2) changes in UV/Vis spectra of 4e at λmax = 452 nm, Table S3: Apparent stability constants (logKs) a, ratios n a = [bound compounds]/[polynucleotide] and spectroscopic properties of complexes of 4a4e with ct-DNA calculated according to UV–Vis titrations (Na-cacodylate buffer, c = 0.05 mol dm−3, pH = 7.0, λ =400-600 nm, c (4a) ≈ 1 × 10⁻⁵ mol dm−3), Figure S11: Fluorimetric titration of 4a4e compounds (c = 1.3–1.5 × 10⁻⁷ mol dm−3) with ct-DNA: a1) experimental (●) and calculated (–) fluorescence intensities of 4a at λem = 570 nm 4aexc = 510 nm); (b1) fluorimetric titration of 4bexc = 478 nm); (b2) experimental (●) and calculated (–) fluorescence intensities of 4b at λ = 548 nm; (c1) 4cexc = 484 nm); (c2) experimental (●) and calculated (–) fluorescence intensities of 4c at λ = 538 nm; d1) 4dexc = 484 nm); (d2) experimental (●) and calculated (–) fluorescence intensities of 4d at λ = 550 nm; e1) 4eexc = 452 nm); (e2) experimental (●) and calculated (–) fluorescence intensities of 4e at λ = 538 nm, Figure S12: Fluorimetric titration of 4a4e compounds (c = 1.3–1.5 × 10⁻⁷ mol dm−3) with poly dApoly dT: (a1) 4aexc=510 nm); (a2) experimental (●) and calculated (–) fluorescence intensities of 4a at λem = 547 nm; (b1) fluorimetric titration of 4bexc = 478 nm); (b2) experimental (●) and calculated (–) fluorescence intensities of 4b at λ = 545 nm; (c1) 4cexc = 484 nm); (c2) experimental (●) and calculated (–) fluorescence intensities of 4c at λ = 538 nm; (d1) 4dexc = 484 nm); (d2) experimental (●) and calculated (–) fluorescence intensities of 4d at λ = 554 nm; (e1) 4eexc = 452 nm); (e2) experimental (●) and calculated (–) fluorescence intensities of 4e at λ = 554 nm, Figure S13: Fluorimetric titration of 4a4e compounds (c = 1.3-1.5 × 10⁻⁷ mol dm−3) with poly dAdT–poly dAdT: (a1) 4aexc = 510 nm); (a2) experimental (●) and calculated (–) fluorescence intensities of 4a at λem = 535 nm; (b1) fluorimetric titration of 4bexc = 478 nm); (b2) experimental (●) and calculated (–) fluorescence intensities of 4b at λ = 545 nm; (c1) 4cexc=484 nm); (c2) experimental (●) and calculated (–) fluorescence intensities of 4c at λ = 538 nm; (d1) 4dexc = 484 nm); (d2) experimental (●) and calculated (–) fluorescence intensities of 4d at λ = 548 nm; e1) 4eexc = 452 nm); (e2) experimental (●) and calculated (–) fluorescence intensities of 4e at λ = 540 nm, Figure S14: Fluorimetric titration of 4a4e compounds (c = 1.3–1.5 × 10⁻⁷ mol dm−3) with poly rApoly rU: (a1) 4aexc = 510 nm); (a2) experimental (●) and calculated (–) fluorescence intensities of 4a at λem = 543 nm; (b1) fluorimetric titration of 4bexc = 478 nm); (b2) experimental (●) and calculated (–) fluorescence intensities of 4b at λ = 550 nm; (c1) 4cexc = 484 nm); (c2) experimental (●) and calculated (–) fluorescence intensities of 4c at λ = 538 nm; (d1) 4dexc = 484 nm); (d2) experimental (●) and calculated (–) fluorescence intensities of 4d at λ = 548 nm; (e1) 4eexc = 452 nm); (e2) experimental (●) and calculated (–) fluorescence intensities of 4e at λ = 557 nm, Figure S15: Fluorimetric titration of 4a4e compounds (c = 1.3–1.5 × 10⁻⁷ mol dm-3) with poly dGpoly dC: (a1) 4aexc = 510 nm); (a2) experimental (●) and calculated (–) fluorescence intensities of 4a at λem = 538 nm; b1) fluorimetric titration of 4bexc = 478 nm); (b2) experimental (●) and calculated (–) fluorescence intensities of 4b at λ = 550 nm; (c1) 4cexc = 484 nm); (c2) experimental (●) and calculated (–) fluorescence intensities of 4c at λ = 538 nm; (d1) 4dexc = 484 nm); (d2) experimental (●) and calculated (–) fluorescence intensities of 4d at λ = 550 nm; (e1) 4eexc=452 nm); (e2) experimental (●) and calculated (–) fluorescence intensities of 4e at λ = 575 nm, Figure S16: Fluorimetric titration of 4a4e compounds (c = 1.3–1.5 × 10⁻⁷ mol dm−3) with polydGdCpoly dGdC: (a1) 4aexc = 510 nm); (a2) experimental (●) and calculated (–) fluorescence intensities of 4a at λem = 535 nm; (b1) fluorimetric titration of 4bexc = 478 nm); (b2) experimental (●) and calculated (–) fluorescence intensities of 4b at λ = 550 nm; (c1) 4cexc = 484 nm); (c2) experimental (●) and calculated (–) fluorescence intensities of 4c at λ = 538 nm; (d1) 4dexc = 484 nm); (d2) experimental (●) and calculated (–) fluorescence intensities of 4d at λ = 548 nm; (e1) 4eexc = 452 nm); (e2) experimental (●) and calculated (–) fluorescence intensities of 4e at λ = 555 nm, Figure S17: Fluorimetric titration of 4a4e compounds (c = 1.3-1.5 × 10⁻⁷ mol dm−3) with poly rGpoly rC: (a1) 4aexc = 510 nm); (a2) experimental (●) and calculated (–) fluorescence intensities of 4a at λem = 538 nm; (b1) fluorimetric titration of 4bexc = 478 nm); (b2) experimental (●) and calculated (–) fluorescence intensities of 4b at λ = 550 nm; c1) 4cexc=484 nm); (c2) experimental (●) and calculated (–) fluorescence intensities of 4c at λ = 538 nm; (d1) 4dexc = 484 nm); (d2) experimental (●) and calculated (–) fluorescence intensities of 4d at λ = 548 nm; e1) 4eexc = 452 nm); (e2) experimental (●) and calculated (–) fluorescence intensities of 4e at λ = 555 nm, Figure S18: Changes of fluorescence emission at emission maxima of (a) 4a (c = 1.3 × 10⁻⁷ mol dm-3); (b) 4b (c = 1.3 × 10⁻⁷ mol dm−3); (c) 4c (c = 1.48 × 10⁻⁷ mol dm−3); (d) 4d (c = 1.34 × 10⁻⁷ mol dm−3); (e) 4e (c = 1.34 × 10⁻⁷ mol dm−3) upon addition of ds-polynucleotides of at pH 7 (Na-cacodylate buffer, pH = 7.0, I = 0.05 M), Figure S19: CD titration of polynucleotides (c = 2.0 × 10⁻⁵ mol dm−3) with 4a at different molar ratios r = [compound]/[polynucleotide] (pH = 7.0, buffer sodium cacodylate, I = 0.05 mol dm−3), Figure S20: CD titration of polynucleotides (c = 1.0 × 10⁻⁵ mol dm−3) with 4b at different molar ratios r = [compound]/[polynucleotide] (pH = 7.0, buffer sodium cacodylate, I = 0.05 mol dm-3), Figure S21: CD titration of polynucleotides (c = 1.0 × 10⁻⁵ mol dm−3) with 4c at different molar ratios r = [compound]/[polynucleotide] (pH = 7.0, buffer sodium cacodylate, I = 0.05 mol dm-3), Figure S22: CD titration of polynucleotides (c = 1.0 × 10⁻⁵ mol dm−3) with 4d at different molar ratios r = [compound]/[polynucleotide] (pH = 7.0, buffer sodium cacodylate, I = 0.05 mol dm−3), Figure S23: CD titration of polynucleotides (c = 1.0 × 10⁻⁵ mol dm−3) with 4e at different molar ratios r = [compound]/[polynucleotide] (pH = 7.0, buffer sodium cacodylate, I = 0.05 mol dm−3), Figure S24: Dose–response profiles for compound 4a4e compounds tested in vitro.

Author Contributions

Synthesis and characterization of new dyes, A.V., M.M. and M.K.; evaluation of antiproliferative effect of various substances in vitro, L.U., I.M.-K., M.K. and I.P.; spectroscopic characterization of dyes in water and study of interactions with biomacromolecules, I.M., I.LJ. and L.-M.T.; conceptualization, supervision, L.-M.T. and A.V.; project administration and funding acquisition, I.P. and A.V. All authors have read and agreed to the published version of the manuscript.

Funding

This research was funded by Croatian Science Foundation project IP-2018-01-5475 and Bulgarian National Science Fund (BNSF) project SOFIa (KP-06-H39/11) from 09 December 2019.

Acknowledgments

LMT and IP gratefully acknowledge for the financial support from Croatian Science Foundation project IP-2018-01-5475. AV and MK gratefully acknowledge the Bulgarian National Science Fund (BNSF) project SOFIa (KP-06-H39/11) from 09.12.2019 for the financial support. LMT is grateful to Marijana-Radić Stojković, Ruđer Bošković Institute, Zagreb, for proof-reading of the manuscript.

Conflicts of Interest

The authors declare no conflict of interest.

References

  1. Chastain, M.; Tinoco, I. Structural Elements in RNA. In Progress in Nucleic Acid Research and Molecular Biology; Cohn, W.E., Moldave, K., Eds.; Academic Press: Cambridge, MA, USA, 1991; Volume 41, pp. 131–177. [Google Scholar]
  2. Saenger, W. Intercalation. In Principles of Nucleic Acid Structure; Saenger, W., Ed.; Springer: New York, NY, USA, 1984; pp. 350–367. [Google Scholar]
  3. Chiang, S.-Y.; Welch, J.; Rauscher, F.J.; Beerman, T.A. Effects of Minor Groove Binding Drugs on the Interaction of TATA Box Binding Protein and TFIIA with DNA. Biochemistry 1994, 33, 7033–7040. [Google Scholar] [CrossRef] [PubMed]
  4. Silverman, R.B.; Holladay, M.W. Chapter 6—DNA-Interactive Agents. In The Organic Chemistry of Drug Design and Drug Action, 3rd ed.; Silverman, R.B., Holladay, M.W., Eds.; Academic Press: Boston, MA, USA, 2014; pp. 275–331. [Google Scholar]
  5. Demeunynck, M.; Bailly, C.; Wilson, W.D. (Eds.) Small Molecule DNA and RNA Binders: From Synthesis to Nucleic Acid Complexes; Wiley-VCH: Weinheim, Germany, 2003. [Google Scholar]
  6. Piantanida, I.; Palm, B.S.; Čudić, P.; Žinić, M.; Schneider, H.J. Interactions of acyclic and cyclic bis-phenanthridinium derivatives with ss- and ds-polynucleotides. Tetrahedron 2004, 60, 6225–6231. [Google Scholar] [CrossRef]
  7. Šmidlehner, T.; Badovinac, M.; Piantanida, I. Pyrene–cyanine conjugates as multipurpose fluorescent probes for non-covalent recognition of ds-DNA, RNA and proteins. New J. Chem. 2018, 42, 6655–6663. [Google Scholar] [CrossRef]
  8. Armitage, B.A. Cyanine Dye–DNA Interactions: Intercalation, Groove Binding, and Aggregation. In DNA Binders and Related Subjects; Waring, M.J., Chaires, J.B., Eds.; Springer: Berlin/Heidelberg, Germany, 2005; pp. 55–76. [Google Scholar]
  9. Rye, H.S.; Glazer, A.N. Interaction of dimeric intercalating dyes with single-stranded DNA. Nucleic Acids Res. 1995, 23, 1215–1222. [Google Scholar] [CrossRef] [Green Version]
  10. Glavaš-Obrovac, L.; Piantanida, I.; Marczi, S.; Mašić, L.; Timcheva, I.I.; Deligeorgiev, T.G. Minor structural differences of monomethine cyanine derivatives yield strong variation in their interactions with DNA, RNA as well as on their in vitro antiproliferative activity. Bioorg. Med. Chem. 2009, 17, 4747–4755. [Google Scholar] [CrossRef]
  11. Tumir, L.M.; Crnolatac, I.; Deligeorgiev, T.; Vasilev, A.; Kaloyanova, S.; Branilović, M.G.; Tomić, S.; Piantanida, I. Kinetic Differentiation between Homo- and Alternating AT DNA by Sterically Restricted Phosphonium Dyes. Chem. A Eur. J. 2012, 18, 3859–3864. [Google Scholar] [CrossRef]
  12. Crnolatac, I.; Tumir, L.M.; Lesev, N.Y.; Vasilev, A.A.; Deligeorgiev, T.G.; Mišković, K.; Glavaš-Obrovac, L.; Vugrek, O.; Piantanida, I. Probing the Structural Properties of DNA/RNA Grooves with Sterically Restricted Phosphonium Dyes: Screening of Dye Cytotoxicity and Uptake. ChemMedChem 2013, 8, 1093–1103. [Google Scholar] [CrossRef]
  13. Rožman, A.; Crnolatac, I.; Deligeorgiev, T.; Piantanida, I. Strong impact of chloro substituent on TOTO and YOYO ds-DNA/RNA sensing. J. Lumin. 2019, 205, 87–96. [Google Scholar] [CrossRef]
  14. Vasilev, A.; Lesev, N.; Dimitrova, S.; Nedelcheva-Veleva, M.; Stoynov, S.; Angelova, S. Bright fluorescent dsDNA probes: Novel polycationic asymmetric monomethine cyanine dyes based on thiazolopyridine-quinolinium chromophore. Coloration Technol. 2015, 131, 94–103. [Google Scholar] [CrossRef]
  15. Deligeorgiev, T.; Gadjev, N.; Vasilev, A.; Drexhage, K.H.; Yarmoluk, S.M. Synthesis of novel monomeric and homodimeric cyanine dyes with thioacetyl substituents for nucleic acid detection. Dye. Pigment. 2007, 72, 28–32. [Google Scholar] [CrossRef]
  16. Deligeorgiev, T.; Vasilev, A.; Drexhage, K.-H. Synthesis of novel monomeric cyanine dyes containing 2-hydroxypropyl and 3-chloro-2-hydroxypropyl substituents—Noncovalent labels for nucleic acids. Dye. Pigment. 2007, 73, 69–75. [Google Scholar] [CrossRef]
  17. Vassilev, A.; Dikova, I.; Deligeorgiev, T.; Drexhage, K.H. Quaternization of N-Heterocycles with Propylene Oxide and Epichlorohydrin. Synth. Commun. 2004, 34, 2539–2547. [Google Scholar] [CrossRef]
  18. Chaires, J.B.; Dattagupta, N.; Crothers, D.M. Studies on interaction of anthracycline antibiotics and deoxyribonucleic acid: Equilibrium binding studies on interaction of daunomycin with deoxyribonucleic acid. Biochemistry 1982, 21, 3933–3940. [Google Scholar] [CrossRef]
  19. Chalikian, T.V.; Völker, J.; Plum, G.E.; Breslauer, K.J. A more unified picture for the thermodynamics of nucleic acid duplex melting: A characterization by calorimetric and volumetric techniques. Proc. Natl. Acad. Sci. USA 1999, 96, 7853–7858. [Google Scholar] [CrossRef] [Green Version]
  20. Wheelhouse, R.T.; Chaires, J.B. Drug binding to DNA x RNA hybrid structures. Methods Mol. Biol. 2010, 613, 55–70. [Google Scholar]
  21. Ragazzon, P.; Chaires, J.B. Use of competition dialysis in the discovery of G-quadruplex selective ligands. Methods 2007, 43, 313–323. [Google Scholar] [CrossRef] [Green Version]
  22. Scatchard, G. The attractions of proteins for small molecules and ions. Ann. N. Y. Acad. Sci. 1949, 51, 660–672. [Google Scholar] [CrossRef]
  23. McGhee, J.D.; von Hippel, P.H. Theoretical aspects of DNA-protein interactions: Co-operative and non-co-operative binding of large ligands to a one-dimensional homogeneous lattice. J. Mol. Biol. 1974, 86, 469–489. [Google Scholar] [CrossRef]
  24. Boyd, M.R.; Paull, K.D. Some practical considerations and applications of the national cancer institute in vitro anticancer drug discovery screen. Drug Dev. Res. 1995, 34, 91–109. [Google Scholar] [CrossRef]
  25. Mosmann, T. Rapid colorimetric assay for cellular growth and survival: Application to proliferation and cytotoxicity assays. J. Immunol. Methods 1983, 65, 55–63. [Google Scholar] [CrossRef]
  26. Nygren, J.; Svanvik, N.; Kubista, M. The interactions between the fluorescent dye thiazole orange and DNA. Biopolymers 1998, 46, 39–51. [Google Scholar] [CrossRef]
  27. Nygren, J.; Andrade, J.M.; Kubista, M. Characterization of a Single Sample by Combining Thermodynamic and Spectroscopic Information in Spectral Analysis. Anal. Chem. 1996, 68, 1706–1710. [Google Scholar] [CrossRef]
  28. Herz, A.H. Dye-dye interactions of cyanines in solution and at agbr surfaces. Photogr. Sci. Eng. 1974, 18, 323–335. [Google Scholar]
  29. Joseph, M.J.; Taylor, J.C.; McGown, L.B.; Pitner, J.B.; Linn, C.P. Spectroscopic studies of YO and YOYO fluorescent dyes in a thrombin-binding DNA ligand. Biospectroscopy 1996, 2, 173–183. [Google Scholar] [CrossRef]
  30. Mergny, J.L.; Lacroix, L. Analysis of thermal melting curves. Oligonucleotides 2003, 13, 515–537. [Google Scholar] [CrossRef]
  31. Crothers, D.M. Calculation of binding isotherms for heterogeneous polymers. Biopolymers 1968, 6, 575–584. [Google Scholar] [CrossRef]
  32. Wakelin, L.P.G. Polyfunctional DNA intercalating agents. Med. Res. Rev. 1986, 6, 275–340. [Google Scholar] [CrossRef]
  33. Mao, F.; Leung, W.-Y.; Xin, X. Characterization of EvaGreen and the implication of its physicochemical properties for qPCR applications. BMC Biotechnol. 2007, 7, 76. [Google Scholar]
  34. Eriksson, M.; Nordén, B. Linear and circular dichroism of drug-nucleic acid complexes. In Methods in Enzymology; Academic Press: Cambridge, MA, USA, 2001; Volume 340, pp. 68–98. [Google Scholar]
  35. Berova, N.; Nakanishi, K.; Woody, R. Circular Dichroism Principles and Applications, 2nd ed.; Wiley-VCH: New York NY, USA, 2000. [Google Scholar]
  36. Rodger, A.; Norden, B. Circular Dichroism and Linear Dichroism, Chapter 2; Oxford University Press: New York, NY, USA, 1997. [Google Scholar]
  37. Garbett, N.C.; Ragazzon, P.A.; Chaires, J.B. Circular dichroism to determine binding mode and affinity of ligand–DNA interactions. Nat. Protoc. 2007, 2, 3166–3172. [Google Scholar] [CrossRef] [PubMed]
  38. Šmidlehner, T.; Piantanida, I.; Pescitelli, G. Polarization spectroscopy methods in the determination of interactions of small molecules with nucleic acids—tutorial. Beilstein J. Org. Chem. 2018, 14, 84–105. [Google Scholar] [CrossRef] [PubMed]
  39. Garoff, R.A.; Litzinger, E.A.; Connor, R.E.; Fishman, I.; Armitage, B.A. Helical Aggregation of Cyanine Dyes on DNA Templates: Effect of Dye Structure on Formation of Homo- and Heteroaggregates. Langmuir 2002, 18, 6330–6337. [Google Scholar] [CrossRef]
  40. Tanaka, T.; Ishitobi, M.; Aoyama, T.; Matsumoto, S. Highly Oriented J-Aggregates of Nitroazo Dye and Its Surface-Induced Chromism. Langmuir 2016, 32, 4710–4718. [Google Scholar] [CrossRef] [PubMed]
  41. Zhao, X.; Yang, C.-X.; Chen, L.-G.; Yan, X.-P. Dual-stimuli responsive and reversibly activatable theranostic nanoprobe for precision tumor-targeting and fluorescence-guided photothermal therapy. Nat. Commun. 2017, 8, 14998. [Google Scholar] [CrossRef] [PubMed] [Green Version]
  42. Drummen, G.P.C. Fluorescent Probes and Fluorescence (Microscopy) Techniques—Illuminating Biological and Biomedical Research. Molecules 2012, 17, 14067–14090. [Google Scholar] [CrossRef] [Green Version]
  43. Trinquet, E.; Mathis, G. Fluorescence technologies for the investigation of chemical libraries. Mol. Biosyst. 2006, 2, 380–387. [Google Scholar] [CrossRef]
Scheme 1. Synthetic conditions, chemical structures and reaction yields of dyes 4a4e.
Biomolecules 11 01075 sch001
Figure 1. UV/Vis titration of 4e (c = 9 × 10⁻⁶ mol dm−3, sodium cacodylate buffer, pH = 7, I = 0.05 mol dm−3) with ct-DNA; inset: changes in the UV/Vis spectra of 4e at λmax = 452 nm.
Biomolecules 11 01075 g001
Figure 2. (a) Fluorimetric titration (λexc = 488 nm) of 4c (c = 1.3 × 10⁻⁷ mol dm−3) with poly dGdC–poly dGdC; (b) Experimental (●) and calculated (–) fluorescence intensities of 4c at λem = 538 nm.
Biomolecules 11 01075 g002
Figure 3. Changes of the fluorescence emission of 4c (c = 1.48 × 10⁻⁷ mol dm−3) upon addition of ds-polynucleotides at pH 7 (Na-cacodylate buffer, pH = 7.0, I=0.05 M; λexc = 488 nm/λem = 538 nm; excitation slit of 5 nm and emission slit of 10 nm).
Biomolecules 11 01075 g003
Figure 4. Changes in the CD spectrum of poly dGdC–poly dGdC (c = 1–2 × 10⁻⁵ mol dm-3) upon addition of 4a4e compounds at different molar ratios r = [compound] / [polynucleotide], pH = 7.0, sodium cacodylate buffer and I = 0.05 mol dm-3.
Biomolecules 11 01075 g004
Figure 5. Colocalization of 4c (green, 1 μM) with MitoTracker® (red) and Hoechst 33342 (blue, nucleus) in H460 cells observed by confocal microscopy (cells were treated with 1 µM of the compound for 60 min at 37 °C and incubated with a 100 nM MitoTracker® and 20 mM Hoechst 33342 solution for 20 min at 37 °C): (a) overlay of brightfield with 4c (green) and MitoTracker® (red); (b) overlay of 4c (green) with Hoechst 33342 (blue, nucleus) and MitoTracker® (red).
Biomolecules 11 01075 g005
Table 1. The a ΔTm values (°C) of the studied ds-polynucleotides upon addition of different ratios b r of 4a4e at pH = 7.0 (buffer sodium cacodylate, I = 0.05 mol dm−3); c (polynucleotide) = 1–2 × 10⁻⁵ mol dm−3.
ΔTm/°C
Compoundrct-DNAPoly dAdT–Poly dAdTPoly A–Poly U
4a0.1
0.2
0.3
>20 c5.5
28.6
31.6
19.2
24.0
26.0
4b0.1
0.2
0.3
2.2
5.3
8.6
2.7
8.9
12.4
1.3
3.0
3.4
4c0.05
0.1
0.2
0.3
3.95
12.3
>15 c
>15 c
2.1
>20 c
>20 c
d
9.1
10.6
−19.1
−16.8
4d0.05
0.1
0.2
0.3
1.0
2.3
4.5
6.4
1.9
5.7
10.7
11.9
0.5
0
0
0
4e0.05
0.1
0.2
0.3
0.7
2.7
5.2d
1.5
4.2
7.1
10.0
0
0.5
0.6
0
a Error in ΔTm: ± 0.5 °C, b r = [compound]/[polynucleotide], c estimated value of ΔTm since the melting point of polynucleotide was higher than 95 °C after addition of the compound, d not determined.
Table 2. Apparent stability constants (logKs) a for fixed ratios n [bound dye]/[polynucleotide] = 0.2 a and spectroscopic properties of complexes b of 4a4e with ds-polynucleotides calculated according to fluorimetric titrations (Na-cacodylate buffer, c = 0.05 mol dm−3, pH = 7.0, λexc = 510 nm, λem = 525–650 nm and c(4a4e) = 1.3–1.5 × 10⁻⁷ mol dm−3).
log KsΔ Icalc b
4a
λexc 510 nm
ct–DNA6.57377
poly dA–poly dT6.41712
poly dA-dT–poly dA-dT6.65358
poly rA–poly rU6.111573
poly dG–poly dC6.79561
poly dG-dC–poly dG-dC6.98895
poly rG–poly rC5.23799
4b
λexc 478 nm
ct–DNA6.93157
poly dA–poly dT6.1944
poly dA-dT–poly dA-dT7.2375
poly rA–poly rU7.15158
poly dG–poly dC7.55114
poly dG-dC–poly dG-dC7.6465
poly rG–poly rC4.94618
4c
λexc 488 nm
ct–DNA6.62386
poly dA–poly dT6.23151
poly dA-dT–poly dA-dT6.68100
poly rA–poly rU6.22255
poly dG–poly dC6.78298
poly dG-dC–poly dG-dC7.04485
poly rG–poly rC4.7663
4d
λexc 478 nm
ct–DNA6.87340
poly dA–poly dT5.89143
poly dA-dT–poly dA-dT6.98117
poly rA–poly rU6.1478
poly dG–poly dC6.63120
poly dG-dC–poly dG-dC7.20285
poly rG–poly rC4.79572
4e
λexc 452 nm
ct–DNA5.94216
poly dA–poly dT5.91329
poly dA-dT–poly dA-dT6.05439
poly rA–poly rU6.1435
poly dG–poly dC7.41155
poly dG-dC–poly dG-dC7.40285
poly rG–poly rC4.95218
a Titration data were processed using the Scatchard equation [22,23], calculations mostly gave values of ratio n [bound dye]/[polynucleotide] = 0.1 – 0.3; for comparison, all log Ks values were recalculated with fixed value n = 0.2; correlation coefficients were > 0.98–0.99 for all calculated Ks, b emission change; ΔIcalc = Ilim − I0; emission intensity change, calculated from titration data processed by the Scatchard equation, where I0 is the calculated intensity of the examined compound, while Ilim is the calculated intensity of the complex.
Table 3. Antiproliferative activity of 4a–4e compounds against solid tumor cell lines expressed as the GI50 a value.
GI50 a (μM)
CompoundCell Lines
HCT 116MCF-7H460
4a6 ± 35 ± 410 ± 7
4b4.5 ± 0.72 ± 0.67 ± 2
4c2.2 ± 0.63.2 ± 1.91.9 ± 1.0
4d2.9 ± 0.13.5 ± 1.26.1 ± 4.4
4e3.3 ± 0.29.7 ± 2.94.6 ± 3.1
a GI50; drug concentration that causes 50% cell growth inhibition; data represent the mean ± SD of three independent experiments. Cells in the exponential growth phase were treated with substances for 72 h and cytotoxicity was analyzed by the MTT cell survival assay.
Publisher’s Note: MDPI stays neutral with regard to jurisdictional claims in published maps and institutional affiliations.

