Article

Triaging of Culture Conditions for Enhanced Secondary Metabolite Diversity from Different Bacteria

Department of Biochemical and Chemical Engineering, TU Dortmund University, Emil-Figge-Straße 66, 44227 Dortmund, Germany
*
Author to whom correspondence should be addressed.
Biomolecules 2021, 11(2), 193; https://doi.org/10.3390/biom11020193
Submission received: 22 December 2020 / Revised: 18 January 2021 / Accepted: 25 January 2021 / Published: 30 January 2021
(This article belongs to the Section Natural and Bio-derived Molecules)

Abstract

:
Over the past decade, the one strain many compounds (OSMAC) approach has been established for the activation of biosynthetic gene clusters (BGCs), which mainly encode the enzymes of secondary metabolite (SM) biosynthesis pathways. These BGCs were successfully activated by altering various culture conditions, such as aeration rate, temperature, and nutrient composition. Here, we determined the biosynthetic potential of 43 bacteria using the genome mining tool antiSMASH. Based on the number of BGCs, biological safety, availability of deposited cultures, and literature coverage, we selected five promising candidates: Bacillus amyloliquefaciens DSM7, Corallococcus coralloides DSM2259, Pyxidicoccus fallax HKI727, Rhodococcus jostii DSM44719, and Streptomyces griseochromogenes DSM40499. The bacteria were cultivated under a broad range of OSMAC conditions (nutrient-rich media, minimal media, nutrient-limited media, addition of organic solvents, addition of biotic additives, and type of culture vessel) to fully assess the biosynthetic potential. In particular, we investigated so far scarcely applied OSMAC conditions to enhance the diversity of SMs. We detected the four predicted compounds bacillibactin, desferrioxamine B, myxochelin A, and surfactin. In total, 590 novel mass features were detected in a broad range of investigated OSMAC conditions, which outnumber the predicted gene clusters for all investigated bacteria by far. Interestingly, we detected mass features of the bioactive compounds cyclo-(Tyr-Pro) and nocardamin in extracts of DSM7 and DSM2259. Both compounds were so far not reported for these strains, indicating that our broad OSMAC screening approach was successful. Remarkably, the infrequently applied OSMAC conditions in defined medium with and without nutrient limitation were demonstrated to be very effective for BGC activation and for SM discovery.

Graphical Abstract

1. Introduction

Secondary metabolites (SMs) are a chemically diverse and large group of biomolecules with complex structures. Approximately 300,000 secondary metabolites are characterized and many SMs are biologically active [1]. They possess antibiotic, cytostatic, or other relevant activities [2,3]. Therefore, SMs are of high interest for drug development in pharmaceutical research. The genes that code for enzymes involved in microbial SM biosynthesis are often clustered in bacteria. The expression of these biosynthetic gene clusters (BGCs) is regulated by various parameters including growth phase and cell differentiation [1,4].
The traditional approach of natural product discovery from microorganisms comprises bioactivity-guided screenings of microbial extract libraries obtained from existing strain collections [5] or newly isolated microorganisms [6,7,8]. The members of the bacterial class actinomycetes are regarded as species with high biosynthetic potential of promising bioactive SMs [5]. However, the biosynthetic potential of an organism has been difficult to estimate owing to the lack of genomic information on BGCs. Thanks to the development of new sequencing technologies, the number of freely available fully sequenced genomes in public databases made genomic information more accessible for genome mining. To date, the National Center for Biotechnology Information (NCBI) provides more than 200,000 prokaryotic genome sequences with different depths of the genome assembly. In particular, the availability of genomes for organisms with high biosynthetic potential facilitated predictions with regards to potentially produced SMs. For example, the BGCs in genomes of interest can be analyzed using software tools like antiSMASH [9]. The antiSMASH tool exploits genomic information to mine previously unidentified natural products from the broad spectrum of the available sequenced genomes [10]. The genome mining approach enables a complete new route of SM discovery compared with the traditional approaches. Still a major challenge remains, which is the activation of the potential BGCs to enable the biosynthesis of the SMs by pathway enzymes present on the genome. BGC activation only occurs under certain cultivation conditions. Most often, the expression of BGCs is silenced in the organisms’ genomes [11]. One way to activate BGCs is through genetic modifications, e.g., ribosome engineering, the manipulation of regulators or quorum sensing systems, and heterologous expression [12,13]. Heterologous expression of BGCs has also been used to confirm these gene clusters as coding sequence of the natural biosynthesis pathway [14]. Aside from genetic modifications, BGC activation has been achieved by perturbing culture conditions, for example, co-cultivation [5]. The culture-condition induced approach is commonly known as the one strain, many compounds (OSMAC) approach to enable the discovery of many compounds produced by one microbial source [15].
The OSMAC approach comprises the alteration of easily adaptable culture conditions, like media composition, pH, temperature, the addition of enzyme inhibitors, oxygen supply, or culture vessel, to induce SM production during cultivation [15]. Table 1 summarizes three examples of pharmaceutically active new compounds obtained from successful OSMAC experiments using easily applicable changes in culture conditions. These changes in culture condition comprise variations of the media and of the carbon source.
Firstly, the BGC activation in OSMAC screenings is often related to variations in the type or concentration of nutrients. In particular, changes in carbon, nitrogen, or phosphate sources successfully induced the microbial production of SMs [19]. For example, Machushynets et al. only detected the quinazolinones A and B with an elevated glycerol concentration, but not on other tested carbon sources such as mannitol, fructose, or glucose [17]. Bode et al. showed that the addition of oat grains to the culture medium increased the number and diversity of produced cladospirones [16].
Secondly, additives such as solvents, heavy metals, tensides, precursors, and other small molecule elicitors were also used to successfully induce secondary metabolite production in microorganisms. Chen et al. reported that organic solvents influence the production of antibiotics. For example, increases in the production of tetracenomycin and thiostrepton by Streptomyces strains were obtained when adding dimethyl sulfoxide (DMSO) and ethanol (EtOH) to the culture broth [20]. Still, the underlying mechanism of solvent-induced BGC activation is not yet fully understood and one only can speculate on the mode of action of intracellular responses to solvents. DMSO might act on the translational level, induce stress proteins, or possess pheromone-like activity. Ethanol likely induces heat shock proteins [21] and permeabilizes the cell membrane [22].
Thirdly, Weinberg identified three heavy metals, Mn2+, Fe3+, and Zn2+, as key trace metals in secondary metabolism of bacteria and fungi. These metal ions induced the synthesis of bacterial exotoxins and peptide antibiotics [23]. Paranagama et al. showed the influence of the addition of heavy metal ions and heat shock on fungal secondary metabolite production profiles. Particularly, the plant-associated fungus Paraphaeosphaeria quadriseptata produced more monocillin I when the culture medium was supplemented with 0.5 mM ZnSO4 [24].
Finally, co-cultivation was used to successfully induce SM production in OSMAC screenings. The term co-cultivation designates the growth of two or more microorganisms at once, which triggers interactions between the organisms [25]. Cell–cell contact or the presence of small molecules presumably induced the expression of silent BGCs and the production of SMs [11,23,26]. It was shown that co-cultivation of various marine bacteria with terrestrial bacteria enhances antibiotic production [27]. Hence, OSMAC screenings became a successful alternative to activate BGCs through variations in culture conditions instead.
Despite the success of established OSMAC approaches in SM discovery, the variations in cultivation conditions are far from being exhaustively tested. Furthermore, although OSMAC studies were conducted with increasing numbers for SM discovery in the past years, our literature search has shown that some cultivation conditions are used more frequently. In that respect, the most frequently used OSMAC conditions to activate silent BGCs in bacterial cultures were different nutrient-rich media, followed by the addition of inducer molecules (n-acetylglucosamine, sub-inhibitory concentrations of antibiotics, and organic acids), and the use of co-cultivation [28,29,30,31,32,33,34]. Fewer studies changed the pH of the growth medium, applied temperature shocks during the cultivation, or added solvents and biotic additives such as heat-killed cells. While several studies investigated nutritional regulators and their control on secondary metabolism, only few studies investigated the secreted metabolome after the use of starvation conditions, referred to in the following as nutrient-limited OSMAC experiments [35,36]. Hence, these infrequently applied OSMAC conditions were not exhaustively explored for their potential to activate silent BGCs in organisms with a high biosynthetic potential or even well investigated organisms of the actinomycetes bacterial family.
In this study, we aimed to explore the less frequently used OSMAC conditions, like the nutrient-limited media experiments. To compare their potential for BGC activation and SM production to the more frequently applied OSMAC conditions, we analyzed the number and diversity of new mass features in high-performance liquid chromatography-mass spectrometry (HPLC-MS) analysis of extracts isolated from selected bacteria, which were grown under the various growth conditions. In total, five fully sequenced, but not thoroughly investigated bacteria were identified via genome mining, all of them sharing a high biosynthetic potential. The activation of their predicted BGCs was investigated using a broad range of culture conditions, including the less frequently applied OSMAC conditions. We used the well-established media variations as a benchmark of SM production in microbial cultures. Next, it was possible to evaluate the less frequently used culture conditions, i.e., Fe3+-, Mg2+-, and PO43−-limitation, as well as addition of biotic additives and organic solvents, for their suitability to further increase the number of new mass features in bacterial cultures. Based on their potential to increase the number of new mass features and diversify the mass feature identity, the OSMAC conditions under PO43−-limitation, Fe3+-limitation, defined M9 minimal medium, glucose mineral salt (GMS) medium, and several biotic additives were identified as conditions with a high potential to activate BGCs and SM production. Hence, these OSMAC conditions are promising starting points for broad screenings of other bacteria in the future. Furthermore, we noticed that 70% of the 590 new mass features were condition-dependent, i.e., they were only detected under exactly one culture condition. This observation led us to the conclusion that especially broad screenings of carefully selected strains are most promising for future SM discovery.

2. Materials and Methods

2.1. Genome Mining

The online-tool antiSMASH bacterial version 3.0 (Novo Nordisk Foundation Center for Biosustainability, Technical University of Denmark, Lyngby, Denmark) [9] was used to examine fully sequenced genomes of 42 bacteria. The percentage of the genomes dedicated to secondary metabolite production, classes of the encoded secondary metabolites, and the origin of the database BGCs were examined. In the Supplementary Material, all examined bacterial strains including their NCBI accession numbers are summarized in Table S1.

2.2. Organisms, Media, and Growth Conditions

As reference or control group, all strains (Bacillus amyloliquefaciens DSM7, Corallococcus coralloides DSM2259, Pyxidicoccus fallax HKI727, Rhodococcus jostii DSM44719, and Streptomyces griseochromogenes DSM40499) were cultivated according to recommendations by DSMZ (German Collection of Microorganisms and Cell Cultures, Braunschweig, Germany). B. amyloliquefaciens was cultivated on nutrient broth (NB) medium [37], C. coralloides was grown on SP medium [38], and P. fallax on MD1 medium [39]. R. jostii was cultivated on tryptic soy broth (TSB) medium [40] and cultures of S. griseochromogenes were grown on glucose-, yeast-, malt- (GYM) medium [41] (Tables S3–S7). A detailed list of used chemicals and suppliers used to prepare the various growth media is presented in Table S2.
Cryo-cultures of all strains were stored at −20 °C in 10% (v/v) glycerol. Inoculum cultures of the bacteria were prepared by incubating 1 mL of the cryo-culture in 19 mL of medium in a baffled 100 mL flask on an orbital shaker at 150 rpm and 30 °C (28 °C for R. jostii) for 15–72 h depending on the bacterium. Different final biomasses were reached during the pre-cultivation periods. B. amyloliquefaciens reached an OD600 of 1.6 after 15 h. An OD600 of 2.3 was obtained for C. coralloides after 15 h. P. fallax reached OD600 1.3 after 72 h. R. jostii reached an OD600 of 7.4 after 43 h. S. griseochromogenes was cultured for 15 h. The biomass measurement by OD600 of this bacterium was not possible because of clotted growth. In the main culture, various culture conditions were investigated. In all cases but the addition of supernatant (see Section 2.3.), 10% inoculum was used in 90 mL fresh medium in baffled 500 mL flasks and cultivated on an orbital shaker at 150 rpm and 30 °C. The cultivation period was 3 days for B. amyloliquefaciens and S. griseochromogenes and 7 days for C. coralloides, P. fallax, and R. jostii. The growth curves of control group cultures are shown in the Supplementary Materials (Figure S1).

2.3. OSMAC Experiments

The variations of culture conditions are summarized in Table 2. In total, every bacterium was tested in 30 conditions. Media recipes can be found in Tables S8–S13.
To generate the two biotic additives, culture supernatant and cell pellets, inducer microbes were cultivated according to the cultivation protocol for the inoculum described above. Here, 10 mL of inoculum and 10 mL of autoclaved and centrifuged or centrifuged and sterile-filtered supernatant of the inducer microbe were added to 80 mL of fresh medium. In the case of the pellet additive, 10 mL of inoculum and 200–500 µL of autoclaved cell pellet were re-suspended in fresh medium and added to 90 mL of fresh medium.

2.4. Preparation of Biotic Additives

Bacterial cultures, which were used as biotic additives, were grown for 5 days at 30 °C in 20 mL medium. The cultures were transferred into sterile Falcon tubes under sterile conditions and centrifuged in a Sorvall™ RC 5B Plus centrifuge at 3795× g for 20 min at 4 °C. The supernatant was sterile-filtered and directly used as biotic additive as described in the previous section. The remaining cell pellet was resuspended in 1 mL of the medium used in the main culture for better pipetting properties and then used as biotic additive, as described.

2.5. Cell Removal

After termination of the cultivation, cells were removed from the broth by centrifugation in a Sorvall™ Rc 5B Plus centrifuge (Thermo Fisher, Waltham, MA, USA) by centrifuging for 20 min at 3795× g and 4 °C. Subsequently, the supernatant was filtered through folded cellulose filters with a pore size between 8 and 12 µm (Sartorius Folded Filters, Grade: 3 hw, Dia: 185 mm, 65 g∙m3, Sartorius, Göttingen, Germany). The cell pellet was collected in the respective folded filters, dried at 70 °C for 24 h, and weighed after drying.

2.6. Extraction of Cell-Free Fermentation Broth

The cell-free broth was extracted three times with the equivalent volume of ethyl acetate, which has previously been used as solvent in natural product extraction [42]. The solvent was then evaporated to dryness to gain a dry extract, which was further prepared for HPLC-MS measurement.

2.7. HPLC-MS Sample Preparation

Here, 2 mL of methanol (LC-MS grade) was added to the dry extracts and the extracts were dissolved in the solvent via ultrasonic bath. The concentrated extract was then filtered through 0.45 µm nylon filters (Chromafil® Xtra PA-45/13, Macherey&Nagel, Düren, Germany) directly into glass vials.

2.8. HPLC-MS/MS Measurement

The utilized high-performance liquid chromatography-mass spectrometry (HPLC-MS) system comprised an Agilent Technologies 1260 Infinity HPLC system (Agilent Technologies, Santa Clara, CA, USA) and a Bruker Compact ESI-QTOF-MS System (Bruker, Billerica, MA, USA). The injected sample volume was 2 µL. The solvents used were ACN (solvent A) and H2O with 0.1% formic acid (solvent B) with a flow of 0.4 mL/min. The following HPLC method was employed: 0–10 min 5%–98% solvent A, 10–15 min 98% solvent A isocratic, 15–17 min 98%–5% solvent A, 17–20 min 5% solvent A at a temperature of 40 °C with a C18-column (100 × 2.6 mm NucleoShell RP18, Macherey&Nagel, Düren, Germany). Diode-array detection (DAD) was used with a setting from 205 nm to 400 nm. The mass spectrometer comprised an electrospray ion (ESI) source and a time-of-flight (TOF) analyzer and was used in positive mode. Negative mode measurements were omitted because preliminary experiments revealed that a significantly higher number of peaks was detected in positive mode. The ESI source was used with a nebulizing gas pressure of 4 bar, a drying gas flow of 12 L/min, a drying temperature of 220 °C, and a capillary voltage of 4500 V. A mass-to-charge-ratio (m/z) range from 100 to 850 was measured. Each sample was measured once. For some samples, Auto-MS2 experiments were conducted. For some specific mass features, multiple reaction monitoring (MRM) measurements were used, applying identical HPLC conditions.

2.9. Evaluation of HPLC-MS Data

For the evaluation of HPLC-MS data, the Bruker software Compass Data Analysis 1.7 was used. The obtained data were evaluated to determine the number of new mass features as a result of the change in culture conditions. In addition, the specific search of mass features was conducted to identify SM compounds. A mass feature was composed of a molecular mass Mr and the corresponding retention time tR. msConvert from the ProteoWizard software (ProteoWizard, Palo Alto, CA, USA) was used for the conversion of vendor format raw data to mzXML-format [43]. The tool MZmine 2.35 [44] was used to identify new mass features by comparison of obtained samples with control group samples and medium background as well as the background of additives where necessary, e.g., supernatants. The steps and settings for raw data conversion, mzXML-raw data preparation, and peak list processing can be found in the Supplementary Material (Tables S14–S16). Additionally, automated and manual refining of the obtained results was necessary to eliminate false positive hits. A strict intensity threshold of 105 was set and mass features were only considered as new if they reached or surpassed that limit in both biological duplicates. The new mass features were compared to a list of known contaminants in mass spectrometry [45]. New mass features were numbered and named according to the producing strain (BaXY = B. amyloliquefaciens, CcXY = C. coralloides, PfXY = P. fallax, RjXY = R. jostii, SgXY = S. griseochromogenes). Predicted compounds were determined using the extracted ion chromatogram (EIC) function of the Compass Data Analysis software for [M + H]+, [M + NH4]+, [M + Na]+, and [M + K]+ adduct identification with an allowed deviation of 0.01 Da.

2.10. Utilized Databases

For the comparison of fragmentation patterns generated through HPLC-MS2 experiments to database entries, GNPS library search was used in default mode, i.e., precursor ion mass tolerance = 2.0 Da, fragment ion mass tolerance = 0.5 Da, minimum number of matched peaks = 6, and score threshold = 0.7. The cosine score indicates similarity between MS2 spectra and ranges from 0 to 1 (0 = dissimilar spectra, 1 = identical spectra) Here, matches with a cosine of 0.7 or higher were considered [46]. For the comparison of the experimental data to in silico fragmentation patterns of candidate molecules, MetFrag was used in default mode (allowed deviation from neutral mass: 5 ppm or 0.001 mzabs, mode: [M + H]+, tree depth = 2) with PubChem as database.

3. Results and Discussion

3.1. Genome-Mining for Selection of Bacteria

For an initial bioinformatics evaluation, 43 bacteria were considered with regard to biological safety, availability of deposited cultures, genome sequences, and literature coverage. The genomes of these bacteria were subjected to antiSMASH genome analysis. The set of bacteria included known SM producers and unexplored bacteria with respect to their biosynthetic potential. The bacteria and their NCBI accession numbers are summarized in Table S1. The genome analysis showed that the percentage of the bacterial genome encoding putative SM gene clusters varies greatly among the examined bacteria. On average, approximately 12% of the genome sequences of the selected bacteria are related to SM production. Some bacteria displayed an increased fraction of more than 20% of their genomes for SM production (Figure 1).
Out of the 43 bacteria, we selected five strains that showed a high potential for the SM production. These bacteria either displayed a high percentage of SM biosynthesis pathway genes or possess interesting BGCs for polyketides, non-ribosomal peptides, and orphan BGCs. The selected bacteria were S. griseochromogenes DSM40499 with 20.92% BGCs on its genome, R. jostii DSM44719 with 12.17% BGCs on its genome, C. coralloides DSM2259 with 15.23% BGCs on its genome, P. fallax HKI727 with 19.08% BGCs on its genome, and B. amyloliquefaciens DSM7 with 14.72% BGCs on its genome. The total number of BGCs present on the genomes of the selected bacteria varies between 11 and 49 (Table 2, Tables S17 and S18, Figures S3–S6). Furthermore, only few of the predicted compounds were reported in the literature (Table 3).

3.2. Verification of AntiSMASH-Predicted SM Compounds

The production of SM compounds, predicted by antiSMASH, was verified using a broad OSMAC approach. The experimental steps in the OSMAC approach included the cultivation of the selected bacteria under various conditions, the subsequent extraction of the culture supernatant, and HPLC-MS analyses to detect novel mass features corresponding to SM compounds. The chosen cultivation conditions varied in the composition of nutrient-rich media and chemically defined minimal media; PO43−-, Fe3+-, and Mg2+-limitation; and the addition of organic solvents as well as different biotic additives. Overall, seven predicted products were detected in the generated extracts. The production of five compounds was solely detectable in the OSMAC samples and they were not detected in control group samples. Control group means the cultivation of the bacteria in their DSMZ-recommended, nutrient-rich media (NB medium for B. amyloliquefaciens, SP medium for C. coralloides, MD1 medium for P. fallax, TSB medium for R. jostii, and GYM medium for S. griseochromogenes). This contrasts with bacillaene (Figure S7) and desferrioxamine B (Figure S8), which were detected in control group samples and various generated OSMAC extracts (Table 4, Table S14).
In extracts obtained from B. amyloliquefaciens, the predicted products surfactins, bacillibactin, and bacillaene were detected. The production of surfactins by B. amyloliquefaciens was activated by various OSMAC conditions, including minimal media, Fe3+-limitation, and the addition of organic solvents (Table S19, Figure S9). Contrary to the broad OSMAC activation of the surfactins, bacillibactin (PubChem ID: 125349) was only detected in Fe3+-limited GMS extracts. This seems reasonable because of its nature of being a siderophore. Siderophores are secreted in Fe3+-starvation conditions and facilitate its uptake [53] (Figure S10). Bacillaene was detected in extracts from several culture conditions as well as in the control group grown in NB medium (Figure S7). The compound’s peak area in the EIC was most prominent in OSMAC conditions like Fe3+-limitation, GMS medium, and the addition of sterile-filtered supernatant of P. fallax. Its peak area decreased in extracts isolated from OSMAC experiments with LB medium and the addition of solvents.
In extracts obtained from OSMAC cultivations of P. fallax, the predicted compounds nostophycin and myxochelin A were detected. Nostophycin was identified using MS2-fragmentation and subsequent comparison with an in silico fragmentation pattern using MetFrag and the corresponding PubChem entry (PubChem ID: 101945102) (Figures S11 and S12, Table S20). Nostophycin was detectable in extracts from P. fallax grown under Fe3+- and Mg2+-limitation, in GMS medium, and in media with high concentrations of ethanol or toluene. The addition of toluene resulted in the highest peak intensity of nostophycin. The compound myxochelin A was detected under diverse OSMAC conditions (Figure S13). The production of myxochelin A by P. fallax was already verified in OSMAC conditions using MD1 medium [50], which could be confirmed here. Although a high number of BGCs can be found in the genome of C. coralloides and R. jostii, none of the predicted compounds were detected in the respective extracts.
In spite of our broad OSMAC screening, the number of detected compounds in comparison with the predicted compounds remained low. Our findings indicate that additional factors aside from the number of BGCs on the genome and OSMAC conditions should be taken into account for the evaluation of the biosynthetic potential of an organism. Firstly, the success of finding new SMs through OSMAC approaches will remain challenging and a broad range of different OSMAC conditions are necessary to enable the activation of various BGCs in the genome. The low number of detected and verified compounds indicate the OSMAC conditions, required for the activation of the predicted BGCs, have not been met. New conditions and multifactorial designs of OSMAC screenings provide a straightforward solution to find the required inducing conditions for the activation of silent BGCs. Interestingly, the detected SMs were produced under culture conditions, which were previously less reported in the literature. The overview of producing conditions in Table S14 shows that, especially, the culture conditions with limited prior literature coverage are responsible for the activation of the detected and predicted SMs. Secondly, a high similarity of BGCs in the selected bacteria with database entries also did not imply that the predicted compounds were produced by the bacteria under any of the tested OSMAC conditions. Indeed, high sequence similarity to database BGCs alone is not a good indicator to evaluate the biosynthetic potential. One explanation of our findings might be that the BGCs are dysfunctional, caused by certain detrimental variations and other mutations present in the BGC sequence. Hence, an in-depth analysis of BGCs including the structural integrity of detected BGCs and of the not yet annotated orphan BGCs is necessary aside from sequence similarity predicted by antiSMASH in order to better evaluate the biosynthetic potential of the selected bacteria.

3.3. Influence of Culture Conditions on the Number of New Mass Features

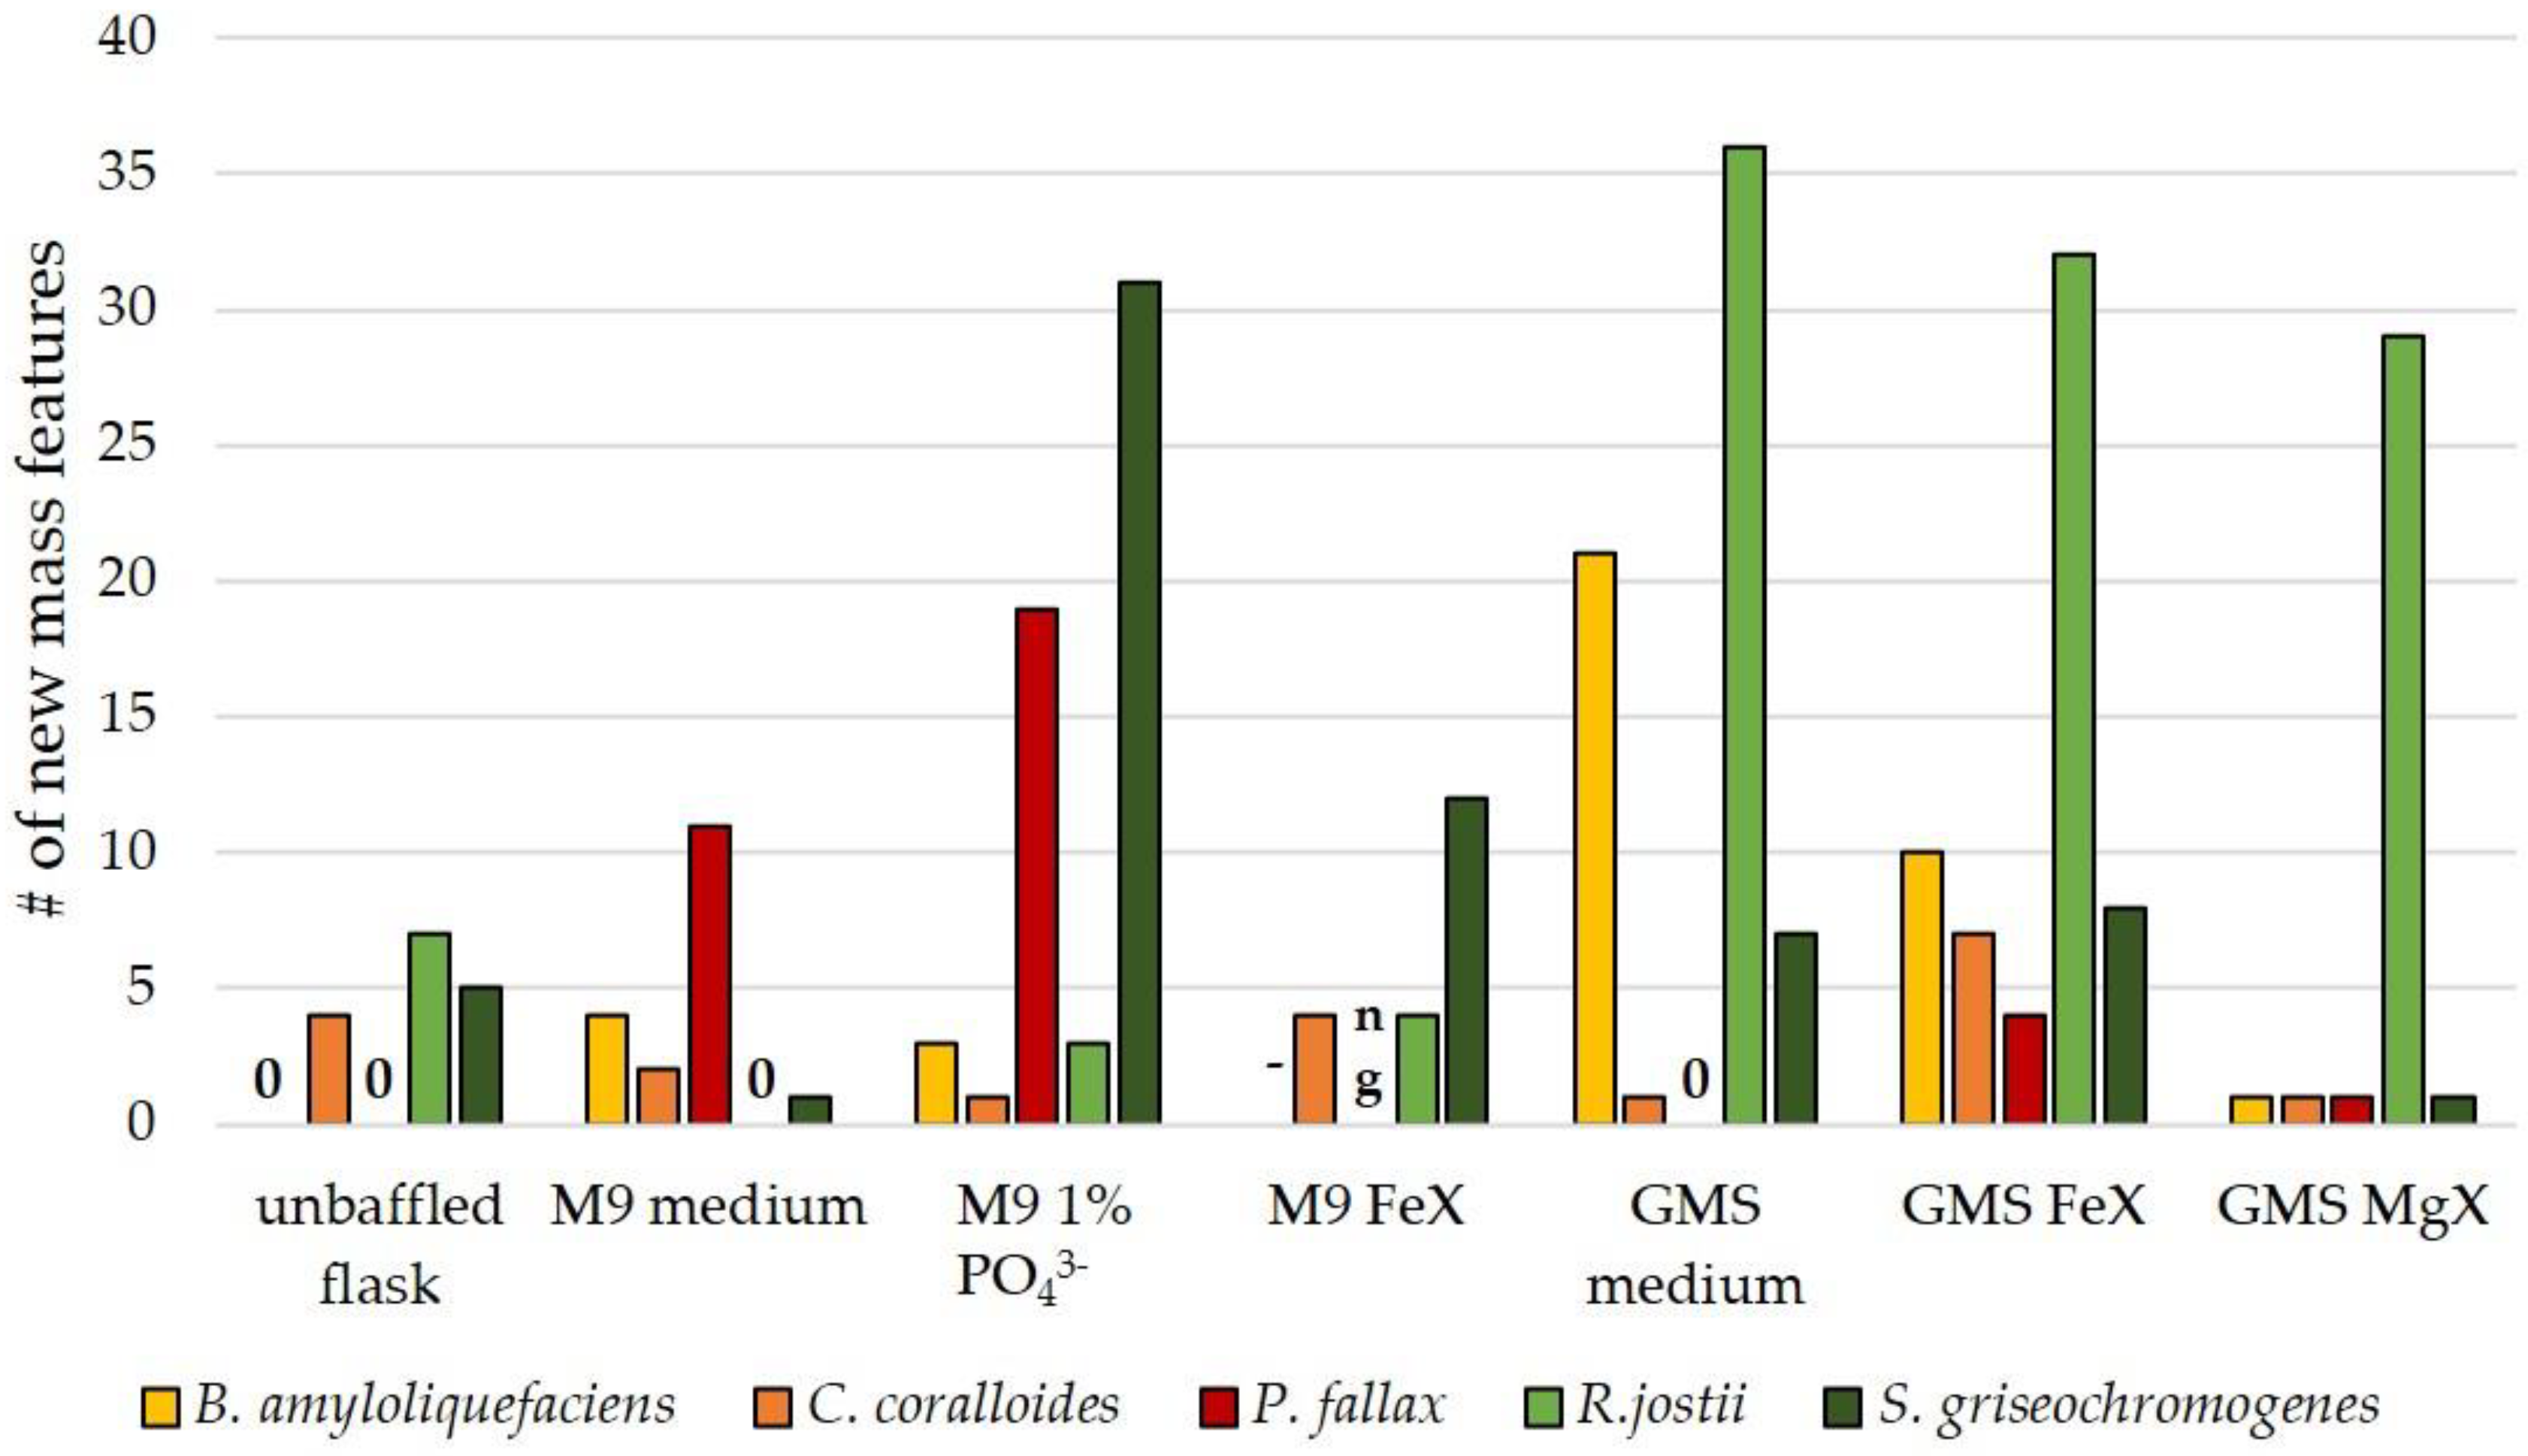
Aside from the identified SM compounds, several novel mass features were detected under the chosen OSMAC conditions. The number of new mass features was mainly dependent on the OSMAC conditions. In fact, we found an increased number of mass features in infrequently applied OSMAC conditions, namely minimal media and limitation experiments. Figure 2 shows the number of new mass features in PO43−-limitation (1% of amount of phosphate salts of original M9 medium recipe used), Fe3+-limitation, and Mg2+-limitation in M9 and GMS medium.
An increased number of mass features was detected in PO43−-limitation experiments. This relates to the common assumption that high PO43−-concentrations act as repressors of SMs, whereas a limited PO43−-concentration is more preferable for secondary metabolism [14,35]. Masuma et al. showed that phosphate reduction enhanced antibiotic production in Streptomyces rosa [54]. S. griseochromogenes and P. fallax are more susceptible to the PO43−-limitation than the other tested strains, as demonstrated by the high numbers of new mass features obtained under this condition. R. jostii reacted strongly to any variation of GMS medium with up to 36 new mass features.
The Fe3+-limitation clearly resulted in an increased number of new mass features. Interestingly, the number of new mass features varied considerably between M9 FeX and GMS FeX cultures. Four new mass features were detected in Fe3+-limited R. jostii cultures in M9 medium versus 32 new mass features in Fe3+-limitation on GMS medium, and their identities were completely different. The same pattern could be seen in C. coralloides and S. griseochromogenes cultures (Table 5). This observation shows that the formation of novel compounds is not solely a result of Fe3+-limitation, but is also dependent on other components present in the minimal medium. The greatest differences are the phosphate concentrations with significantly lower amounts in GMS medium; the presence and absence, respectively, of several trace elements; as well as further compounds such as amino acids, vitamins, and salts. Especially, the availability of phosphate and trace elements might have influenced the (de)activation of several BGCs.
The use of nutrient-rich media is the most frequent OSMAC approach for SM discovery and BGC activation [55]. In nutrient-rich media, different complex nutrient sources are used, which presumably influence secondary metabolism [56]. Some chosen media possess trace elements (MD1, MD1+G) or amino acids (Landy), some possess several complex nutrient sources (CY/H), and others possess two complex components (NB). In this study, we tested a total of eight different nutrient-rich media, which have previously been used in OSMAC-based media screenings [57,58]. Three different media per strain were tested (Figure 3).
Owing to the compositional differences of the nutrient-rich media, we expected several new mass features in the extracts of the bacteria grown on various media. Figure 3 shows that new mass features indeed appeared in the OSMAC media screening. Especially, the Landy extracts showed a high numbers of new mass features. An explanation for the increased number of mass features was the difference in composition of the Landy medium compared with the media used for the control group of each bacterium. While the control group media are based on complex carbon and nitrogen sources such as casitone, yeast extract, or meat extract, the main components of Landy medium are glucose, glutamic acid, and phenylalanine. This difference in composition explains the more pronounced change in the metabolite profile [55]. Still, this observation is surprising, because glucose is known to interfere with secondary metabolism in many strains via carbon catabolite repression [56]. Ruiz et al. give an overview of SMs underlying carbon catabolite repression like actinorhodin in Streptomyces coelicolor. However, SMs that are not under the control of carbon catabolite repression are known as well (bacilysin from Bacillus subtilis) [59]. Other carbon sources can also have interfering or non-interfering effects on SMs, such as glycerol interfering with cephalosporin production in Cephalosporium acremonium, but not with simocyclinones in Streptomyces antibioticus Tü6040. Lactose and starch have not been reported as interfering with the production of any SMs. As B. amyloliquefaciens, R. jostii, and S. griseochromogenes produced several new mass features when grown in Landy medium, the produced mass features seem to not underlie carbon catabolite repression.
Following the impact of nutrient-rich media on SM production, the effect of solvents was evaluated. The addition of solvents for the elicitation of SMs from bacteria has not yet been sufficiently reported. Among the few publications dealing with the influence of solvents, ethanol was most frequently used. Apart from the study by Chen et al. from the year 2000 [20], Doull et al. and Jakeman et al. examined the influence of ethanol shock on jadomycin B production in Streptomyces venezuelae [22,60], and Chatterjee et al. investigated the effect of very low concentrations of ethanol on the viability and growth recovery of Staphylococcus aureus [61]. Therefore, cultivations with higher ethanol concentrations (0.5/1/3/6 Vol%) were used in this study. Additionally, we included dimethyl sulfoxide (DMSO), toluene (Tol), and acetonitrile (ACN) in the OSMAC screening. DMSO was already used by Chen et al. and affected antibiotic production in Bacillus and Streptomyces strains [20]. To the best of our knowledge, neither acteonitrile nor toluene have previously been investigated regarding SM elicitation. It has previously been reported that immediate addition of ethanol has a positive effect on SM production, while too late addition results in decreased SM production [22,60]. In our experiments, the organic solvents were hence immediately added to the main cultures.
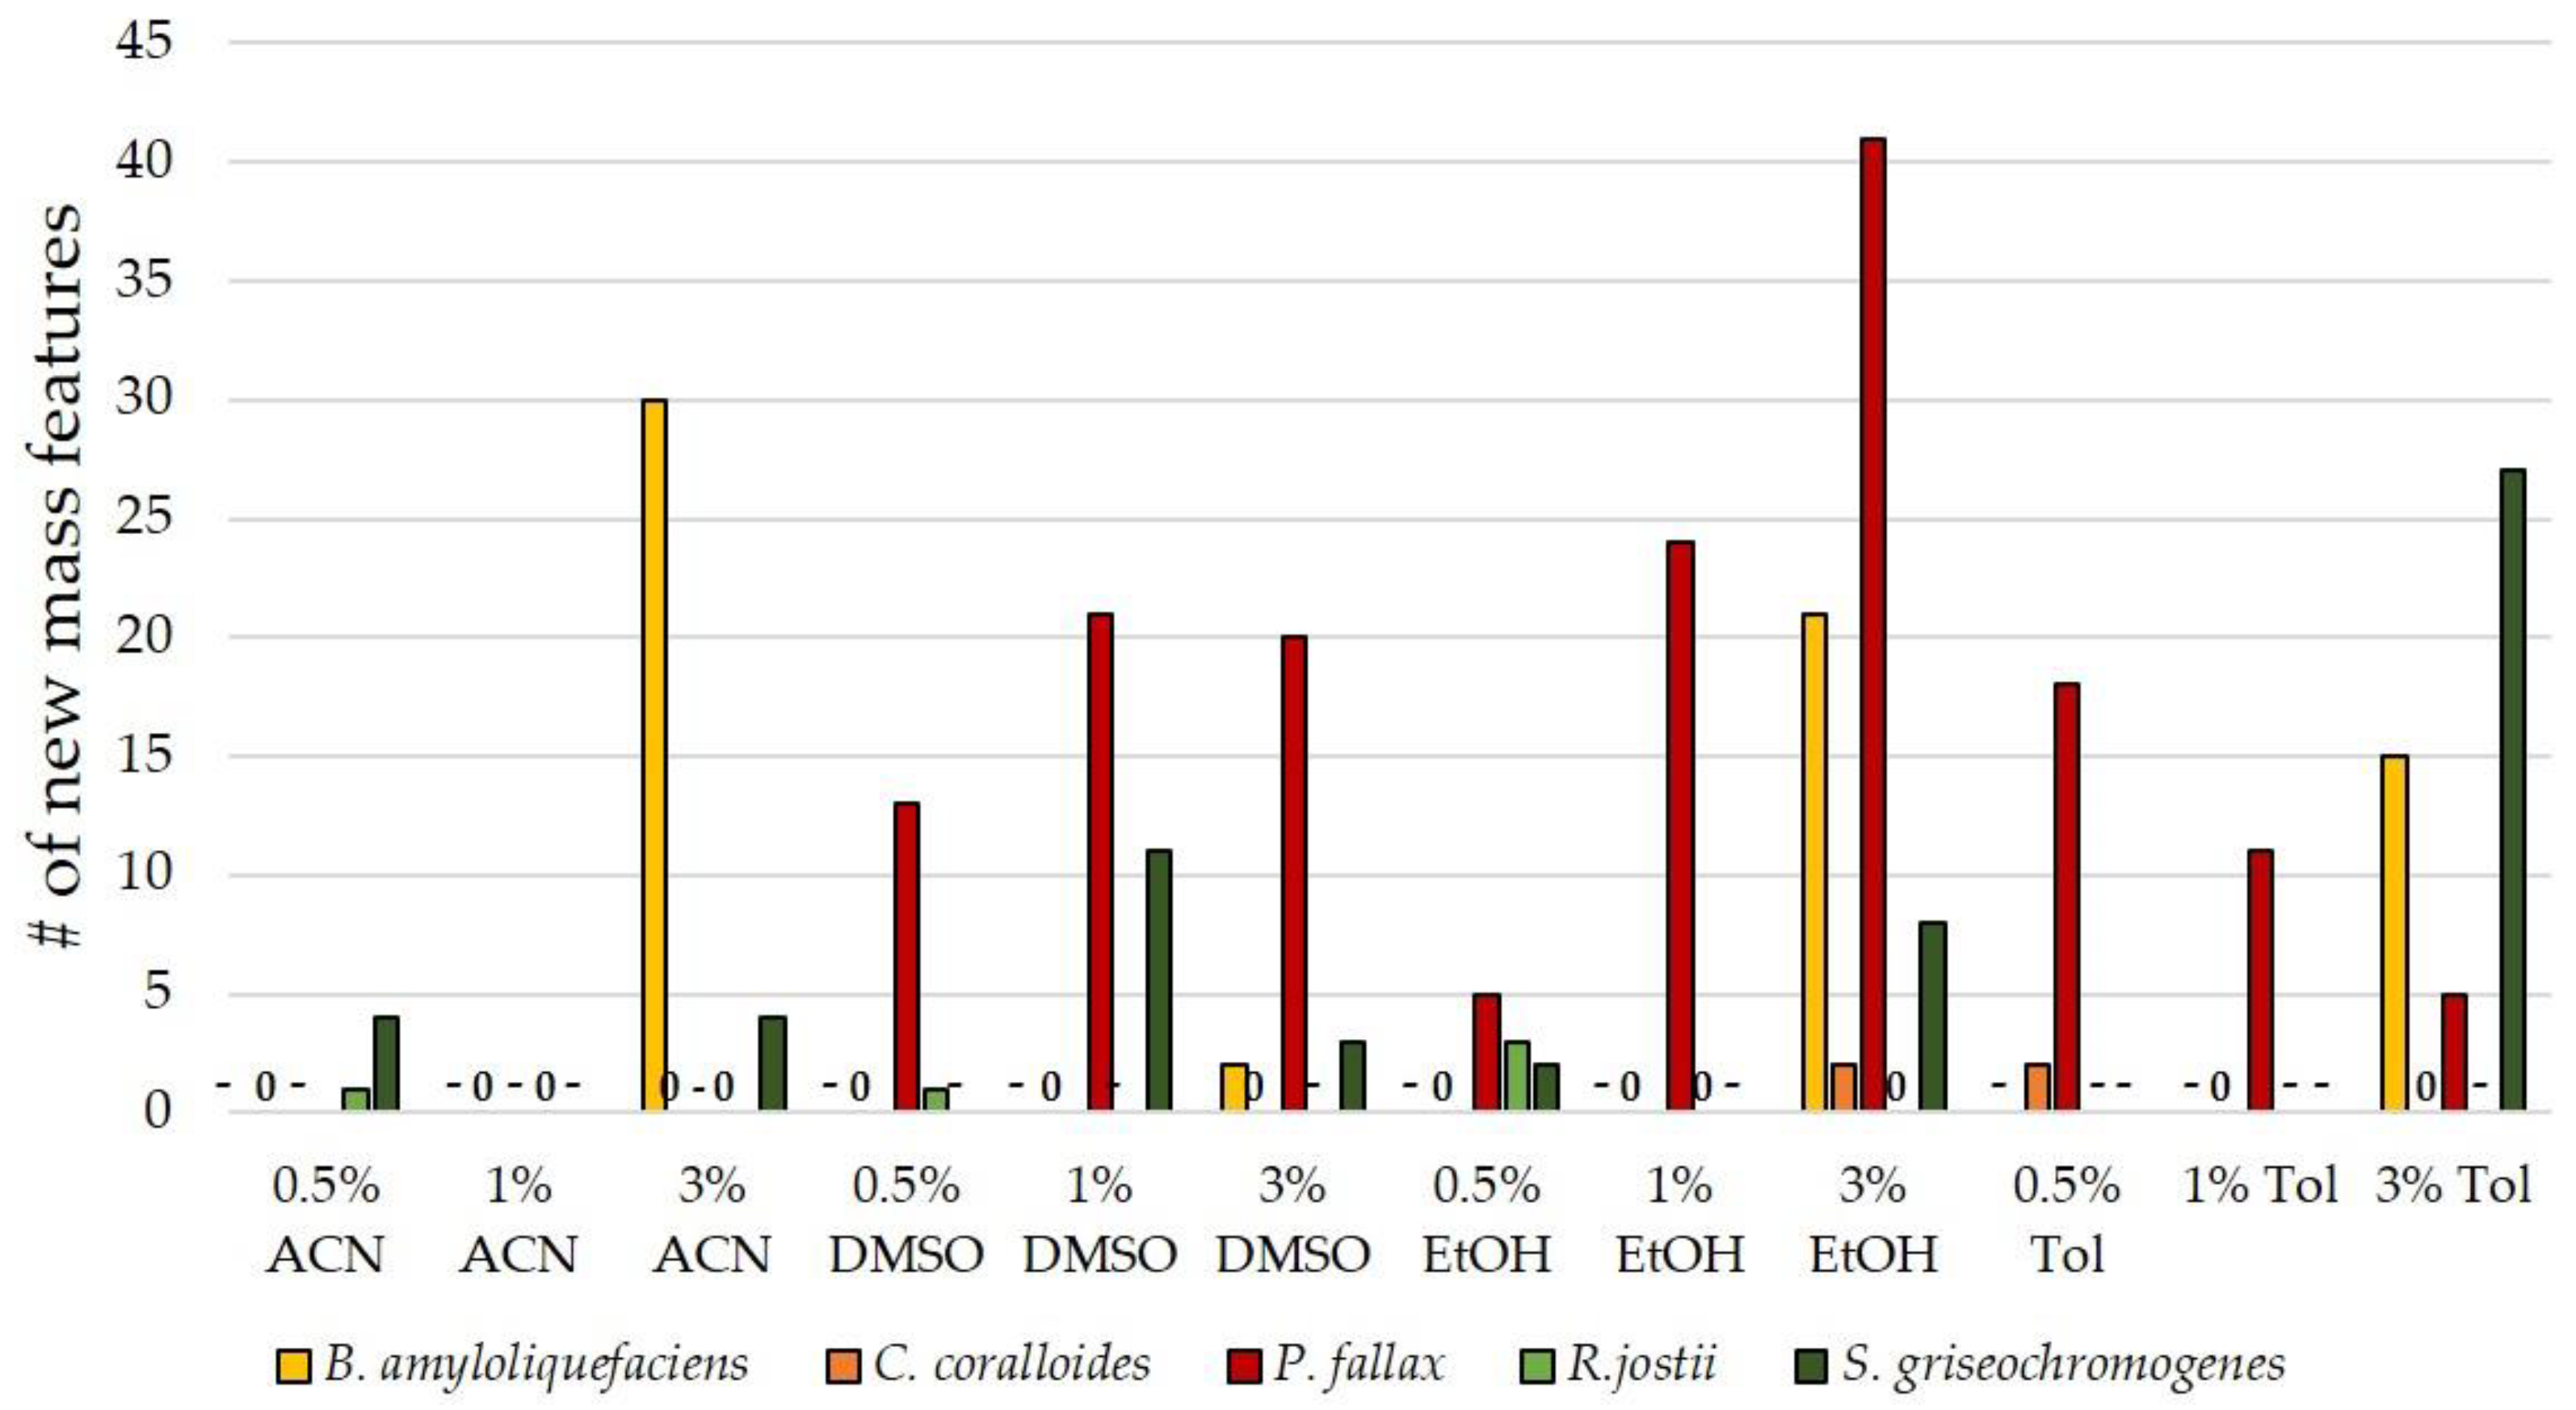
The analysis of the extracts of OSMAC conditions in the presence of solvents showed heterogeneous results across the selected strains. While C. coralloides was unsusceptible to almost all tested solvents and concentrations, P. fallax displayed up to 41 new mass features in the presence of DMSO, ethanol, and toluene (Figure 4). S. griseochromogenes responded with new mass features to all tested organic solvent additives. B. amyloliquefaciens reached between 15 and 30 new mass features in response to toluene, ethanol, and acetonitrile, but only produced 2 new mass features when supplemented with DMSO. This confirms the observation of Chen et al. that the solvent effects are highly dependent on the microbe’s stress tolerance [20]. Different tolerance mechanisms have been proposed for ethanol and DMSO, among them the action on the translational level and change of membrane structure, but no definite statement can be given at this point [21,61]. In sum, the OSMAC approach with solvent addition is a promising route to discover new SMs. Particularly, more organic solvents should be tested for their potential to increase the number of mass features as a proxy of new SMs.
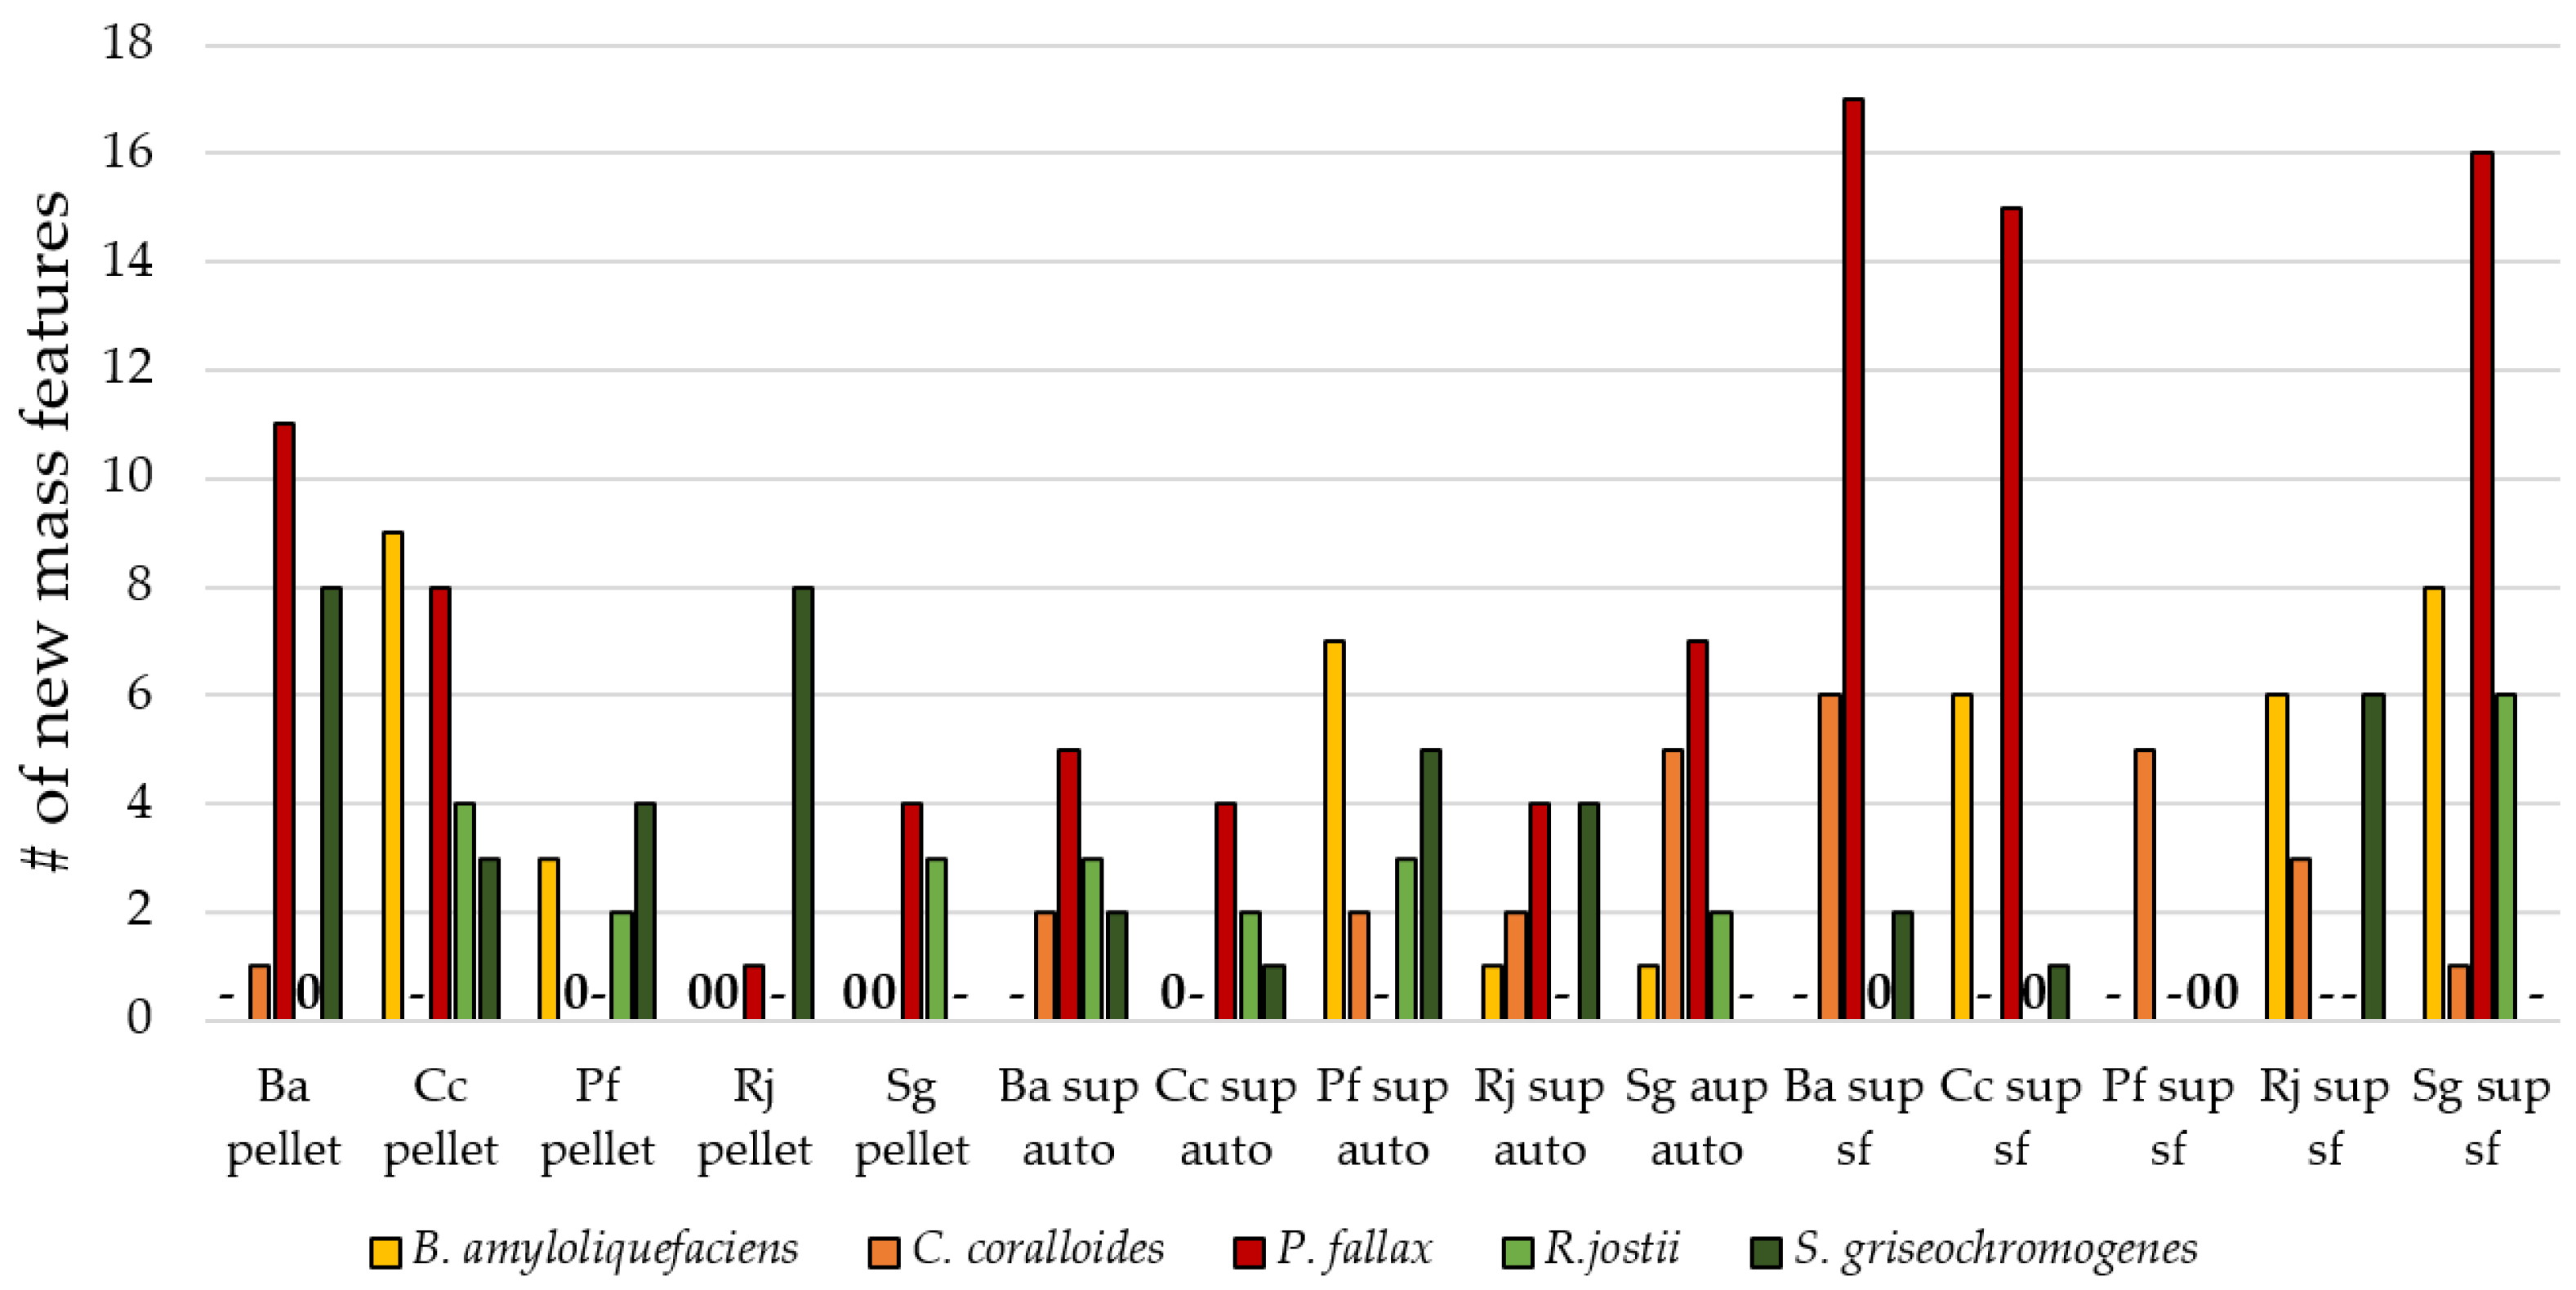
It has been shown in manifold research papers that co-cultivation is a productive way of exploiting the biosynthetic potential of microbes [62]. Several small molecules produced by one organism are bioactive in other organisms. For example, acyl homoserine lactones are actively involved in proteobacteria signaling and peptides are known as signaling molecules in gram-positive bacteria [63]. Moreover, the addition of supernatants and culture extracts, or the use of heat-killed cells, were successful in generating SMs [27,33]. However, the use of such biotic additives has not been widely exploited to mimic the presence of signal molecules and surface proteins to trigger a metabolic response in microorganisms. In order to study the influence of biotic additives on SM production, sterile-filtered and autoclaved supernatants obtained from various bacterial strains were added to bacterial cultures. New mass features were generated in both experimental setups in all tested strains (Figure 5). In general, we observed that pretreatment of bioactive additives had a minor influence on the number of mass features. The addition of sterile-filtered supernatant did not generally lead to a higher number of new mass features compared with the autoclaved supernatant. It is likely that most signaling molecules were sufficiently temperature-stable during the autoclaving process.
In the case of S. griseochromogenes cultures, two new mass features were detected when supplemented with sterile-filtered supernatant from B. amyloliquefaciens and another two mass features when supplemented with its autoclaved supernatant. These new mass features were not the same for sterile-filtered and autoclaved supernatant. The compounds Sg255 (Peak #255) originated from the S. griseochromogenes culture, Sg345 from cultivation with sterile-filtered supernatant, and Sg358 and Sg359 from cultivation with autoclaved supernatant. Sg255 was also produced when cultures were supplemented with 0.5% toluene or sterile-filtered supernatant of R. jostii. Sg345 was also produced when an autoclaved cell pellet of R. jostii was added. On the contrary, Sg358 and Sg359 were condition-specific and were only produced when autoclaved supernatant from B. amyloliquefaciens was added to S. griseochromogenes cultures.
In general, the supernatant types were equally well suited to generate new mass features. An exception was the OSMAC approach with P. fallax, with a clear benefit of the sterile-filtered supernatant. Here, we obtained an increased number of new mass features compared with all tested bacteria with added supernatants. The addition of autoclaved cell pellets also worked well for the generation of new mass features in P. fallax, R. jostii, and S. griseochromogenes cultures. Certain bacteria responded only to a specific bacterial pellet. For example, C. coralloides only reacted to the addition of B. amyloliquefaciens pellet and B. amyloliquefaciens only reacted to the myxobacteria C. coralloides and P. fallax. This observation might be due to the relationship between the known predatory myxobacteria and their prey, which often constitutes Bacillus species [64]. In comparison with the addition of organic solvents, the addition of the three types of biotic additives seems to generate new mass features in the selected bacteria more reliably.
To sum up, after data curation, 590 new mass features, which are likely to originate from secondary metabolism, from the five strains were obtained through OSMAC experiments. This number greatly surpasses the number of encoded BGCs and verifies the assumed biosynthetic potential of the selected bacterial strains. Table 6 summarizes the detected new mass features and the number of predicted BGCs in comparison with the genome size.
Apart from C. coralloides, the selected bacteria generated significantly more new mass features under the tested culture conditions than predicted. The results showed that a high number of predicted BGCs does not necessarily correspond to high biosynthetic potential in terms of a high number of new mass features, as evident when comparing, e.g., B. amyloliquefaciens and C. coralloides (Table 6). Overall, the selected bacteria produced many new mass features under the tested culture conditions and the selection of biosynthetically promising bacteria was thus successful. Additionally, it could be shown that the culture conditions with limited prior literature coverage—for example, addition of solvents, biotic additives, and limitations—produced many new mass features, which need to be further investigated.

3.4. Suitability of Culture Conditions for the Generation of New Mass Features

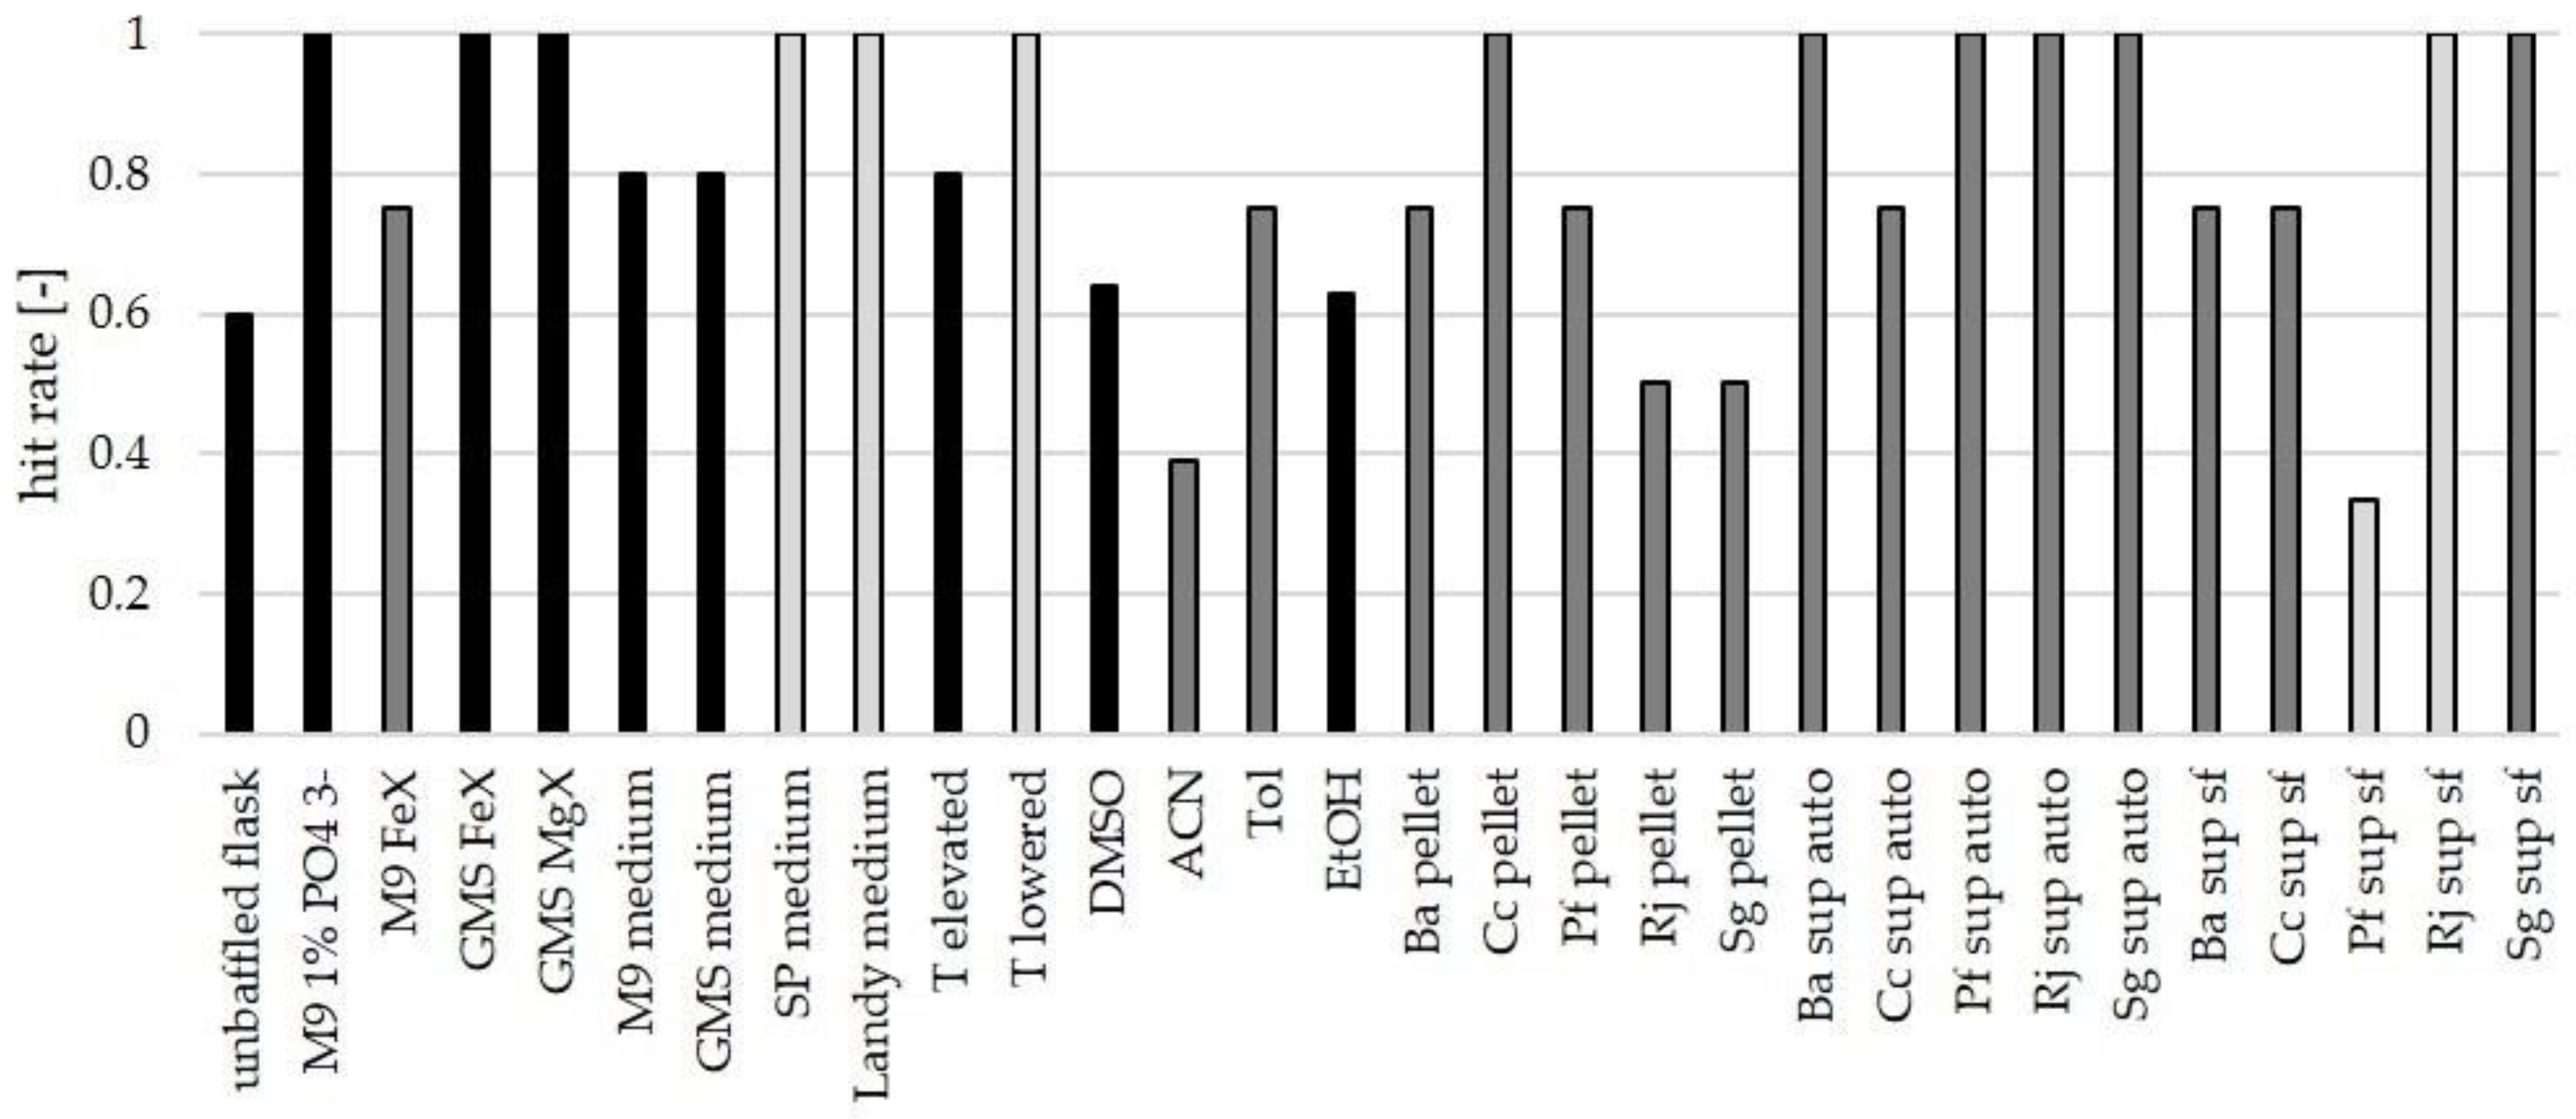
Interestingly, the tested culture conditions were not equally successful in eliciting new mass features and the selected bacteria seem to be susceptible to different conditions. Overall, it was observed that all tested culture conditions are pleiotropic as they generated more than one new mass feature in at least one bacterial strain [65]. The authors hence agree with Bode’s statement that no “common rules for all microorganisms” can be developed from OSMAC screenings and that “everything is allowed to find new natural products” as long as no complete understanding of secondary metabolism and its regulation is achieved [15]. However, our findings demonstrate that some culture conditions are more promising than others and constitute good starting points for future screenings. Therefore, we evaluated the selected culture conditions regarding their general capability to provoke new mass features from the considered bacteria. This capability is termed hit rate and is defined as the number of strains generating new mass features in response to one culture condition over the number of tested strains. The results show that 13 of the 30 tested culture conditions led to the detection of new mass features in all strains. In other words, 43% of the tested OSMAC conditions led to a hit rate of 1 (Figure 6).
The addition of several biotic additives (cell pellet of C. coralloides, autoclaved supernatants of all strains, but C. coralloides) and some limitation experiments (PO43−-limitation on M9 medium and Fe3+- and Mg2+-limitation on GMS medium) have reliably provoked new mass features from all tested microorganisms. These OSMAC conditions are recommended as starting points for future screenings with other bacteria.
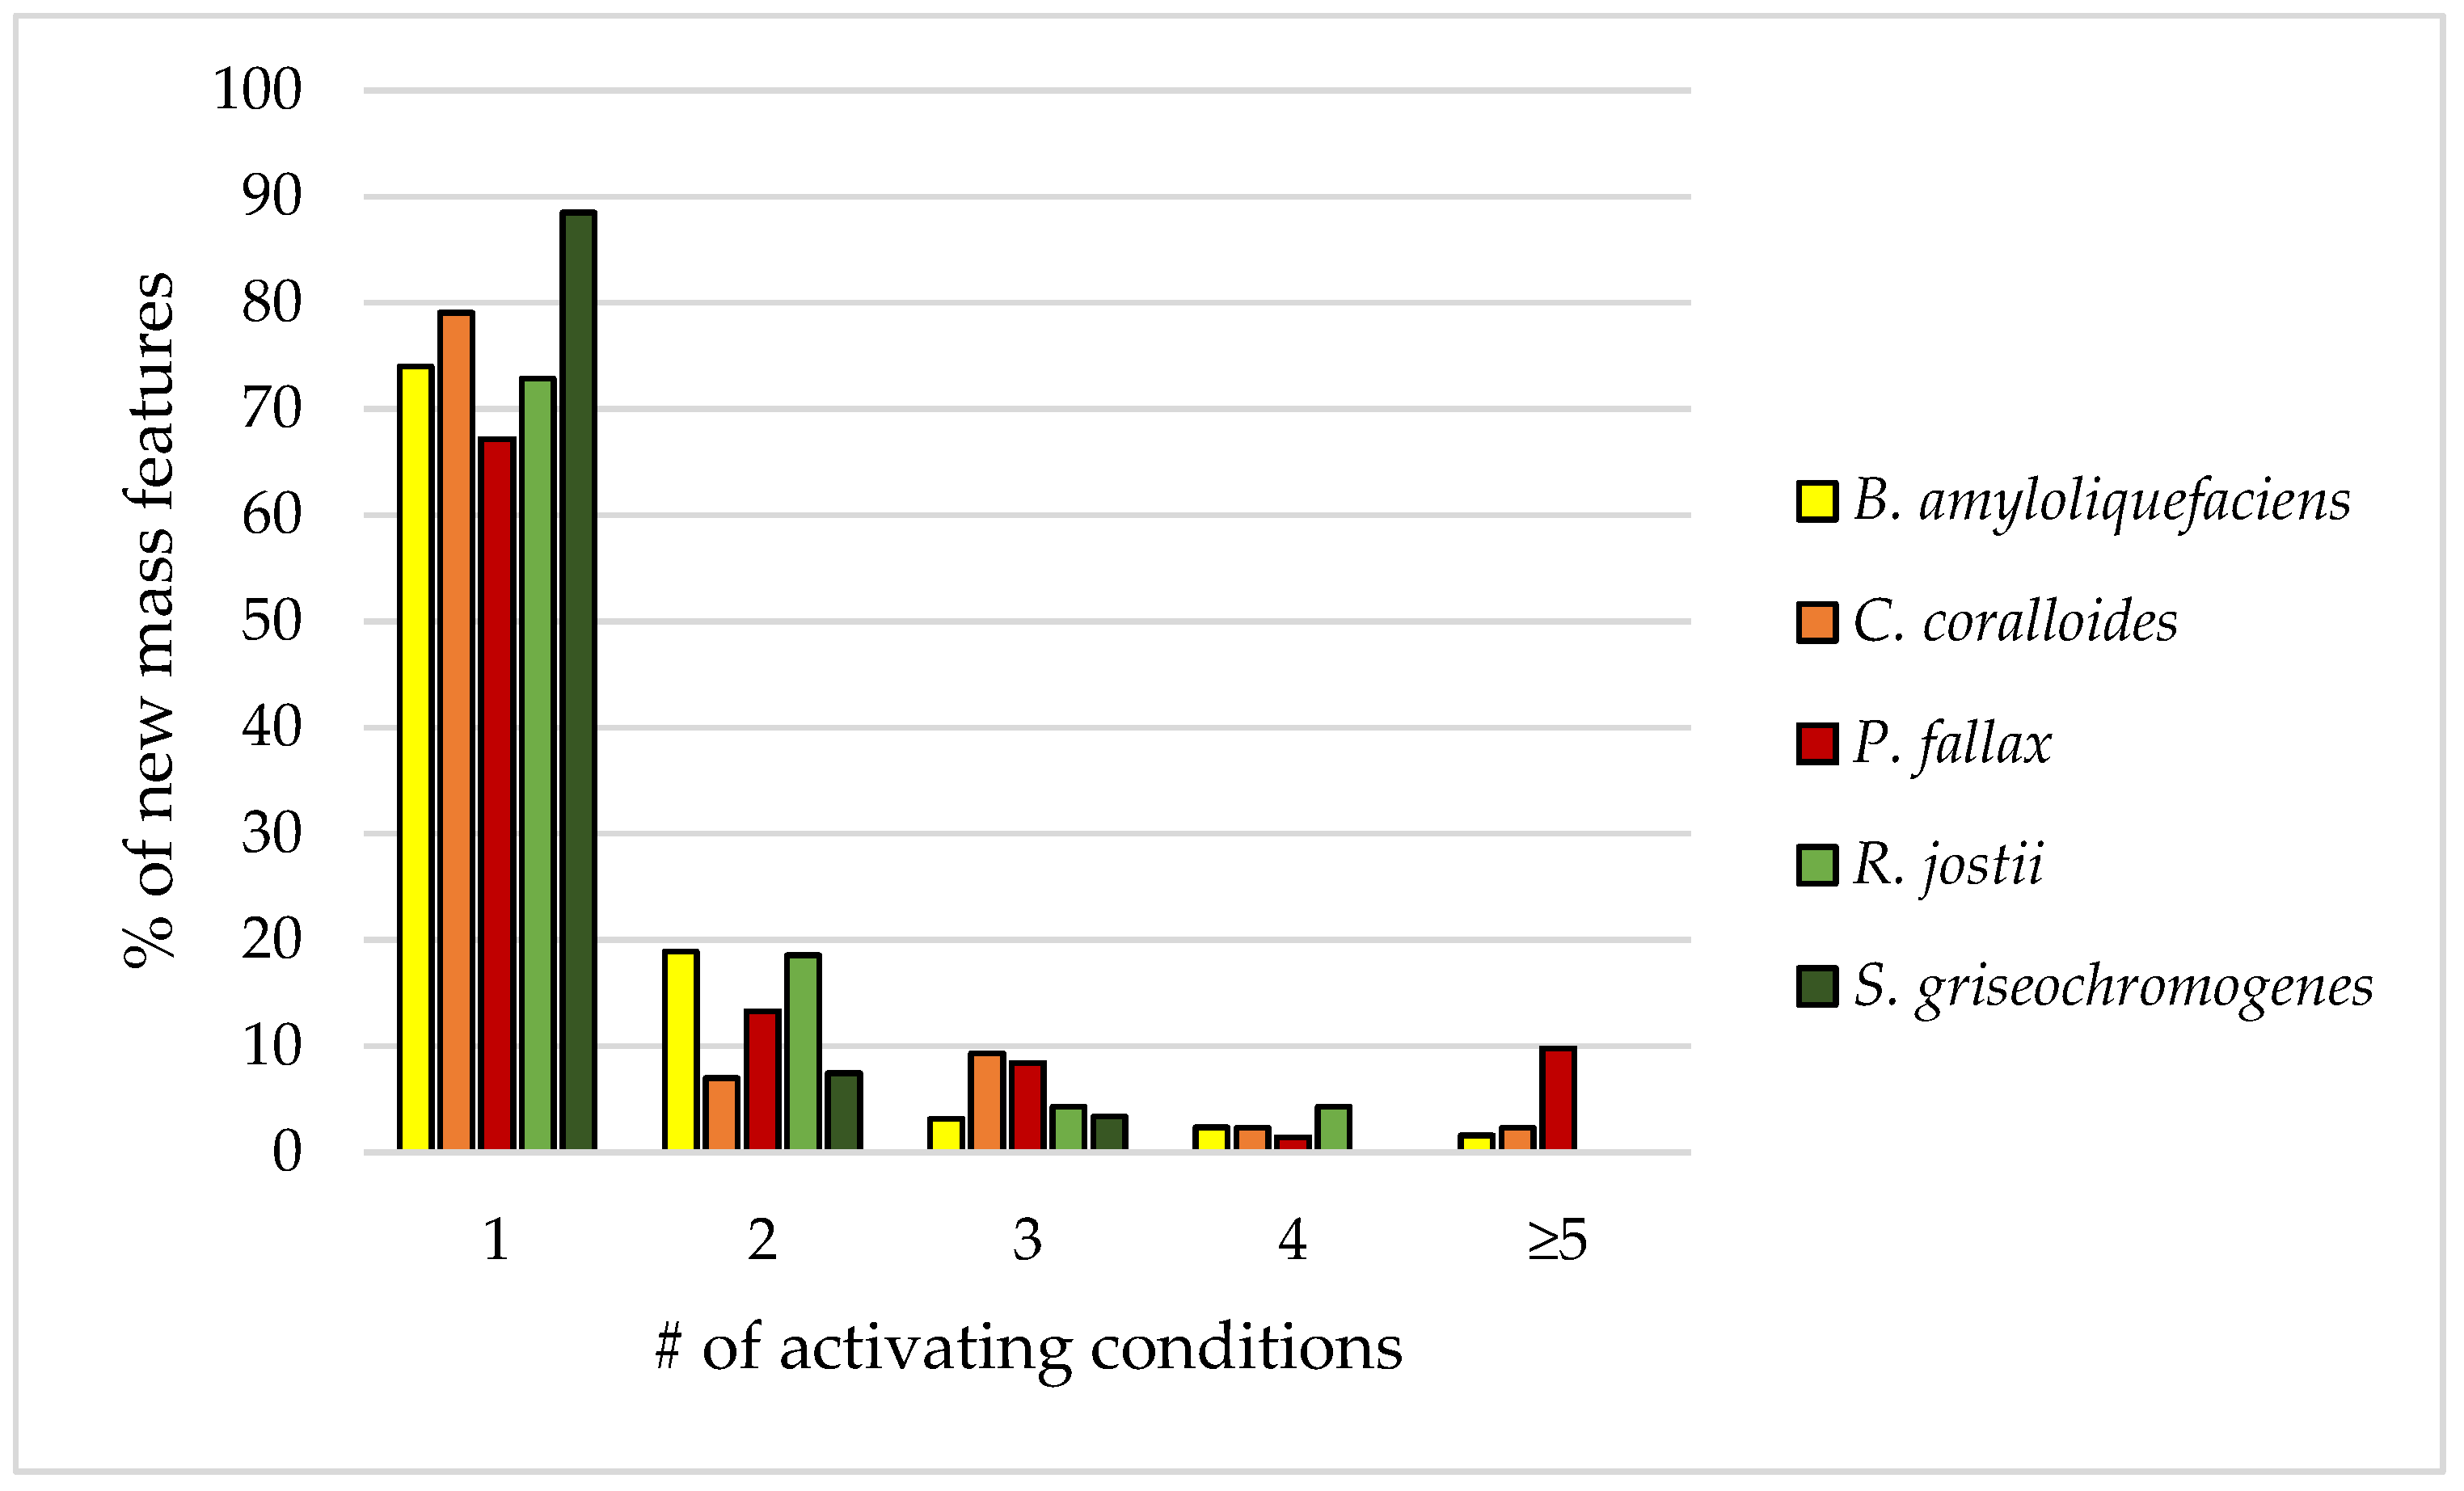
Our analysis also shows that, in most tested strains, more than 70% of the generated new mass features were produced under exactly one of the tested culture conditions (condition-specific). Between 7 and 19% of the new mass features were generated under two culture conditions, and even less under three or more culture conditions (Figure 7).
In general, we postulate that a broad screening of many culture conditions with a high hit rate applied to carefully selected and promising bacterial strains is a recommendable way for the generation of new mass features.

3.5. Putative Annotation of New Mass Features

The analysis of HPLC-MS data resulted in detailed lists of new mass features for each investigated sample containing Mr, tRs, and culture conditions (Tables S16–S20). To assess the likelihood of the new mass features being SMs, they were categorized into groups based on their physicochemical properties. The categorization was carried out by comparing the Mr and tR of the mass features to published data of 56 primary metabolites and 128 bacterial SMs (Figures S15 and S16). The 590 new mass features were evaluated regarding their intensity and peak area with heat maps for prioritization (Tables S21–S25, Figures S17–S19). The top 5% regarding peak area were subjected to HPLC-MS2 measurements to obtain their compound-specific fragmentation patterns. Identified mass features, their corresponding compounds, and means of identification are listed in Table 7. The corresponding producing conditions are listed in Table S26. Matches to reference compounds comprised matching tRs and [M + H]+. The mass deviation was less than 5 ppm in all cases, but myxochelin A (Δppm = 10), and is specified in the Supplementary Material.
The production of bacillibactin (Ba58), myxochelin A (Pf336), and desferrioxamine B (Sg117 derivative, Sg130 Al-complex) was already described above, as their BGCs were predicted by antiSMASH. Following the predicted compounds, various novel compounds could be assigned.
Ba3 has been identified as the cyclic dipeptide cyclo-(Tyr-Pro) (Figure S20) and has not been reported in the literature as a product from B. amyloliquefaciens DSM7. It is produced under various culture conditions: Mg2+-limitation, and two different nutrient-rich media. Strains from B. subtilis, are generally regarded as producers of cyclic peptides, which have antimicrobial activity against gram-negative strains [66,67].
The mass features named Ba8, Ba9, and Ba10 have been putatively matched with iturins A-4, A-6, and A-8 (Figures S21–S24). Interestingly, no BGC related to iturin was detected by antiSMASH, although it is a common antifungal SM of B. amyloliquefaciens strains [68]. A detailed analysis of the B. amyloliquefaciens DSM7 genome independent of antiSMASH conducted in 2011 revealed an iturin BGC and a follow-up study is the only literature report of iturin production by this exact strain [69,70]. In the study by Borriss et al., iturin A was detected in DSM7 cultures grown in Landy medium [70], while we detected the compound in LB cultures. Because our antiSMASH genome analysis revealed an orphan NRPS BGC on the genome of B. amyloliquefaciens DSM7, this may be the BGC responsible for iturin A synthesis.
Cc42 has been identified as nocardamin, a cyclic desferrioxamine B derivative, and thus a siderophore [71] (Figure S25), This compound has not yet been reported in the literature as a product from C. coralloides. Nocardamin has only been detected in actinomycetes, mostly cultures of Streptomyces, and has, to the best of our knowledge, never before been reported for any proteobacterium. Our antiSMASH analysis has not revealed the nocardamin BGC. Nevertheless, the C. coralloides genome is not fully annotated and harbors many orphan BGCs, which could potentially code for the nocardamin BGC.
Streptomycetes are known producers of desferrioxamine siderophores, which include nocardamin (=desferrioxamine E) [72]. Different desferrioxamine derivatives have been detected in our S. griseochromogenes OSMAC cultures as well as in the control group. It has been observed that a change in culture conditions influences the distribution of produced derivatives (data not shown). Mass feature Sg117, desmethyl-enyl nocardamin, was only detected in the iron-deprived M9 culture (M9 FeX) and the complex of desferrioxamine B with aluminum was only detected in cultures supplemented with DMSO (Figures S26 and S27).

4. Conclusions

The biosynthetically promising and fully sequenced bacterial strains B. amyloliquefaciens DSM7, C. coralloides DSM2259, P. fallax HKI727, R. jostii DSM77419, and S. griseochromogenes DSM40499 were selected for OSMAC experiments based on genome mining, availability, and literature research to activate their predicted BGCs. The five selected bacteria were cultured under 30 different OSMAC conditions and 308 extracts were obtained, resulting in 590 new mass features. Among all tested bacteria, five BGCs could be activated using OSMAC conditions: surfactin variants and bacillibactin from B. amyloliquefaciens extracts, myxochelin A and putatively nostophycin from P. fallax extracts, and putatively albaflavenone from S. griseochromogenes extracts. Additionally, bacillaene and desferrioxamine B were verified in cultures of B. amyloliquefaciens and S. griseochromogenes, respectively. Because these two compounds were already present in the control group samples, their BGCs were not activated. Still, some predicted BGCs remained silent under the tested culture conditions, some even despite 100% sequence similarity. These results demonstrate that high sequence similarity alone is not an adequate indicator for the biosynthetic potential of strains. Furthermore, the genomes of the investigated bacteria possess high numbers of orphan BGCs. Thus, the biosynthetic potential of the investigated bacteria has not yet been fully elucidated and holds more to discover.
The culture conditions with limited literature coverage have successfully contributed to the activation of predicted BGCs as well as to the generation of new mass features. Some culture conditions provoked the production of new mass features more reliably than others. Furthermore, more than 70% of the generated new mass features were condition-specific. The biological potential of SM production by varying culture conditions is obviously far from being exhausted, as demonstrated by this broadly chosen OSMAC approach. Most of the tested bacteria surpass the expected number of novel mass features. The high number of provoked new mass features, e.g., 147 new peaks in S. griseochromogenes DSM40499 extracts, validates the high biosynthetic potential of the selected strains. From these observations, we conclude the following statements: Firstly, PO43--limited M9 medium, Fe3+-limited GMS medium, and several biotic additives are promising starting points for future screenings. Secondly, a broad screening with many tested culture conditions and a small number of carefully selected strains is a promising approach for the search for novel bacterial SMs because of the condition-specificity of mass features. If a broader screening leads to more mass features provoked by several conditions, statistical analysis tools like principal component analysis (PCA) could be employed to study the silent cluster activation mechanisms in more detail [73]. The large number of new mass features presents us with new challenges, namely the elucidation of the novel compounds and the investigation of their biological properties. The potential to find new promising molecules with interesting properties among these substances is enormous.

Supplementary Materials

The following are available online at https://www.mdpi.com/2218-273X/11/2/193/s1, Figure S1: Growth curves of selected bacterial under control group conditions, Figure S2: antiSMASH predictions for Bacillus amyloliquefaciens DSM7, Figure S3: antiSMASH predictions for Rhodococcus jostii DSM44719, Figure S4: antiSMASH predictions for Streptomyces griseochromogenes DSM40499, Figure S5: antiSMASH predictions for Corallococcus coralloides DSM2259, Figure S6: antiSMASH predictions for Pyxidicoccus fallax HKI727, Figure S7: Extracted Ion Chromatograms (EICs) of singly and double charged of putative bacillaene from B. amyloliquefaciens cultures grown on LB medium and corresponding MS-spectrum, Figure S8: Comparison of chromatograms (EICs) and MS-spectra of desferrioxamine B reference compound and EIC of S. griseochromogenes control group sample, Figure S9: (a) Comparison of chromatograms of surfactin reference compound and Extracted Ion Chromatograms (EICs) from sample B. amyloliquefaciens grown at 40 °C. (b) Comparison of MS-spectra of surfactin reference compound and sample B. amyloliquefaciens grown at 40 °C, Figure S10: Experimental fragmentation pattern of bacillibactin with 45eV, Figure S11: Total Ion Chromatogram (TIC) and fragmentation pattern of putative nostophycin in sample P. fallax 6 Vol% toluene, Figure S12: MetFrag results of in silico fragmentation of PubChem entry #101945102 compared with experimental MS2 spectrum of putative nostophycin, Figure S13: Comparison of chromatograms and MS-spectra of myxochelin A reference compound and EIC of sample P. fallax M9 1% PO43-, Figure S14: Extracted Ion Chromatogram and corresponding MS-spectrum of putative albaflavenone from oxygen limitation sample of S. griseochromogenes culture, Figure S15: Comparison of physicochemical data of bacterial primary and secondary metabolites taken from PubChem, Figure S16: Visualization of employed HPLC method and correlation of logP values and ACN percentage at tR, Figure S17: Heat map for new mass features of B. amyloliquefaciens DSM7 and utilized color code, Figure S18: (a) Heat map of S. griseochromogenes DSM40499; (b) Heat map of C. coralloides DSM2259. Rows = mass features, columns = producing conditions, Figure S19: (a) Heat map of P. fallax HKI727; (b) Heat map of R. jostii DSM44719. Rows = mass features, columns = producing conditions, Figure S20: Comparison of Extracted Ion Chromatograms (EICs) and MS spectra of cyclo-(tyr-pro) reference compound and cyclo-(tyr-pro) in B. amyloliquefaciens sample grown at 40 °C, Figure S21: Extracted Ion Chromatograms of putative iturins A4, A-6 and A-8 from B. amyloliquefaciens sample grown on LB medium and Total Ion Chromatogram of MS2-experiment from the same sample, Figure S22: MS2-spectra of putative iturin A-4, A-6 and A-8 masses in B. amyloliquefaciens sample grown on LB medium, Figure S23: MetFrag settings used for the verification of MS2-fragments of putative iturin A-8 with corresponding PubChem entry #10866068, Figure S24: MetFrag explanations of fragments obtained through MS2-analysis of mass 1085.59 (putative iturin A-8) in B. amyloliquefaciens DSM7 sample grown on LB medium, Figure S25: Comparison of Extracted Ion Chromatograms (EICs) and MS spectra of nocardamin reference compound and nocardamin in C. coralloides sample grown in an unbaffled flask, Figure S26: Results of GNPS search of desmethyl enyl nocardamin MS2-spectrum (mirror match and overview), Figure S27: Results of GNPS search of desferrioxamine B + Al MS2-spectrum (mirror match and overview). Table S1: NCBI Accession numbers of candidate strains examined with antiSMASH, Table S2: List of chemicals, chemical formulae, and supplier, Table S3: Composition of NB medium, Table S4: Composition of SP medium, Table S5: Composition of MD1 medium, Table S6: Composition of TSB medium, Table S7: Composition of GYM medium, Table S8: Composition of CY/H medium, Table S9: Composition of LB medium, Table S10: Composition of MD1+G medium, Table S11: Composition of Landy medium, Table S12: Composition of Glucose Minerals Salts (GMS) medium, Table S13: Composition of M9 medium and 1% PO43- M9 medium, Table S14: Settings for vendor format raw data conversion with msConvert according to GNPS website instructions, Table S15: Steps for raw data preparation with MZmine 2.35, Table S16: Steps for peak list processing with MZmine 2.35 with tR = retention time, Table S17: Numbers of BGCs of different natural product classes present on the genomes of selected strains, Table S18: Color code used for natural product classes in genome maps, Table S19: Overview of compounds and corresponding producing conditions from selected strains. Table S20: m/z of fragments generated through MS2 experiment of sample P. fallax 6 Vol% toluene and corresponding intensities used for in silico fragmentation of PubChem entry #101945102 for verification of nostophycin, Table S21: List of new mass features detected in extracts from B. amyloliquefaciens DSM7, Table S22: List of new mass features detected in extracts from C. coralloides DSM2259, Table S23: List of new mass features detected in extracts from P. fallax HKI727, Table S24: List of new mass features detected in extracts from R. jostii DSM44719, Table S25: List of new mass features detected in extracts from S. griseochromogenes DSM40499, Table S26: Overview of new mass features, proposed compounds, and corresponding producing conditions from selected strains, Table S27: Summary of fragmentation patterns and collision energies (CE) of compounds identified among the new mass features, Table S28: Summary of detected compounds and level of confidence for their identification.

Author Contributions

Conceptualization, J.S. and S.L.; methodology, J.S.; software, J.S.; validation, J.S.; formal analysis, J.S.; investigation, J.S.; resources, S.L.; data curation, J.S.; writing—original draft preparation, J.S.; writing—review and editing, G.H. and K.R.; visualization, J.S.; supervision, S.L.; project administration, S.L.; funding acquisition, S.L. All authors have read and agreed to the published version of the manuscript.

Funding

This research received no external funding.

Institutional Review Board Statement

Ethical review and approval were waived for this study, because the studies did not involve experimental tests on humans or animals.

Informed Consent Statement

Not applicable.

Data Availability Statement

Data is contained within the article or Supplementary Material.

Acknowledgments

The authors would like to acknowledge the scientific advice and help with analytics provided by C. Zammarelli as well as the scientific exchange with M. Nett and Dipl.-Pharm. A. Sester, which enriched this study.

Conflicts of Interest

The authors declare no conflict of interest.

References

  1. McMurry, J. Secondary Metabolites: An Introduction to Natural Products Chemistry. In Organic Chemistry with Biological Applications; Springer: Berlin/Heidelberg, Germany, 2015; pp. 1016–1046. ISBN 9781285842912. [Google Scholar]
  2. Luckner, M. What is secondary metabolism? In Secondary Metabolism in Microorganisms, Plants, and Animals, 3rd ed.; Springer: Berlin/Heidelberg, Germany, 1990; pp. 15–23. [Google Scholar]
  3. Newman, D.J.; Cragg, G.M. Natural Products as Sources of New Drugs over the Nearly Four Decades from 01/1981 to 09/2019. J. Nat. Prod. 2020, 83, 770–803. [Google Scholar] [CrossRef]
  4. Luckner, M. Expression and Control, Secondary Metabolism in Microorganisms, Plants, and Animals, 3rd ed.; Springer: Berlin/Heidelberg, Germany, 1990; pp. 44–62. [Google Scholar]
  5. Wu, C.; Zacchetti, B.; Ram, A.F.J.; Van Wezel, G.P.; Claessen, D.; Choi, Y.H. Expanding the chemical space for natural products by Aspergillus-Streptomyces co-cultivation and biotransformation. Sci. Rep. 2015, 5, 1–10. [Google Scholar] [CrossRef] [Green Version]
  6. Surup, F.; Viehrig, K.; Mohr, K.I.; Herrmann, J.; Jansen, R.; Müller, R. Disciformycins A and B: 12-membered macrolide glycoside antibiotics from the myxobacterium pyxidicoccus fallax active against multiresistant staphylococci. Angew. Chem. Int. Ed. 2014, 53, 13588–13591. [Google Scholar] [CrossRef] [PubMed]
  7. Rateb, M.E.; Houssen, W.E.; Harrison, W.T.A.; Deng, H.; Okoro, C.K.; Asenjo, J.A.; Andrews, B.A.; Bull, A.T.; Goodfellow, M.; Ebel, R.; et al. Diverse Metabolic Profiles of a Streptomyces Strain Isolated from a Hyper-arid Environment. J. Nat. Prod. 2011, 74, 1965–1971. [Google Scholar] [CrossRef] [PubMed]
  8. Jamil, B.; Hasan, F.; Hameed, A.; Ahmed, S. Isolation of bacillus subtilis MH-4 from soil and its potential of polypeptidic antibiotic production. Pak. J. Pharm. Sci. 2007, 20, 26–31. [Google Scholar] [PubMed]
  9. Weber, T.; Blin, K.; Duddela, S.; Krug, D.; Kim, H.U.; Bruccoleri, R.; Lee, S.Y.; Fischbach, M.A.; Müller, R.; Wohlleben, W.; et al. AntiSMASH 3.0-A comprehensive resource for the genome mining of biosynthetic gene clusters. Nucleic Acids Res. 2015, 43, W237–W243. [Google Scholar] [CrossRef] [Green Version]
  10. Wilkinson, B.; Micklefield, J. Mining and engineering natural-product biosynthetic pathways. Nat. Chem. Biol. 2007, 3, 379–386. [Google Scholar] [CrossRef]
  11. Okada, B.K.; Seyedsayamdost, M.R. Antibiotic dialogues: Induction of silent biosynthetic gene clusters by exogenous small molecules. FEMS Microbiol. Rev. 2017, 41, 19–33. [Google Scholar] [CrossRef] [Green Version]
  12. Zarins-Tutt, J.S.; Barberi, T.T.; Gao, H.; Mearns-Spragg, A.; Zhang, L.; Newman, D.J.; Goss, R.J.M. Prospecting for new bacterial metabolites: A glossary of approaches for inducing, activating and upregulating the biosynthesis of bacterial cryptic or silent natural products. Nat. Prod. Rep. 2016, 33, 54–72. [Google Scholar] [CrossRef] [Green Version]
  13. Scherlach, K.; Hertweck, C. Triggering cryptic natural product biosynthesis in microorganisms. Org. Biomol. Chem. 2009, 7, 1753–1760. [Google Scholar] [CrossRef]
  14. Rackham, E.J.; Grüschow, S.; Ragab, A.E.; Dickens, S.; Goss, R.J.M. Pacidamycin biosynthesis: Identification and heterologous expression of the first uridyl peptide antibiotic gene cluster. ChemBioChem 2010, 11, 1700–1709. [Google Scholar] [CrossRef] [PubMed]
  15. Bode, B.H.; Bethe, B.; Höfs, R.; Zeeck, A. Big Effects from Small Changes: Possible Ways to Explore Nature’s Chemical Diversity. ChemBioChem 2002, 3, 619–627. [Google Scholar] [CrossRef]
  16. Bode, H.B.; Walker, M.; Zeeck, A. Secondary metabolites by chemical screening. 42 Cladospirones B to I from Sphaeropsidales sp. F-24’707 by variation of culture conditions. Eur. J. Org. Chem. 2000, 3185–3193. [Google Scholar] [CrossRef]
  17. Machushynets, N.V.; Wu, C.; Elsayed, S.S.; Hankemeier, T.; van Wezel, G.P. Discovery of novel glycerolated quinazolinones from Streptomyces sp. MBT27. J. Ind. Microbiol. Biotechnol. 2019. [Google Scholar] [CrossRef] [Green Version]
  18. Li, W.; Ding, L.; Wang, N.; Xu, J.; Zhang, W.; Zhang, B.; He, S.; Wu, B.; Jin, H. Isolation and Characterization of Two New Metabolites from the Sponge-Derived Fungus Aspergillus sp. LS34 by OSMAC Approach. Mar. Drugs 2019, 17, 283. [Google Scholar] [CrossRef] [Green Version]
  19. Urem, M.; Świątek-Połatyńska, M.A.; Rigali, S.; van Wezel, G.P. Intertwining nutrient-sensory networks and the control of antibiotic production in Streptomyces. Mol. Microbiol. 2016, 102, 183–195. [Google Scholar] [CrossRef] [Green Version]
  20. Chen, G.; Wang, G.; Li, X.; Waters, B.; Davies, J. Enhanced Production of Microbial Metabolites in the Presence of Dimethyl Sulfoxide streptomycin (phenotypic suppression, for example) can be removed, and the pellet washed twice by resuspending in Morphological Observations Streptomyces glaucescens wa. J. Antibiot. (Tokyo) 2000, 53, 1145–1153. [Google Scholar] [CrossRef] [Green Version]
  21. Lindquist, S. The Heat-Shock Response. Annu. Rev. Biochem. 1986, 55, 1151–1191. [Google Scholar] [CrossRef]
  22. Doull, J.L.; Singh, A.K.; Hoare, M.; Ayer, S.W. Conditions for the production of jadomycin B by Streptomyces venezuelae ISP5230: Effects of heat shock, ethanol treatment and phage infection. J. Ind. Microbiol. 1994, 13, 120–125. [Google Scholar] [CrossRef]
  23. Weinberg, E.D. Roles of trace metals in transcriptional control of microbial secondary metabolism. Biol. Met. 1990, 2, 191–196. [Google Scholar] [CrossRef]
  24. Paranagama, P.A.; Wijeratne, E.M.; Gunatilaka, A.A. Uncovering Biosynthetic Potential of Plant-Associated Fungi: Effect of Culture Conditions on Metabolite Production by Paraphaeosphaeria quadriseptata and Chaetomium chiversii(1). J. Nat. Prod. 2007, 21, 1939–1945. [Google Scholar] [CrossRef] [PubMed]
  25. Freemont, P.; Polizzi, K.M.; Goers, L. Co-culture systems and technologies: Taking synthetic biology to the next level. J. R. Soc. Interface 2014, 11. [Google Scholar] [CrossRef] [Green Version]
  26. Moody, S.C. Microbial co-culture: Harnessing intermicrobial signaling for the production of novel antimicrobials. Future Microbiol. 2014, 9, 575–578. [Google Scholar] [CrossRef] [PubMed] [Green Version]
  27. Mearns-Spragg, A.; Bregu, M.; Boyd, K.G.; Burgess, J.G. Cross-species, induction and enhancement of antimicrobial activity produced by epibiotic bacteria from marine algae and invertebrates, after exposure to terrestrial bacteria. Lett. Appl. Microbiol. 1998, 27, 142–146. [Google Scholar] [CrossRef] [PubMed]
  28. Hussain, A.; Rather, M.A.; Dar, M.S.; Aga, M.A.; Ahmad, N.; Manzoor, A.; Qayum, A.; Shah, A.; Mushtaq, S.; Ahmad, Z.; et al. Novel bioactive molecules from Lentzea violacea strain AS 08 using one strain-many compounds (OSMAC) approach. Bioorganic Med. Chem. Lett. 2017, 27, 2579–2582. [Google Scholar] [CrossRef]
  29. Santos, J.D.; Vitorino, I.; De La Cruz, M.; Díaz, C.; Cautain, B.; Annang, F.; Pérez-Moreno, G.; Martinez, I.G.; Tormo, J.R.; Martín, J.M.; et al. Bioactivities and extract dereplication of actinomycetales isolated from marine sponges. Front. Microbiol. 2019, 10, 1–11. [Google Scholar] [CrossRef]
  30. Rigali, S.; Titgemeyer, F.; Barends, S.; Mulder, S.; Thomae, A.W.; Hopwood, D.A.; van Wezel, G.P. Feast or famine: The global regulator DasR links nutrient stress to antibiotic production by Streptomyces. EMBO Rep. 2008, 9, 670–675. [Google Scholar] [CrossRef] [Green Version]
  31. Amano, S.; Morota, T.; Kano, Y.; Narita, H.; Hashidzume, T.; Yamamoto, S.; Mizutani, K.; Sakuda, S.; Furihata, K.; Takano-Shiratori, H. Promomycin, a polyether promoting antibiotic production in Streptomyces spp. J. Antibiot. (Tokyo) 2010, 63, 486–491. [Google Scholar] [CrossRef] [Green Version]
  32. Grond, S.; Papastavrou, I.; Zeeck, A. Novel α-L-rhamnopyranosides from a single strain of Streptomyces by supplement-induced biosynthetic steps. Eur. J. Org. Chem. 2002, 3237–3242. [Google Scholar] [CrossRef]
  33. Schäberle, T.F.; Orland, A.; König, G.M. Enhanced production of undecylprodigiosin in Streptomyces coelicolor by co-cultivation with the corallopyronin A-producing myxobacterium, Corallococcus coralloides. Biotechnol. Lett. 2014, 36, 641–648. [Google Scholar] [CrossRef]
  34. Angell, S.; Bench, B.J.; Williams, H.; Watanabe, C.M.H. Pyocyanin Isolated from a Marine Microbial Population: Synergistic Production between Two Distinct Bacterial Species and Mode of Action. Chem. Biol. 2006, 13, 1349–1359. [Google Scholar] [CrossRef] [PubMed] [Green Version]
  35. Martín, J.F.; Sola-Landa, A.; Santos-Beneit, F.; Fernández-Martínez, L.T.; Prieto, C.; Rodríguez-García, A. Cross-talk of global nutritional regulators in the control of primary and secondary metabolism in Streptomyces. Microb. Biotechnol. 2011, 4, 165–174. [Google Scholar] [CrossRef] [PubMed] [Green Version]
  36. Senges, C.H.R.; Al-Dilaimi, A.; Marchbank, D.H.; Wibberg, D.; Winkler, A.; Haltli, B.; Nowrousian, M.; Kalinowski, J.; Kerr, R.G.; Bandow, J.E. The secreted metabolome of Streptomyces chartreusis and implications for bacterial chemistry. Proc. Natl. Acad. Sci. USA 2018, 115, 2490–2495. [Google Scholar] [CrossRef] [PubMed] [Green Version]
  37. DSMZ GmbH Nutrient Medium Composition. Available online: https://www.dsmz.de/microorganisms/medium/pdf/DSMZ_Medium1.pdf (accessed on 11 September 2020).
  38. DSMZ GmbH SP Medium Composition. Available online: https://www.dsmz.de/microorganisms/medium/pdf/DSMZ_Medium222.pdf (accessed on 11 September 2020).
  39. DSMZ GmbH MD1 Medium Composition. Available online: https://www.dsmz.de/microorganisms/medium/pdf/DSMZ_Medium1118.pdf (accessed on 11 September 2020).
  40. DSMZ GmbH TSB Medium Composition. Available online: https://www.dsmz.de/microorganisms/medium/pdf/DSMZ_Medium545.pdf (accessed on 11 September 2020).
  41. DSMZ GmbH GYM Medium Composition. Available online: https://www.dsmz.de/microorganisms/medium/pdf/DSMZ_Medium65.pdf (accessed on 11 September 2020).
  42. Seidel, V. Initial and Bulk Extraction of Natural Products Isolation. In Natural Products Isolation- Methods and Protocols; Sarker, S.D., Nahar, L., Eds.; Humana Press: Totowa, NJ, USA, 2012; pp. 27–41. ISBN 9781617796241. [Google Scholar]
  43. Kessner, D.; Chambers, M.; Burke, R.; Agus, D.; Mallick, P. ProteoWizard: Open source software for rapid proteomics tools development. Bioinformatics 2008, 24, 2534–2536. [Google Scholar] [CrossRef] [PubMed]
  44. Pluskal, T.; Castillo, S.; Villar-Briones, A.; Orešič, M. MZmine 2: Modular framework for processing, visualizing, and analyzing mass spectrometry-based molecular profile data. BMC Bioinform. 2010, 11. [Google Scholar] [CrossRef] [PubMed] [Green Version]
  45. Keller, B.O.; Sui, J.; Young, A.B.; Whittal, R.M. Interferences and contaminants encountered in modern mass spectrometry. Anal. Chim. Acta 2008, 71–81. [Google Scholar] [CrossRef]
  46. Wang, M.; Carver, J.J.; Phelan, V.V.; Sanchez, L.M.; Garg, N.; Peng, Y.; Nguyen, D.D.; Watrous, J.; Kapono, C.A.; Luzzatto-Knaan, T.; et al. Sharing and community curation of mass spectrometry data with Global Natural Products Social Molecular Networking. Nat. Biotechnol. 2016, 34, 828–837. [Google Scholar] [CrossRef] [Green Version]
  47. Cawoy, H.; Mariutto, M.; Henry, G.; Fisher, C.; Vasilyeva, N.; Thonart, P.; Dommes, J.; Ongena, M. Plant Defense Stimulation by Natural Isolates of Bacillus Depends on Efficient Surfactin Production. Mol. Plant-Microbe Interact. 2013, 27, 87–100. [Google Scholar] [CrossRef] [Green Version]
  48. Chen, X.H.; Scholz, R.; Borriss, M.; Junge, H.; Mögel, G.; Kunz, S.; Borriss, R. Difficidin and bacilysin produced by plant-associated Bacillus amyloliquefaciens are efficient in controlling fire blight disease. J. Biotechnol. 2009, 140, 38–44. [Google Scholar] [CrossRef] [Green Version]
  49. Dunlap, C.A.; Bowman, M.J.; Schisler, D.A. Genomic analysis and secondary metabolite production in Bacillus amyloliquefaciens AS 43.3: A biocontrol antagonist of Fusarium head blight. Biol. Control 2013, 64, 166–175. [Google Scholar] [CrossRef]
  50. Korp, J.; König, S.; Schieferdecker, S.; Dahse, H.M.; König, G.M.; Werz, O.; Nett, M. Harnessing Enzymatic Promiscuity in Myxochelin Biosynthesis for the Production of 5-Lipoxygenase Inhibitors. ChemBioChem 2015, 16, 2445–2450. [Google Scholar] [CrossRef] [PubMed]
  51. Bosello, M.; Robbel, L.; Linne, U.; Xie, X.; Marahiel, M.A. Biosynthesis of the siderophore rhodochelin requires the coordinated expression of three independent gene clusters in Rhodococcus jostii RHA1. J. Am. Chem. Soc. 2011, 133, 4587–4595. [Google Scholar] [CrossRef] [PubMed]
  52. Cone, M.C.; Yin, X.; Grochowski, L.L.; Parker, M.R.; Zabriskie, T.M. The blasticidin S biosynthesis gene cluster from Streptomyces griseochromogenes: Sequence analysis, organization, and initial characterization. ChemBioChem 2003, 4, 821–828. [Google Scholar] [CrossRef] [PubMed]
  53. Miethke, M.; Westers, H.; Blom, E.J.; Kuipers, O.P.; Marahiel, M.A. Iron starvation triggers the stringent response and induces amino acid biosynthesis for bacillibactin production in Bacillus subtilis. J. Bacteriol. 2006, 188, 8655–8657. [Google Scholar] [CrossRef] [PubMed] [Green Version]
  54. Masuma, R.; Tanaka, Y.; Tanaka, H.; Omura, S. Production of Nanaomycin and other Antibiotics by Phosphate-depressed Fermentation Using Phosphate-trapping Agents. J. Antibiot. (Tokyo) 1986, 39, 1557–1564. [Google Scholar] [CrossRef] [PubMed] [Green Version]
  55. Pan, R.; Bai, X.; Chen, J.; Zhang, H.; Wang, H. Exploring structural diversity of microbe secondary metabolites using OSMAC strategy: A literature review. Front. Microbiol. 2019, 10, 1–20. [Google Scholar] [CrossRef] [PubMed] [Green Version]
  56. Ruiz, B.; Chávez, A.; Forero, A.; García-Huante, Y.; Romero, A.; Snchez, M.; Rocha, D.; Snchez, B.; Rodríguez-Sanoja, R.; Sánchez, S.; et al. Production of microbial secondary metabolites: Regulation by the carbon source. Crit. Rev. Microbiol. 2010, 36, 146–167. [Google Scholar] [CrossRef] [PubMed]
  57. Wu, Q.; Zhang, G.; Wang, B.; Li, X.; Yue, S.; Chen, J.; Zhang, H.; Wang, H. Production and Identification of Inthomycin B Produced by a Deep-Sea Sediment-Derived Streptomyces sp. YB104 Based on Cultivation-Dependent Approach. Curr. Microbiol. 2018, 75, 942–951. [Google Scholar] [CrossRef]
  58. Pinzón-Espinosa, A.; Martinez-Matamoros, D.; Castellanos, L.; Duque, C.; Rodríguez, J.; Jiménez, C.; Ramos, F.A. Cereusitin A, a cyclic tetrapeptide from a Bacillus cereus strain isolated from the soft coral Antillogorgia (syn. Pseudopterogorgia) elisabethae. Tetrahedron Lett. 2017, 58, 634–637. [Google Scholar] [CrossRef]
  59. Singh, V.; Haque, S.; Niwas, R.; Srivastava, A.; Pasupuleti, M.; Tripathi, C.K.M. Strategies for fermentation medium optimization: An in-depth review. Front. Microbiol. 2017, 7. [Google Scholar] [CrossRef]
  60. Jakeman, D.L.; Graham, C.L.; Young, W.; Vining, L.C. Culture conditions improving the production of jadomycin B. J. Ind. Microbiol. Biotechnol. 2006, 33, 767–772. [Google Scholar] [CrossRef] [PubMed]
  61. Chatterjee, I.; Somerville, G.A.; Heilmann, C.; Sahl, H.G.; Maurer, H.H.; Herrmann, M. Very low ethanol concentrations affect the viability and growth recovery in post-stationary-phase Staphylococcus aureus populations. Appl. Environ. Microbiol. 2006, 72, 2627–2636. [Google Scholar] [CrossRef] [PubMed] [Green Version]
  62. Pettit, R.K. Mixed fermentation for natural product drug discovery. Appl. Microbiol. Biotechnol. 2009, 83, 19–25. [Google Scholar] [CrossRef] [PubMed]
  63. Tobias, N.J.; Brehm, J.; Kresovic, D.; Brameyer, S.; Bode, H.B.; Heermann, R. New Vocabulary for Bacterial Communication. ChemBioChem 2019, 1–11. [Google Scholar] [CrossRef] [PubMed]
  64. Hamoen, L.W.; Venema, G.; Kuipers, O.P. Controlling competence in Bacillus subtilis: Shared use of regulators. Microbiology 2003, 149, 9–17. [Google Scholar] [CrossRef] [PubMed] [Green Version]
  65. Rutledge, P.J.; Challis, G.L. Discovery of microbial natural products by activation of silent biosynthetic gene clusters. Nat. Rev. Microbiol. 2015, 13, 509–523. [Google Scholar] [CrossRef]
  66. Milne, P.J.; Hunt, A.L.; Rostoll, K.; Van Der Walt, J.J.; Graz, C.J.M. The Biological Activity of Selected Cyclic Dipeptides. J. Pharm. Phamacol. 1998, 50, 1331–1337. [Google Scholar] [CrossRef]
  67. Pomilio, A.; Battista, M.; Vitale, A. Naturally-Occurring Cyclopeptides: Structures and Bioactivity. Curr. Org. Chem. 2006, 10, 2075–2121. [Google Scholar] [CrossRef]
  68. Koumoutsi, A.; Henne, A.; Liesegang, H.; Hitezeroth, G.; Franke, P.; Vater, J.; Borriss, R. Structural and Functional Characterization of Gene Clusters Directing Nonribosomal Synthesis of Bioactive Cyclic Lipopeptides in. J. Bacteriol. 2004, 186, 1084–1096. [Google Scholar] [CrossRef] [Green Version]
  69. Rückert, C.; Blom, J.; Chen, X.H.; Reva, O.; Borriss, R. Genome sequence of B. amyloliquefaciens type strain DSM7T reveals differences to plant-associated B. amyloliquefaciens FZB42. J. Biotechnol. 2011, 155, 78–85. [Google Scholar] [CrossRef]
  70. Borriss, R.; Chen, X.H.; Rueckert, C.; Blom, J.; Becker, A.; Baumgarth, B.; Fan, B.; Pukall, R.; Schumann, P.; Spröer, C.; et al. Relationship of Bacillus amyloliquefaciens clades associated with strains DSM 7 T and FZB42 T: A proposal for Bacillus amyloliquefaciens subsp. amyloliquefaciens subsp. nov. and bacillus amyloliquefaciens subsp. plantarum subsp. nov. based on complete gen. Int. J. Syst. Evol. Microbiol. 2011, 61, 1786–1801. [Google Scholar] [CrossRef] [PubMed]
  71. Lee, H.S.; Hee, J.S.; Kyoung, H.J.; Tae, S.K.; Oh, K.B.; Shin, J. Cyclic peptides of the nocardamine class from a marine-derived bacterium of the genus Streptomyces. J. Nat. Prod. 2005, 68, 623–625. [Google Scholar] [CrossRef] [PubMed]
  72. Yamanaka, K.; Oikawa, H.; Ogawa, H.O.; Hosono, K.; Shinmachi, F.; Takano, H.; Sakuda, S.; Beppu, T.; Ueda, K. Desferrioxamine E produced by Streptomyces griseus stimulates growth and development of Streptomyces tanashiensis. Microbiology 2005, 151, 2899–2905. [Google Scholar] [CrossRef]
  73. Liu, M.; Grkovic, T.; Liu, X.; Han, J.; Zhang, L.; Quinn, R.J. A systems approach using OSMAC, Log P, and NMR fingerprinting: An approach to novelty. Synth. Syst. Biotechnol. 2017, 2, 276–286. [Google Scholar] [CrossRef] [PubMed]
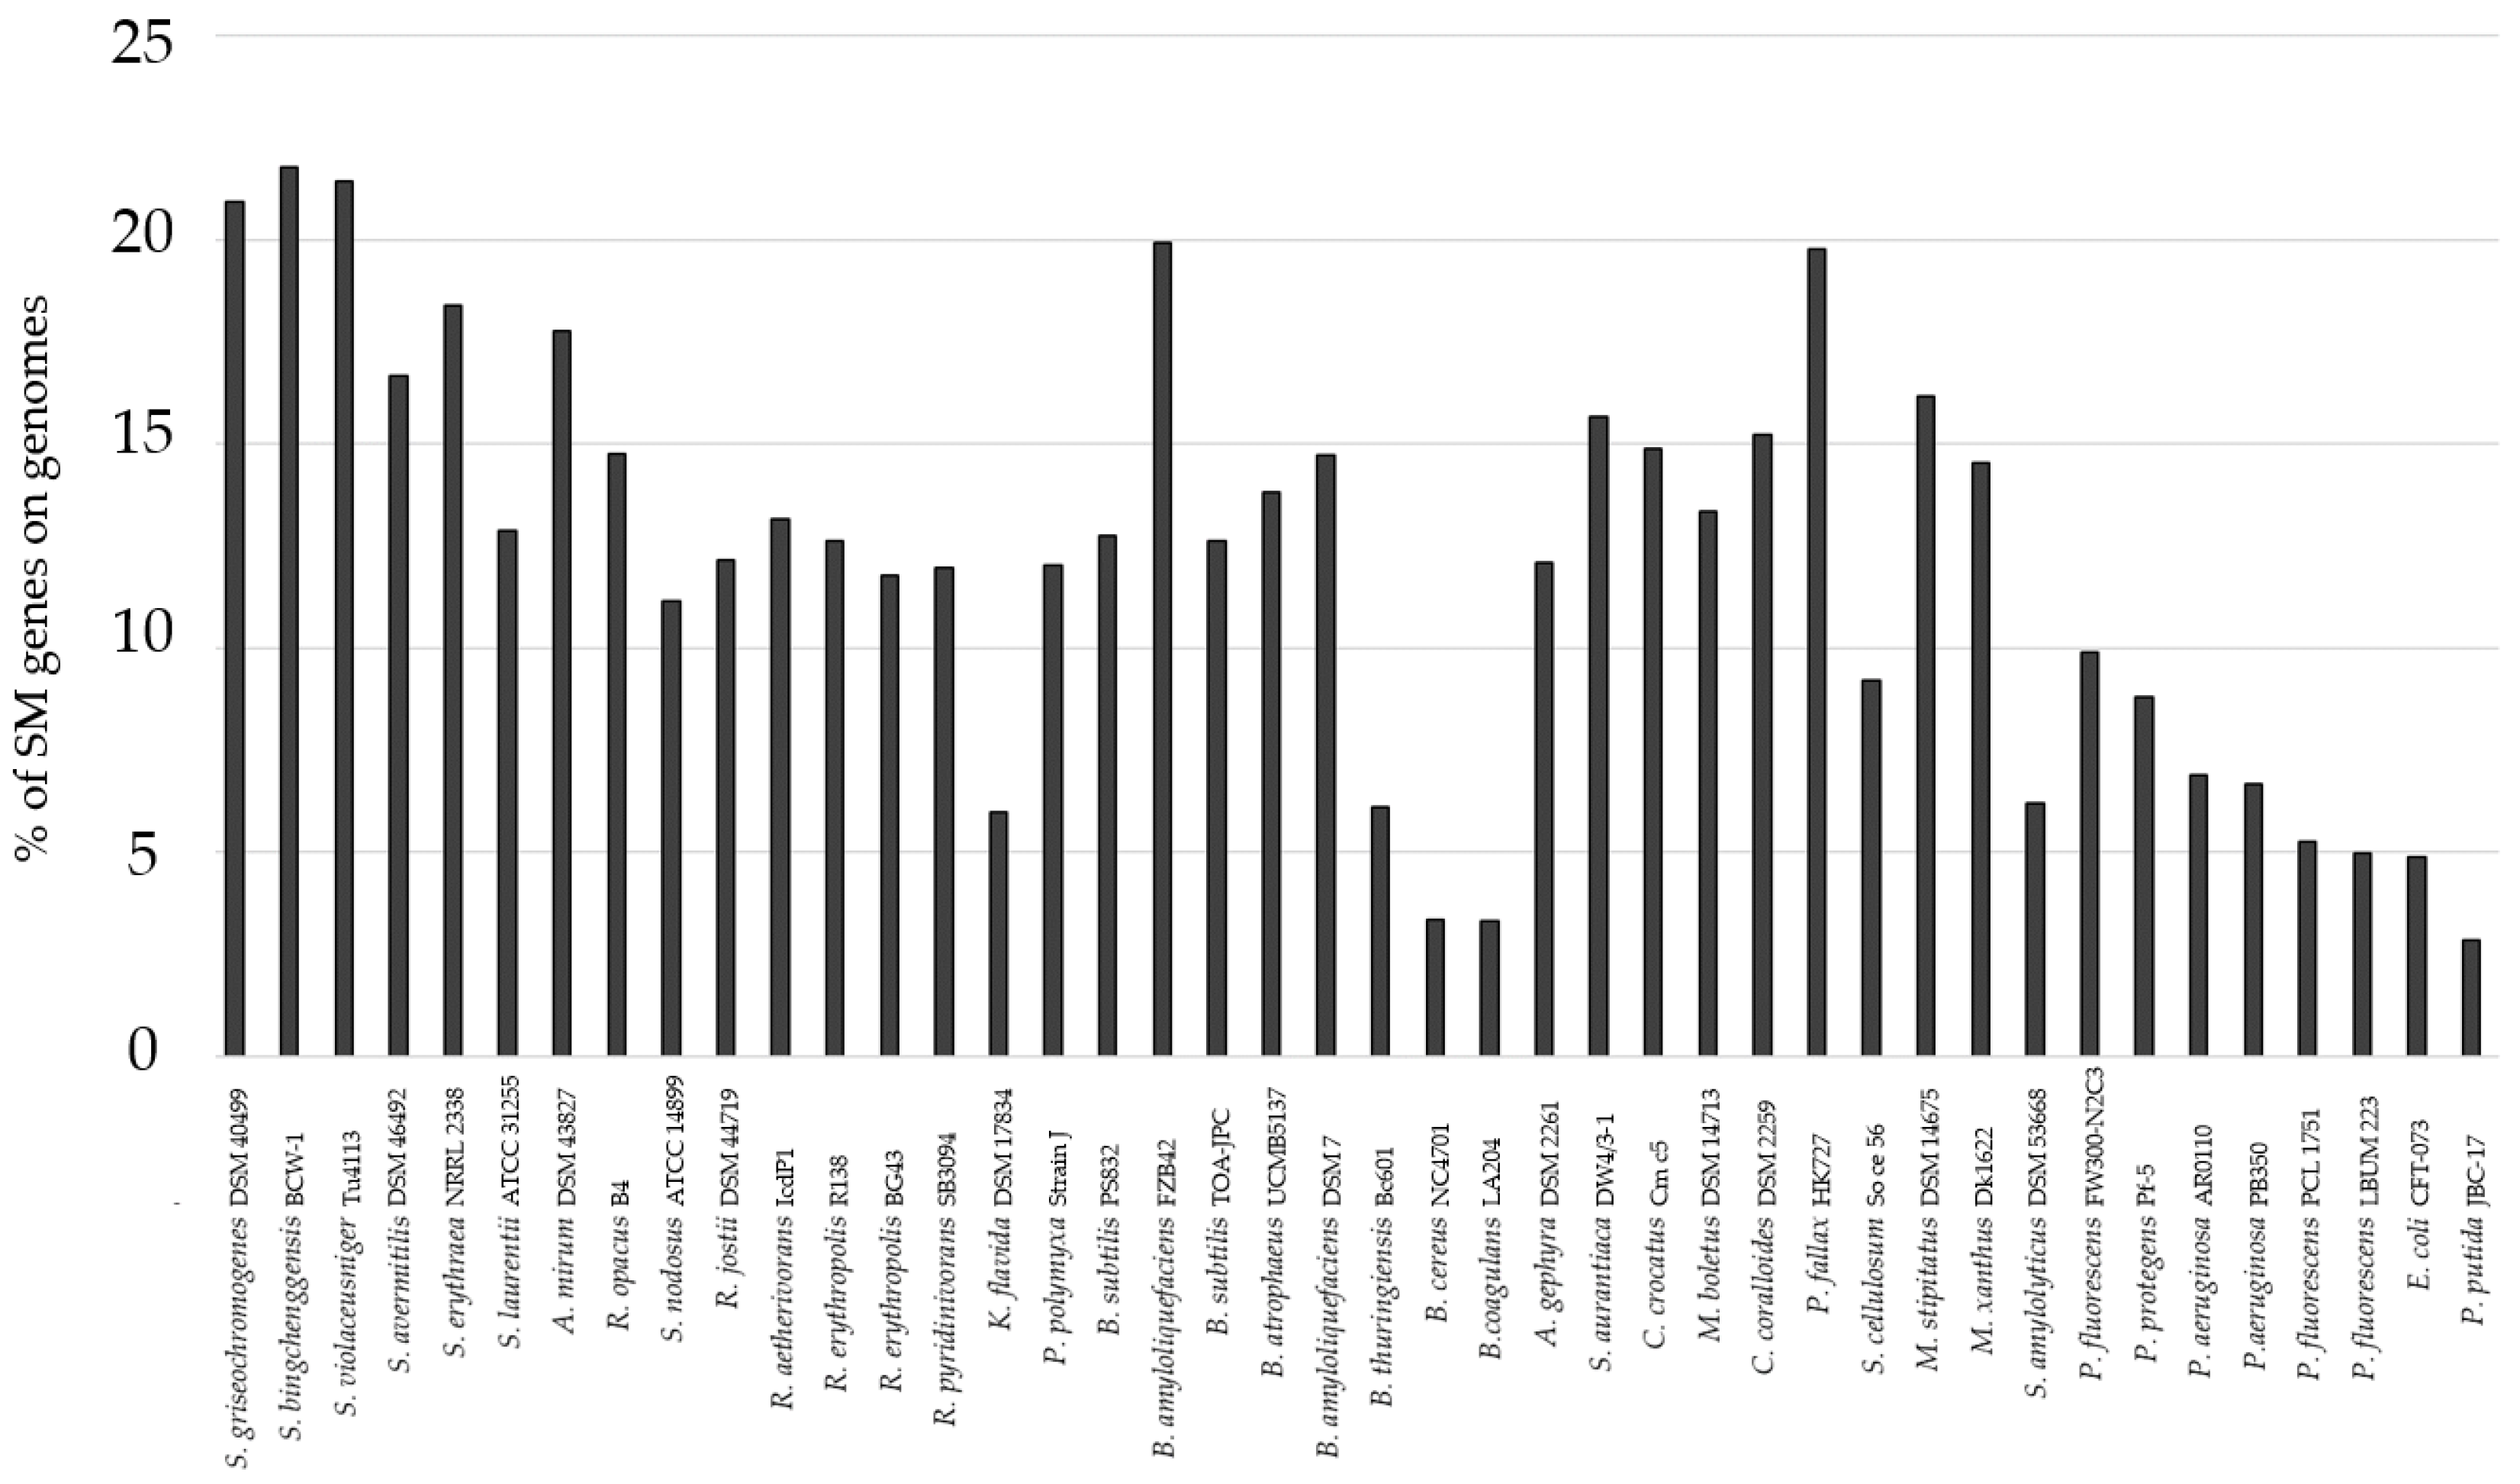
Figure 1. Percentage of genes relating to the entire number of mapped genes in the genome of the selected bacteria. The genome mining approach was carried out with antiSMASH [9]. A total of 42 bacteria were investigated for their potential to harbor silent biosynthetic gene clusters (BGCs) in their genome. The complete list of bacteria is presented in the supplement (Table S1). SM, secondary metabolite.
Biomolecules 11 00193 g001
Figure 2. Number of new mass features in extracts of minimal media experiments, limitation experiments, and unbaffled flask experiments (all other experiments were conducted in baffled flasks). The ‘-’ indicates that the condition was not tested with this bacterium; a ‘0’ refers to no new mass features; and in the conditions marked with ‘ng’, bacteria did not grow. Every OSMAC condition was tested twice. The new mass feature had to be present in both biological duplicates. The mass feature signal had to surpass an intensity of 105 [a.u.] to be considered for the number of new mass features. Therefore, this diagram only shows the number of reproducibly detected mass features in the duplicate cultivation.
Biomolecules 11 00193 g002
Figure 3. Number of new mass features in extracts of nutrient-rich media experiments. The ‘-’ indicates not tested with this bacterium, the ’0’ related to no new mass features compared with the control group ‘c’. Any new mass feature had to be present in both biological duplicates and its MS signal had to surpass an intensity of 105 to be considered for the number of new mass features presented in this diagram. Therefore, this diagram only shows the number of reproducibly detected mass features.
Biomolecules 11 00193 g003
Figure 4. Number of new mass features in extracts of solvent supplementation experiments. Entries marked with ‘-’ were not tested and ‘0’ indicates no new mass features with this bacterium. Any new mass feature had to be present in both biological duplicates and its MS signal had to surpass an intensity of 105 to be considered for the number of new mass features presented in this diagram. Therefore, this diagram only shows the number of reproducibly detected mass features. DMSO, dimethyl sulfoxide; ACN, acetonitrile; Tol, toluene; EtOH, ethanol.
Biomolecules 11 00193 g004
Figure 5. Number of new mass features in extracts of biotic additive experiments. A ‘-’ indicates not tested with this bacterium, while ‘0’ relates to no new mass features. The bacteria are indicated as follows: Ba = B. amyloliquefaciens, Cc = C. coralloides, Pf = P. fallax, Rj = R. jostii, and Sg = S. griseochromogenes. Any new mass feature had to be present in both biological duplicates and its MS signal had to surpass an intensity of 105 to be considered for the number of new mass features presented in this diagram. Therefore, this diagram only shows the number of reproducibly detected mass features.
Biomolecules 11 00193 g005
Figure 6. Hit rates for all tested culture conditions. Black bars: sample size n = 5 strains, dark grey bars: n = 4, light grey bars: n = 3.
Biomolecules 11 00193 g006
Figure 7. Percentage of new mass features that are activated by a certain number of culture conditions.
Biomolecules 11 00193 g007
Table 1. Summary of new pharmaceutically active compounds obtained by altering culture conditions in one strain many compounds (OSMAC) screening approaches.
StrainNatural ProductAltered ConditionsPropertiesReference
Sphaeropsidales sp. F-24’70742 cladospironesvariation of mediaantibacterial and antifungal[16]
Streptomyces sp. MBT27quinazolinone A and Bvariation of carbon sourcesanti-inflammatory, antitumor, antimicrobial, and anti-fungal properties[17]
Aspergillus sp. LS349 new compoundssolid rice medium and potato dextrose mediumcytotoxic activity against cancer cell lines/active against pathogenic Staphylococcus aureus[18]
Table 2. Summary of tested OSMAC culture conditions used in this study. Tryptic Soy Broth (TSB), Lysogeny Broth (LB), Glucose-Yeast-Malt (GYM), Nutrient Broth (NB), Glucose Minimal Salt (GMS).
CategoryTested Conditions
culture vesselunbaffled flask instead of baffled flask
nutrient-rich media3 per bacterium out of SP medium, TSB medium, CY/H medium, MD1 medium, MD1+G medium, LB medium, GYM medium, NB medium, Landy medium, Luria medium
minimal mediaM9 medium, GMS medium
limitationsMg2+-, PO43−- and Fe2+ limitation (named MgX [no Mg2+-salts], FeX [no Fe3+-salts], 1% PO43− [1% of amount of phosphate salts in original recipe])
organic solventsacetonitrile (ACN), dimethyl sulfoxide (DMSO), ethanol (EtOH), toluene (Tol) at 0.5/1/3/6 Vol %
biotic additivesautoclaved supernatant, sterile-filtered supernatant, autoclaved cell pellet of B. amyloliqufaciens, C. coralloides, P. fallax, R. jostii, and S. griseochromogenes
Table 3. Summary of the biosynthetic potential of the five selected strains based on the genome mining approach with antiSMASH. The percentage of detected biosynthetic gene clusters (BGCs) in the genome, the total number of BGCs, and the number of known secondary metabolite (SM) compounds of these selected bacteria are shown in the table.
StrainGenome Size [Mbp]% BGCsNumber of BGCsKnown Compounds
B. amyloliquefaciens3.9814.711surfactin [47], bacillaene [48], fengycin [47], and bacillibactin [49] from B. amyloliquefaciens FZB42
C. coralloides10.0815.234-
P. fallax10.7719.133myxochelin [50] from P. fallax HKI727
R. jostii7.8912.218rhodochelin [51] from R. jostii RHA1
S. griseochromogenes10.7620.949blasticidin [52] from S. griseochromogenes (not further specified) heterologously expressed in S. lividans
Table 4. Summary of detected compounds from the number of searchable compounds based on the predicted non-orphan BGCs in the five selected bacteria. These compounds were identified in the analyzed extracts of the bacteria. Mass-based identification was carried out with the extracted ion chromatogram (EIC) function of the Compass Data Analysis software with 0.01 Da tolerance and under consideration of the isotopic profile. Deviations of the measured m/z from the calculated [M + H]+ in ppm are indicated in the table. A comparison of experimental MS2-spectra with in silico fragmentation patterns generated via MetFrag was used for bacillibactin and nostophycin. Additionally, the fragmentation pattern of bacillibactin was compared to literature data [49]. Compounds in bold were only found in extracts of OSMAC experiments, but not in the control group. The producing conditions for each compound can be taken from Table S19. Control group means the cultivation of the bacteria in their DSMZ-recommended, nutrient-rich media (NB medium for B. amyloliquefaciens, SP medium for C. coralloides, MD1 medium for P. fallax, TSB medium for R. jostii, and GYM medium for S. griseochromogenes).
StrainNumber of BGCs According to AntiSMASHNumber of Searchable CompoundsDetected Compounds
(% Sequence Similarity)
Means of Identification
Mass-BasedMS2- Fragmentation (MetFrag)Reference Compound
B. amyloliquefaciens116surfactin
(82%)

Δppm = 2.2 (C15)
Δppm = 4.9
(C14)
bacillibactin (100%) ✓ (and [49])
Δppm = 1.4
bacillaene (100%)
Δppm = 0.7
C. coralloides3412-
P. fallax3322myxochelin A (75%)
Δppm = 10.1
nostophycin (18%)
Δppm = 7.0
R. jostii1813-
S. griseochromogenes4938desferrioxamine B (100%)
Δppm = 4.6
albaflavenone (100%)
Δppm = 38.8
Table 5. Comparison of new mass features produced by C. coralloides and S. griseochromogenes on M9 FeX medium and GMS FeX medium. The mass features’ properties (m/z and tR) can be found in the Supplementary Material.
StrainNew Mass Features on M9 FeXNew Mass Features on GMS FeX
C. coralloidesCc243, Cc244, Cc249, Cc250Cc22, Cc181, Cc186, Cc187, Cc189, Cc193, Cc210
S. griseochromogenesSg115, Sg117, Sg119, Sg120, Sg135, Sg198, Sg199, Sg201, Sg203, Sg206, Sg207, Sg214Sg96, Sg97, Sg101, Sg103, Sg104, Sg106, Sg107, Sg109
Table 6. Genome size, numbers of predicted BGCs, and numbers of detected new mass features per strain.
StrainB. amyloliquefaciensC. coralloidesP. fallaxR. jostiiS. griseo-chromogenes
Genome size [Mbp]3.9810.0810.767.8910.77
Number of predicted BGCs1134331849
Number of new mass features in extracts12735143138147
Table 7. Results of fragmentation pattern analysis of selected new mass features. The new mass features were identified by the fragmentation pattern library of the web-based mass spectrometry ecosystem Global Natural Products Social Molecular Networking (GNPS), MetFrag or a reference compound. Evidence is given in the Supplementary Material. A summary of the experimental fragmentation pattern is given in Table S27. The level of confidence for the identification of all compounds is given in Table S28. The ID is composed of the abbreviation of the producer strain (Ba = B. amyloliquefaciens, Cc = C. coralloides, Pf = P. fallax, Sg = S. griseochromogenes) and the number of the detected new mass features.
IDm/ztR [min]Proposed CompoundMeans of Identification
GNPSMetFragReference Compound
Ba3261.124.5cyclo (Tyr-Pro)
Δppm = 0.7
Ba81057.577.2iturin A-4
Ba91071.587.6iturin A-6mass-based
Ba101085.67.9iturin A-8
Ba58883.266.1bacillibactincomparison to fragmentation pattern from literature, Δppm = 1.4
Cc42601.364.7nocardamin
Δppm = 4.4
Pf336405.165.4myxochelin A
Δppm = 10.1
Sg117587.354.5desmethyl enyl nocardamin Δppm = 0 (GNPS)
Sg130585.364.9desferrioxamine B + Al Δppm = 13 (GNPS)
Publisher’s Note: MDPI stays neutral with regard to jurisdictional claims in published maps and institutional affiliations.