Article

Transcriptome Analysis Reveals Altered Inflammatory Pathway in an Inducible Glial Cell Model of Myotonic Dystrophy Type 1

by
Cuauhtli N. Azotla-Vilchis
1,2,
Daniel Sanchez-Celis
1,2,
Luis E. Agonizantes-Juárez
1,3,
Rocío Suárez-Sánchez
1,
J. Manuel Hernández-Hernández
2,
Jorge Peña
4,5,
Karla Vázquez-Santillán
6,
Norberto Leyva-García
1,
Arturo Ortega
7,
Vilma Maldonado
6,
Claudia Rangel
4,
Jonathan J. Magaña
1,8,
Bulmaro Cisneros
2 and
Oscar Hernández-Hernández
1,*
1
Laboratory of Genomic Medicine, Department of Genetics, Instituto Nacional de Rehabilitación, Luis Guillermo Ibarra Ibarra, Mexico City 14389, Mexico
2
Department of Genetics and Molecular Biology, Centro de Investigación y de Estudios Avanzados, CINVESTAV-IPN, Mexico City 07360, Mexico
3
Escuela Nacional de Ciencias Biologicas-Instituto Politécnico Nacional, Mexico City 11340, Mexico
4
Computational and Integrative Genomics Laboratory, Instituto Nacional de Medicina Genómica, Mexico City 14610, Mexico
5
Institute of Mathematical Sciences, Claremont Graduate University, Claremont, CA 91711, USA
6
Epigenetics Laboratory, Instituto Nacional de Medicina Genomica, Mexico City 14610, Mexico
7
Department of Toxicology, Centro de Investigación y de Estudios Avanzados, CINVESTAV-IPN, Mexico City 07360, Mexico
8
School of Engineering and Sciences, Department of Bioengineering, Tecnológico de Monterrey-Campus, Mexico City 14380, Mexico
*
Author to whom correspondence should be addressed.
Biomolecules 2021, 11(2), 159; https://doi.org/10.3390/biom11020159
Submission received: 31 December 2020 / Revised: 22 January 2021 / Accepted: 22 January 2021 / Published: 26 January 2021
(This article belongs to the Special Issue Molecular Basis of Neuromuscular Diseases)

Abstract

:
Myotonic dystrophy type 1 (DM1), the most frequent inherited muscular dystrophy in adults, is caused by the CTG repeat expansion in the 3′UTR of the DMPK gene. Mutant DMPK RNA accumulates in nuclear foci altering diverse cellular functions including alternative splicing regulation. DM1 is a multisystemic condition, with debilitating central nervous system alterations. Although a defective neuroglia communication has been described as a contributor of the brain pathology in DM1, the specific cellular and molecular events potentially affected in glia cells have not been totally recognized. Thus, to study the effects of DM1 mutation on glial physiology, in this work, we have established an inducible DM1 model derived from the MIO-M1 cell line expressing 648 CUG repeats. This new model recreated the molecular hallmarks of DM1 elicited by a toxic RNA gain-of-function mechanism: accumulation of RNA foci colocalized with MBNL proteins and dysregulation of alternative splicing. By applying a microarray whole-transcriptome approach, we identified several gene changes associated with DM1 mutation in MIO-M1 cells, including the immune mediators CXCL10, CCL5, CXCL8, TNFAIP3, and TNFRSF9, as well as the microRNAs miR-222, miR-448, among others, as potential regulators. A gene ontology enrichment analyses revealed that inflammation and immune response emerged as major cellular deregulated processes in the MIO-M1 DM1 cells. Our findings indicate the involvement of an altered immune response in glia cells, opening new windows for the study of glia as potential contributor of the CNS symptoms in DM1.

1. Introduction

Myotonic Dystrophy type 1 (DM1), an inherited neuromuscular disorder, is the most common form of muscular dystrophy in adults, with a prevalence between 0.5–18.1 per 100,000 [1]. DM1 is caused by a CTG repeat expansion located in the 3′ untranslated region (UTR) of the myotonic dystrophy protein kinase (DMPK) gene. The CTG tract consists of 5 to 37 repeats in healthy individuals, but it is expanded to more than 50 CTG repeats in DM1 patients [2,3,4]. DM1 is a multisystemic disease with a broad clinical presentation including myotonia, muscle weakness, heart conduction abnormalities, insulin resistance, endocrine defects, frontal balding, cataracts, and central nervous system (CNS) alterations [5]. The neuronal features exhibited by patients with DM1 depend on the age of onset and size of the CTG tract [6,7]. Specifically, intellectual disability is present in the congenital form of DM1; while learning difficulties, speech and language delay, reduced IQ-values accompanied with attention deficit hyperactive disorder, and autism spectrum are frequent in infantile- and juvenile-onset DM1 [8,9]. Apathy and reduced initiative, attention deficit, excessive daytime sleepiness, and fatigue are commonly present in the adult form [7]. Finally, important neuropsychological signs and symptoms, such as anxiety, hostility, depression, low esteem and paranoia, are also frequent in DM1 patients [10,11]. Overall CNS symptomatology has a negative impact on the quality of life of patients [12].
DM1 pathogenesis is mediated by an RNA gain-of-function mechanism, through accumulation of mutant DMPK mRNA aggregates in the nucleus of affected cells [13,14,15]. This in turn alters directly or indirectly numerous cell functions, including transcription regulation, RNA polyadenylation, translation, microRNA (miRNA) processing, and alternative splicing [16,17,18,19,20]. In addition, the detection of small DMPK RNAs expressed in the antisense direction [21], as well as the occurrence of repeat-associated non-ATG translation [22,23], which results in the accumulation of homopolymeric proteins, have added further complexity to molecular pathogenesis of DM1. Perturbation of alternative splicing through sequestration of muscleblind-like (MBNL) family of factors by mutant DMPK RNA and upregulation of CUG/Elav-like (CELF) proteins [24,25] are the best described pathogenic mechanisms in DM1. In fact, numerous mis-splicing events have been described in genes expressed in DM1 brain tissues implicated in its CNS symptomatology, including GRIN1/NMDAR1 exons 5 and 21, MAPT exons 2–3, 10, APP exon 8, MBNL1/2 exon 7, CAMK2D exons 14–15, and SORBS exon 26 [14,26,27].
In spite of the role of glial cells in essential brain functions, including synapsis, inflammation response, and neurotransmission [28], their implication in DM1 neuropathology just began to be addressed. Recent evidence shows that cortical astrocytes contain greater abundancy of ribonuclear foci than neurons in the brain of DM1 transgenic mice [26]. In addition, DMPK transcript levels are higher in astrocytes and glia-derived cell lines, compared to neurons [29]; and finally, glutamate excitotoxicity associated with downregulation of glutamate transporter 1 (GLT1) is observed in Bergmann glia of DM1 mice [30]. All these observations suggest that defective neuron-glia interactions, which are fundamental for proper brain function, might be an important contributor to DM1 brain pathophysiology.
To gain insight into the cellular and molecular pathways primarily affected by the DM1 mutation in glial cells, in this study, we generated a DM1 model derived from human retinal Müller glial cells (MIO-M1) [31], which express a mutant DMPK RNA carrying 648 CUG repeats in an inducible manner [MIO-M1 CTG(648)]. Validation experiments indicated the occurrence of an RNA toxicity mechanism in the established model, characterized by altered alternative splicing and nuclear co-localization of RNA foci with MBNL1/2 splicing factors. By conducting transcriptome analysis of MIO-M1 CTG(648) cells, we observed altered expression levels of numerous genes upon expression of the CTG repeat expansion, including immune mediators and microRNA genes. A gene ontology analysis approach led us to the identification of inflammatory pathway and immune response as the major cellular deregulated processes in MIO-M1 CTG(648) cells. Considering the role of glial cells as modulators of neuroinflammation, these results open new avenues for the study of DM1 brain pathophysiology associated with defective glia.

2. Materials and Methods

2.1. Cell Culture

MIO-M1 cells (Moorfields/Institute of Ophthalmology, University College London) were grown in presence of Dulbecco’s Modified Eagle Medium (DMEM) (Invitrogen, Carlsbad, CA, USA), supplemented with 10% fetal bovine serum (FBS), 100 U/mL penicillin and 100 μg/mL streptomycin. Cultures were maintained at 37 °C in a 5% humidified CO2 atmosphere.

2.2. Generation of MIO-M1 DM1 Cell Model

MIO-M1 cell line was stably transfected with the pCMV-Tet3G plasmid (Clontech, Mountain View, CA, USA). After 3 weeks on geneticin (G418) selection, independent clones were assayed with the Dual-Luciferase Reporter Assay System (Promega Corporation, Madison, WI, USA). The clone with the high doxycycline induction and the low basal luciferase activity (MIO-M1-CMV-Tet) was selected. Simultaneously, fragments of DMPK minigene containing exons 11–15, carrying an expanded CTG tract, or 0 CTG repeat tract as control, were excised by NheI digestion from DT960 and DMPKS plasmids [32], respectively. Expanded or control DMPK minigene fragments were ligated to the equally restricted pTRE3G plasmid (Clontech, Mountain View, CA, USA) to generate the CTG expanded and control Tet responsive constructs. Then, MIO-M1-CMV-Tet cells were stably transfected with the responsive plamids and selected in the presence of 350 μg/mL G418 and 0.35 μg/mL puromycin to obtain the control MIO-M1-CTG(0) and the mutant MIO-M1-CTG(648) cells. The control MIO-M1-CTG(0) and the mutant MIO-M1-CTG(648) established cell lines were subsequently cultured in presence of 10% FBS tetracycline-free.

2.3. Genotyping

Genomic DNA was extracted from cell cultures and genotyping was performed by triplet repeat-primed polymerase chain reaction (TP-PCR) and capillary electrophoresis on a 3730 xl DNA analyzer (Applied Biosystems, Foster City, CA, USA) as previously described [33]. Estimation of expanded allele size was carried out by Small Pool PCR (SP-PCR) as described by Tomé S. et al. [34].

2.4. RNA Isolation, Retrotranscription and Polymerase Chain Reaction (RT-PCR)

Total RNA was isolated from cell cultures using TRIzol Reagent (Invitrogen, Carlsbad, CA, USA). RNA integrity was analyzed by gel electrophoresis. A NanoDrop 2000 spectrophotometer (NanoDrop Technologies, Wilmington, DE, USA) was used for quantification and purity determination. Total RNA (1 µg) was used to prepare cDNA by using the High-Capacity cDNA reverse transcription kit according to manufacturer’s protocol (Thermo Fisher Scientific. Waltham, MA, USA). PCR reactions were carried out in 12.5 μL total volume by using the Platinum Taq DNA pol (Invitrogen, Carlsbad, CA, USA). The percentage of exon inclusion was calculated as [exon inclusion band/(exon inclusion band + exon exclusion band)] x 100 [26]. Oligonucleotide primers used for RT-PCR analysis to detect DMPK/GAPDH expression and MBNL1/2 alternative splicing patterns are indicated in Table S1.

2.5. RNA Fluorescence In Situ Hybridization (RNA-FISH) and Immunofluorescence

Cells on coverslips were fixed with 4% paraformaldehyde for 10 min at room temperature, then permeabilized with cold 2% acetone for 5 min, and overnight incubation in 70% ethanol. Cells were prehybridized in 30% formamide, 2X SSC buffer for 10 min at room temperature and then incubated for 2 h in a humidified chamber at 37 °C with hybridization buffer [2X SSC, 40% formamide, 0.02% BSA, 2mM vanadyl ribonucleoside (Sigma-Aldrich, St. Louis, MO, USA), 66 µg/mL yeast tRNA (Sigma-Aldrich, St. Louis, MO, USA) and 1 ng/µl Cy3-conjugated CAG(6) probe]. Preparations were washed in prehybridization buffer at 45 °C for 30 min, twice in 1X SSC at room temperature, and once in PBS. Cells were mounted on microscope slides with Vectashield antifade medium containing diamino-2-phenylindole (DAPI) (Vector Labs., Burlingame, CA, USA). For combine immunofluorescence and FISH, cells were incubated in 3% BSA for 15 min at room temperature after the post-hybridization wash step of the RNA FISH procedure, then incubated overnight at 4 °C with the primary anti-MBNL1 or MBNL2 antibodies (Abcam, Cambridge, UK. ab45899 and ab171551, respectively). After washing three times with PBS, preparations were incubated 1h at room temperature with fluorescein-conjugated anti-rabbit antibody (Vector Labs., Burlingame, CA, USA), counterstained with DAPI and mounted with Vectashield.

2.6. Microarray Processing

MIO-M1-CTG(0) and MIO-M1-CTG(648) cells were cultured in absence (-Dox) or presence (+Dox) of doxycycline (1 μg/mL) during 8 days, replacing culture medium every 48 h. For each of the four experimental groups, 3 biological replicates were used. Total RNA was extracted using RNeasy Mini kit (Qiagen, Valencia, CA, USA) and RNase-Free DNase Set, according to the manufacturer’s protocol. The RNA concentration was determined using a NanoDrop 2000 spectrophotometer (NanoDrop Technologies, Wilmington, DE, USA), and the RNA integrity number (RIN) was determined in an Agilent 2100 Bioanalyzer (Agilent Technologies Inc, Santa Clara, CA, USA). Only RNA samples with a RIN > 9 were employed. Sample preparation was carried out as described in the Affymetrix GeneChip WT Plus Reagent Kit User Manual (Affymetrix Inc., Santa Clara, CA, USA). Briefly, 100 ng of total RNA were used for synthesize first-strand cDNA followed by a reaction that uses DNA polymerase I and RNase H to simultaneously degrade the RNA and synthesize second-strand cDNA, which was subsequently converted to cRNA by in vitro transcription. Finally, the sense-strand cDNA was obtained by reverse transcription of the cRNA, loaded onto Clariom D Arrays for human samples (Thermo Fisher Scientific. Waltham, MA, USA) and incubated for 16 h at 45 °C on the GeneChip Hybridation Oven 645 (Affymetrix Inc., Santa Clara, CA, USA). After hybridization, arrays were washed and stained using the GeneChip Fluidics Station 450 followed by scanning with the GeneChip Scanner 3000 7G (Affymetrix Inc., Santa Clara, CA, USA). Microarray experiment data have been deposited in NCBI’s Gene Expression Omnibus database (GSE164057).

2.7. Microarrays Data Analysis

The raw intensity values were background corrected and normalized using Robust Multiarray Average (RMA) method [35] and Quantile Normalization [36], respectively. Statistical linear model with arbitrary coefficients was used to determine differential expression, contrasts of interest were analyzed using the Bioconductor library limma [37,38]. Corrections for multiple comparisons were applied using false discovery rate (FDR). Differentially expressed genes were considered as log fold change (FC) >0.5 and p val < 0.005.

2.8. Functional Genomic Analysis

Gene ontology enrichment analyses were performed by Gene set enrichment analysis (GSEA) [39], DAVID (http://david.abcc.ncifcrf.gov), Key Pathway Advisor (KPA version 17.4) and MetaCore (version 19.2). Overlapping list of differentially expressed genes, founded in contrasts A and B, was used to perform DAVID, KPA and MetaCore analyses. GSEA was performed to measure the enrichment of annotated gene sets which represent biological altered processes in MIO-M1-CTG(648) Dox-induced cells compared with non-induced MIO-M1-CTG(648) cells. Analysis was run using default settings and 1000 permutation with a weighted enrichment statistic and a signal-to-noise metric for gene ranking. Gene sets were downloaded from the MSigDB database. Normalized enrichment scores (NES) and p-values were calculated to measure differences in gene set size as well as correlation with other gene signatures. KPA and MetaCore were used to identify canonical pathways having statistically significant changes. Top pathways and functions were scored and sorted by predicted activation and by the number of molecules involved. MicroRNA target prediction was performed by using mirDIP 4.1 integrative [40] and miRDB [41] online databases. DAVID and ShinyGO [42] tools were used to executed enrichment analysis of predicted miRNA targets.

2.9. TaqMan Validation Assays

The expression of selected transcripts was evaluated by retrotranscription and quantitative PCR (RT-qPCR) by using TaqMan probe-based assays (Applied Biosystems, Foster City, CA, USA). Total RNA extraction and retrotranscription were performed as described in the Microarray processing section. PCR was performed in a 20 μL total volume reaction by mixing 100 ng cDNA, 2X TaqMan Universal Master Mix II with UNG (Applied Biosystems, Foster City, CA, USA), 1μL of specific target TaqMan assay probe, and 1 μL of primer limited probe for the endogenous control glyceraldehyde-3-phosphate deshydrogenase (GAPDH). Amplification was conducted at 50 °C for 2 min, 95 °C for 10 min as initial step followed by 95 °C for 15 sec, 60 °C for 1min for 40 cycles on a StepOne Real Time PCR System (Applied Byosistems, Foster City, CA, USA). Relative gene expression was calculated using the 2ΔΔCT method.

2.10. Statistical Analysis

When two groups were compared, an unpaired Student’s t-test for statistical significance were performed. The significance level was set at p < 0.05. Data were expressed as mean ± standard error of the mean (SEM). The statistical software GraphPad Prism package was used for calculations.

3. Results

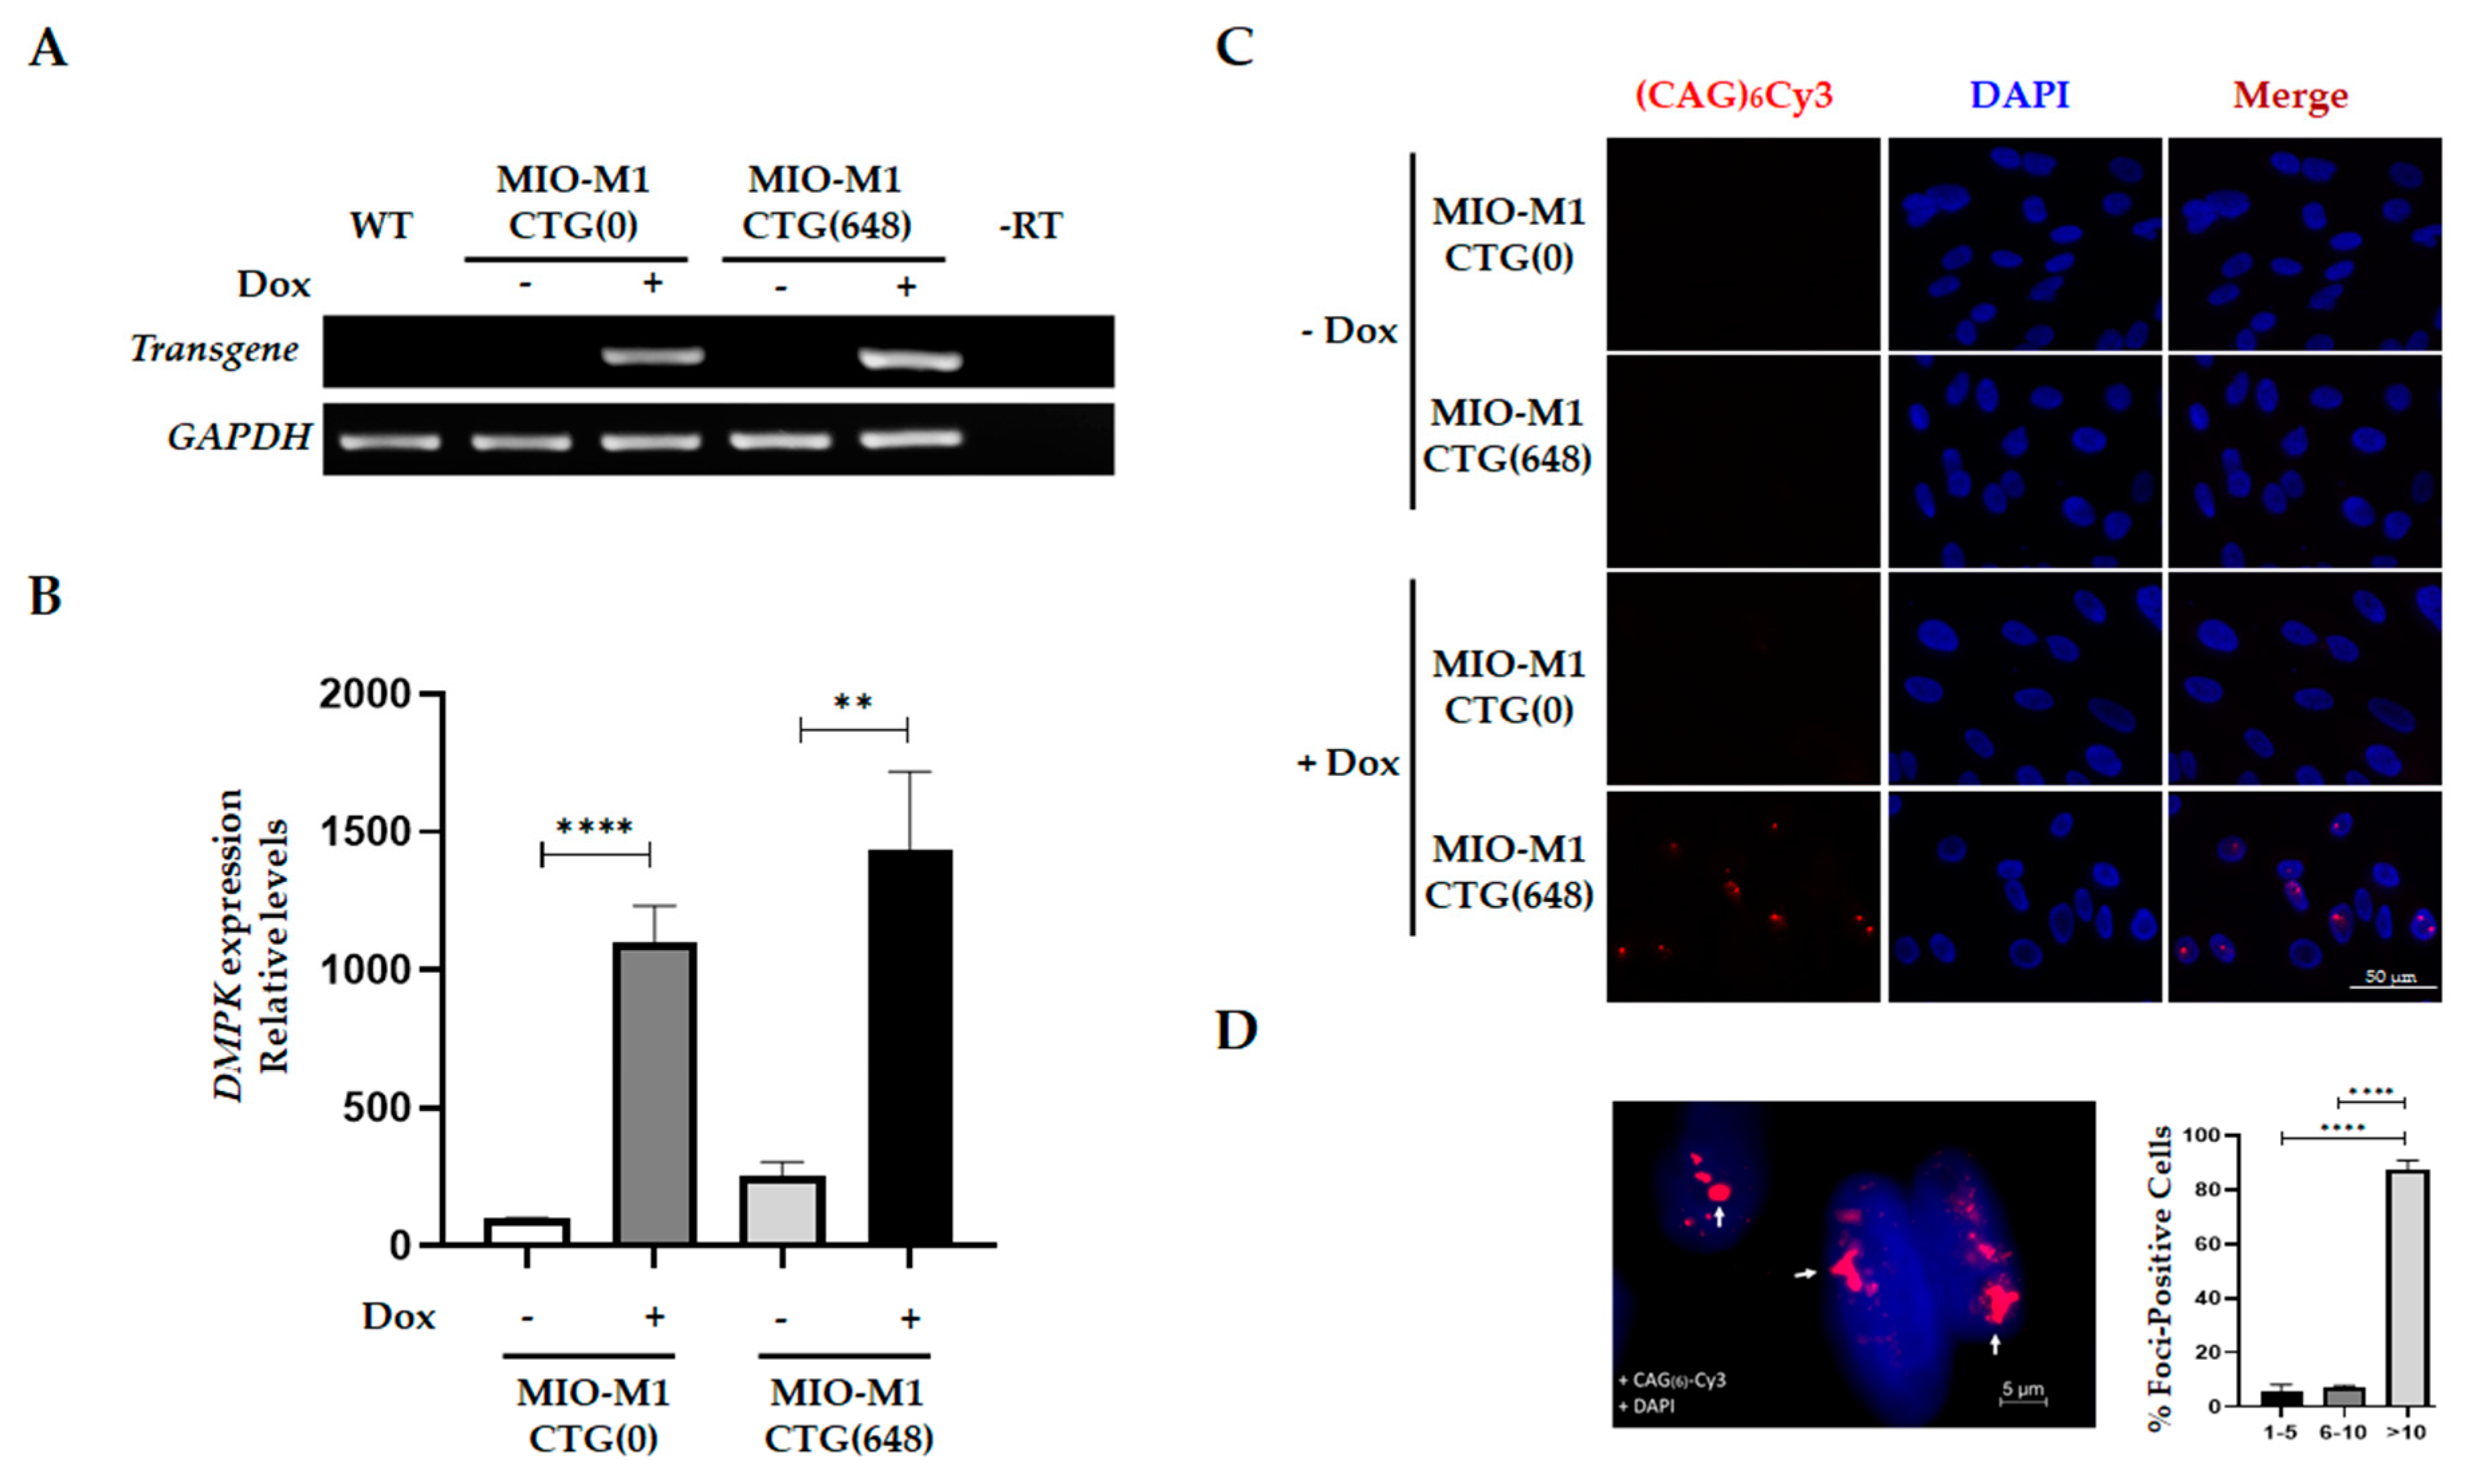
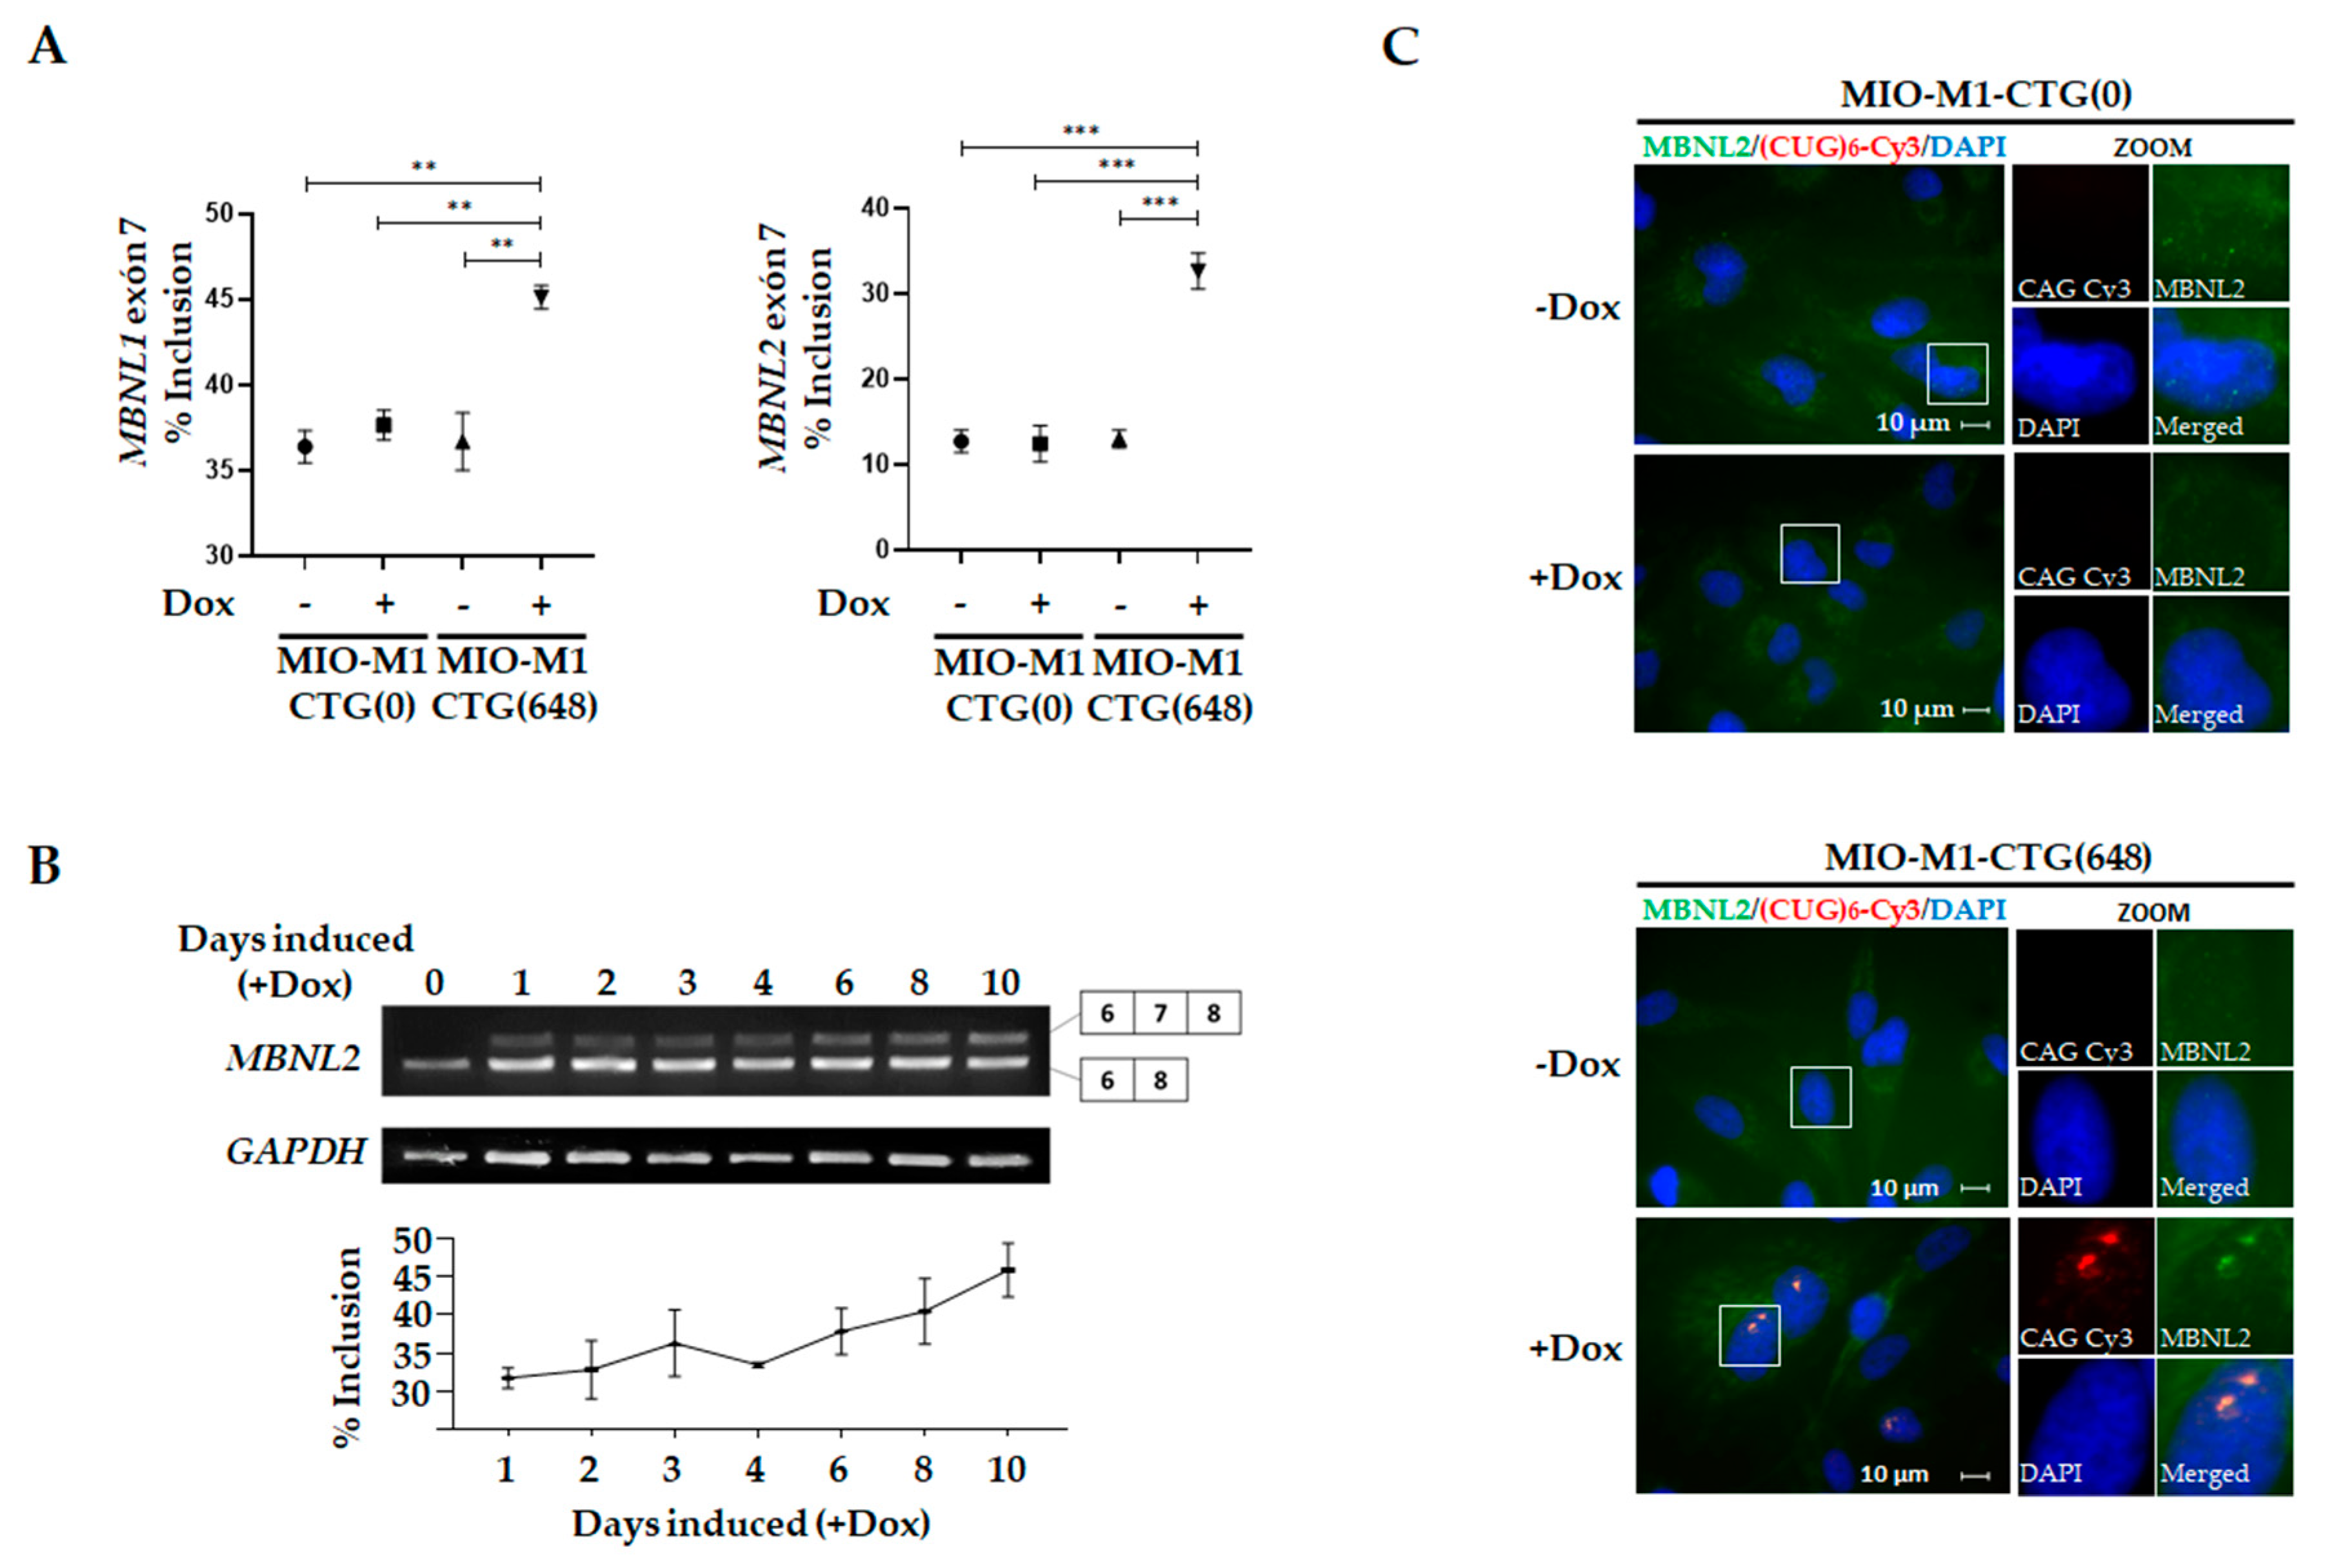
3.1. Generation and Characterization of a MIO-M1 Glial Cell-based Model for DM1

To analyze the effect of DM1 mutation on glial cell physiology, we generated MIO-M1-derivative cell lines expressing a DMPK minigene harboring 0 CTG repeats [MIO-M1-CTG(0)] or an expanded repeat [MIO-M1-CTG(648)], in an inducible manner (Figure S1A). Stable incorporation of the DMPK minigene into cells was confirmed by genotyping using TP-PCR and SP-PCR assays. A ladder pattern of amplified fragments was obtained from MIO-M1-CTG(648) cells after TP-PCR analysis, unlike MIO-M1-CTG(0) cells, which lacked this characteristic pattern (Figure S1B). Confirming this result, SP-PCR experiments on MIO-M1-CTG(648) cells resulted in the amplification of a DNA fragment that corresponds to 648 CTG repeats tract, while no amplified expanded fragment was obtained from MIO-M1-CTG(0) cells (Figure S1C). Together, these results demonstrated that control and mutant DMPK minigene was successfully inserted into the genome of MIO-M1 CTG(0) and MIO-M1 CTG(648) cells, respectively. To analyze DMPK minigene expression in MIO-M1-CTG(0) and MIO-M1-CTG(648) cells, RT-PCR experiments were performed, using a forward primer that exclusively amplifies DMPK minigene transcripts. Both MIO-M1-CTG(0) and MIO-M1-CTG(648) cells expressed the exogenous DMPK RNA after exposure to doxycycline (+Dox) for 3 days, with no detectable basal expression in the absence of Dox (-Dox) (Figure 1A), demonstrating the specificity of the inducible system. In addition, DMPK expression levels were comparable between MIO-M1-CTG(0) and MIO-M1-CTG(648) cells, as shown by RT-qPCR analysis (Figure 1B). Since it has been extensively described that mutant DMPK RNA induces ribonucleoprotein foci in DM1 tissues/cells, we asked whether Dox-induced MIO-M1-CTG(648) cells contained nuclear foci of mutant DMPK RNA. RNA-FISH experiments showed that mutant DMPK RNA foci were present in MIO-M1-CTG(648) cells upon 3 days of Dox induction, unlike MIO-M1-CTG(0) cells, where no nuclear foci was detected (Figure 1C). Quantitative analysis revealed that 75% of cells had nuclear foci, out of these, 87.5% containing >10 foci, 7.0% between 6–10 foci and 5.5% between 1–5 foci (Figure 1D).
Dysregulation of alternative splicing is a central pathogenic mechanism broadly described in DM1. In order to explore this process in our model, we analyzed the exon 7 inclusion rate of MBNL1 and MBNL2, two DM1-associated mis-splicing events [43,44,45]. As anticipated, higher percentage of splicing inclusion for MBNL1 exon 7 was observed in Dox-induced MIO-M1-CTG(648) cells (45.1%) compared to non-induced MIO-M1-CTG(648) (36.7%) and to both non-induced and Dox-induced MIO-M1-CTG(0) cells (36.4% and 37.7 %, respectively) (Figure 2A left panel and Figure S2A). Similarly, MIO-M1-CTG(648) cells showed higher MBNL2 exon 7 inclusion (32.7%) compared to non-induced MIO-M1-CTG(648) cells (13.0%), and to both non-induced and Dox-induced MIO-M1-CTG(0) cells (12.8% and 12.5%, respectively), (Figure 2A right panel and Figure S2A). Notably, the sustained Dox treatment further increased the aberrant splicing of MBNL2 exon 7 over time in the MIO-M1-CTG(648) cells (Figure 2B), likely due to the nuclear foci accumulation. As functional depletion of MBNLs, by its sequestration into the nuclear foci, causes numerous mis-splicing events, we were prompted to examine whether MBNL1/MBNL2 proteins are co-localized with RNA foci in MIO-M1-CTG(648) cells. RNA-FISH coupled with immunofluorescence assays revealed that both, MBNL1 (Figure S2B) and MBNL2 (Figure 2C) co-localize with CUG RNA foci in MIO-M1-CTG(648) cells upon Dox induction, while MIO-M1-CTG(0) cells displayed diffuse MBNL protein staining, supporting the idea that mutant RNA is altering the MBNLs function. Collectively, these results demonstrated the occurrence of the DM1 molecular hallmarks in the established cell model, indicative of the existence of an RNA toxicity mechanism in MIO-M1-CTG(648) cells.

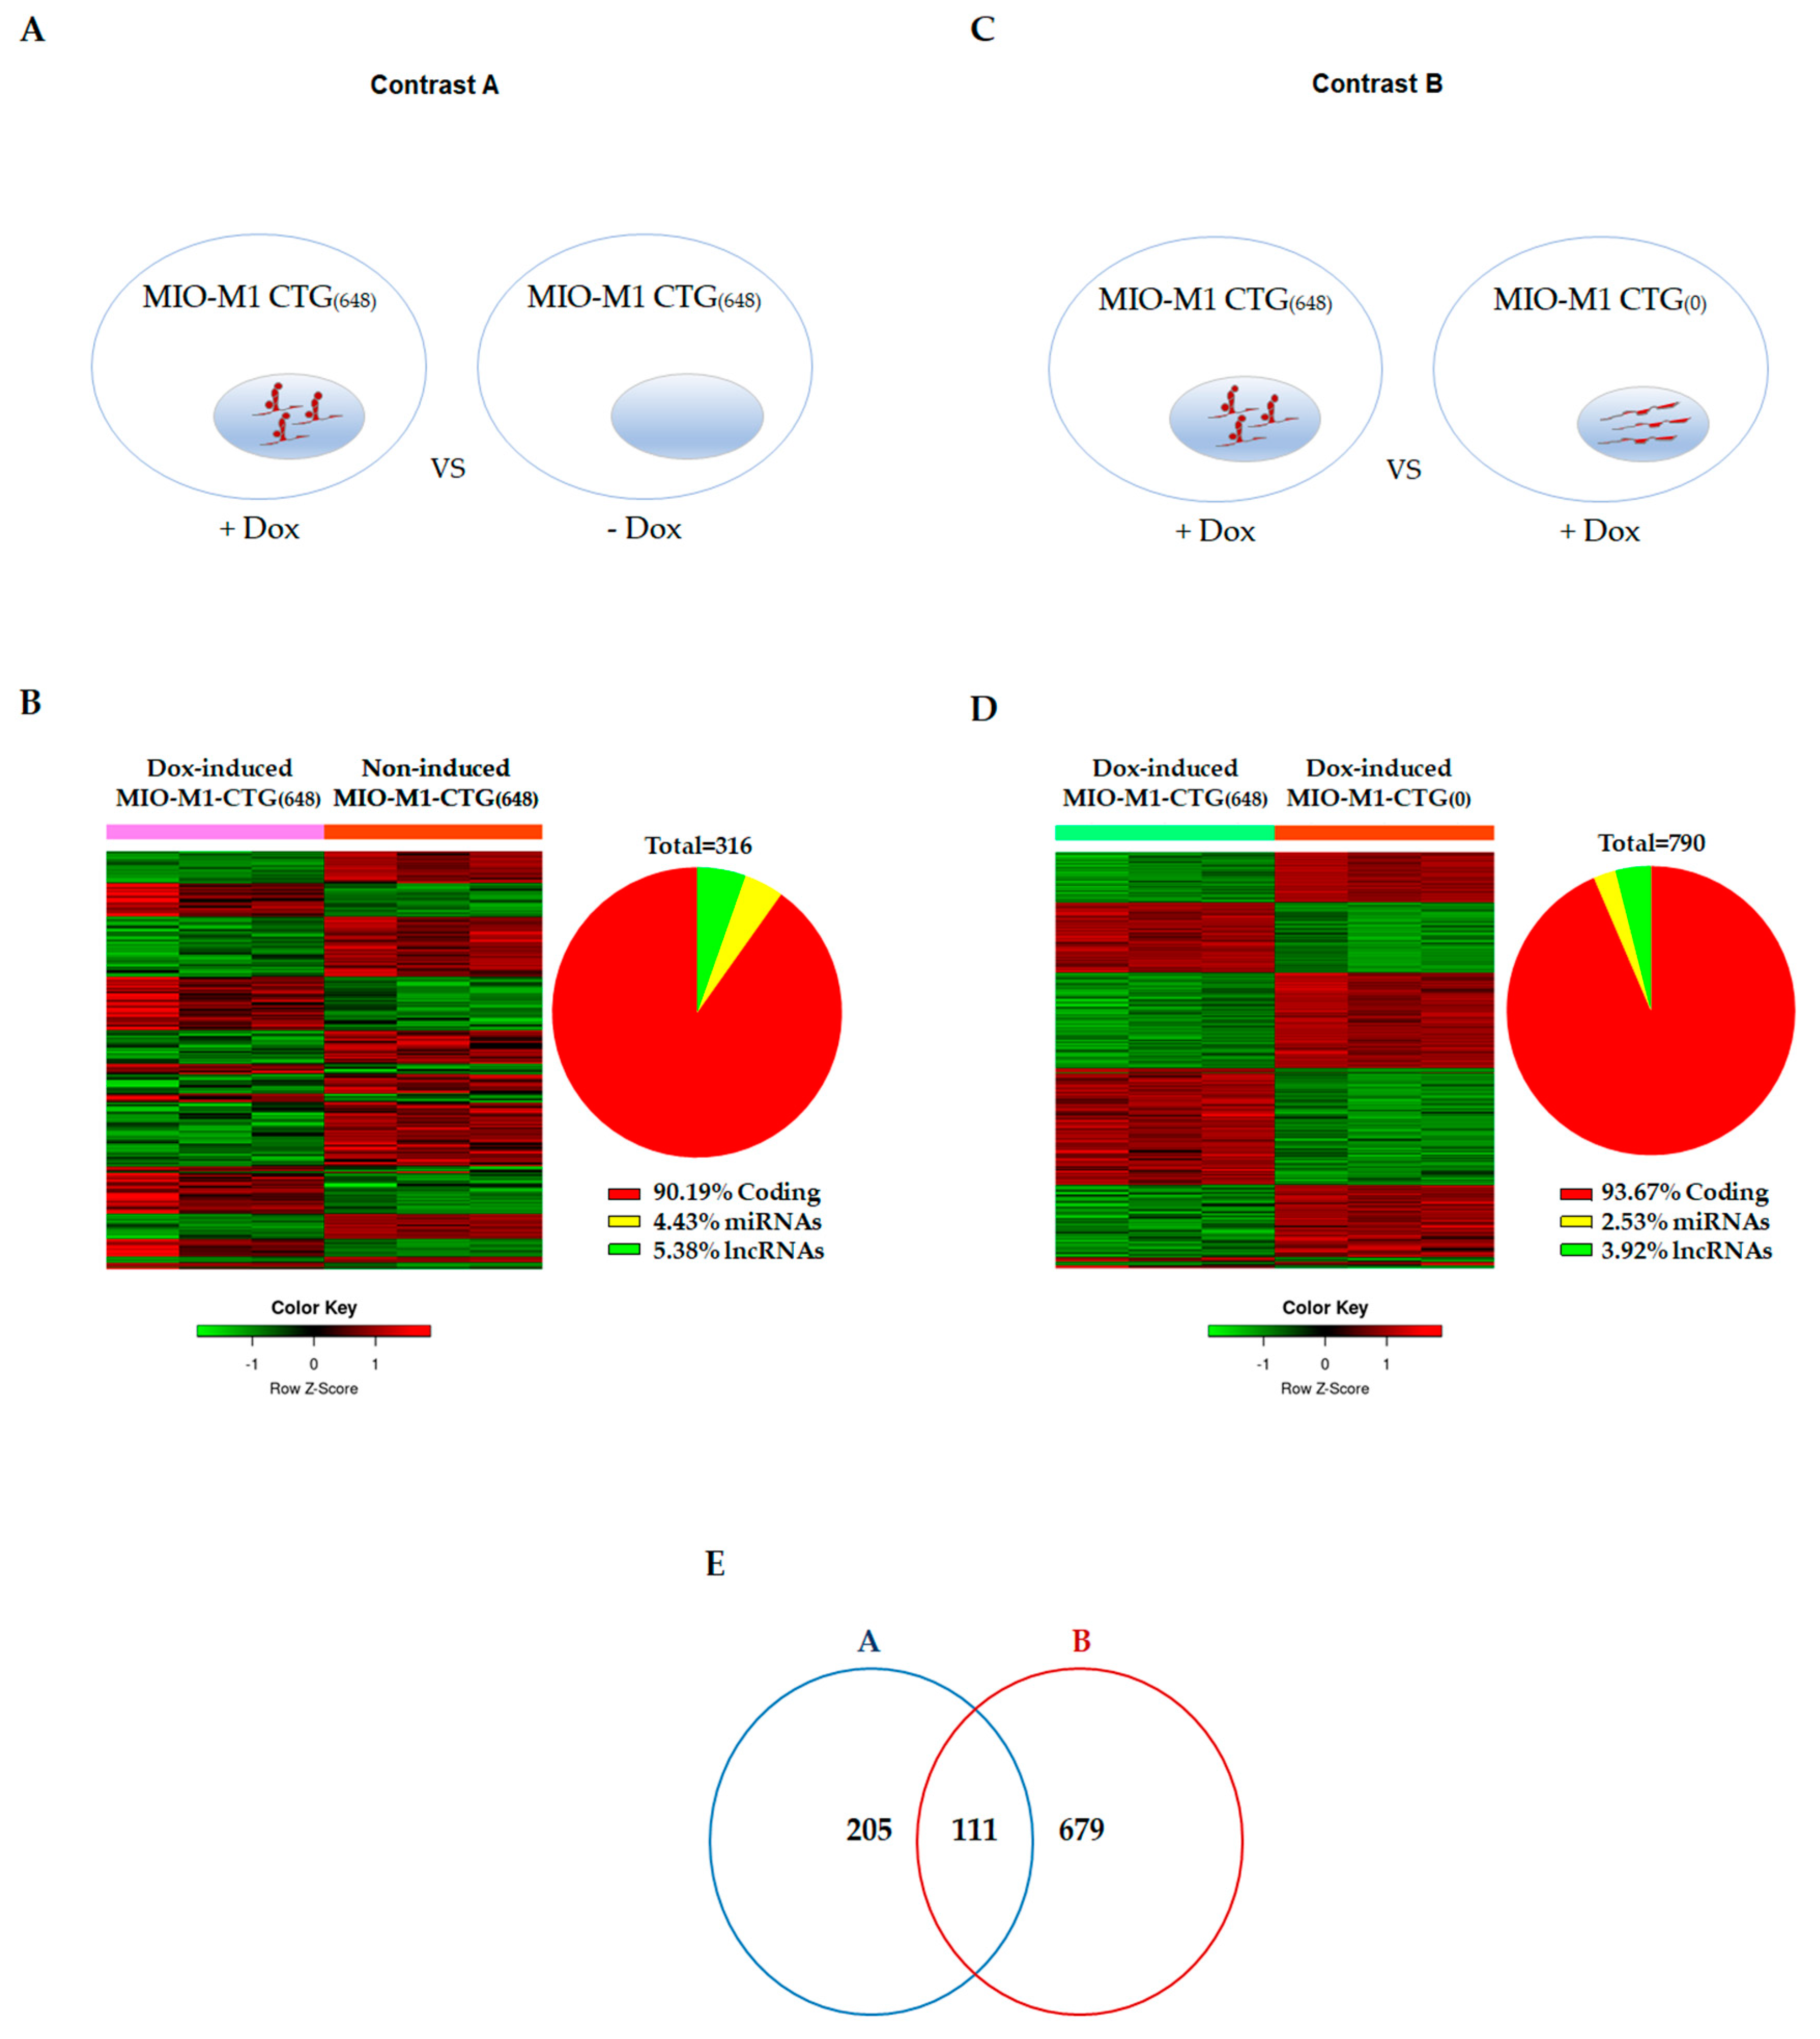
3.2. Effects of DM1 Mutation on Global Gene Expression in MIO-M1-CTG(648) Cells

Several transcription-associated processes are altered in DM1. Thus, it is reasonable to expect global transcriptional changes in our DM1 model. To evaluate this, we determined the gene expression differences between Dox-induced MIO-M1-CTG(648) and non-induced MIO-M1-CTG(648) cells (Figure 3A, Contrast A). We first compared the gene expression profile between MIO-M1-CTG(0) Dox-treated cells and MIO-M1-CTG(0) non-induced cells, in order to remove those genes dysregulated by the Dox treatment. Contrast A led us to identify 316 differentially expressed genes, with 187 up-regulated (59.17%) and 129 down-regulated (40.82%) genes. From this, 285 corresponded to coding (90.19%) and 31 to non-coding genes (9.81%), including 14 miRNAs (4.43%) and 17 long non-coding RNAs (5.38%) (Figure 3B). In parallel, a second contrast (Figure 3C, Contrast B) was analyzed. In this case, we first removed differential effects caused by the transgene insertion site, and then, we compared the transcriptome of Dox-induced MIO-M1-CTG(648) cells versus that of Dox-induced MIO-M1-CTG(0) cells. In contrast B, 790 differentially expressed genes were identified, with 449 up-regulated (56.84%) and 342 down-regulated (43.29%) genes. From this, 740 corresponded to coding (93.67%) and 51 to non-coding genes (6.46 %), including 20 miRNAs (2.53%) and 31 long non-coding RNAs (3.92%) (Figure 3D). A total of 111 differential expressed genes were overlapped in both contrasts, representing 90.9 % coding and 9.1 % non-coding gene changes (Figure 3E and Tables S2 and S3). The ten most up and down differentially expressed genes, that were common in both contrasts (A and B) are shown in Table 1.
In order to confirm the validity of the microarray data, the expression levels of CXCL10, TNFRSF9 and TNFAIP3, identified as upregulated genes, and PLXDC1 and TSPAN18, identified as downregulated genes, were validated by TaqMan probe-based assays on three independent culture replicates. Levels of CORO2B, a gene with any observed changes, were also validated (Figure S3). The expression alteration and directionality of all the transcripts analyzed was confirmed (Table 2 and Figure S3). Collectively, these results showed that DM1 mutation is altering gene expression regulation in MIO-M1-CTG(648) cells.

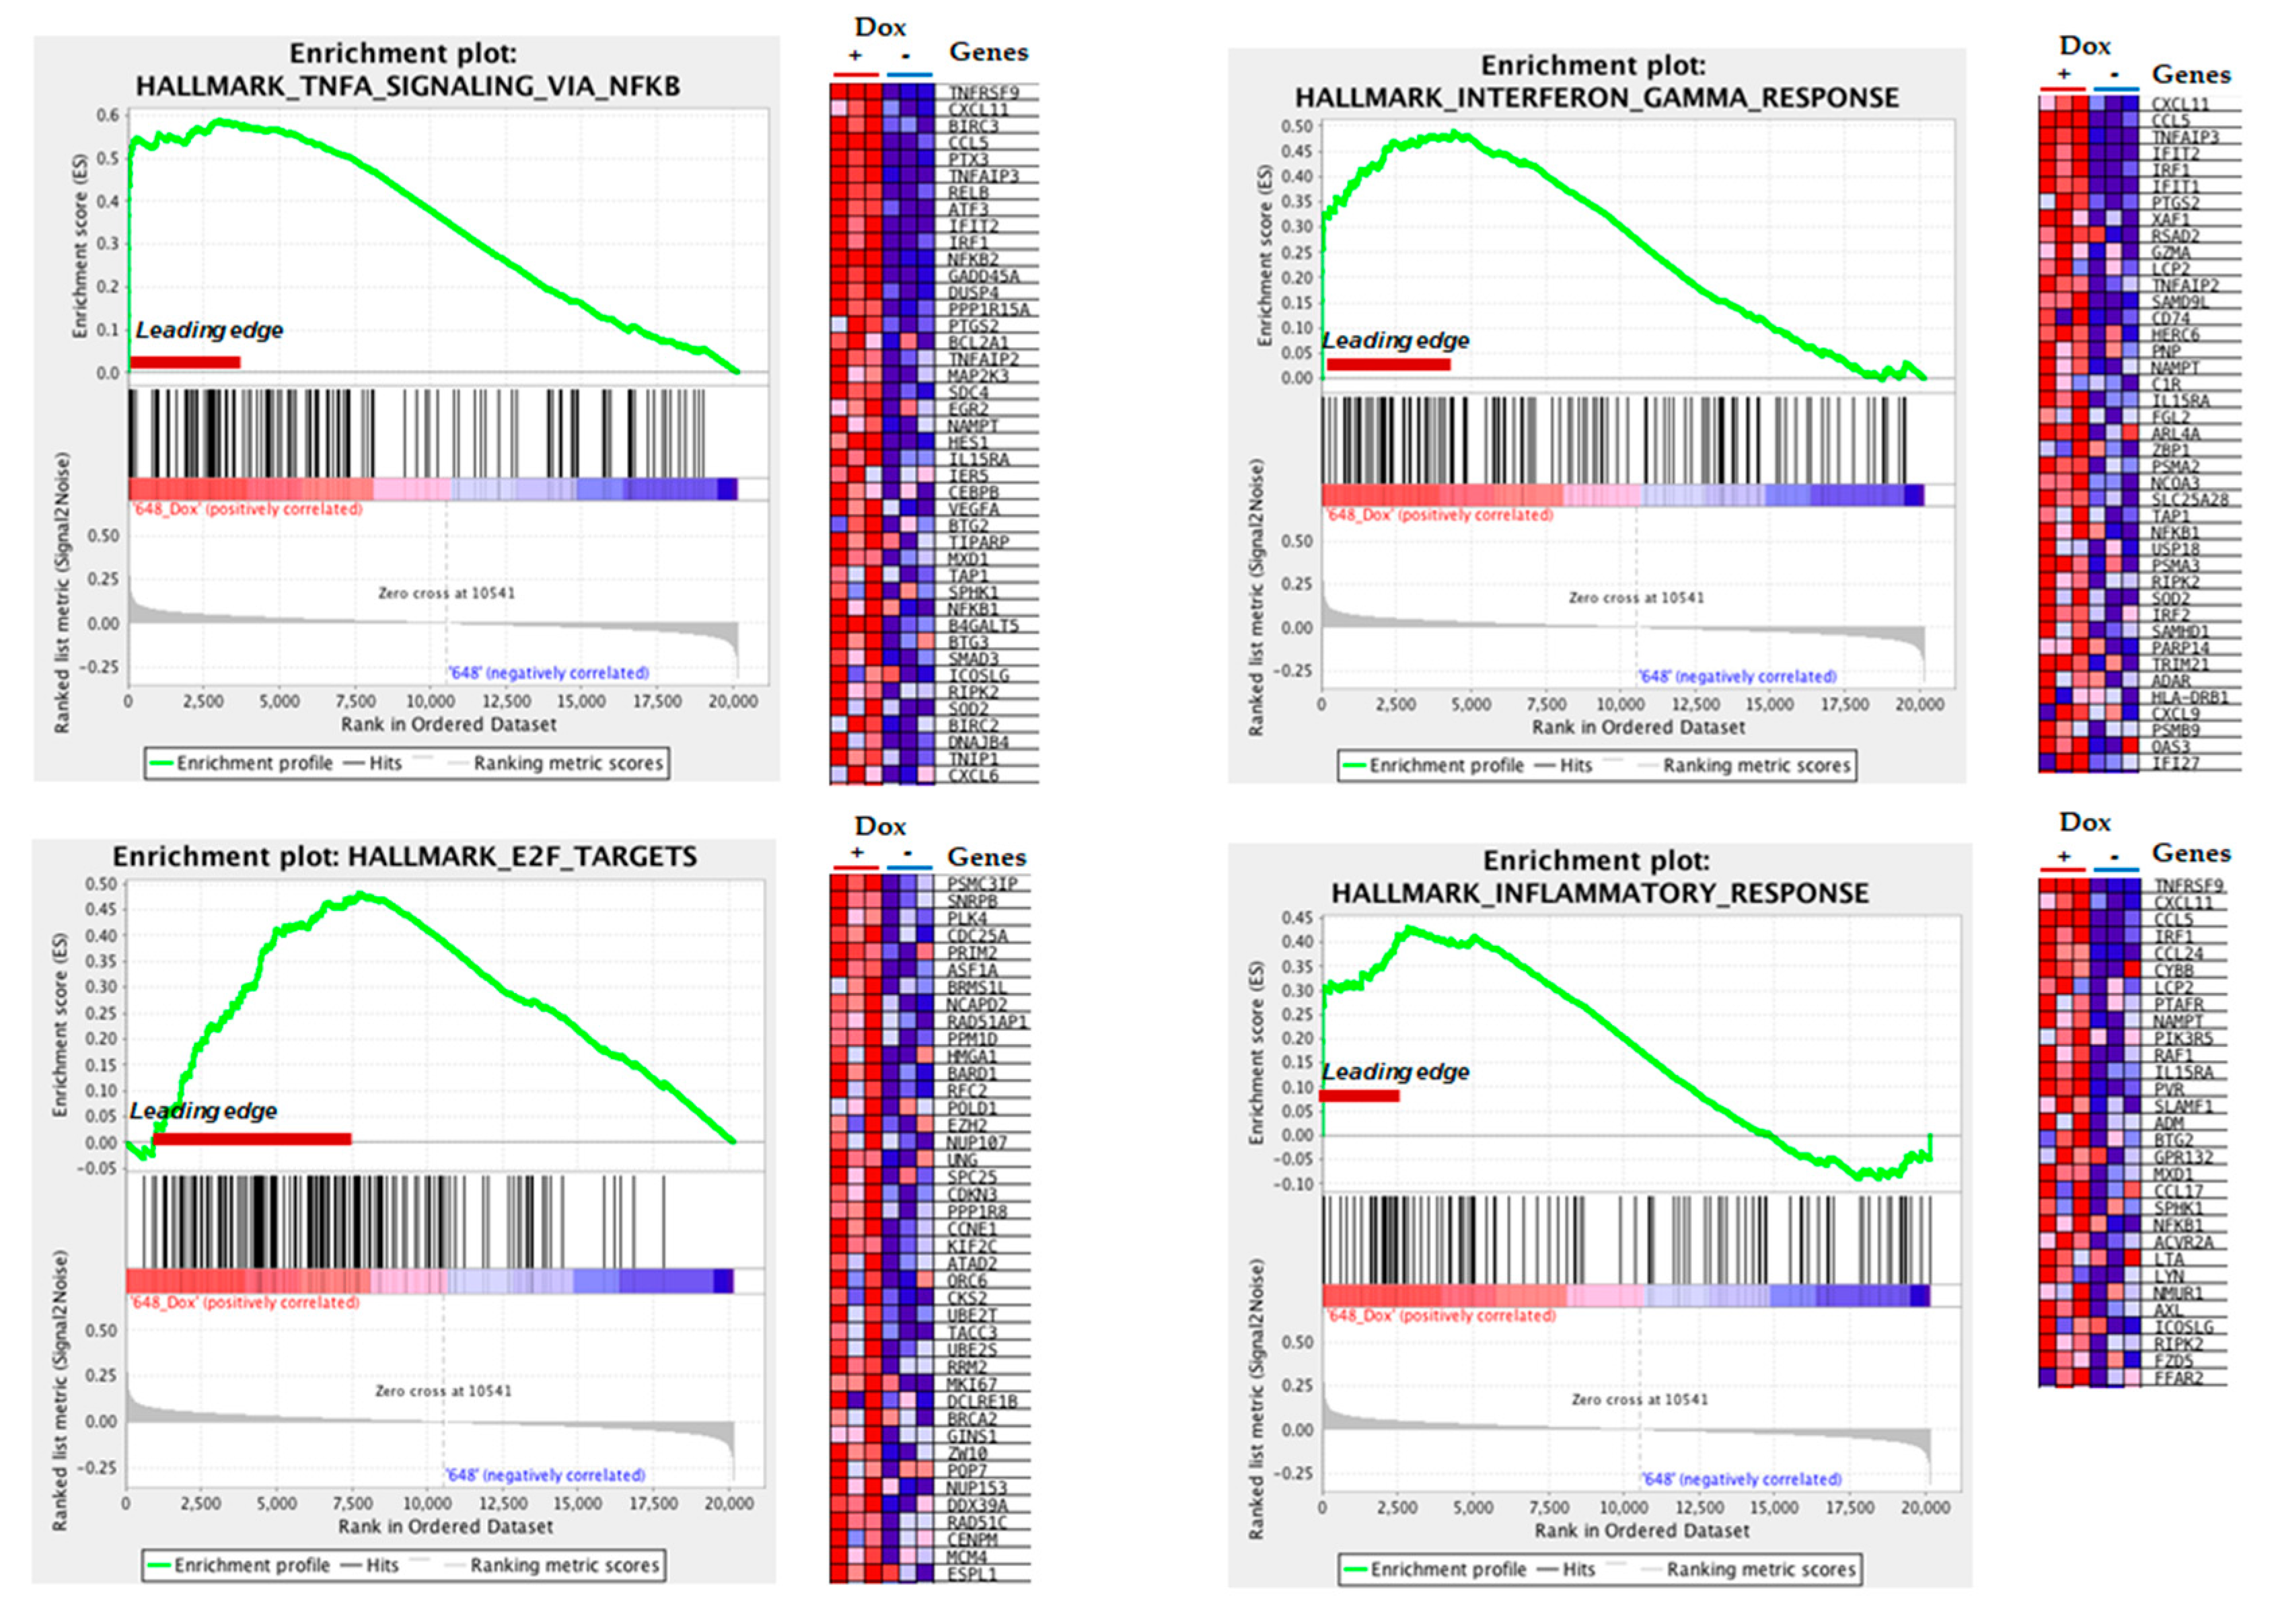
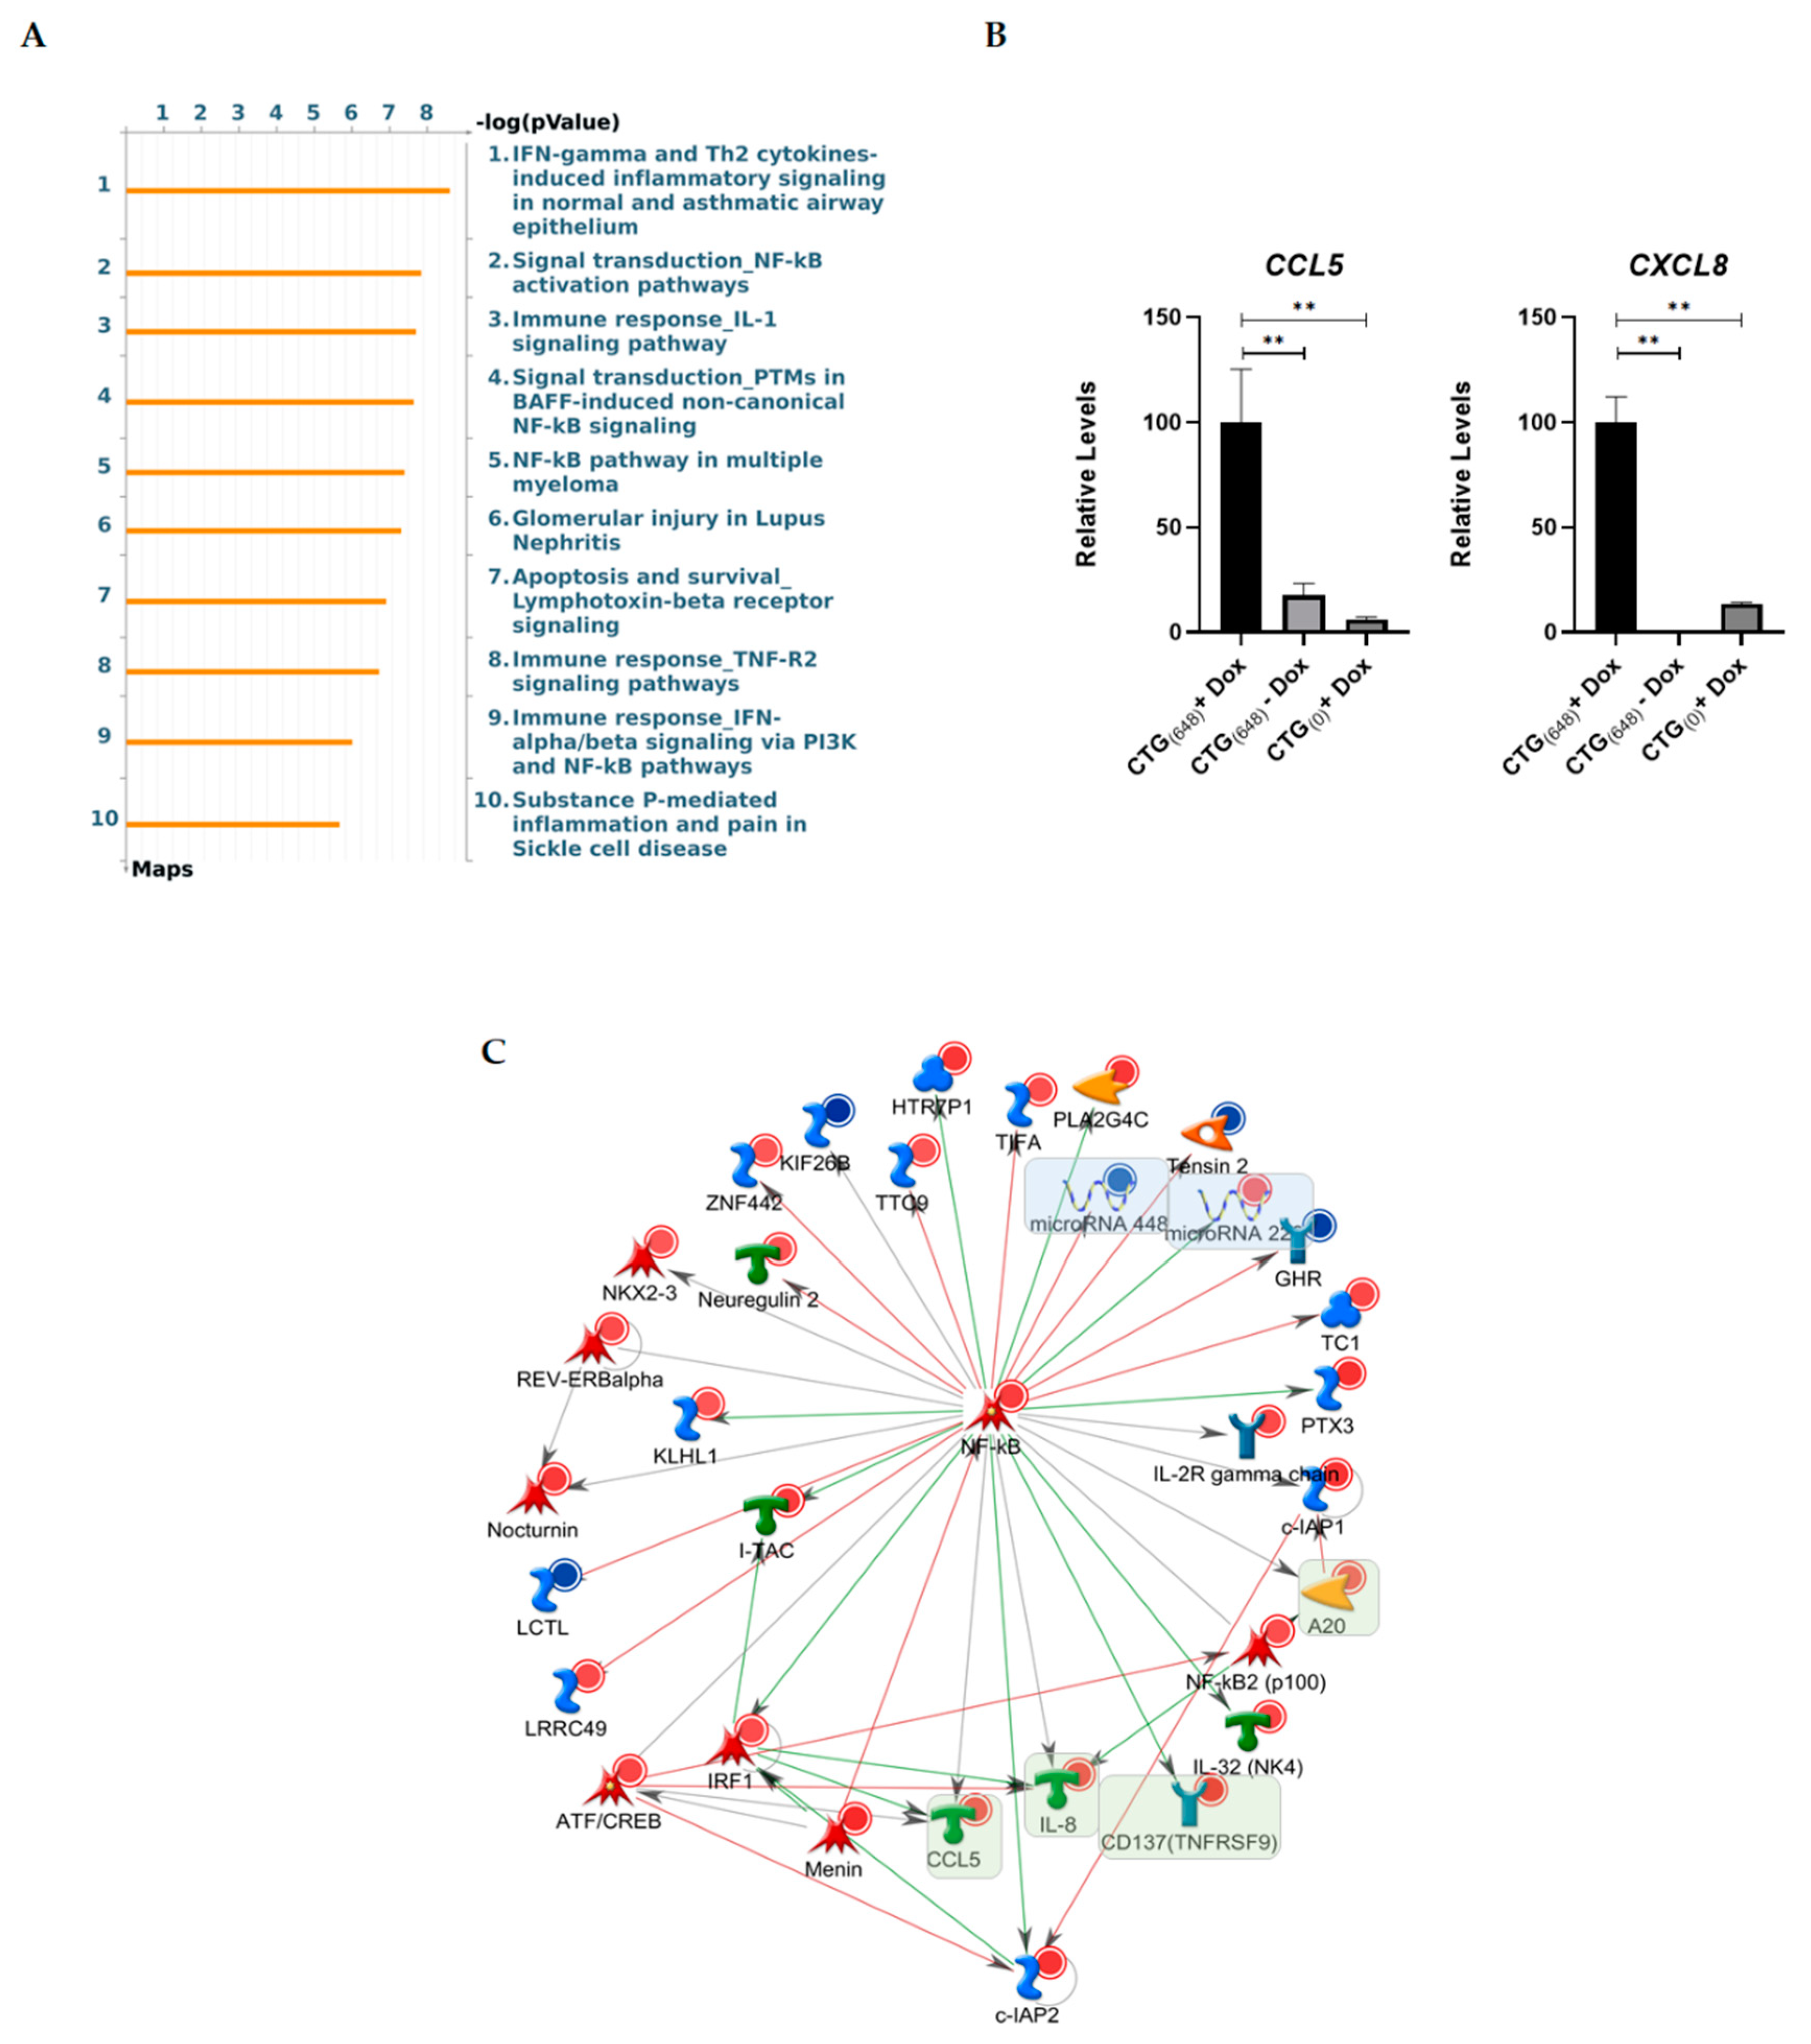
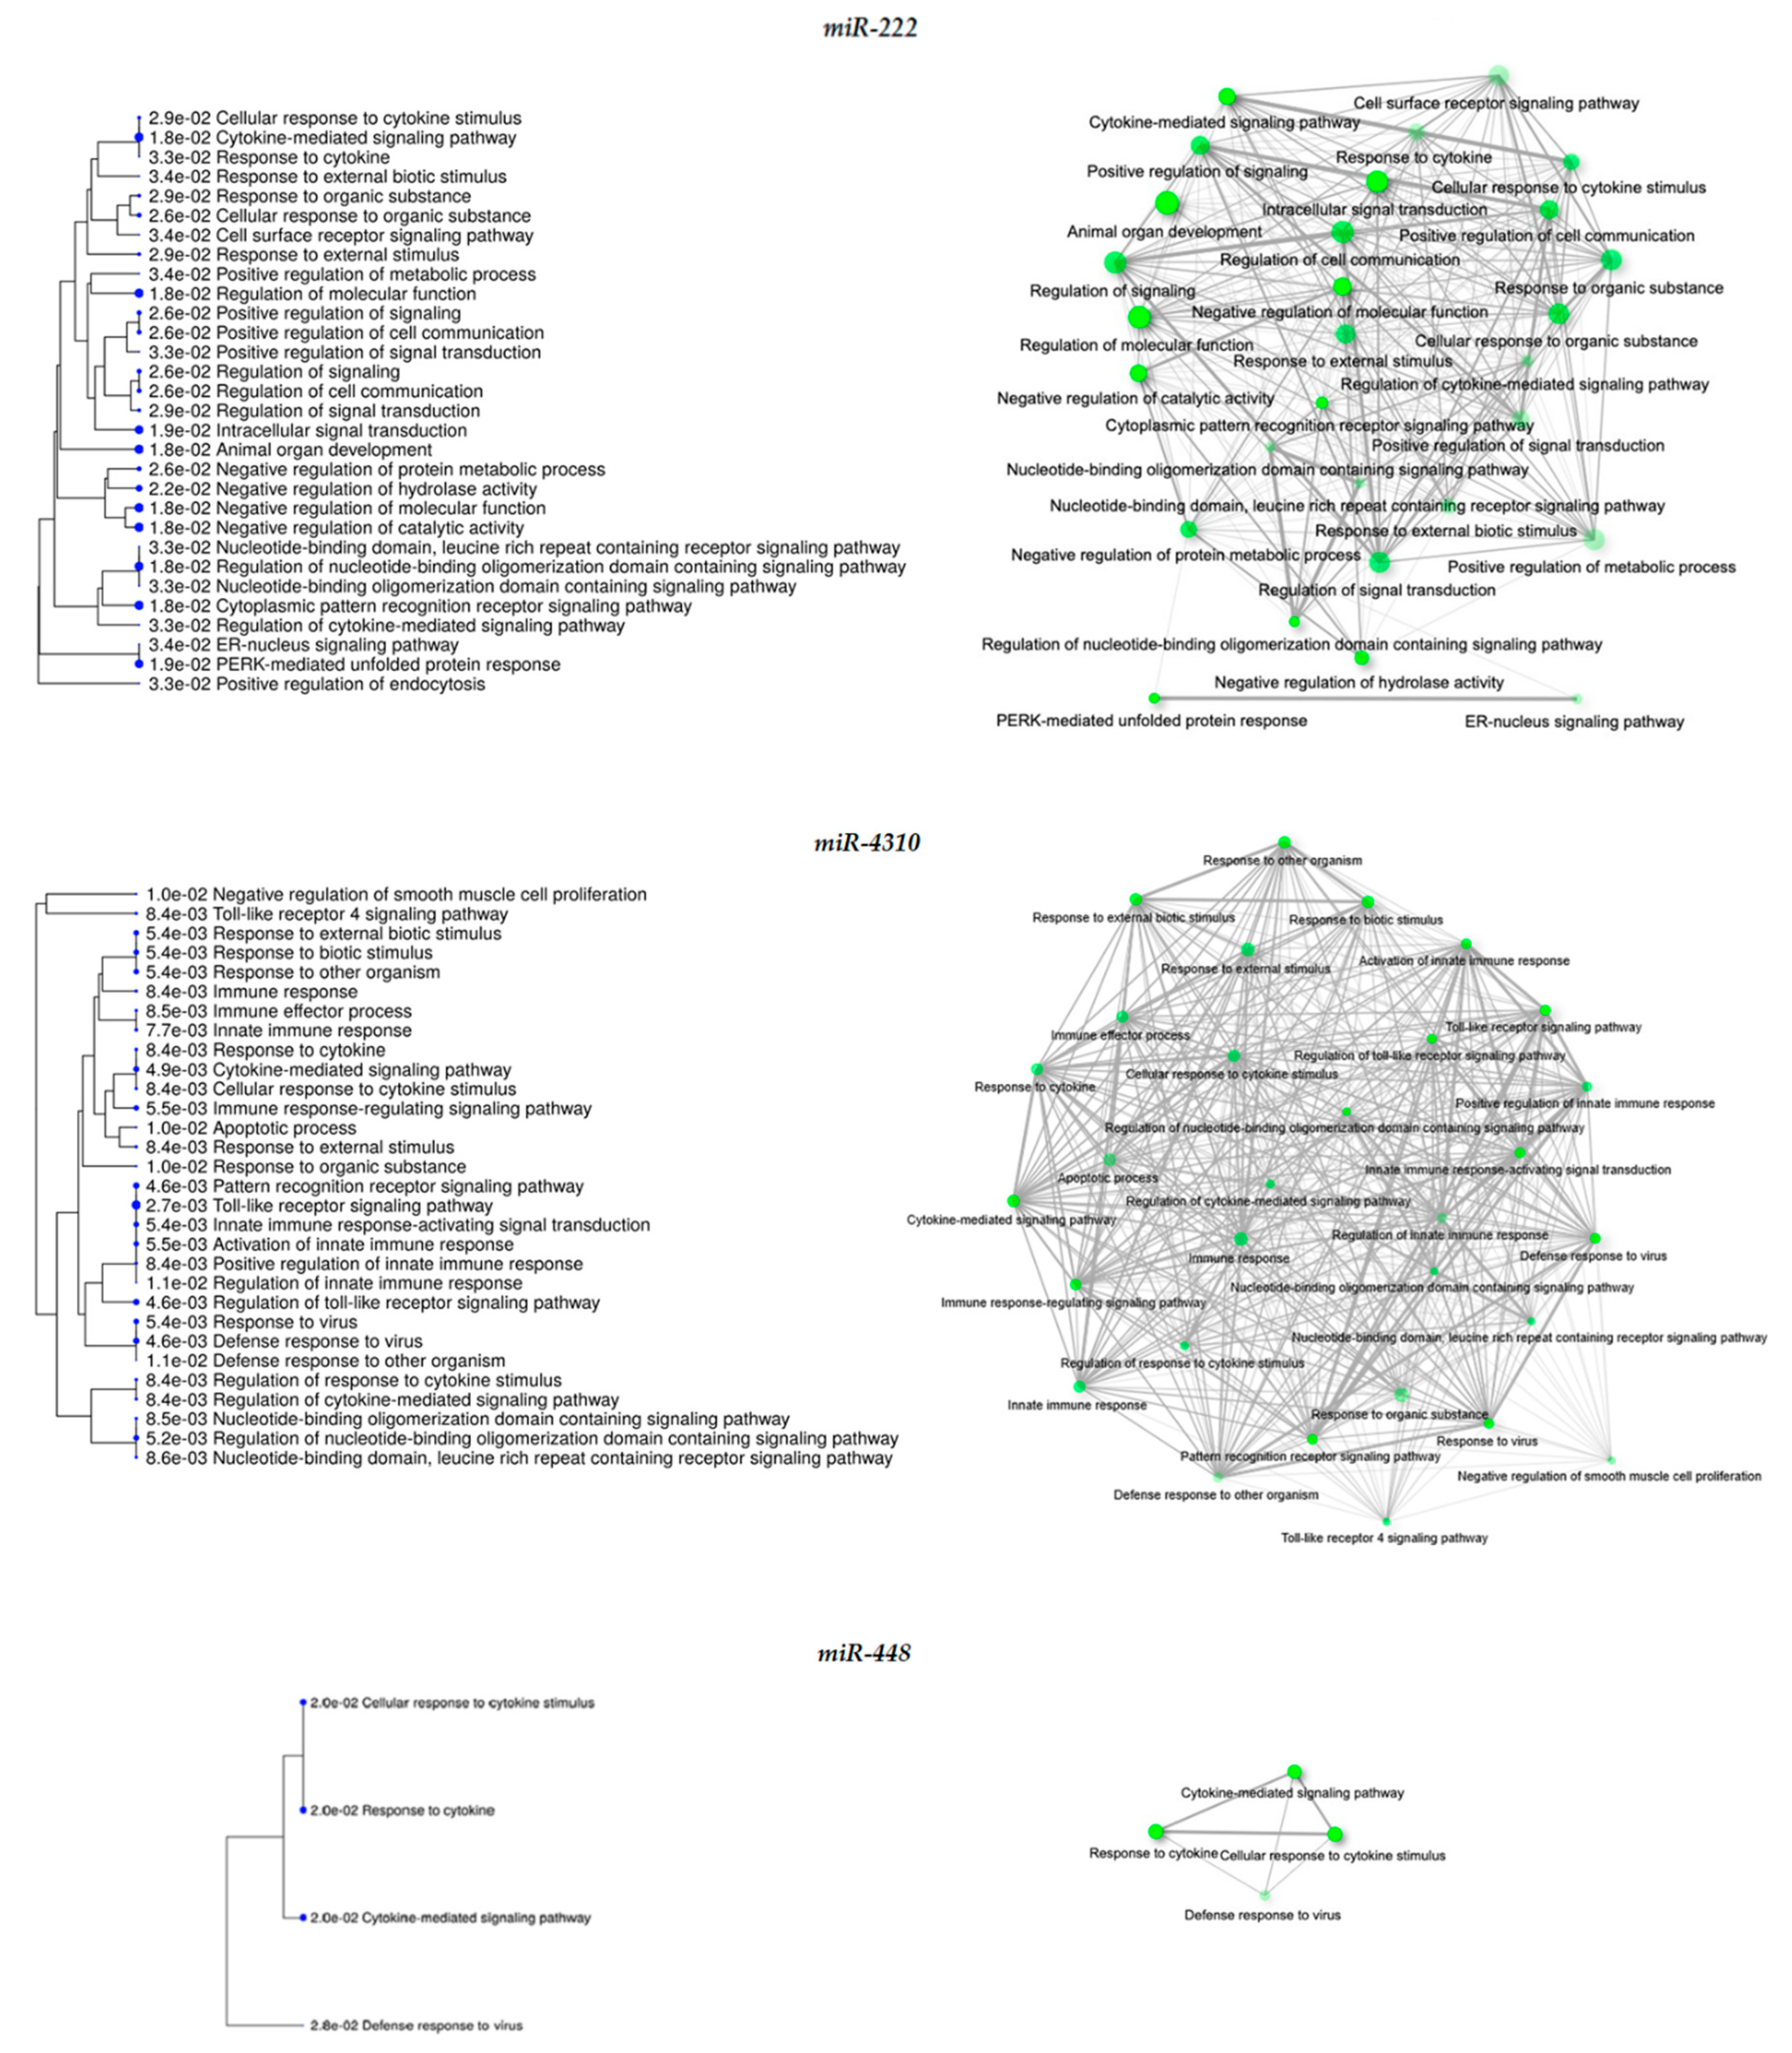
3.3. Gene Ontology Analysis Reveals Altered Inflammatory Processes in MIO-M1-CTG(648) Cells

To understand the functional alterations behind the gene changes in MIO-M1-CTG(648) cells, we performed gene ontology (GO) enrichment analyses using different bioinformatic tools. By GSEA approach, we identified the TNF-α via NFκB signaling pathway, the INF-γ response mechanism, the E2F targets, and the inflammatory response as the most gene set enriched hallmarks in MIO-M1-CTG(648) Dox-induced cells (Figure 4). Likewise, we identified the chemokine mediated signaling pathway as the most significantly overrepresented biological process (Table 3, GSEA Resource/BP category). For cellular component category, the spliceosomal complex was overrepresented (Table 3, GSEA Resource/CC category). Similarly, the most enriched molecular function was the chemokine receptor binding (Table 3, GSEA Resource/MF category). The list of the most enriched gene set and processes revealed by GSEA, DAVID, and KPA tools is showed in Table 3. Remarkably, GO enrichment analysis highlighted immune response-related processes in MIO-M1-CTG(648) Dox-induced cells. Additional processes were also recognized, included the non-coding RNA (ncRNA) transcription, progression through the cell division cycle (G2/M Checkpoint), RNA splicing via transesterification reactions, and the spliceosome pathway (Figure S4).
GO enrichment results were supported by findings obtained with MetaCore pathway analysis. The signal transduction NF-κB activation pathway and the immune response IL-1 signaling pathway were identified among the top 10 Pathway Maps (Figure 5A). IL-1 is a pro-inflammatory cytokine which activates a broad range of transcription factors, including IRF1 and NFκB, thus, inducing a spectrum of immune and inflammatory responses (Figure S5). Since IL-1 pathway positively regulates the expression of the chemokines CXCL8 (IL-8) and CCL5 [46,47], we asked whether MIO-M1-CTG(648) cells overexpressed these two chemokine transcripts upon Dox-induction. As predicted, RT-qPCR experiments demonstrated up-regulated levels of CCL5 and CXCL8 in Dox-induced MIO-M1-CTG(648) cells compared with non-induced MIO-M1-CTG(648) and Dox-induced MIO-M1-CTG(0) cells (Figure 5B), thus, confirming the microarray data (see Table 1). Subsequently, we performed a MetaCore network analysis to identify important transcription factors connected with the query genes in MIO-MI-CTG(648) Dox-treated cells. This approach led us to identify numerous NFκB gene targets, including CCL5, IL-8, TNFRSF9, CXCL10, and interestingly, miR-222 and miR-448, two dysregulated miRNAs in MIO-MI-CTG(648) Dox-treated cells (Figure 5C and Table 4).
In addition to miR-222 and miR-448, we detected altered expression of miR-4288, miR-103a-1, miR-298, and miR-4310 in both contrasts A and B. To get insight into the possible function of these dysregulated miRNAs could have in MIO-M1-CTG(648) Dox-induced cells, we first determined their transcript targets, filtered by nervous system expression, in the miRDB data base. The list of targets was then subjected to GO enrichment analyses. Nervous system development was the most significantly enriched in the biological processes category (FDR 1.1 × 10−68), while synapse (FDR 1.1 × 10−69) and enzyme binding (FDR 1.1 × 10⁻³¹) were overrepresented in cellular component and molecular function categories, respectively (Figure S6). Then, to identify a functional relationship between altered miRNAs and the dysregulated genes identified in contrasts A and B, we performed GO enrichment with the individual lists of putative targets per miRNA. This approach led us to identify 30 miR-222 dysregulated targets in MIO-M1-CTG(648) Dox-treated cells, which were enriched in processes including cytokine-mediated signaling pathway (Table 4 and Figure 6). We determined 32 putative miR-103a-1 targets, involved in animal organ development and morphogenesis. miR-298 revealed to have 24 targets enriched in anatomical structure morphogenesis, among other biological processes. miR-4310 showed 18 targets, that were associated with Toll-like receptor signaling pathway and cytokine-mediated signaling pathway among other immune-related processes. We finally found miR-448 to have 24 putative target genes, involved in cellular response to cytokine stimulus and response to cytokine (Table 4 and Figure 6). Collectively, our results suggest that some of the observed gene changes in MIO-M1-CTG(648) cells are caused by miRNA dysregulation.

4. Discussion

In this work we reported the generation of a new in vitro inducible model for DM1 based on MIO-M1 cells. These cells retain the functional and phenotypic features of Müller glia, including progenitor characteristics, electrophysiological response to glutamate and expression of the cell markers EGF-R, glutamate synthetase, and CRALB [31,48,49]; providing us an excellent biological tool to study the effects of the CTG expansion on glia physiology. The inducible DM1 MIO-M1 model established in this work recreated the RNA gain-of-function mechanism of the disease, exhibited global transcriptome changes, and, according to qPCR validation and GO enrichment analyses, presents inflammation pathway and immune response as major cellular impaired processes.
We demonstrated the stable incorporation of the transgene (Figure S1), and the specific expression of exogenous DMPK transcript in the inducible model (Figure 1A,B). Furthermore, by RNA-FISH experiments, we revealed the existence of abundant CUG RNA foci exclusively in the MIO-M1-CTG(648) cells after Dox induction (Figure 1C). Notably, we observed dysregulation of the alternative splicing process of MBNL1 and MBNL2, as well as co-localization of these splicing regulators with RNA foci in MIO-M1-CTG(648) Dox-treated cells (Figure 2 and Figure S2). These results are in agreement with previous studies performed in cortical astrocytes of the DMSXL mouse and brain samples of affected humans [14,30]; demonstrating that in MIO-M1 DM1 cells, even lacking the DMPK genomic context, the CTG expansion is still able to recapitulate many molecular features of the disease, including splicing defects and accumulation of RNA foci colocalized with MBNL proteins.
Identification of altered gene expression patterns in DM1, in both coding and non-coding genes, has gradually increased in the past few years [43,50,51]. This not only has increased complexity of the disease mechanism but has also raised the possibility of identifying biomarkers and design then novel therapeutic strategies [52]. Thus, we used our MIO-M1 DM1 cell model to explore effects of the DM1 mutation on global gene expression. By applying a microarray approach, we detected global transcriptome changes associated with the DM1 mutation (Figure 3). Comparative analysis revealed 316 and 790 differentially expressed genes in contrast A and contrast B, respectively. The difference in the total number of affected genes between both comparisons is likely due to a different insertion site of transgene in control [MIO-M1-CTG(0)] and mutant [MIO-M1-CTG(648)] cells. Despite of this fact, the proportion of up-regulated, down-regulated, coding and non-coding altered genes was fairly similar between these two contrasts (Figure 3). It is worth to note that a proportion of the most differentially events identified in both contrasts corresponded to the same genes, (see in Table 1: CXCL10, TNFRSF9, CCL5, SCG2, MIR4288, PLEKHS1, TSPAN18). More importantly, validation experiments of the selected transcripts by RT-qPCR supported the reliability of microarrays data (Table 2, and Figure 5).
A major finding of this study is the abnormal transcript regulation of immune response mediators observed in the MIO-MI-CTG(648) Dox-induced cells: the increased expression of CXCL10 (also known as IP-10), TNFRSF9, TNFAIP3 (or A20), CXCL8 (IL-8), and CCL5 (Table 2), as well as the enrichment of important pathways including the immune response IL-1 signaling pathway (Table 3 and Figure 5). In concordance with our results, a previous microarray study, performed in lens epithelial samples of DM1 patients with cataract, reported 382 significant changes with enrichment in both interferon (IFN)-regulated genes and genes associated with the innate immune response [53]. More recently, participation of IFN1 pathway to rescue impaired differentiation of congenital DM1 myoblast was described [54]. Likewise, a study in a Zebra fish model expressing 91 CUG repeats, reported an upregulation of Sesn3, a marker of inflammation implicated in some neurological disorders [55]. Immune response in DM1 has also been explored at systemic level: higher levels of the soluble tumor necrosis factor receptor 2 (sTNFR2), interleukin (IL) 1 beta (IL-1β), tumor necrosis factor-alpha (TNF-α), and IL-6, as well as decreased levels of IL-10 have been found in the plasma of patients, compared to healthy subjects. Overall, these studies have revealed significant association between pro-inflammatory cytokines and both DM1 disease severity and CTG expansion size [56,57,58]. In the light of this, and in conjunction with our transcriptome data, an active role of the inflammation and immune response pathway in MIO-M1 cells is highly conceivable.
A pro-inflammatory cellular environment may contribute to the derangement of CNS function [59]. Consistent with this notion, several studies have linked CNS pathology with altered levels of chemokines: CXCL10 has been implicated with altered cognitive function [60,61], and neuroendocrine dysregulation [62]; furthermore, altered levels of CXCL8 were found to be associated with schizophrenia [63], and depression [64], as well as with structural brain abnormalities [65]. Finally, dysregulation of CCL5 has been linked with depression and neuroinflammatory processes in neurodegenerative conditions, such as Alzheimer (AD) and Parkinson’s (PD) diseases [66]. Deregulated release of chemokines by glia cells may impact on neuron-glia communication through the orchestration of a neuroinflammatory cross-talk [67]. It has been reported that chemokines like CCL5, may lead to an activated glia state that releases pro-inflammatory effectors including TNF-α and IL-1 β, which in turn induce chemokine overproduction [68,69]. In line with this, we identified the TNF-α pathway, the immune response to IL-1 signaling, and the chemokine mediated signaling pathway as the most enriched key pathways and biological processes in MIO-M1-CTG(648) cells (Table 3, GSEA and KPA analyses). In addition, we found overexpression of TNFRSF9 (Table 2 and Table 3), a member of the TNF receptor family that activates microglia cells, enhances cell adhesion, and promotes secretion of pro-inflammatory cytokines [70,71]. We also observed upregulation of TNFAIP3 (Table 2 and Table 3), a critical mediator of microglia activation and synaptic function [72]. In concordance with these results, a previous study showed increased microglial expression related to a proinflammatory process in the Mbnl2 knockout mice, an animal model that displays features of DM1 neuropathophysiology [73]. Collectively, these observations support the existence of a neuroinflammatory mechanism in the Dox-induced MIO-M1 CTG(648) cells.
Interestingly, GSEA analysis identified enrichment of the splicing processes in MIO-M1-CTG(648) Dox-induced cells (see spliceosomal complex for cellular component category in Table 3 and RNA splicing via transesterification reactions in Figure S3), which is in agreement with the alternative splicing defect at MBNL1/2 exon 7 (Figure 2). Moreover, cell cycle progression (G2/M checkpoint) was found enriched in our analyses (Figure S3). In concordance with this, Peng et al. demonstrated that CUG expansion led to accelerated cell cycling, which explains at least in part, the defective myocyte differentiation in DM1 [74].
Remarkably, GO analyses uncovered the NFκB transcription factor as a potential key regulator of inflammation processes in MIO-M1-CTG(648) cells (see TFT and PaPM categories in Table 3, and Figure 5). As reported elsewhere, NFκB exerts important functions in cell cycle and survival, immune response and inflammation [75,76,77,78,79]. After activation by myriads of agents (mitogens, viruses, oxidative stress, lipopolysaccharide, and cytokines, etc.), NFκB regulates the expression of multiple of genes including cytokines and chemokines. Solid experimental evidence has indicated that NFκB upregulates the expression of IRF1 [80], IL8 [46,81], CCL5 [81], and CXCL10 [47,82]. Thus, the upregulated expression of the immune mediators CXCL10, CCL5, CCXCL8, and TNFRSF9 could be explained by increased activation of transcription regulators such as RELB, NFκB2, and/or IRF1 (Figure 5), whose RNA expression was found affected in Dox-induced MIO-M1-CTG(648) cells (Tables S2 and S3: LogFC 1.26/contrast A, LogFC 1.31/contrast B for RELB; LogFC 0.84/contrast A, LogFC 0.60/ contrast B for NFκB2; and LogFC 0.88/contrast A, LogFC 0.62/contrast B for IRF1).
Several miRNAs have been found to be deregulated in tissues and cell models of DM1 [52,83,84,85]; however, studies in the CNS and particularly in glia cells are lacking. In this work, we detected dysregulated levels of six miRNAs in both in contrasts A and B (Table 4). None of these alterations, except for the miR-222 upregulation reported in skeletal muscle [86], has been previously reported in DM1. Functional consequences of these dysregulated miRNAs were evaluated by GO enrichment analysis of their respective targets. Such analysis revealed an involvement of the altered miRNAs in processes with relevance to CNS function, specifically in nervous system development (Figure S5). In line with this, miR-222 is associated with proliferation of neural stem cell, the development of retina [87], as well as with developing and maturation of the CNS [88]. On the other hand, the inhibition of miR-103a can inhibit the activation of astrocytes in hippocampus, improving thereby neuron damage [89]; furthermore, its low serum levels have been linked with cognitive impairment [90]. It is worth to note that dysregulated expression of miR-4288, miR-222, miR103, miR-298, and miR-448 found in our DM1 model is shared with other neurodegenerative conditions such as AD and Huntington’s disease (HD) [91,92,93,94,95]. Surprisingly, although miR-4288 showed the highest FC (2.79 contrast A/2.77 contrast B) in Dox-induced MIO-M1-CTG(648) cells, we only recognized two targets within the dysregulated genes (Table 4). CELF3 was identified as a miR-298 target, while CELF5 and CELF6 were both predicted as miR-448 targets. Interestingly, MBNL1 was revealed as one of the predicted miR-4288 targets. Considering the central role playing by MBNL and CELF proteins in the DM1 pathogenic mechanism, further studies are required to explore the functional consequences of the indicated dysregulated miRNAs.
As shown in Table 4, GO enrichment analysis of dysregulated miRNA targets suggested a miRNA-mediated regulation of the immune response in Dox-induce MIO-M1-CTG(648) cells, mainly through, miR-222, miR-4310, and miR448 (Figure 6). Supporting this, it has been demonstrated that miR-222 directly activates NFκB [96], which in turn induce miR-222 expression [97], orchestrating a positive feedback loop. On the other hand, it has been reported the transcriptional suppression of miR-448 by NFκB [98]. These regulatory feedback loops may promote the increased expression of their predicted targets, namely, TNFRSF9, CXCL8, and TNFAIP3 (Table 4), and ultimately induce the immune/inflammatory response in Dox-induced MIO-M1-CTG(648) cells. The existence of multiple recognition sites for different miRNA on transcripts is well known [99]. Nonetheless, it is worth to note that miRNAs can also be regulated by target interactions in an intricate manner [100], meaning that transcript expression may be controlled at various levels.
Collectively, our findings strongly suggest the implication of the inflammatory pathway and the immune system response in the physiology of glial MIO-M1-CTG(648) cells. The establishment of this glial DM1 cell model will be helpful to explore new mechanistic avenues that connect the glia with the CNS alterations of DM1 patients. Further functional experiments in MIO-M1-CTG(648) cells as wells in animal models and/or brain human samples are required to strengthen the significance of our findings in the biology of DM1.

5. Conclusions

We established an inducible glial cell model for DM1, the MIO-M1-CTG(648) cells, which recapitulated the molecular hallmarks of the disease. The transcriptome alterations found in these cells open a new avenue for the study of glia as a contributor to the CNS symptoms of DM1, likely by the activation of a neuroinflammation processes throughout dysregulation of chemokines and immune meditators. Furthermore, our DM1 cell model might represent a valuable tool for the design of novel therapeutic approaches.

Supplementary Materials

The following are available online at https://www.mdpi.com/2218-273X/11/2/159/s1. Figure S1: Generation of cell model and genotyping. Figure S2: MBNL1/2 splicing defects and MBNL1 colocalization with RNA foci. Figure S3: RT-qPCR validation of microarray gene expression analysis. Figure S4: GSEA of non-immune related enriched pathways in Dox-induced MIO-M1-CTG(648) cells. Figure S5: Immune response IL-1 signaling pathway regulates numerous cell functions potentially altered in Dox-induced MIO-M1-CTG(648) cells. Figure S6: GO enrichment analysis of dysregulated miRNA targets, filtered by brain tissue. Table S1: Sequences of primers used in RT-PCR assays. Table S2: Overlapping dysregulated genes detected in contrast A. Table S3: Overlapping dysregulated genes detected in contrast B.

Author Contributions

Conceptualization, O.H.-H.; methodology, C.N.A.-V., D.S.-C., L.E.A.-J., and R.S.-S.; software, J.P., K.V.-S., C.R., and V.M.; validation, J.M.H.-H., and L.E.A.-J.; formal analysis, J.P., K.V.-S., C.R., V.M., J.M.H.-H., and O.H.-H.; investigation, C.N.A.-V., N.L.-G.; A.O., J.J.M., and B.C.; resources, O.H.-H., J.J.M., and R.S.-S.; data curation, C.N.A.-V., J.M.H.-H., and O.H.-H.; writing—original draft preparation, O.H.-H.; writing—review and editing, J.M.H.-H., B.C., and O.H.-H.; supervision, O.H.-H.; project administration, O.H.-H.; funding acquisition, O.H.-H., J.J.M., and R.S.-S. All authors have read and agreed to the published version of the manuscript.

Funding

This research was funded by CONACyT, grant numbers CB-2012-01/183697 to O.H-H, CB258043 to J.J.M. and CB258268 to R.S-S. C.N.A-V. and D.S-C were recipients of doctoral fellowship under CONACyT grants (263471 and 394277, respectively).

Institutional Review Board Statement

Not applicable.

Informed Consent Statement

Not applicable.

Data Availability Statement

The microarray data of this study are available in NCBI’s Gene Expression Omnibus database (GSE164057).

Acknowledgments

We thank Thomas Cooper (Baylor College of Medicine) for donation of DMPKS and DT960 vectors. We also thank J. Susana Jano-Ito and N. Mireya Murillo Melo for technical support.

Conflicts of Interest

The authors declare no conflict of interest. The funders had no role in the design of the study; in the collection, analyses, or interpretation of data; in the writing of the manuscript; or in the decision to publish the results.

References

  1. Theadom, A.; Rodrigues, M.; Roxburgh, R.; Balalla, S.; Higgins, C.; Bhattacharjee, R.; Jones, K.; Krishnamurthi, R.; Feigin, V. Prevalence of muscular dystrophies: A systematic literature review. Neuroepidemiology 2014, 43, 259–268. [Google Scholar] [CrossRef] [PubMed] [Green Version]
  2. Brook, J.D.; McCurrach, M.E.; Harley, H.G.; Buckler, A.J.; Church, D.; Aburatani, H.; Hunter, K.; Stanton, V.P.; Thirion, J.P.; Hudson, T.; et al. Molecular basis of myotonic dystrophy: Expansion of a trinucleotide (CTG) repeat at the 3′ end of a transcript encoding a protein kinase family member. Cell 1992, 69, 385. [Google Scholar] [CrossRef]
  3. Fu, Y.H.; Pizzuti, A.; Fenwick, R.G.; King, J., Jr.; Rajnarayan, S.; Dunne, P.W.; Dubel, J.; Nasser, G.A.; Ashizawa, T.; de Jong, P.; et al. An unstable triplet repeat in a gene related to myotonic muscular dystrophy. Science 1992, 255, 1256–1258. [Google Scholar] [CrossRef]
  4. Mahadevan, M.; Tsilfidis, C.; Sabourin, L.; Shutler, G.; Amemiya, C.; Jansen, G.; Neville, C.; Narang, M.; Barcelo, J.; O’Hoy, K.; et al. Myotonic dystrophy mutation: An unstable CTG repeat in the 3′ untranslated region of the gene. Science 1992, 255, 1253–1255. [Google Scholar] [CrossRef] [PubMed]
  5. Udd, B.; Krahe, R. The myotonic dystrophies: Molecular, clinical, and therapeutic challenges. Lancet Neurol. 2012, 11, 891–905. [Google Scholar] [CrossRef]
  6. Dogan, C.; De Antonio, M.; Hamroun, D.; Varet, H.; Fabbro, M.; Rougier, F.; Amarof, K.; Arne Bes, M.C.; Bedat-Millet, A.L.; Behin, A.; et al. Gender as a Modifying Factor Influencing Myotonic Dystrophy Type 1 Phenotype Severity and Mortality: A Nationwide Multiple Databases Cross-Sectional Observational Study. PLoS ONE 2016, 11, e0148264. [Google Scholar] [CrossRef] [PubMed]
  7. Gourdon, G.; Meola, G. Myotonic Dystrophies: State of the Art of New Therapeutic Developments for the CNS. Front. Cell Neurosci. 2017, 11, 101. [Google Scholar] [CrossRef] [Green Version]
  8. Angeard, N.; Jacquette, A.; Gargiulo, M.; Radvanyi, H.; Moutier, S.; Eymard, B.; Heron, D. A new window on neurocognitive dysfunction in the childhood form of myotonic dystrophy type 1 (DM1). Neuromuscul. Disord. 2011, 21, 468–476. [Google Scholar] [CrossRef]
  9. Douniol, M.; Jacquette, A.; Cohen, D.; Bodeau, N.; Rachidi, L.; Angeard, N.; Cuisset, J.M.; Vallee, L.; Eymard, B.; Plaza, M.; et al. Psychiatric and cognitive phenotype of childhood myotonic dystrophy type 1. Dev. Med. Child Neurol. 2012, 54, 905–911. [Google Scholar] [CrossRef]
  10. Bertrand, J.A.; Jean, S.; Laberge, L.; Gagnon, C.; Mathieu, J.; Gagnon, J.F.; Richer, L. Psychological characteristics of patients with myotonic dystrophy type 1. Acta Neurol. Scand. 2015, 132, 49–58. [Google Scholar] [CrossRef]
  11. Callus, E.; Bertoldo, E.G.; Beretta, M.; Boveri, S.; Cardani, R.; Fossati, B.; Brigonzi, E.; Meola, G. Neuropsychological and Psychological Functioning Aspects in Myotonic Dystrophy Type 1 Patients in Italy. Front. Neurol. 2018, 9, 751. [Google Scholar] [CrossRef] [PubMed]
  12. Rakocevic-Stojanovic, V.; Peric, S.; Madzarevic, R.; Dobricic, V.; Ralic, V.; Ilic, V.; Basta, I.; Nikolic, A.; Stefanova, E. Significant impact of behavioral and cognitive impairment on quality of life in patients with myotonic dystrophy type 1. Clin. Neurol. Neurosurg. 2014, 126, 76–81. [Google Scholar] [CrossRef] [PubMed]
  13. Davis, B.M.; McCurrach, M.E.; Taneja, K.L.; Singer, R.H.; Housman, D.E. Expansion of a CUG trinucleotide repeat in the 3′ untranslated region of myotonic dystrophy protein kinase transcripts results in nuclear retention of transcripts. Proc. Natl. Acad. Sci. USA 1997, 94, 7388–7393. [Google Scholar] [CrossRef] [PubMed] [Green Version]
  14. Jiang, H.; Mankodi, A.; Swanson, M.S.; Moxley, R.T.; Thornton, C.A. Myotonic dystrophy type 1 is associated with nuclear foci of mutant RNA, sequestration of muscleblind proteins and deregulated alternative splicing in neurons. Hum. Mol. Genet. 2004, 13, 3079–3088. [Google Scholar] [CrossRef] [PubMed] [Green Version]
  15. Taneja, K.L.; McCurrach, M.; Schalling, M.; Housman, D.; Singer, R.H. Foci of trinucleotide repeat transcripts in nuclei of myotonic dystrophy cells and tissues. J. Cell Biol. 1995, 128, 995–1002. [Google Scholar] [CrossRef] [PubMed] [Green Version]
  16. Braz, S.O.; Acquaire, J.; Gourdon, G.; Gomes-Pereira, M. Of Mice and Men: Advances in the Understanding of Neuromuscular Aspects of Myotonic Dystrophy. Front. Neurol. 2018, 9, 519. [Google Scholar] [CrossRef] [Green Version]
  17. Meola, G.; Cardani, R. Myotonic dystrophies: An update on clinical aspects, genetic, pathology, and molecular pathomechanisms. Biochim. Biophys. Acta 2015, 1852, 594–606. [Google Scholar] [CrossRef] [Green Version]
  18. Moxley, R.T.; Hilbert, J.E.; Meola, G. The myotonic dystrophies. In Rosenerg’s Molecular and Genetic Basis of Neurological and Psychiatric Disease, 6th ed.; Rosenberg, R.N., Pascual, J.M., Eds.; Academic Press: Cambridge, MA, USA, 2020; pp. 491–510. [Google Scholar]
  19. Sicot, G.; Gourdon, G.; Gomes-Pereira, M. Myotonic dystrophy, when simple repeats reveal complex pathogenic entities: New findings and future challenges. Hum. Mol. Genet. 2011, 20, R116–R123. [Google Scholar] [CrossRef] [Green Version]
  20. Sznajder, L.J.; Swanson, M.S. Short Tandem Repeat Expansions and RNA-Mediated Pathogenesis in Myotonic Dystrophy. Int. J. Mol. Sci. 2019, 20, 3365. [Google Scholar] [CrossRef] [Green Version]
  21. Cho, D.H.; Thienes, C.P.; Mahoney, S.E.; Analau, E.; Filippova, G.N.; Tapscott, S.J. Antisense transcription and heterochromatin at the DM1 CTG repeats are constrained by CTCF. Mol. Cell 2005, 20, 483–489. [Google Scholar] [CrossRef]
  22. Nguyen, L.; Cleary, J.D.; Ranum, L.P.W. Repeat-Associated Non-ATG Translation: Molecular Mechanisms and Contribution to Neurological Disease. Annu. Rev. Neurosci. 2019, 42, 227–247. [Google Scholar] [CrossRef] [PubMed]
  23. Zu, T.; Gibbens, B.; Doty, N.S.; Gomes-Pereira, M.; Huguet, A.; Stone, M.D.; Margolis, J.; Peterson, M.; Markowski, T.W.; Ingram, M.A.; et al. Non-ATG-initiated translation directed by microsatellite expansions. Proc. Natl. Acad. Sci. USA 2011, 108, 260–265. [Google Scholar] [CrossRef] [PubMed] [Green Version]
  24. Miller, J.W.; Urbinati, C.R.; Teng-Umnuay, P.; Stenberg, M.G.; Byrne, B.J.; Thornton, C.A.; Swanson, M.S. Recruitment of human muscleblind proteins to (CUG)(n) expansions associated with myotonic dystrophy. EMBO J. 2000, 19, 4439–4448. [Google Scholar] [CrossRef] [PubMed] [Green Version]
  25. Timchenko, N.A.; Cai, Z.J.; Welm, A.L.; Reddy, S.; Ashizawa, T.; Timchenko, L.T. RNA CUG repeats sequester CUGBP1 and alter protein levels and activity of CUGBP1. J. Biol. Chem. 2001, 276, 7820–7826. [Google Scholar] [CrossRef] [Green Version]
  26. Hernandez-Hernandez, O.; Guiraud-Dogan, C.; Sicot, G.; Huguet, A.; Luilier, S.; Steidl, E.; Saenger, S.; Marciniak, E.; Obriot, H.; Chevarin, C.; et al. Myotonic dystrophy CTG expansion affects synaptic vesicle proteins, neurotransmission and mouse behaviour. Brain 2013, 136 (Pt 3), 957–970. [Google Scholar] [CrossRef] [Green Version]
  27. Suenaga, K.; Lee, K.Y.; Nakamori, M.; Tatsumi, Y.; Takahashi, M.P.; Fujimura, H.; Jinnai, K.; Yoshikawa, H.; Du, H.; Ares, M., Jr.; et al. Muscleblind-like 1 knockout mice reveal novel splicing defects in the myotonic dystrophy brain. PLoS ONE 2012, 7, e33218. [Google Scholar] [CrossRef]
  28. Allen, N.J.; Lyons, D.A. Glia as architects of central nervous system formation and function. Science 2018, 362, 181–185. [Google Scholar] [CrossRef] [Green Version]
  29. Oude Ophuis, R.J.; Mulders, S.A.; van Herpen, R.E.; van de Vorstenbosch, R.; Wieringa, B.; Wansink, D.G. DMPK protein isoforms are differentially expressed in myogenic and neural cell lineages. Muscle Nerve 2009, 40, 545–555. [Google Scholar] [CrossRef]
  30. Sicot, G.; Servais, L.; Dinca, D.M.; Leroy, A.; Prigogine, C.; Medja, F.; Braz, S.O.; Huguet-Lachon, A.; Chhuon, C.; Nicole, A.; et al. Downregulation of the Glial GLT1 Glutamate Transporter and Purkinje Cell Dysfunction in a Mouse Model of Myotonic Dystrophy. Cell Rep. 2017, 19, 2718–2729. [Google Scholar] [CrossRef] [Green Version]
  31. Limb, G.A.; Salt, T.E.; Munro, P.M.; Moss, S.E.; Khaw, P.T. In vitro characterization of a spontaneously immortalized human Muller cell line (MIO-M1). Investig. Ophthalmol. Vis. Sci. 2002, 43, 864–869. [Google Scholar]
  32. Ho, T.H.; Savkur, R.S.; Poulos, M.G.; Mancini, M.A.; Swanson, M.S.; Cooper, T.A. Colocalization of muscleblind with RNA foci is separable from mis-regulation of alternative splicing in myotonic dystrophy. J. Cell Sci. 2005, 118 (Pt 13), 2923–2933. [Google Scholar] [CrossRef] [Green Version]
  33. Murillo-Melo, N.M.; Marquez-Quiroz, L.C.; Gomez, R.; Orozco, L.; Mendoza-Caamal, E.; Tapia-Guerrero, Y.S.; Camacho-Mejorado, R.; Cortes, H.; Lopez-Reyes, A.; Santana, C.; et al. Origin of the myotonic dystrophy type 1 mutation in Mexican population and influence of Amerindian ancestry on CTG repeat allelic distribution. Neuromuscul. Disord. 2017, 27, 1106–1114. [Google Scholar] [CrossRef] [PubMed]
  34. Tome, S.; Nicole, A.; Gomes-Pereira, M.; Gourdon, G. Non-radioactive detection of trinucleotide repeat size variability. PLoS Curr. 2014, 6. [Google Scholar] [CrossRef] [PubMed]
  35. Irizarry, R.A.; Bolstad, B.M.; Collin, F.; Cope, L.M.; Hobbs, B.; Speed, T.P. Summaries of Affymetrix GeneChip probe level data. Nucleic Acids Res. 2003, 31, e15. [Google Scholar] [CrossRef] [PubMed]
  36. Bolstad, B.M.; Irizarry, R.A.; Astrand, M.; Speed, T.P. A comparison of normalization methods for high density oligonucleotide array data based on variance and bias. Bioinformatics 2003, 19, 185–193. [Google Scholar] [CrossRef] [Green Version]
  37. Ritchie, M.E.; Phipson, B.; Wu, D.; Hu, Y.; Law, C.W.; Shi, W.; Smyth, G.K. Limma powers differential expression analyses for RNA-sequencing and microarray studies. Nucleic Acids Res. 2015, 43, e47. [Google Scholar] [CrossRef]
  38. Smyth, G.K. Linear models and empirical bayes methods for assessing differential expression in microarray experiments. Stat. Appl. Genet. Mol. Biol. 2004, 3, Article3. [Google Scholar] [CrossRef]
  39. Subramanian, A.; Tamayo, P.; Mootha, V.K.; Mukherjee, S.; Ebert, B.L.; Gillette, M.A.; Paulovich, A.; Pomeroy, S.L.; Golub, T.R.; Lander, E.S.; et al. Gene set enrichment analysis: A knowledge-based approach for interpreting genome-wide expression profiles. Proc. Natl. Acad. Sci. USA 2005, 102, 15545–15550. [Google Scholar] [CrossRef] [Green Version]
  40. Tokar, T.; Pastrello, C.; Rossos, A.E.M.; Abovsky, M.; Hauschild, A.C.; Tsay, M.; Lu, R.; Jurisica, I. mirDIP 4.1-integrative database of human microRNA target predictions. Nucleic Acids Res. 2018, 46, D360–D370. [Google Scholar] [CrossRef]
  41. Chen, Y.; Wang, X. miRDB: An online database for prediction of functional microRNA targets. Nucleic Acids Res. 2020, 48, D127–D131. [Google Scholar] [CrossRef] [Green Version]
  42. Ge, S.X.; Jung, D.; Yao, R. ShinyGO: A graphical gene-set enrichment tool for animals and plants. Bioinformatics 2020, 36, 2628–2629. [Google Scholar] [CrossRef]
  43. Charizanis, K.; Lee, K.Y.; Batra, R.; Goodwin, M.; Zhang, C.; Yuan, Y.; Shiue, L.; Cline, M.; Scotti, M.M.; Xia, G.; et al. Muscleblind-like 2-mediated alternative splicing in the developing brain and dysregulation in myotonic dystrophy. Neuron 2012, 75, 437–450. [Google Scholar] [CrossRef] [PubMed] [Green Version]
  44. Hernandez-Hernandez, O.; Sicot, G.; Dinca, D.M.; Huguet, A.; Nicole, A.; Buee, L.; Munnich, A.; Sergeant, N.; Gourdon, G.; Gomes-Pereira, M. Synaptic protein dysregulation in myotonic dystrophy type 1, Disease neuropathogenesis beyond missplicing. Rare Dis. 2013, 1, e25553. [Google Scholar] [CrossRef] [PubMed] [Green Version]
  45. Wang, P.Y.; Lin, Y.M.; Wang, L.H.; Kuo, T.Y.; Cheng, S.J.; Wang, G.S. Reduced cytoplasmic MBNL1 is an early event in a brain-specific mouse model of myotonic dystrophy. Hum. Mol. Genet. 2017, 26, 2247–2257. [Google Scholar] [CrossRef] [PubMed] [Green Version]
  46. Weber, A.; Wasiliew, P.; Kracht, M. Interleukin-1 (IL-1) pathway. Sci. Signal. 2010, 3, cm1. [Google Scholar] [CrossRef]
  47. Yamazaki, K.; Gohda, J.; Kanayama, A.; Miyamoto, Y.; Sakurai, H.; Yamamoto, M.; Akira, S.; Hayashi, H.; Su, B.; Inoue, J. Two mechanistically and temporally distinct NF-kappaB activation pathways in IL-1 signaling. Sci. Signal. 2009, 2, ra66. [Google Scholar] [CrossRef] [PubMed]
  48. Garcia-Lopez, A.L.; Hernandez-Castillo, J.; Hernandez-Kelly, L.C.; Olivares-Banuelos, T.N.; Ortega, A. Fluoride Exposure Affects Glutamine Uptake in Muller Glia Cells. Neurotox Res. 2020, 38, 765–774. [Google Scholar] [CrossRef]
  49. Lawrence, J.M.; Singhal, S.; Bhatia, B.; Keegan, D.J.; Reh, T.A.; Luthert, P.J.; Khaw, P.T.; Limb, G.A. MIO-M1 cells and similar muller glial cell lines derived from adult human retina exhibit neural stem cell characteristics. Stem Cells 2007, 25, 2033–2043. [Google Scholar] [CrossRef]
  50. Wang, E.T.; Treacy, D.; Eichinger, K.; Struck, A.; Estabrook, J.; Olafson, H.; Wang, T.T.; Bhatt, K.; Westbrook, T.; Sedehizadeh, S.; et al. Transcriptome alterations in myotonic dystrophy skeletal muscle and heart. Hum. Mol. Genet. 2019, 28, 1312–1321. [Google Scholar] [CrossRef]
  51. Wang, E.T.; Ward, A.J.; Cherone, J.M.; Giudice, J.; Wang, T.T.; Treacy, D.J.; Lambert, N.J.; Freese, P.; Saxena, T.; Cooper, T.A.; et al. Antagonistic regulation of mRNA expression and splicing by CELF and MBNL proteins. Genome Res. 2015, 25, 858–871. [Google Scholar] [CrossRef] [Green Version]
  52. Lopez Castel, A.; Overby, S.J.; Artero, R. MicroRNA-Based Therapeutic Perspectives in Myotonic Dystrophy. Int. J. Mol. Sci. 2019, 20, 5600. [Google Scholar] [CrossRef] [PubMed]
  53. Rhodes, J.D.; Lott, M.C.; Russell, S.L.; Moulton, V.; Sanderson, J.; Wormstone, I.M.; Broadway, D.C. Activation of the innate immune response and interferon signalling in myotonic dystrophy type 1 and type 2 cataracts. Hum. Mol. Genet. 2012, 21, 852–862. [Google Scholar] [CrossRef] [PubMed] [Green Version]
  54. Rizzo, M.; Beffy, P.; Del Carratore, R.; Falleni, A.; Pretini, V.; D’Aurizio, R.; Botta, A.; Evangelista, M.; Stoccoro, A.; Coppede, F.; et al. Activation of the interferon type I response rather than autophagy contributes to myogenesis inhibition in congenital DM1 myoblasts. Cell Death Dis. 2018, 9, 1071. [Google Scholar] [CrossRef] [PubMed]
  55. Todd, P.K.; Ackall, F.Y.; Hur, J.; Sharma, K.; Paulson, H.L.; Dowling, J.J. Transcriptional changes and developmental abnormalities in a zebrafish model of myotonic dystrophy type 1. Dis. Models Mech. 2014, 7, 143–155. [Google Scholar] [CrossRef] [Green Version]
  56. Fernandez-Real, J.M.; Molina, A.; Broch, M.; Ricart, W.; Gutierrez, C.; Casamitjana, R.; Vendrell, J.; Soler, J.; Gomez-Saez, J.M. Tumor necrosis factor system activity is associated with insulin resistance and dyslipidemia in myotonic dystrophy. Diabetes 1999, 48, 1108–1112. [Google Scholar] [CrossRef] [PubMed] [Green Version]
  57. Johansson, A.; Carlstrom, K.; Ahren, B.; Cederquist, K.; Krylborg, E.; Forsberg, H.; Olsson, T. Abnormal cytokine and adrenocortical hormone regulation in myotonic dystrophy. J. Clin. Endocrinol. Metab. 2000, 85, 3169–3176. [Google Scholar] [CrossRef]
  58. Mammarella, A.; Ferroni, P.; Paradiso, M.; Martini, F.; Paoletti, V.; Morino, S.; Antonini, G.; Gazzaniga, P.P.; Musca, A.; Basili, S. Tumor necrosis factor-alpha and myocardial function in patients with myotonic dystrophy type 1. J. Neurol. Sci. 2002, 201, 59–64. [Google Scholar] [CrossRef]
  59. Hohlfeld, R.; Kerschensteiner, M.; Meinl, E. Dual role of inflammation in CNS disease. Neurology 2007, 68 (Suppl. 3), S58–S63, discussion S91–S56. [Google Scholar] [CrossRef]
  60. Blank, T.; Detje, C.N.; Spiess, A.; Hagemeyer, N.; Brendecke, S.M.; Wolfart, J.; Staszewski, O.; Zoller, T.; Papageorgiou, I.; Schneider, J.; et al. Brain Endothelial- and Epithelial-Specific Interferon Receptor Chain 1 Drives Virus-Induced Sickness Behavior and Cognitive Impairment. Immunity 2016, 44, 901–912. [Google Scholar] [CrossRef] [Green Version]
  61. Marciniak, E.; Faivre, E.; Dutar, P.; Alves Pires, C.; Demeyer, D.; Caillierez, R.; Laloux, C.; Buee, L.; Blum, D.; Humez, S. The Chemokine MIP-1alpha/CCL3 impairs mouse hippocampal synaptic transmission, plasticity and memory. Sci. Rep. 2015, 5, 15862. [Google Scholar] [CrossRef] [Green Version]
  62. Callewaere, C.; Banisadr, G.; Rostene, W.; Parsadaniantz, S.M. Chemokines and chemokine receptors in the brain: Implication in neuroendocrine regulation. J. Mol. Endocrinol. 2007, 38, 355–363. [Google Scholar] [CrossRef] [PubMed]
  63. Brown, A.S.; Hooton, J.; Schaefer, C.A.; Zhang, H.; Petkova, E.; Babulas, V.; Perrin, M.; Gorman, J.M.; Susser, E.S. Elevated maternal interleukin-8 levels and risk of schizophrenia in adult offspring. Am. J. Psychiatry 2004, 161, 889–895. [Google Scholar] [CrossRef] [PubMed]
  64. Leighton, S.P.; Nerurkar, L.; Krishnadas, R.; Johnman, C.; Graham, G.J.; Cavanagh, J. Chemokines in depression in health and in inflammatory illness: A systematic review and meta-analysis. Mol. Psychiatry 2018, 23, 48–58. [Google Scholar] [CrossRef] [PubMed] [Green Version]
  65. Ellman, L.M.; Deicken, R.F.; Vinogradov, S.; Kremen, W.S.; Poole, J.H.; Kern, D.M.; Tsai, W.Y.; Schaefer, C.A.; Brown, A.S. Structural brain alterations in schizophrenia following fetal exposure to the inflammatory cytokine interleukin-8. Schizophr. Res. 2010, 121, 46–54. [Google Scholar] [CrossRef] [PubMed] [Green Version]
  66. Pittaluga, A. CCL5-Glutamate Cross-Talk in Astrocyte-Neuron Communication in Multiple Sclerosis. Front. Immunol. 2017, 8, 1079. [Google Scholar] [CrossRef] [Green Version]
  67. Stuart, M.J.; Singhal, G.; Baune, B.T. Systematic Review of the Neurobiological Relevance of Chemokines to Psychiatric Disorders. Front. Cell Neurosci. 2015, 9, 357. [Google Scholar] [CrossRef]
  68. Barnes, D.A.; Huston, M.; Holmes, R.; Benveniste, E.N.; Yong, V.W.; Scholz, P.; Perez, H.D. Induction of RANTES expression by astrocytes and astrocytoma cell lines. J. Neuroimmunol. 1996, 71, 207–214. [Google Scholar] [CrossRef]
  69. Mennicken, F.; Maki, R.; de Souza, E.B.; Quirion, R. Chemokines and chemokine receptors in the CNS: A possible role in neuroinflammation and patterning. Trends Pharm. Sci. 1999, 20, 73–78. [Google Scholar] [CrossRef]
  70. Reali, C.; Curto, M.; Sogos, V.; Scintu, F.; Pauly, S.; Schwarz, H.; Gremo, F. Expression of CD137 and its ligand in human neurons, astrocytes, and microglia: Modulation by FGF-2. J. NeuroSci. Res. 2003, 74, 67–73. [Google Scholar] [CrossRef]
  71. Yeo, Y.A.; Martinez Gomez, J.M.; Croxford, J.L.; Gasser, S.; Ling, E.A.; Schwarz, H. CD137 ligand activated microglia induces oligodendrocyte apoptosis via reactive oxygen species. J. Neuroinflamm. 2012, 9, 173. [Google Scholar] [CrossRef] [Green Version]
  72. Voet, S.; Mc Guire, C.; Hagemeyer, N.; Martens, A.; Schroeder, A.; Wieghofer, P.; Daems, C.; Staszewski, O.; Vande Walle, L.; Jordao, M.J.C.; et al. A20 critically controls microglia activation and inhibits inflammasome-dependent neuroinflammation. Nat. Commun. 2018, 9, 2036. [Google Scholar] [CrossRef] [PubMed] [Green Version]
  73. Ramon-Duaso, C.; Gener, T.; Consegal, M.; Fernandez-Aviles, C.; Gallego, J.J.; Castarlenas, L.; Swanson, M.S.; de la Torre, R.; Maldonado, R.; Puig, M.V.; et al. Methylphenidate Attenuates the Cognitive and Mood Alterations Observed in Mbnl2 Knockout Mice and Reduces Microglia Overexpression. Cereb. Cortex 2019, 29, 2978–2997. [Google Scholar] [CrossRef] [PubMed]
  74. Peng, X.; Shen, X.; Chen, X.; Liang, R.; Azares, A.R.; Liu, Y. Celf1 regulates cell cycle and is partially responsible for defective myoblast differentiation in myotonic dystrophy RNA toxicity. Biochim. Biophys. Acta 2015, 1852, 1490–1497. [Google Scholar] [CrossRef] [PubMed] [Green Version]
  75. Kaltschmidt, B.; Widera, D.; Kaltschmidt, C. Signaling via NF-kappaB in the nervous system. Biochim. Biophys. Acta 2005, 1745, 287–299. [Google Scholar] [CrossRef] [PubMed] [Green Version]
  76. Ledoux, A.C.; Perkins, N.D. NF-kappaB and the cell cycle. Biochem. Soc. Trans. 2014, 42, 76–81. [Google Scholar] [CrossRef]
  77. Li, Q.; Verma, I.M. NF-kappaB regulation in the immune system. Nat. Rev. Immunol. 2002, 2, 725–734. [Google Scholar] [CrossRef]
  78. Mattson, M.P. NF-kappaB in the survival and plasticity of neurons. Neurochem. Res. 2005, 30, 883–893. [Google Scholar] [CrossRef]
  79. Sen, R.; Baltimore, D. Inducibility of kappa immunoglobulin enhancer-binding protein Nf-kappa B by a posttranslational mechanism. Cell 1986, 47, 921–928. [Google Scholar] [CrossRef]
  80. Wang, T.; Wang, J. K63-linked polyubiquitination of IRF1, An essential step in the IL-1 signaling cascade. Cell Mol. Immunol. 2014, 11, 407–409. [Google Scholar] [CrossRef] [Green Version]
  81. Newton, R.; Holden, N.S.; Catley, M.C.; Oyelusi, W.; Leigh, R.; Proud, D.; Barnes, P.J. Repression of inflammatory gene expression in human pulmonary epithelial cells by small-molecule IkappaB kinase inhibitors. J. Pharm. Exp. 2007, 321, 734–742. [Google Scholar] [CrossRef]
  82. Sizemore, N.; Lerner, N.; Dombrowski, N.; Sakurai, H.; Stark, G.R. Distinct roles of the Ikappa B kinase alpha and beta subunits in liberating nuclear factor kappa B (NF-kappa B) from Ikappa B and in phosphorylating the p65 subunit of NF-kappa B. J. Biol. Chem. 2002, 277, 3863–3869. [Google Scholar] [CrossRef] [PubMed] [Green Version]
  83. Koehorst, E.; Ballester-Lopez, A.; Arechavala-Gomeza, V.; Martinez-Pineiro, A.; Nogales-Gadea, G. The Biomarker Potential of miRNAs in Myotonic Dystrophy Type, I. J. Clin. Med. 2020, 9, 3939. [Google Scholar] [CrossRef] [PubMed]
  84. Shao, D.; Zhu, X.; Sun, W.; Huo, L.; Chen, W.; Wang, H.; Liu, B.; Pan, P. Investigation of the Mol.ecular mechanisms underlying myotonic dystrophy types 1 and 2 cataracts using microRNAtarget gene networks. Mol. Med. Rep. 2017, 16, 3737–3744. [Google Scholar] [CrossRef] [PubMed] [Green Version]
  85. Shen, X.; Xu, F.; Li, M.; Wu, S.; Zhang, J.; Wang, A.; Xu, L.; Liu, Y.; Zhu, G. miR-322/-503 rescues myoblast defects in myotonic dystrophy type 1 cell model by targeting CUG repeats. Cell Death Dis. 2020, 11, 891. [Google Scholar] [CrossRef] [PubMed]
  86. Cappella, M.; Perfetti, A.; Cardinali, B.; Garcia-Manteiga, J.M.; Carrara, M.; Provenzano, C.; Fuschi, P.; Cardani, R.; Renna, L.V.; Meola, G.; et al. High-throughput analysis of the RNA-induced silencing complex in myotonic dystrophy type 1 patients identifies the dysregulation of miR-29c and its target ASB2. Cell Death Dis. 2018, 9, 729. [Google Scholar] [CrossRef] [PubMed]
  87. Decembrini, S.; Bressan, D.; Vignali, R.; Pitto, L.; Mariotti, S.; Rainaldi, G.; Wang, X.; Evangelista, M.; Barsacchi, G.; Cremisi, F. MicroRNAs couple cell fate and developmental timing in retina. Proc. Natl. Acad. Sci. USA 2009, 106, 21179–21184. [Google Scholar] [CrossRef] [Green Version]
  88. Kapsimali, M.; Kloosterman, W.P.; de Bruijn, E.; Rosa, F.; Plasterk, R.H.; Wilson, S.W. MicroRNAs show a wide diversity of expression profiles in the developing and mature central nervous system. Genome Biol. 2007, 8, R173. [Google Scholar] [CrossRef] [Green Version]
  89. Zheng, P.; Bin, H.; Chen, W. Inhibition of microRNA-103a inhibits the activation of astrocytes in hippocampus tissues and improves the pathological injury of neurons of epilepsy rats by regulating BDNF. Cancer Cell Int. 2019, 19, 109. [Google Scholar] [CrossRef]
  90. Kondo, M.; Yamada, H.; Munetsuna, E.; Yamazaki, M.; Hatta, T.; Iwahara, A.; Ohashi, K.; Ishikawa, H.; Tsuboi, Y.; Inoue, T.; et al. Associations of serum microRNA-20a, -27a, and -103a with cognitive function in a Japanese population: The Yakumo study. Arch. Gerontol. Geriatr. 2019, 82, 155–160. [Google Scholar] [CrossRef]
  91. Boissonneault, V.; Plante, I.; Rivest, S.; Provost, P. MicroRNA-298 and microRNA-328 regulate expression of mouse beta-amyloid precursor protein-converting enzyme 1. J. Biol. Chem. 2009, 284, 1971–1981. [Google Scholar] [CrossRef] [Green Version]
  92. Lukiw, W.J. Micro-RNA speciation in fetal, adult and Alzheimer’s disease hippocampus. Neuroreport 2007, 18, 297–300. [Google Scholar] [CrossRef] [PubMed]
  93. Marti, E.; Pantano, L.; Banez-Coronel, M.; Llorens, F.; Minones-Moyano, E.; Porta, S.; Sumoy, L.; Ferrer, I.; Estivill, X. A myriad of miRNA variants in control and Huntington’s disease brain regions detected by massively parallel sequencing. Nucleic Acids Res. 2010, 38, 7219–7235. [Google Scholar] [CrossRef] [PubMed]
  94. Packer, A.N.; Xing, Y.; Harper, S.Q.; Jones, L.; Davidson, B.L. The bifunctional microRNA miR-9/miR-9* regulates REST and CoREST and is downregulated in Huntington’s disease. J. Neurosci. 2008, 28, 14341–14346. [Google Scholar] [CrossRef] [PubMed] [Green Version]
  95. Zhang, C. Natural compounds that modulate BACE1-processing of amyloid-beta precursor protein in Alzheimer’s disease. Discov. Med. 2012, 14, 189–197. [Google Scholar] [PubMed]
  96. Ding, J.; Xu, Z.; Zhang, Y.; Tan, C.; Hu, W.; Wang, M.; Xu, Y.; Tang, J. Exosome-mediated miR-222 transferring: An insight into NF-kappaB-mediated breast cancer metastasis. Exp. Cell Res. 2018, 369, 129–138. [Google Scholar] [CrossRef]
  97. Galardi, S.; Mercatelli, N.; Farace, M.G.; Ciafre, S.A. NF-kB and c-Jun induce the expression of the oncogenic miR-221 and miR-222 in prostate carcinoma and glioblastoma cells. Nucleic Acids Res. 2011, 39, 3892–3902. [Google Scholar] [CrossRef] [Green Version]
  98. Li, Q.Q.; Chen, Z.Q.; Cao, X.X.; Xu, J.D.; Xu, J.W.; Chen, Y.Y.; Wang, W.J.; Chen, Q.; Tang, F.; Liu, X.P.; et al. Involvement of NF-kappaB/miR-448 regulatory feedback loop in chemotherapy-induced epithelial-mesenchymal transition of breast cancer cells. Cell Death Differ. 2011, 18, 16–25. [Google Scholar] [CrossRef] [Green Version]
  99. Ying, S.Y.; Chang, D.C.; Miller, J.D.; Lin, S.L. MicroRNA protocols. Perspectives. Methods Mol. Biol. 2006, 342, 351–358. [Google Scholar]
  100. Pasquinelli, A.E. MicroRNAs and their targets: Recognition, regulation and an emerging reciprocal relationship. Nat. Rev. Genet. 2012, 13, 271–282. [Google Scholar] [CrossRef]
Figure 1. Inducible expression of mutant DMPK minigene elicits nuclear foci in MIO-M1-CTG(648) cells. (A) Expression of exogenous DMPK minigene was analyzed by RT-PCR in MIO-M1-CTG(0) and MIO-M1-CTG(648) cells, before (-) and after (+) Dox (1 µg/mL) induction, using GAPDH as endogenous control. WT: RT-PCR using cDNA from MIO-M1 wild type cells, -RT: RT-PCR using cDNA prepared in absence of retro-transcriptase enzyme. (B) Quantification of DMPK expression indicates comparable levels of transgene between MIO-M1-CTG(0) and MIO-M1-CTG(648) cells after (+) Dox induction. Values are the mean ± SEM of three independent experiments, with significant differences determined by unpaired t-test, **** denotes p < 0.0001, ** denotes p < 0.005. (C) In situ hybridization of CUG repeats using a (CAG)6 Cy3 probe were carried out in MIO-M1-CTG(0) and MIO-M1-CTG(648) cells in absence (-Dox) and presence (+Dox) of doxycycline. Cells were counterstained with DAPI for nuclei visualization prior to being analyzed by confocal microscopy. Representative single typical optical Z-sections were selected to show the presence nuclear foci. (D) 15X magnification of representative MIO-M1-CTG(648) cells cultured under Dox induction (left), and quantitation of foci-positive cells (right). Data in the graph are the mean ± SEM of triplicate experiments (n = 200 cells), **** denotes p < 0.0001.
Biomolecules 11 00159 g001
Figure 2. Alternative splicing of exon 7 in MBNL1 and MBNL2 mRNAs is dysregulated in MIO-M1-CTG(648) cells. (A) The inclusion rate of MBNL1 and MBNL2 exon 7 was assessed by RT-PCR in MIO-M1-CTG(0) cells and MIO-M1-CTG(648) cells, before (-) and after (+) Dox (1 µg/mL) induction for 3 days. Data shown are means ± SEM of three independent experiments, with p values indicating significance differences (unpaired t-test), ** represents p < 0.005, *** denotes p < 0.0005. (B) MBNL2 exon 7 inclusion increased progressively after Dox induction for the indicated number of days in MIO-M1-CTG(648) cells. GAPDH expression was used as endogenous control (C) RNA FISH [CAG)6- Cy3] and immunofluorescence (MBNL2) showed colocalization of mutant RNA with MBNL2 exclusively in MIO-M1 CTG(648) upon Dox induction (+Dox). Cells were counterstained with DAPI for nuclei visualization prior to being analyzed by confocal microscopy. 4.5X magnification (ZOOM) is showed for each condition. Representative single typical optical Z-sections were selected to show the presence nuclear foci.
Biomolecules 11 00159 g002
Figure 3. Transcriptome changes in MIO-M1-CTG(648) cells expressing DM1 mutation. (A) Contrast A gene set was obtained by the comparison of profiles between MIO-M1-CTG(648) Dox-treated (+Dox) cells vs MIO-M1-CTG(648) non-induced (-Dox) cells. Gene changes caused by Dox treatment were first identified contrasting MIO-M1-CTG(0) Dox-induced cells vs MIO-M1-CTG(0) non-induced cell profiles, and then were discharged from this data set (B) Heat map representation (left) of the 187 up-regulated (red) and 129 down-regulated (green) genes from a total of 316 differentially expressed genes between MIO-M1 CTG(648) cells with and without Dox-induction (contrast A). Pie chart (right) illustrates the percentage of coding and non-coding genes determined by this comparison. (C) Contrast B gene set was obtained by the comparison of profiles between MIO-M1-CTG(648) Dox-treated cells vs MIO-M1-CTG(0) Dox-induced cells (+Dox). Gene changes derived from gene insertion site were first identified contrasting gene profiles of MIO-M1-CTG(648) vs MIO-M1-CTG(0) both non-induced (-Dox) cells, and subsequently discharged from this data set. (D) Heat map (left) illustrating the 449 up-regulated (red) and 342 down-regulated (green) genes from a total of 790 gene changes between Dox-induced MIO-M1-CTG(648) cells and Dox-induced MIO-M1-CTG(0) cells (contrast B). Pie chart (right) showing the % of coding and non-coding genes revealed by this contrast. (E) Venn diagram showing overlapping (111) and non-overlapping (884) gene changes between contrast A and B.
Biomolecules 11 00159 g003
Figure 4. GSEA revealed inflammation altered processes associated with DM1 mutation in MIO-M1 cells. Enrichment plots of the four highly significant hallmark gene-sets are showed. Leading edge subset denote the more biologically important genes, which are showed in the corresponding heat map for Dox-induced MIO-M1 CTG(648) cells (+Dox) and non-induced MIO-M1 CTG(648) cells (−Dox) as control. Red: up-regulated, blue: down-regulated. Normalized enrichment score (NES) and false discovery rate (FDR) are indicated.
Biomolecules 11 00159 g004
Figure 5. Functional enrichment analysis by MetaCore showed involvement of immune system pathways in MIO-M1-CTG(648) cells (A). Top 10 enriched Pathway Maps sorted by statistical significance -log (p value) of the findings. (B) Up-regulation of CCL5 and CXCL8 (IL-8) were validated by TaqMan assays in Dox-induced MIO-M1-CTG(648) cells. Data shown are means ± SEM from three independent experiments. Unpaired t-test was used to determine statistical significance. ** denotes p > 0.005 (C) Network analysis of dysregulated genes shows connection with NFκB transcription factor. CCL5, CXCL8 (IL-8), TNFRSF9, and TNFAIP3 (A20), indicated in green boxes, are positively NFκB-regulated targets. miR-448 and miR-222, showed in blue rectangles, are negatively (red line) and positively (green line) NFκB-regulated targets, respectively.
Biomolecules 11 00159 g005
Figure 6. Enriched biological processes for the indicated dysregulated miRNA targets in MIO-M1-CTG(648) Dox-induced cells. Hierarchical clustering trees (left), and network diagrams (right) were performed using ShinyGO server. Nodes (circles) on networks, denote enriched processes; lines denote interactions among genes that are common between processes.
Biomolecules 11 00159 g006
Table 1. List of the most up and down (-) differentially expressed genes in contrast A and B.
Contrast AContrast B
Gene SymbolFold Changep ValueGene SymbolFold Changep Value
CXCL104.664.49 × 10−9CXCL109.196.24 × 10−11
TNFRSF94.632.51 × 10−8CCL55.041.86 × 10−7
CXCL83.441.51 × 10−6SCG24.323.26 × 10−8
CCL53.108.12 × 10−6TNFRSF94.126.13 × 10−8
SCG23.107.30 × 10−7ATF33.821.61 × 10−7
PTX32.791.47 × 10−6CXCL113.351.21 × 10−5
MIR42882.781.43 × 10−5RFPL4AL12.931.57 × 10−3
BIRC32.686.22 × 10−6PLA2G4C2.841.59 × 10−7
PLA2G4C2.594.50 × 10−7LINC007072.785.88 × 10−6
HTR7P12.582.53 × 10−6MIR42882.761.53 × 10−5
HHAT−1.566.74 × 10−3LINC00673−2.041.03 × 10−6
SCD−1.669.01 × 10−4PLEKHS1−2.068.13 × 10−6
PLXDC1−1.665.11 × 10−5LRMDA−2.071.47 × 10−5
C3AR1−1.749.89 × 10−5PLXDC1−2.101.14 × 10−6
KIF26B−1.763.89 × 10−4TSPAN18−2.121.36 × 10−5
APLN−1.771.68 × 10−4SV2A−2.255.14 × 10−7
SCG5−1.794.25 × 10−5APLN−2.284.76 × 10−6
DCN−2.023.28 × 10−3COL11A1−2.598.67 × 10−7
PLEKHS1−2.125.69 × 10−6KIF26B−2.741.63 × 10−6
TSPAN18−2.275.60 × 10−8DCN−3.284.51 × 10−5
Table 2. Gene expression by RT-qPCR and microarray of selected genes.
GeneContrast AContrast B
FC RT-qPCRFC MAFC RT-qPCRFC MA
CXCL1025.2 (1.0 × 10⁻⁴)4.66 (4.4 × 10⁻⁹)228.2 (1.0 × 10⁻⁴)9.19 (6.2 × 10⁻¹¹)
TNFRSF911.7 (2.1 × 10⁻³)4.63 (2.5 × 10⁻⁸)10.2 (2.4 × 10⁻³)4.12 (6.1 × 10⁻⁸)
TNFAIP34.1 (1.7 × 10⁻²)2.53 (1.6 × 10⁻⁷)2.2 (4.0 × 10⁻²)1.97 (4.8 × 10⁻⁶)
PLXDC1−5.8 (9.8 × 10⁻³)−1.66 (5.1 × 10⁻⁵)−2.4 (3.3 × 10⁻²)−2.10 (1.1 × 10⁻⁶)
TSPAN18−4.1 (1.0 × 10⁻⁴)−2.27 (5.6 × 10⁻⁶)−2.3 (2.3 × 10⁻²)−2.12 (1.3 × 10⁻⁵)
FC = Fold change; MA = Microarray. Negative values mean down regulation. p values are showed in parenthesis.
Table 3. List of the most enriched ontology processes and pathways in MIO-M1CTG(648) cells.
ResourceCategoryNameGenes
SizeNES
GSEAHTNF-α signaling pathwayTNFRSF9, CXCL11, BRIC3, CCL5, PTX3, TNFAIP3, RELB, ATF3, IFIT2, IRF1, NFKB21312.43
BPChemokine mediated signaling pathwayCCR4, CXCL11, CCL5, CCL24, GPR75, MPL, CXCR3, CCL17, CCR6252.30
CCSpliceosomal complexPRPF39, SNRPB, SNRNP48, XAB2, PTBP2, ARSR2, LUC7L, BUD31, AQR, ZCCHC81371.91
MFChemokine receptor bindingCXCL10, CXCL11, CCL5242.02
TFTGGGNNTTTCC_NFκB_Q6_01CXCL10, TNFRSF9, BIRC3, CCL5, RELB, NFKB2, WNT10A, POUF2F3, CCND2852.09
KPChemokine signaling pathwayCCR4, CXCL10, CXCL11, CCL5, PLCB4, TIAM1HCK, ADCY4, PIK3R5, RAF1, PIK3CD1181.89
%pval
DAVIDBPInflammatory responseCCL5, CXCL10, CCR4, CXCL11, CXCL8, RELB, TNFAIP3, TNFRSF9, C3AR1, IRGM, NFKB2, PTX3, PLA2G4C, SCG212.12.9 × 10−7
CCExtracellular spaceCCL5, CXCL11, CXCL8, TNFRSF9, APLN, CST7, DCN, GHR, ITGAM, IFNA14, IL32, NRG2, PTX3, PLXDC1, SCG2, SERPIND116.01.3 × 10−3
MFRNA Pol II regulatory region sequence-specific RELB, SOX13, ATF3, DLX2, NR1D14.71.9 × 10−2
KPCytokine-cytokine receptor interaction CCL5, CCR4, CXCL10, CXCL11, CXCL8, TNFRSF9, GHR, IFNA14, IL2RG7.57.9 × 10−4
KPA KH
p val
Union
p val
KPMImmune response IL-1 signaling pathway CXCL8, CCL5, CXCL10, MAP3K14, MAPK14, JNK, IRAK1, RELA, IRF1, MAP3K8, NFKB2, CIAP2, IFNB.2.9 × 10−71.1 × 10⁻¹²
PaPMNF-kB pathway in multiple myeloma CIAP2, MAP3K14, IKKA, NFKB2, RELB, CYLD, IKB1.5 × 10−45.0 × 10⁻⁹
PhPMImmune response TNFR2 signaling pathways IKKA, RELA, TRAF1, IKB, NFKB, CIAP2, MAP3K14, IKKA, NFKB2, RELB, MAPK8-10, BCL-XL, C-JUN7.3 × 10−74.7 × 10⁻¹¹
Categories: H = Hallmark, BP = Biological Process, CC = Cellular Component, MF = Molecular Function, TFT = Transcription Factor Targets, KP = KEGG Pathway, KPM = Key Pathway Maps, PaPM = Pathological Pathway Maps, PhPM = Physiological Pathway Maps. NES = Normalized Enrichment Score, KH = Key Hubs.
Table 4. Enriched ontology processes of predicted targets for dysregulated miRNAs in MIO-M1-CTG(648) cells.
miRNAFC Target GenesBiological ProcessFDR
miR-42882.79Up-regulated: SYTL2, NRG2Not determined-
miR-2222.37Up-regulated: ATF3, BAMBI, BIRC3, CXCL11, IFIT2, IL2RG, KIF26B, KLHL1, LRRC49, PPP1R15A, PTX3, SERPIND1, SH3RF2, SNAPC1, SOX13, TUFA, TNFAIP3, TTC9, TUF1Cytokine-mediated signaling pathway
Cytoplasmic pattern recognition receptor signaling pathway
Regulation of molecular function
Negative regulation of catalytic activity
Intracellular signal transduction
1.8 × 10⁻²
1.8 × 10⁻²
1.8 × 10⁻²
1.8 × 10⁻²
1.9 × 10⁻²
Down-regulated: APLN, CD24, COL11A1, GHR, HHAT, PLEKHS1, PLXDC1, PSD3, SCG5, SV2A, SCD
miR-103a12.04Up-regulated: ATF3, CSRNP1, CYHR1, DLX2, DUSP4, HSPA4L, IRF1, MYLK3, PLA2G4C, PTX3, SERPIND1, SH3RF2, SYTL2, TIFA, TMEM45B, TNFAIP3, TTC9, TUFT1Animal organ development
Animal organ morphogenesis
Skeletal system morphogenesis
Skeletal system development
Anatomical structure morphogenesis
Regulation of signal transduction
1.3 × 10⁻³
3.9 × 10⁻³
4.0 × 10⁻³
1.3 × 10⁻²
1.6 × 10⁻²
1.9 × 10⁻²
Down-regulated: APLN, CD24, COL11A1, DCN, EYA1, GHR, HHAT, KIF26B, PLEKHS1, PLXDC1, PSD3, SCD, SV2A, TSPAN18
miR-2981.91 Up-regulated: BAMBI, CCL5, CSRNP1, DUSP4, HSPA4L, KLHL1, MYLK3, NR1D1, PLCB4, SCG2, SNAPC1, SOX13, SYTL5, TNFAIP3, TUFT1Anatomical structure morphogenesis
Negative regulation of signal transduction
Regulation of cell communication
Regulation of signaling
Regulation of chronic inflammatory response
2.8 × 10⁻³
2.8 × 10⁻³
2.8 × 10⁻³
2.8 × 10⁻³
2.8 × 10⁻³
Down-regulated: APLN, CD24, DCN, GHR, PLXDC1, PSD3, SCD, SCG5, TSPAN18
miR-43101.48Up-regulated: ATF3, BIRC3, IFIT2, IRF1, ITGAM, KCTD16, PTX3, SNAPC1, SYTL5, TNFAIP3, TTC9Toll-like receptor signaling pathway
Cytokine-mediated signaling pathway
Activation of innate immune response
Cellular response to cytokine stimulus
2.7 × 10⁻³
4.9 × 10⁻³
5.5 × 10⁻³
8.4 × 10⁻³
Down-regulated: APLN, CD24, PLEKHS1, PLXDC1, PSD3, SCD, SV2A
miR-448−1.43Up-regulated: CXCL8, DHRS2, HSPA4L, IFIT2, IRF1 TNFRSF9, KCTD16, LRRC49, MYLK3, NRG2, PLCB4, SGIP1, SH3RF2, SNAPC1, SOX13, TNFAIP3, TTC9, TUFT1, ZNF620Cellular response to cytokine stimulus
Response to cytokine
Cytokine-mediate signaling pathway
Defense response to virus
2.0 × 10⁻²
2.0 × 10⁻²
2.0 × 10⁻²
2.8 × 10⁻²
Down-regulated: EYA1, GHR, PSD, SCD3, SCG5
FC = Fold change. Negative value (-) mean down regulation.
Publisher’s Note: MDPI stays neutral with regard to jurisdictional claims in published maps and institutional affiliations.

