Article

Immunoprofiles and DNA Methylation of Inflammatory Marker Genes in Ulcerative Colitis-Associated Colorectal Tumorigenesis

by
Satu Mäki-Nevala
1,*,
Sanjeevi Ukwattage
1,
Erkki-Ville Wirta
2,
Maarit Ahtiainen
3,
Ari Ristimäki
4,5,
Toni T. Seppälä
5,6,
Anna Lepistö
5,6,
Jukka-Pekka Mecklin
3,7 and
Päivi Peltomäki
1
1
Department of Medical and Clinical Genetics, University of Helsinki, FI-00014 Helsinki, Finland
2
Department of Gastroenterology and Alimentary Tract Surgery, Tampere University Hospital, FI-33521 Tampere, Finland
3
Department of Education and Research, Hospital Nova of Central Finland, FI-40620 Jyväskylä, Finland
4
Department of Pathology, HUSLAB, HUS Diagnostic Center, University of Helsinki and Helsinki University Hospital, FI-00029 Helsinki, Finland
5
Applied Tumor Genomics Research Program, Research Programs Unit, University of Helsinki, FI-00014 Helsinki, Finland
6
Department of Gastrointestinal Surgery, Helsinki University Hospital, FI-00029 Helsinki, Finland
7
Department of Sport and Health Sciences, University of Jyväskylä, FI-40014 Jyväskylä, Finland
*
Author to whom correspondence should be addressed.
Biomolecules 2021, 11(10), 1440; https://doi.org/10.3390/biom11101440
Submission received: 19 August 2021 / Revised: 23 September 2021 / Accepted: 27 September 2021 / Published: 30 September 2021
(This article belongs to the Special Issue Advances in Epigenetic Regulation in Cancer)

Abstract

:
Immunological and epigenetic changes are interconnected and contribute to tumorigenesis. We determined the immunoprofiles and promoter methylation of inflammation-related genes for colitis-associated colorectal carcinomas (CA-CRC). The results were compared with Lynch syndrome (LS)-associated colorectal tumors, which are characterized by an active immune environment through inherited mismatch repair defects. CA-CRCs (n = 31) were immunohistochemically evaluated for immune cell scores (ICSs) and PDCD1 and CD274 expression. Seven inflammation-associated genes (CD274, NTSR1, PPARG, PTGS2, PYCARD, SOCS1, and SOCS2), the repair gene MGMT, and eight standard marker genes for the CpG Island Methylator Phenotype (CIMP) were investigated for promoter methylation in CA-CRCs, LS tumors (n = 29), and paired normal mucosae by multiplex ligation-dependent probe amplification. All but one CA-CRCs were microsatellite-stable and all LS tumors were microsatellite-unstable. Most CA-CRCs had a high ICS (55%) and a positive CD274 expression in immune cells (52%). NTSR1 revealed frequent tumor-specific hypermethylation in CA-CRC and LS. When compared to LS mucosae, normal mucosae from patients with CA-CRC showed significantly higher methylation of NTSR1 and most CIMP markers. In conclusion, CA-CRCs share a frequent ICShigh/CD274pos expression pattern with LS tumors. Elevated methylation in normal mucosa may indicate field cancerization as a feature of CA-CRC-associated tumorigenesis.

1. Introduction

Ulcerative colitis (UC) together with Crohn’s disease comprise inflammatory bowel disease (IBD), which is a recognized risk factor for colorectal cancer (CRC) [1]. The development of UC-associated CRC (CA-CRC) is a multifactorial and complex process involving persistent inflammation, alterations in the intestinal microbiome, imbalance of the immune system, and genetic and epigenetic changes [2,3]. Reactive oxygen species and nitrogen intermediates produced by active inflammatory cells promote mutations and genetic instability [4], and cytokine production may promote epigenetic changes contributing to tumorigenesis through DNA repair gene inactivation and other mechanisms [4]. CRC risk in patients with UC is approximately two-fold compared with the average population [3]. Moreover, CA-CRC patients tend to be younger and have multiple tumors, and mucinous and poorly differentiated carcinomas are common [3]. Consistent with the aggressive histopathological characteristics, Watanabe et al. found CA-CRC to be associated with a worse prognosis compared with sporadic colorectal cancer, which might in part reflect diagnosis at late stages [5].
Aggressive histological features, i.e., mucinous and poorly differentiated tumors, also characterize Lynch syndrome (LS)-associated CRC [6], where the cumulative risk of CRC depends on the predisposing mutation: carriers of MLH1 or MSH2 germline mutations have over 10-fold relative risks compared to the general population [7]. LS is the most common hereditary condition predisposing to CRC and is caused by pathogenic germline variants in DNA mismatch repair (MMR) genes MLH1, MSH2, MSH6, and PMS2 [8] or, more rarely, deletions in the 3′ end of the EPCAM gene, leading to hypermethylation of the MSH2 gene promoter [9]. These heterozygous germline defects decrease the levels of functional MMR proteins, compromising their critical cancer avoidance functions and resulting in hypermutated and microsatellite-unstable tumors [10,11]. LS-CRC patients have better survival compared to sporadic CRC [7,12] and tumors are less likely to metastasize, possibly due to an active immune environment of the tumors [6]. A high rate of de novo somatic mutations leads to high levels of neoantigens, causing abundant tumor-infiltrating lymphocytes, which are counterbalanced by the increased expression of immune checkpoint molecules, such as PDCD1 and CD274 [13].
Immunoscore is a method for describing immune responses and is based on CD3+ and CD8+ lymphocyte infiltrations in the tumor center and invasive margin. It has proven to be a strong independent prognostic marker in stage I–III colon cancer [14]. Immune cell score (ICS) was developed following those same principles and produced similar results. High ICS was generally associated with a favorable outcome and differentiated patients with a poor vs. improved prognosis across tumor stages, regardless of MMR status [15,16]. As expected, most MMR-deficient CRCs, whether sporadic or LS, were characterized by high ICS, a profuse amount of PDCD1-positive lymphocytes, and a high expression rate of CD274-positive immune cells [15]. Available information of immune cell infiltration in CA-CRC is limited, and the findings are in part conflicting [17,18,19].
As these observations imply, inflammation has an important role in cancer; however, epigenetic regulation of inflammation-associated genes and its impact on UC- and LS-associated CRC tumorigenesis are not completely understood. Promoter methylation of inflammation-associated genes, such as CD274, may be a prognostic factor in sporadic CRC [20]. DNA methylation alterations of inflammation-associated genes could provide a specific mechanism for the widespread inflammatory/immunological alterations that accompany tumorigenesis, especially in association with the CpG island methylator phenotype (CIMP) or microsatellite instability (MSI). In this study, we aimed to evaluate the immunological landscape of CA-CRCs through ICS and altered methylation of inflammation-associated genes, using LS tumors for comparison (Figure 1).

2. Materials and Methods

2.1. Material

Study material included FFPE specimens of (paired) normal and tumorous colonic mucosa from patients with CA-CRC (normal mucosae, n = 17 and carcinomas, n = 31) and LS (normal mucosae, n = 11, adenomas, n = 14, and carcinomas, n = 15). Details are presented in Table 1. Sampling was done before any cytostatic cancer treatments, either at the time of the diagnosis or the surgery. All LS adenomas had high-grade dysplasia and their molecular profiles (including MSI, CIMP, and somatic mutational status) were comparable to LS-CRCs, as detailed previously [21]. Therefore, LS adenomas and carcinomas were combined, and the respective results in this study are given for this joint group referred to as “LS tumors”. All LS patients were verified mutation carriers represented in the nationwide Lynch syndrome Registry of Finland. DNA was extracted using the modified extraction protocol of the phenyl–chloroform method [22]. CA-CRC tissue samples were punched and DNA was extracted from these punches (3 × 1 mm), collected from cancerous tissue or histologically normal tissue verified by the pathologist. Normal samples were derived from separate tissue blocks (the whole specimen represented normal tissue by histological evaluation, with one exception, which was punched from a tumor block (adjacent to tumorous tissue)). For LS tissue samples, the pathologist verified the histology and DNA was extracted from the FFPE sections. Normal samples were derived from separate tissue blocks (the whole specimen was histologically evaluated as normal tissue). In tumor samples, the average of tumorous tissue was 46% (SD ± 13.0).

2.2. MSI Analysis

MSI status was investigated using mononucleotide repeat markers BAT25 and BAT26, as described in Mäki-Nevala et al. [21]. The diagnosis of MSI required at least one unstable marker.

2.3. Immunohistochemical Analysis of PDCD1 and CD274, and Immune Cell Scoring (ICS)

CA-CRC samples were studied for PDCD1 and CD274 expression by immunohistochemical analysis, as described in Ahtiainen et al. [15]. Also, ICS based on CD3 and CD8 expression was calculated according to the previously described protocol [15,16]. Briefly, antibodies used were: anti-PDCD1 (SP269, 1:50; Spring Bioscience, Pleasanton, CA, USA), anti-CD274 (E1L3N, 1:100; Cell Signaling Technology, Danvers, MA, USA), anti-CD3 (LN 10, 1:50; Novocastra, Buffalo Grove, IL, USA), and anti-CD8 (SP16, 1:100; Thermo Fisher Scientific, Waltham, MA, USA). Positively stained cells were analyzed using QuPath [23]. Cut-off values for PDCD1, CD3, and CD8 positivity were determined from a large reference series of CRCs using receiver operating characteristic curves drawn in relation to disease-specific 5-year survival [18]. The cut-off values for PDCD1 were 38 cells/mm2 (invasive margin) and 57 cells/mm2 (tumor center). Based on these cut-off values, the samples were divided into PDCD1low and PDCD1high. Cut-off values for ICS were: 815 for CD3 and 384 for CD8 in the tumor center and 1144 for CD3 and 496 for CD8 in the invasive front. Expressions in the tumor center and invasive front were used to formulate the ICS, as specified in Wirta et al. [16]; one point is given for each section (tumor center or invasive margin with CD3 or CD8 staining) with a lymphocyte count exceeding the determined cut-off value so that in ICS 4, all the sections had a high cell count and in ICS 0, all the sections had a low cell count. Samples were grouped into ICSlow (scores 0–2) and ICShigh (scores 3–4). Expression of CD274 was evaluated on tumor cells (TC) and tumor-infiltrating immune cells (IC) throughout the tumor center and the invasive margin from stained whole tissue sections. Both the percentage of stained immune and tumor cells and the staining intensity were visually estimated. A sample was considered CD274pos if the proportion of CD274-positive tumor and/or tumor-infiltrating immune cells with moderate or strong intensity exceeded 5%. The location of CD274 expression on tumor and/or immune cells was confirmed by detailed side-by-side analyses of CD274 expression with corresponding HE stained slides.

2.4. CpG Island Methylator Phenotype (CIMP) Analysis

Commercial SALSA MS-MLPA ME042-B2 (for LS samples) and ME042-C1 (for CA-CRC samples) probe mixes (MRC Holland, Amsterdam, The Netherlands) were used according to the manufacturer’s protocol. The results were interpreted as described in Mäki-Nevala et al. [21] for CA-CRC and Valo et al. [24] for LS. Briefly, eight established marker genes for CIMP (CACNA1G, CDKN2A, CRABP1, IGF2, NEUROG1, MLH1, RUNX3, and SOCS1) were investigated. A set of corresponding normal samples were examined to determine a threshold for hypermethylation for each probe with a stringency level II; these details are described in Valo et al. [24]. CIMP status was assigned by a three-level evaluation [25]. First, probe-level methylation was assessed against the mean Dm of normal mucosae plus two standard deviations (if this value was lower than the technical threshold of 0.15, the technical cut-off was used as a threshold). Second, a gene was considered hypermethylated if at least one-fourth of all probes for that gene were methylated. Third, CIMP(+) status required a minimum of 3/5 marker genes (CACNA1G, IGF2, NEUROG1, RUNX3, and SOCS1) to be methylated according to the Weisenberger criteria [26].

2.5. O-6-Methylguanine-DNA-Methyltransferase (MGMT) Methylation Analysis

The SALSA MLPA Probemix ME012 MGMT-IDH1-IDH2 (MRC Holland, Amsterdam, The Netherlands) was applied according to the manufacturer’s protocol. The probemix included six probes for the MGMT promoter area.

2.6. Bisulfite Modification and Sequencing

CRC cell lines (HCA7, HCT116, LIM1215, RKO, SW480, and T84) and normal samples (DNA from normal colonic mucosa (Dr. P. Set, Amsbio, Abingdon, United Kingdom) and blood-derived healthy control DNA (Promega, Madison, WI, USA) were bisulfite converted using the EZ DNA Methylation-DirectTM Kit (Zymo Research, Orange, CA, USA) according to the manufacturer’s protocol. Methylation-unbiased primers (Supplementary Figure S1 and Supplementary Table S6) were used to amplify the bisulfite converted DNA samples, and amplified products were sequenced directly or after cloning. NTSR1 was selected for the cloning experiment (Supplementary Figure S2). Amplified DNA samples were cloned into a pCRC2.1 TOPO vector using the TOPO TA Cloning System (Invitrogen, Carlsbad, CA, USA) and One Shot Electrocompetent E. coli (Invitrogen, Carlsbad, CA, USA). Resulting white colonies were used for the purification of DNA and were sequenced, totaling 14–30 sequences per amplification product. The frequency of methylated sites was calculated and compared to MS-MLPA results (Supplementary Figure S2).

2.7. Custom-Made Methylation Specific Multiplex Ligation-Dependent Probe Amplification (MS-MLPA) Assay for Inflammation-Related Genes

The inflammation-associated gene panel was designed in-house (Figure 1). We started with a list of more than 200 inflammation and/or immune response-associated genes in mice (Paloviita, 2015, personal communication and MSc thesis, 2016). An extensive literature review was conducted in the PubMed using the following search terms: “gene_name” AND “methylation” AND “cancer”. in October and November 2016. Human orthologs of those inflammation-related genes whose DNA methylation alterations were associated with CRC and inversely associated with mRNA and/or protein expression were characterized. For a gene to be considered further, it was necessary that at least one GCGC site occurred in the region of interest to allow the subsequent design of an MS-MLPA probe. We selected the most interesting genes (n = 10); additionally, the immune checkpoint genes CD274 and PDCD1 were included, although to that date, there were no studies reporting methylation alterations associated with CRC. For these 12 genes, bisulfite sequencing primers were designed or previously published ones were used for the regions (Supplementary Table S6). CpG sites and promoter regions were identified using the UCSC Genome Browser [27]. Bisulfite sequencing was performed as described above. MS-MLPA probes were designed if distinct methylation profiles were observed between various CRC cell lines and in normal controls compared to CRC cell lines.
The final seven genes were: CD274 (Cluster of Differentiation 274), also known as the gene for Programmed Cell Death Ligand-1 (PD-L1); NTSR1 (Neurotensin Receptor 1); PPARG (Peroxisome Proliferator-Activated Receptor Gamma); PTGS2 (Prostaglandin-Endoperoxide Synthase 2), also known as cyclo-oxygenase 2 (COX-2); PYCARD (PYD and CARD Domain Containing Protein), SOCS1 (Suppressor of Cytokine Signaling 1), and SOCS2 (Suppressor of Cytokine Signaling 2). MS-MLPA probes were designed according to the protocol by the MRC-Holland (Amsterdam, The Netherlands) (version 15) (Supplementary Figure S1 and Supplementary Table S1). Probes were ordered from the Integrated DNA Technologies (Coralville, IA, USA), and were tested and optimized against bisulfite sequencing results. The optimized custom-made probe mix including probes for the aforementioned seven genes was used together with the SALSA MLPA probe mix P300-B1 Reference2 (MRC-Holland, Amsterdam, The Netherlands) and the SALSA MLPA EK-FAM reagent kit (MRC-Holland, Amsterdam, The Netherlands) according to the manufacturer’s protocol. Cut-off values for hypermethylation were calculated in the same way as described for the CIMP panel [24]. To note, SOCS1 is also included in the commercial CIMP panel (see above), but its targeted region is different; CIMP panel probes are located 1374-2441bp downstream from the custom-made probe.

2.8. mRNA Expression Analysis

Cancer cell lines’ mRNA expression was assessed with Affymetrix Human Genome U133 Plus 2.0 GeneChip® microarrays (Affymetrix, Santa Clara, CA, USA), as described [28]. Normal tissue RNA was purchased from Amsbio (Abingdon, UK). Microarray data were analyzed by the Affy package in R using RMA (robust multi-array average) normalization methods.

2.9. Statistical Analysis

Statistical analyses were conducted using the SPSS software, version 25.0 and 27.0 (IBM SPSS Inc., Chicago, IL, USA). Fisher’s exact test was used to study pairwise comparisons of categorical variables. Normal distribution of continuous data was tested using the Shapiro–Wilk test. Continuous variables were analyzed using the independent t-test for normally distributed variables and the non-parametric Mann–Whitney–U test was applied on not normally distributed variables. Similarly, correlation analyses were calculated either with Pearson’s or Spearman’s correlation test. Exact two-sided p values were calculated. When applicable, raw p values were corrected with the Bonferroni method for multiple comparisons. Corrected p values < 0.05 were considered statistically significant and are presented throughout the paper, unless otherwise indicated.

3. Results

3.1. Immunoprofiles of CA-CRC

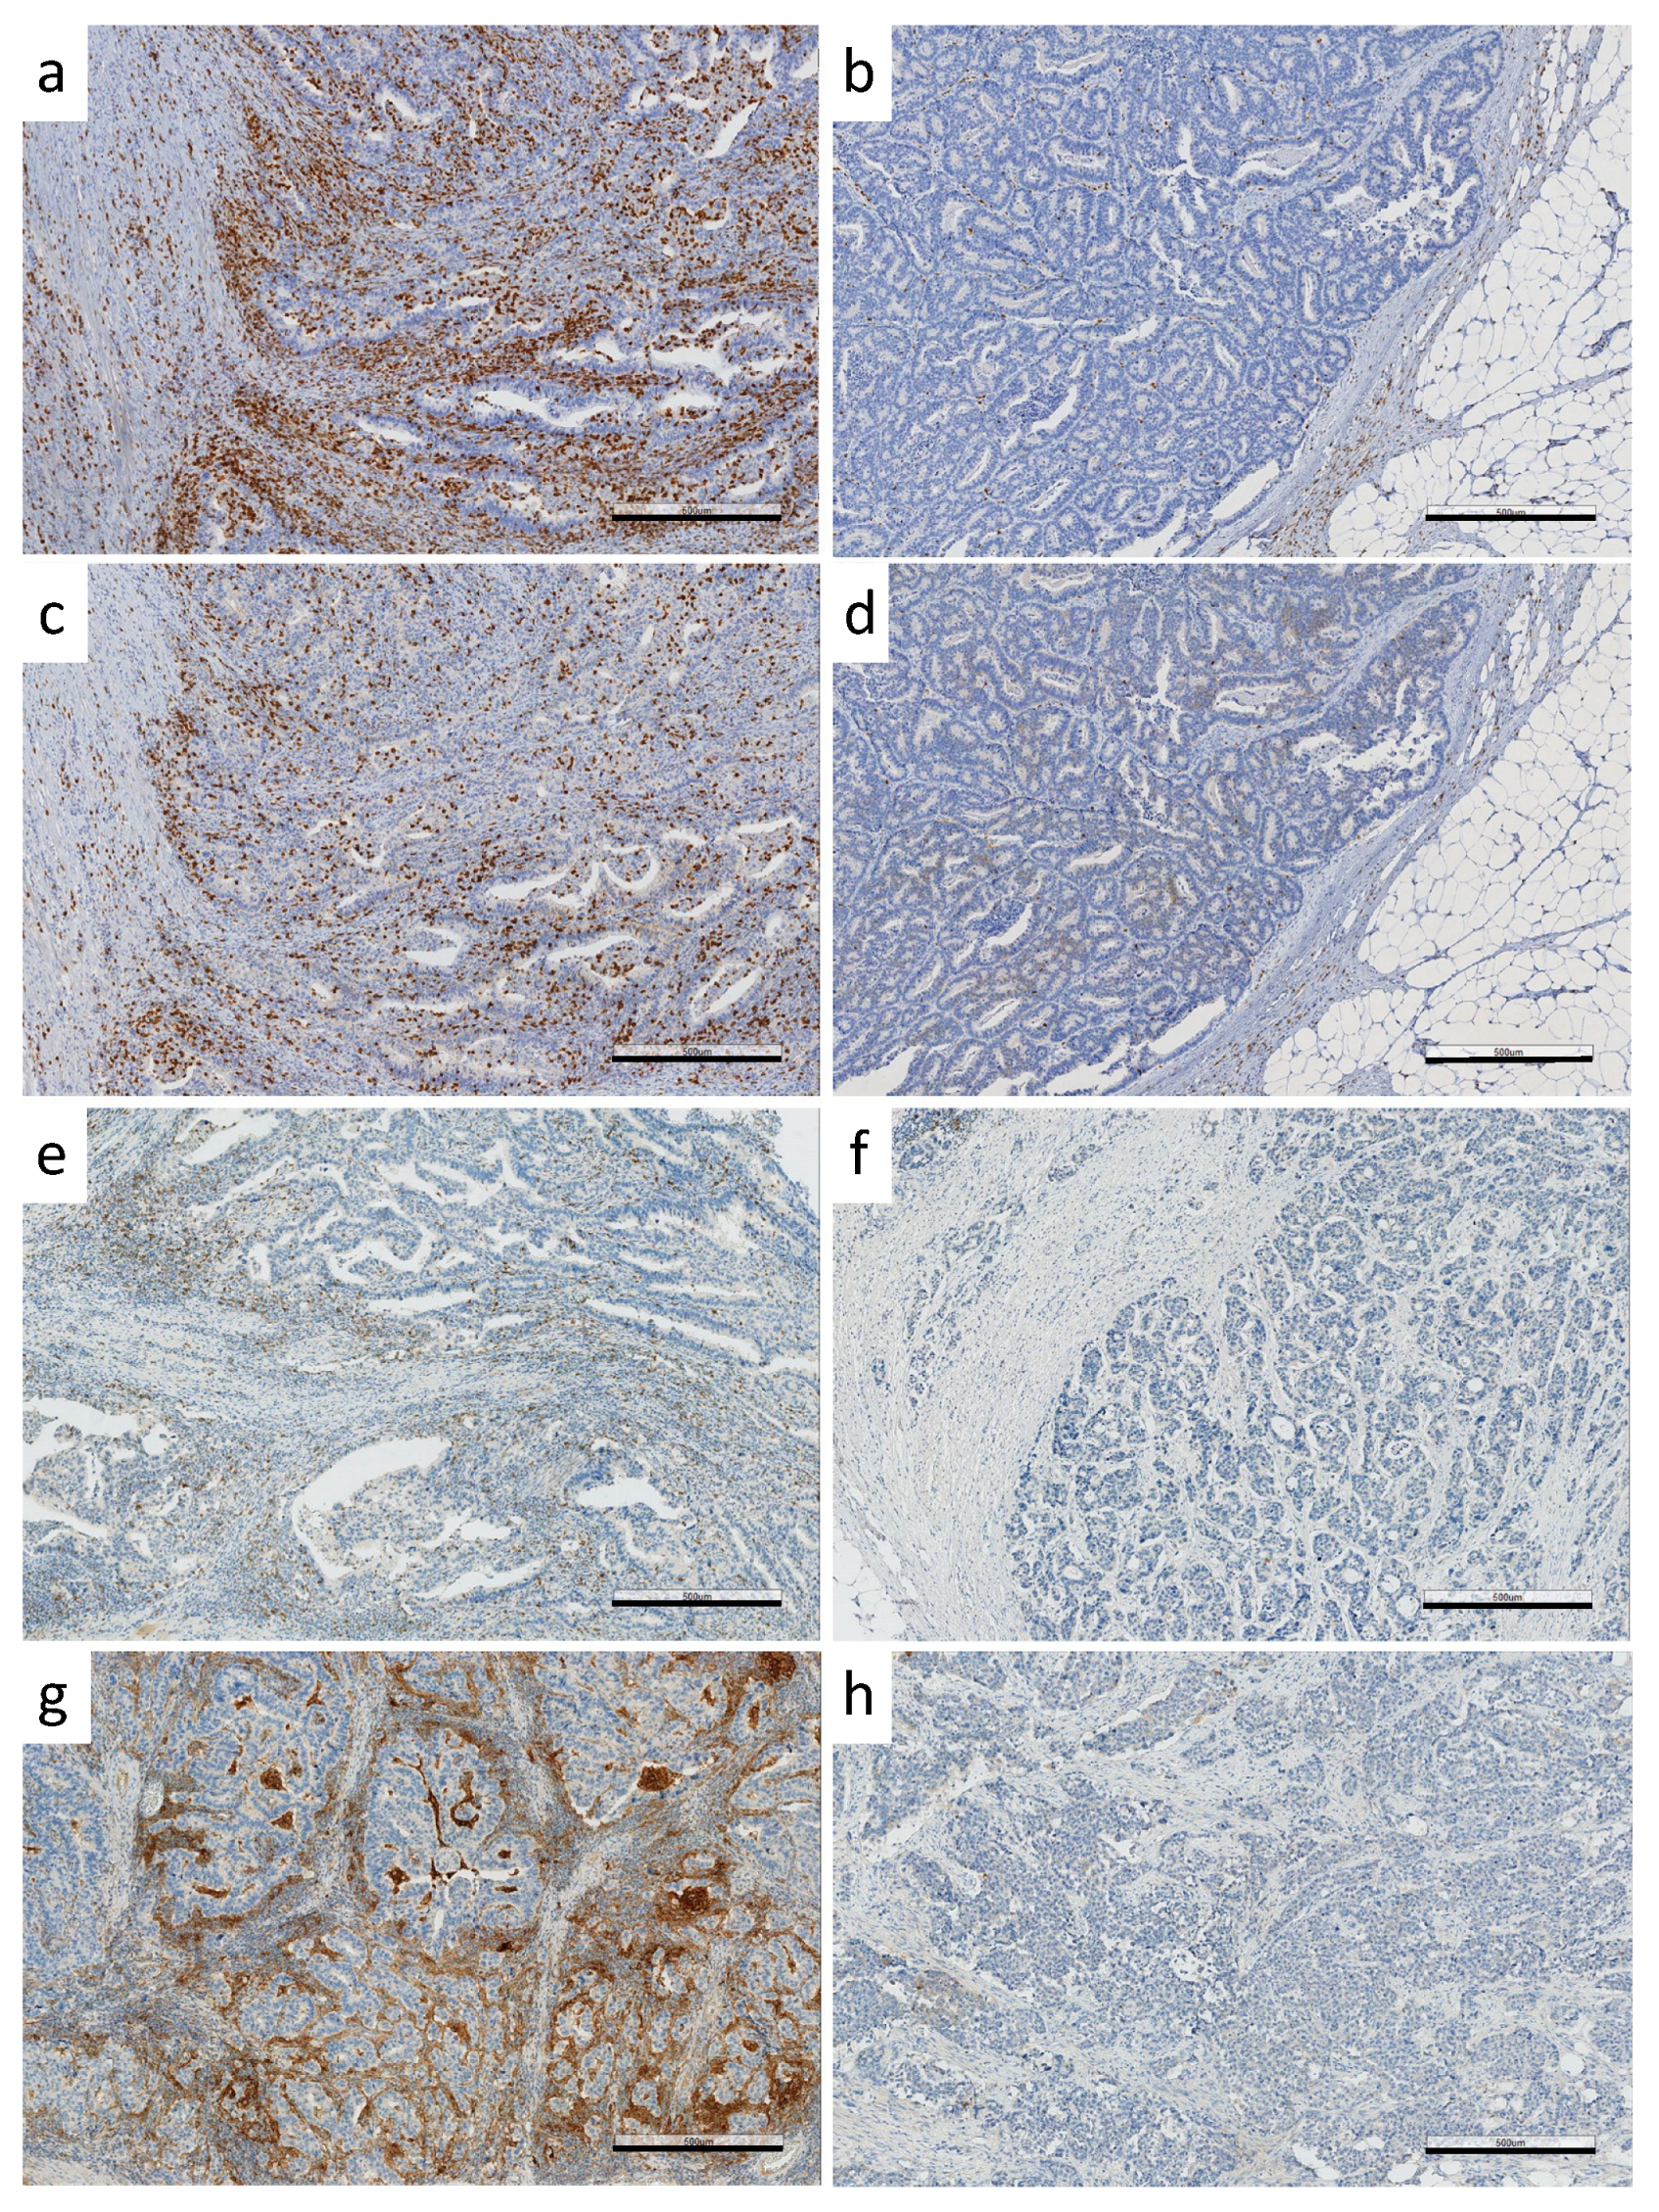
Immunoprofiles were determined based on ICS and immune checkpoint protein expression. This study comprised 31 CA-CRCs, all microsatellite-stable (MSS) except for one (Table 1). ICSs were distributed as follows: 0 in 23%, 1 in 10%, 2 in 13%, 3 in 16%, and 4 in 38% of the tumors. On a dichotomous scale, ICS was high (three or four) in 17/31 (55%) CA-CRC-tumors (Table 2). Figure 2 represents high and low expressions of CD3, CD8, PDCD1, and CD274 by IHC.
Most CA-CRCs showed a high expression of the immune checkpoint protein PDCD1: 18/31 (58%) when PDCD1-positive lymphocytes in the tumor center were counted (Table 2) and 21/31 (68%) based on PDCD1-positive lymphocytes in the invasive margin. Half of the CA-CRCs (16/31, 52%) expressed CD274-positive immune cells, whereas tumor cells were CD274-negative.
We combined the data of tumor-infiltrating lymphocytes, i.e., ICSs, and the CD274 expression of immune cells, as suggested and done in previous studies [15,29]. The samples were divided into four subgroups: ICShigh/CD274pos (type I; adaptive immune resistance), ICSlow/CD274neg (type II; immunological ignorance), ICShigh/CD274neg (type III; tolerance), and ICSlow/CD274pos (type IV; intrinsic induction) according to Teng et al. [29]. Details are presented in Table 2.
In this investigation, ICS, PDCD1, and CD274 assays were performed on CA-CRC alone. We previously [15] immunologically profiled a separate set of LS-CRCs (all from verified carriers of pathogenic germline mutations of MLH1, MSH2, or MSH6), together with cohorts of sporadic CRCs, by the same method used here, enabling direct comparisons (Table 2). CA-CRC did not significantly differ from LS-CRC relative to any immunological parameter assessed. As 97% of CA-CRCs were MSS, we selected the MMR-proficient (pMMR) subgroup of sporadic CRCs for comparison. In CA-CRCs, CD274 on immune cells was more often positive and ICS high (the difference reached statistical significance for CD274), resulting in a significantly different distribution of ICS/CD274IC types between CA-CRC and pMMR-CRC (Table 2).

3.2. Immunoprofile vs. Somatic Mutational Status and CIMP

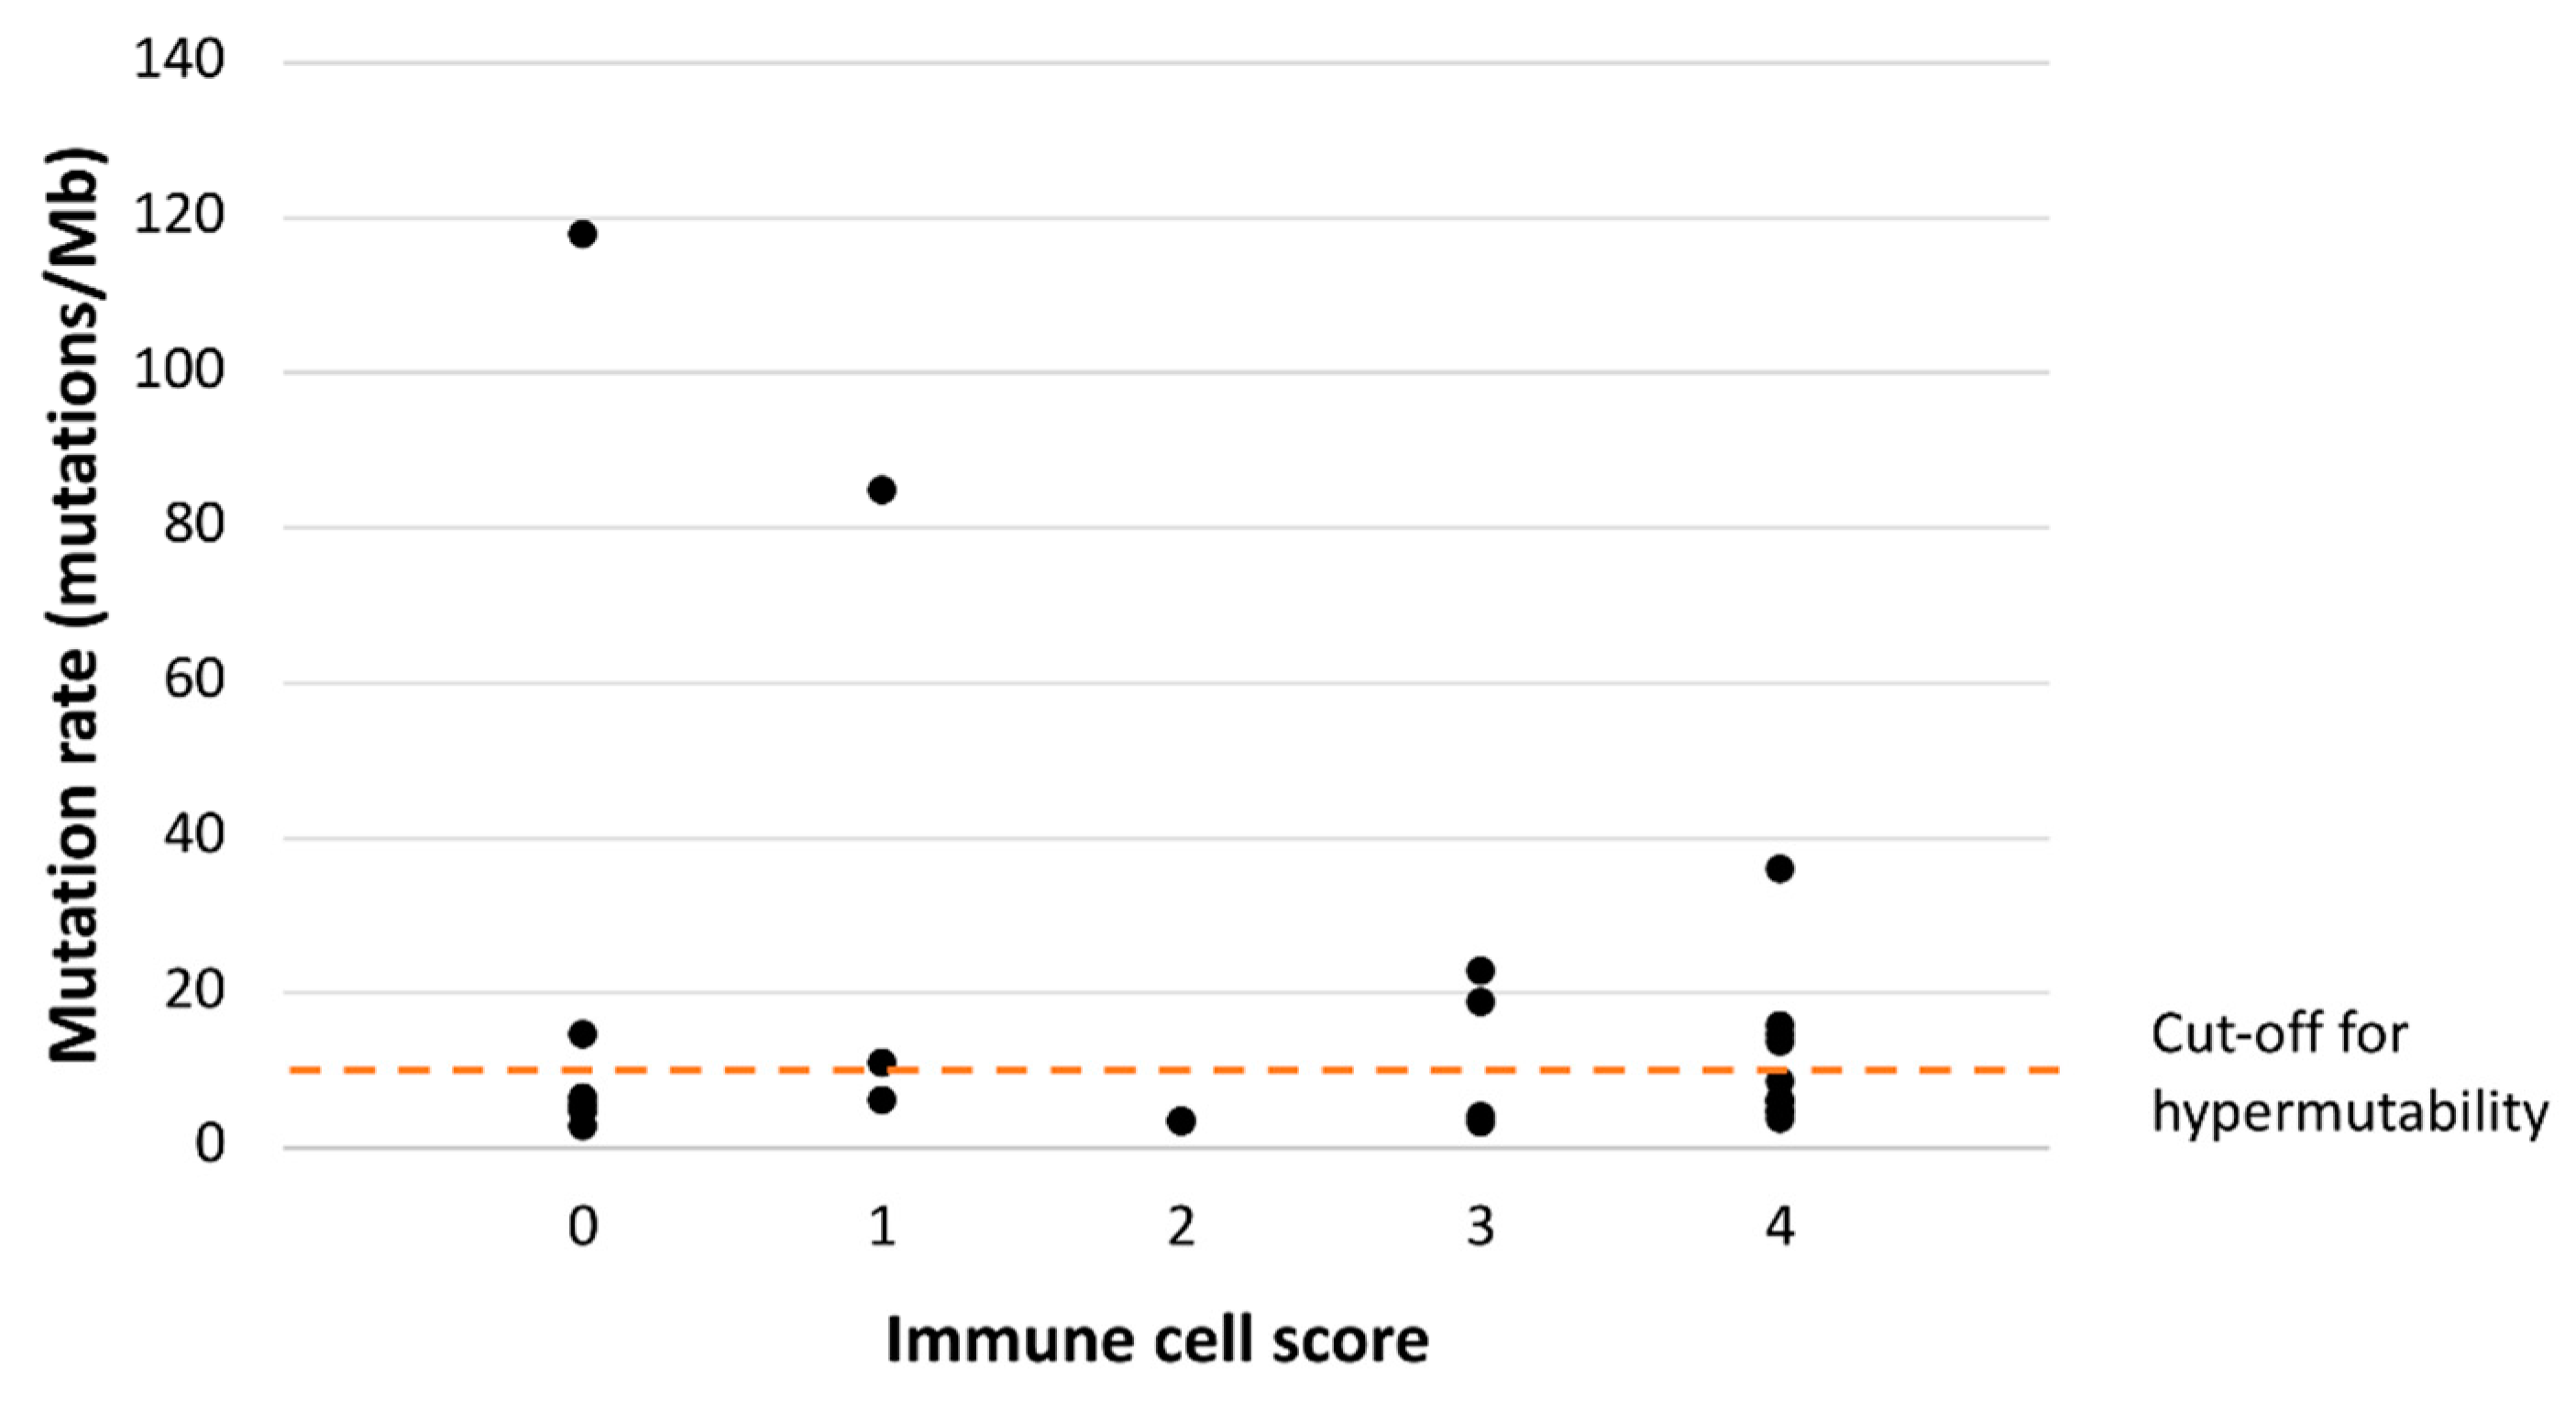
Of the 31 CA-CRCs, 27 were sequenced for somatic mutations as part of our previous study [21], which allowed us to compare mutational status and immunoprofiles. CA-CRC tumors broke down into three subgroups based on their status of MSI and hypermutability (the latter defined as over 10 nonsynonymous somatic mutations/Mb): group one comprised hypermutated MSI tumors (n = 1); group two, hypermutated MSS tumors (n = 9); and group three, non-hypermutated MSS tumors (n = 17). We plotted the number of somatic mutations against ICS, and all ICS groups, except number two, included two or three hypermutated tumors (Figure 3). Interestingly, two tumors (including the single one with MSI) had somatic mutation numbers around the “ultramutated” range (100 mutations/Mb) and both had low ICS values (0 and 1). The mutation rate (mutations/Mb) was not associated with the immunological subgroup defined by ICS and CD274 expression (p = 0.835). The ten hypermutant tumors were distributed among all four immunological subgroups, most commonly ICShigh/CD274pos (four tumors) and ICSlow/CD274neg (three tumors, including the single MSI tumor), followed by ICShigh/CD274neg (two tumors), and ICSlow/CD274pos (one tumor).
Of all CA-CRC tumors, 12 (39%) were CIMP(+) and 19 were CIMP(−) (61%) (Table 1). CIMP status was not associated with the immunological subgroup (p = 0.486). The largest proportion of CIMP(+) tumors (6/12, 50%) fell into the ICShigh/CD274pos group and of CIMP(−) tumors (6/19, 32%), into the ICSlow/CD274neg group.

3.3. Methylation of Inflammation-Related Genes in CA-CRC and LS Tumors

We focused on seven inflammation-associated genes selected, as described in Figure 1 and Methods (Section 2.7). Our custom-made MS-MLPA panel (Supplementary Figure S1 and Supplementary Table S1) was validated against bisulfite sequencing results of cell lines. A cloning experiment was performed for one of the genes, NTSR1. Quantification of methylation by MS-MLPA vs. cloning yielded closely concordant results (Supplementary Figure S2).
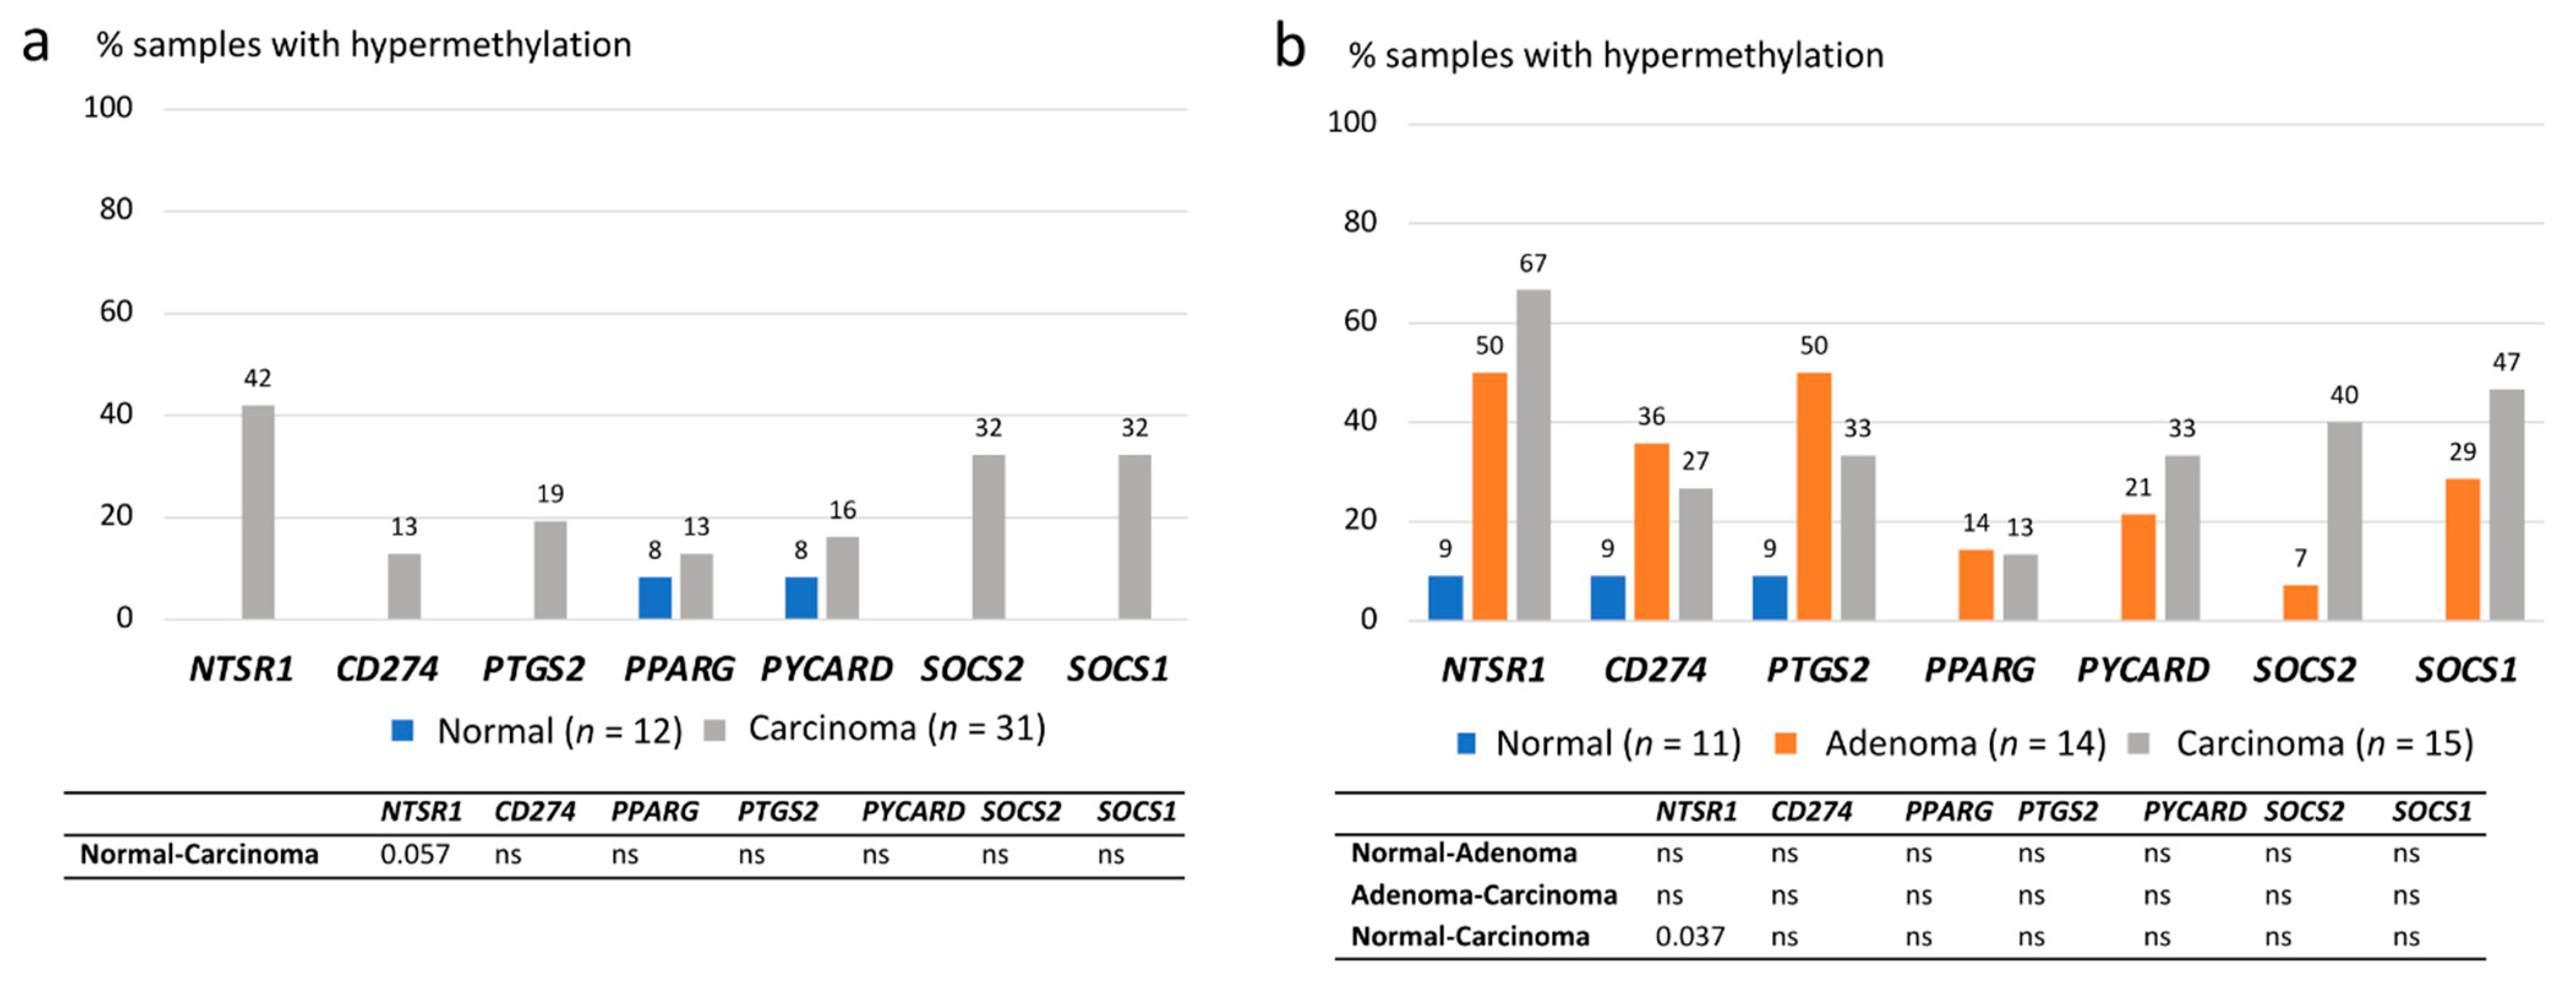
Methylation data were evaluated in two ways: first, by determining the frequencies of hypermethylation in tumor tissues relative to gene-specific thresholds derived from normal mucosa (Supplementary Table S2), and second, by using the degrees of methylation (based on methylation dosage ratios (Dm) obtained for each gene in each specimen) as continuous variables. In the former analysis, both CA-CRC and LS-associated colorectal samples showed hypermethylation of tumor samples compared with normal mucosae (Figure 4a,b). In CA-CRC, the hypermethylation frequencies of NTSR1, SOCS2, and SOCS1 (32–42%) clearly exceeded those of the paired normal tissues (0%); however, statistical significances were lost when the Bonferroni correction was applied (Figure 4a), and only NTSR1 remained borderline significant (p = 0.057). Among LS samples, NTSR1, SOCS2, and SOCS1 showed tentatively increased methylation frequencies in carcinomas compared to normal mucosae, but only NTSR1 remained significant after adjustment for multiple testing (p = 0.037) (Figure 4b). NTSR1 and PTGS2 hypermethylation were elevated already in adenomas and the latter one showed an even somewhat higher hypermethylation frequency in adenomas compared to carcinomas, 50% vs. 33% (Figure 4b).
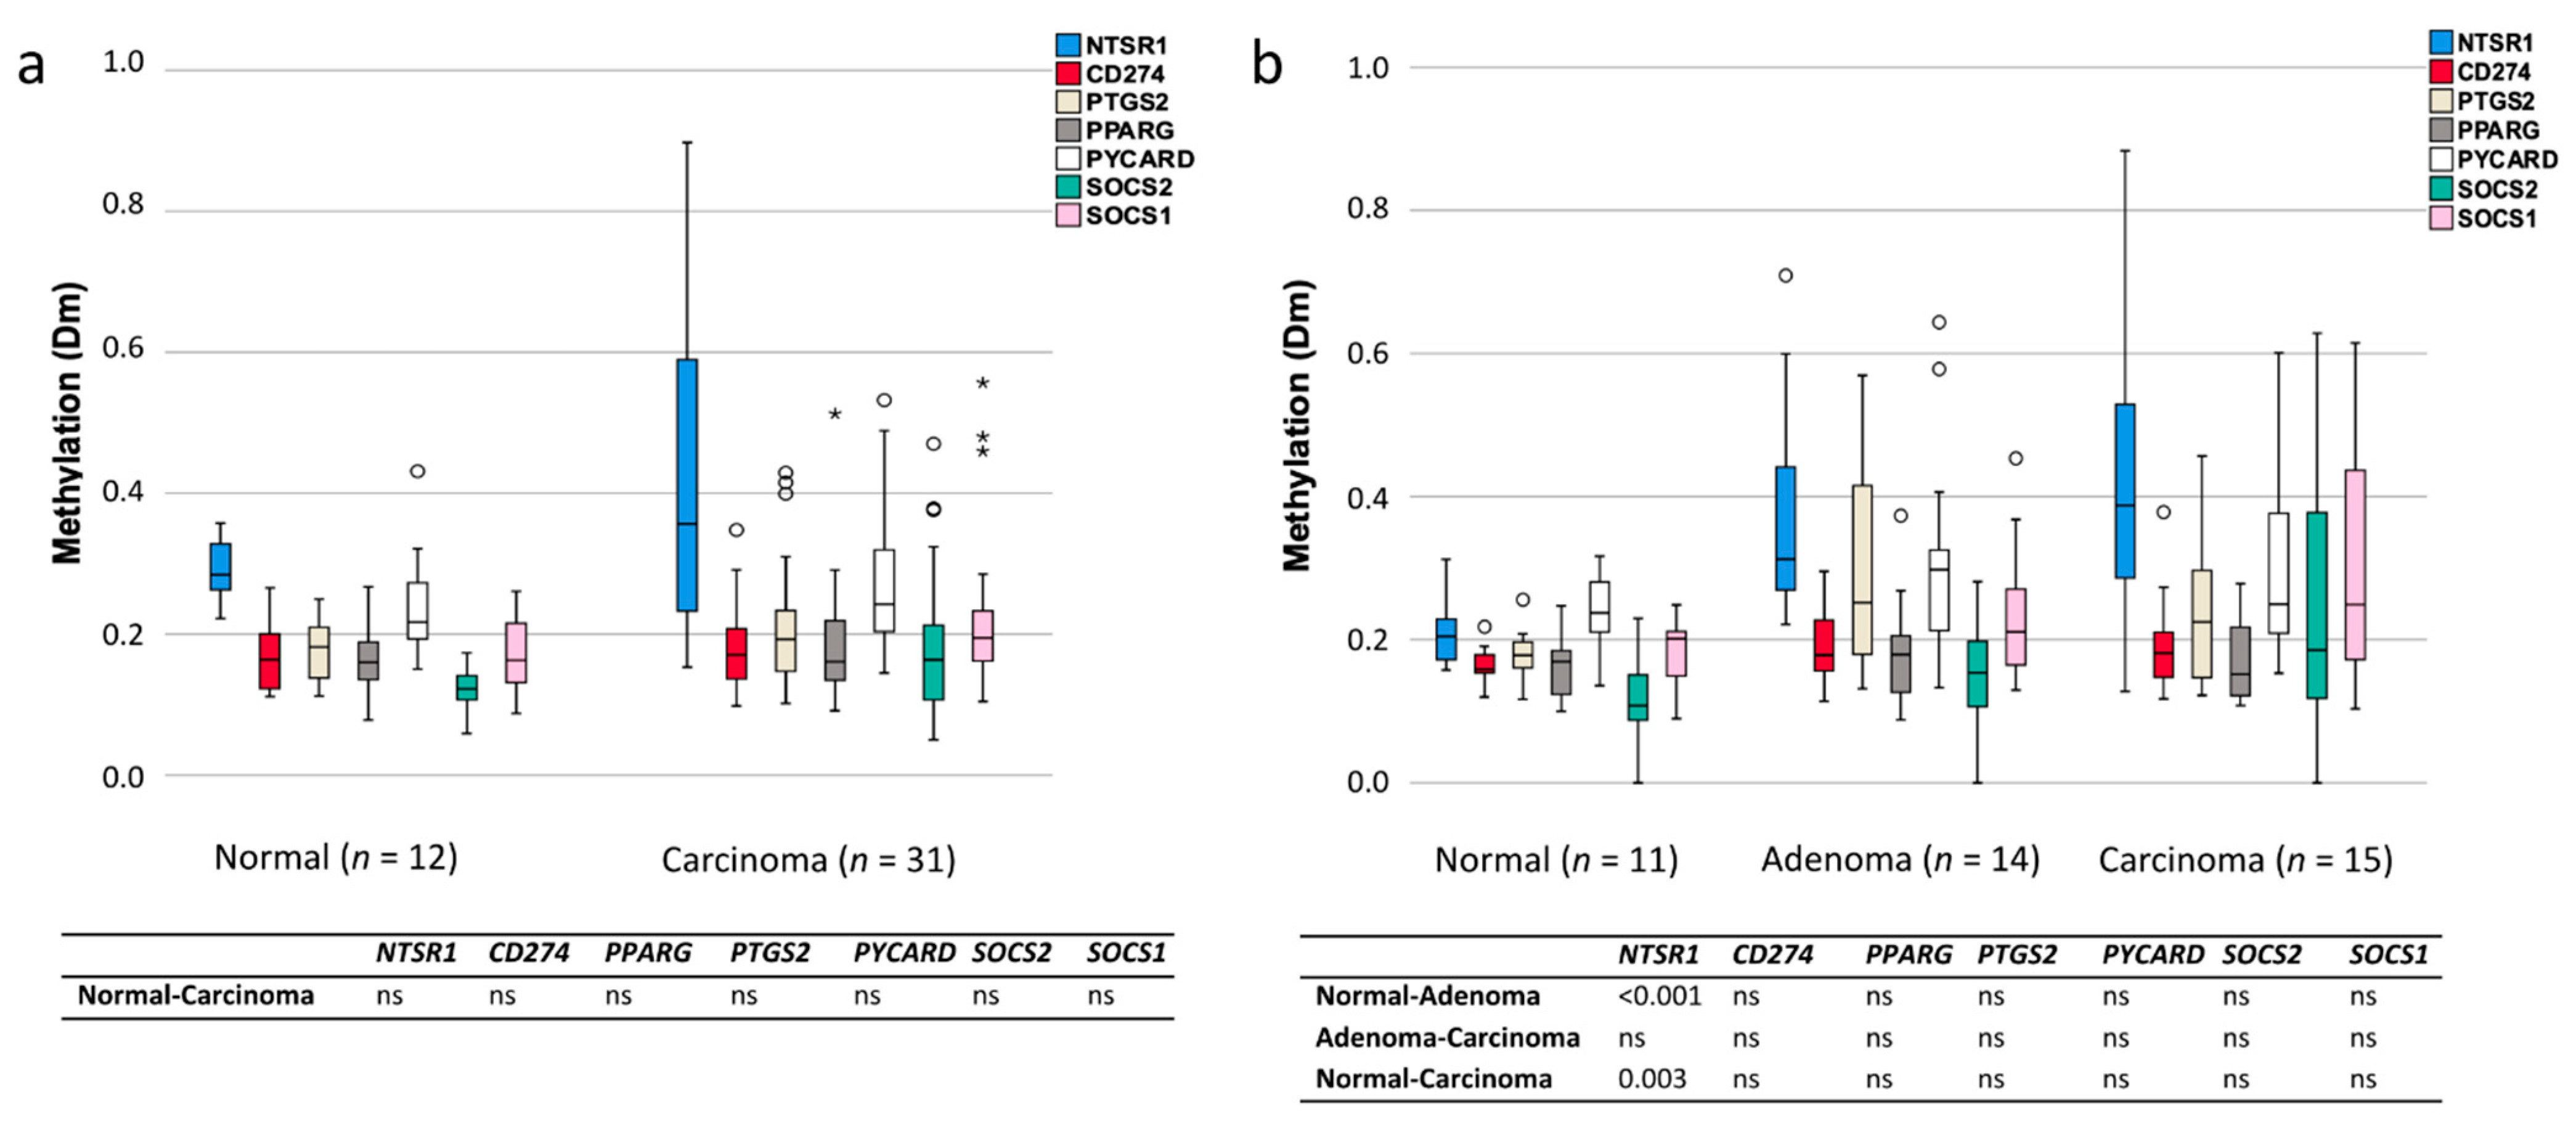
Treating the degrees of methylation as continuous variables, NTSR1 and SOCS2 revealed the most evidently increased methylation levels in CA-CRCs compared to normal mucosa, although no statistical significance was reached (Figure 5a). NTSR1 methylation values were characterized by a high variance, which suggested the existence of two subsets of tumor samples, one with increased and another one with decreased methylation compared to normal colon samples. In LS, NTSR1 had significantly increased methylation values in tumor samples compared to normal counterparts, both in adenomas (p < 0.001) and carcinomas (p = 0.003) (Figure 5b).
When the hypermethylation frequencies of inflammation-associated genes were stratified by CIMP status, higher (although statistically non-significant) hypermethylation frequencies were seen for the CIMP(+) vs. CIMP(−) subsets of CA-CRCs for PYCARD (33 vs. 5%), CD274 (25 vs. 5%), NTSR1 (50 vs. 37%), and SOCS2 (42 vs. 26%). The degree of methylation as a continuous variable was not significantly associated with the CIMP status for any inflammation-associated gene in CA-CRC. Among LS tumors, NTSR1 methylation was associated with overall CIMP: the average degree of methylation was 0.62 in CIMP(+) tumors vs. 0.34 in CIMP(−) tumors (p = 0.002).
Intriguingly, normal mucosa samples of CA-CRC vs. LS patients differed significantly: the average degree of methylation for NTSR1 was significantly higher in normal mucosa from CA-CRC patients (mean Dm ± SD of 0.29 ± 0.12, range 0.22–0.36) compared to normal mucosa from LS patients (0.21 ± 0.15, range 0.16–0.31) (p = 0.007). In the corresponding tumors, the average degrees of methylation of NTSR1 or other inflammation-associated genes did not significantly differ between UC and LS patients. When compared to normal mucosae of LS patients, normal mucosae of CA-CRC patients additionally showed significantly increased average degrees of methylation in at least one of the probes for all CIMP marker genes except MLH1 (Supplementary Table S3). A similar trend was seen for the corresponding tumor tissues.
Methylation of inflammatory marker genes was not significantly associated with immunological subgroup or ICS. None of the inflammatory marker probes showed an age-related correlation with methylation levels in CA-CRC tumors, and the same was true for CIMP markers (in LS tumors, one CIMP probe, IGF2 I, showed statistical significance (r = 0.612, p = 0.013). Similarly, no age-related correlation with methylation was observed in normal mucosae (n = 12) from CA-CRC patients (in LS samples (n = 11), RUNX3 I and RUNX3 II showed a significant, but inverse correlation between age and methylation (r = −0.858, p = 0.022, and r = −0.841, p = 0.037, respectively)). The tumor stage was not associated with the hypermethylation frequency or methylation levels of inflammation-associated genes or CIMP markers in CA-CRC or LS tumors.

3.4. Methylation of MGMT

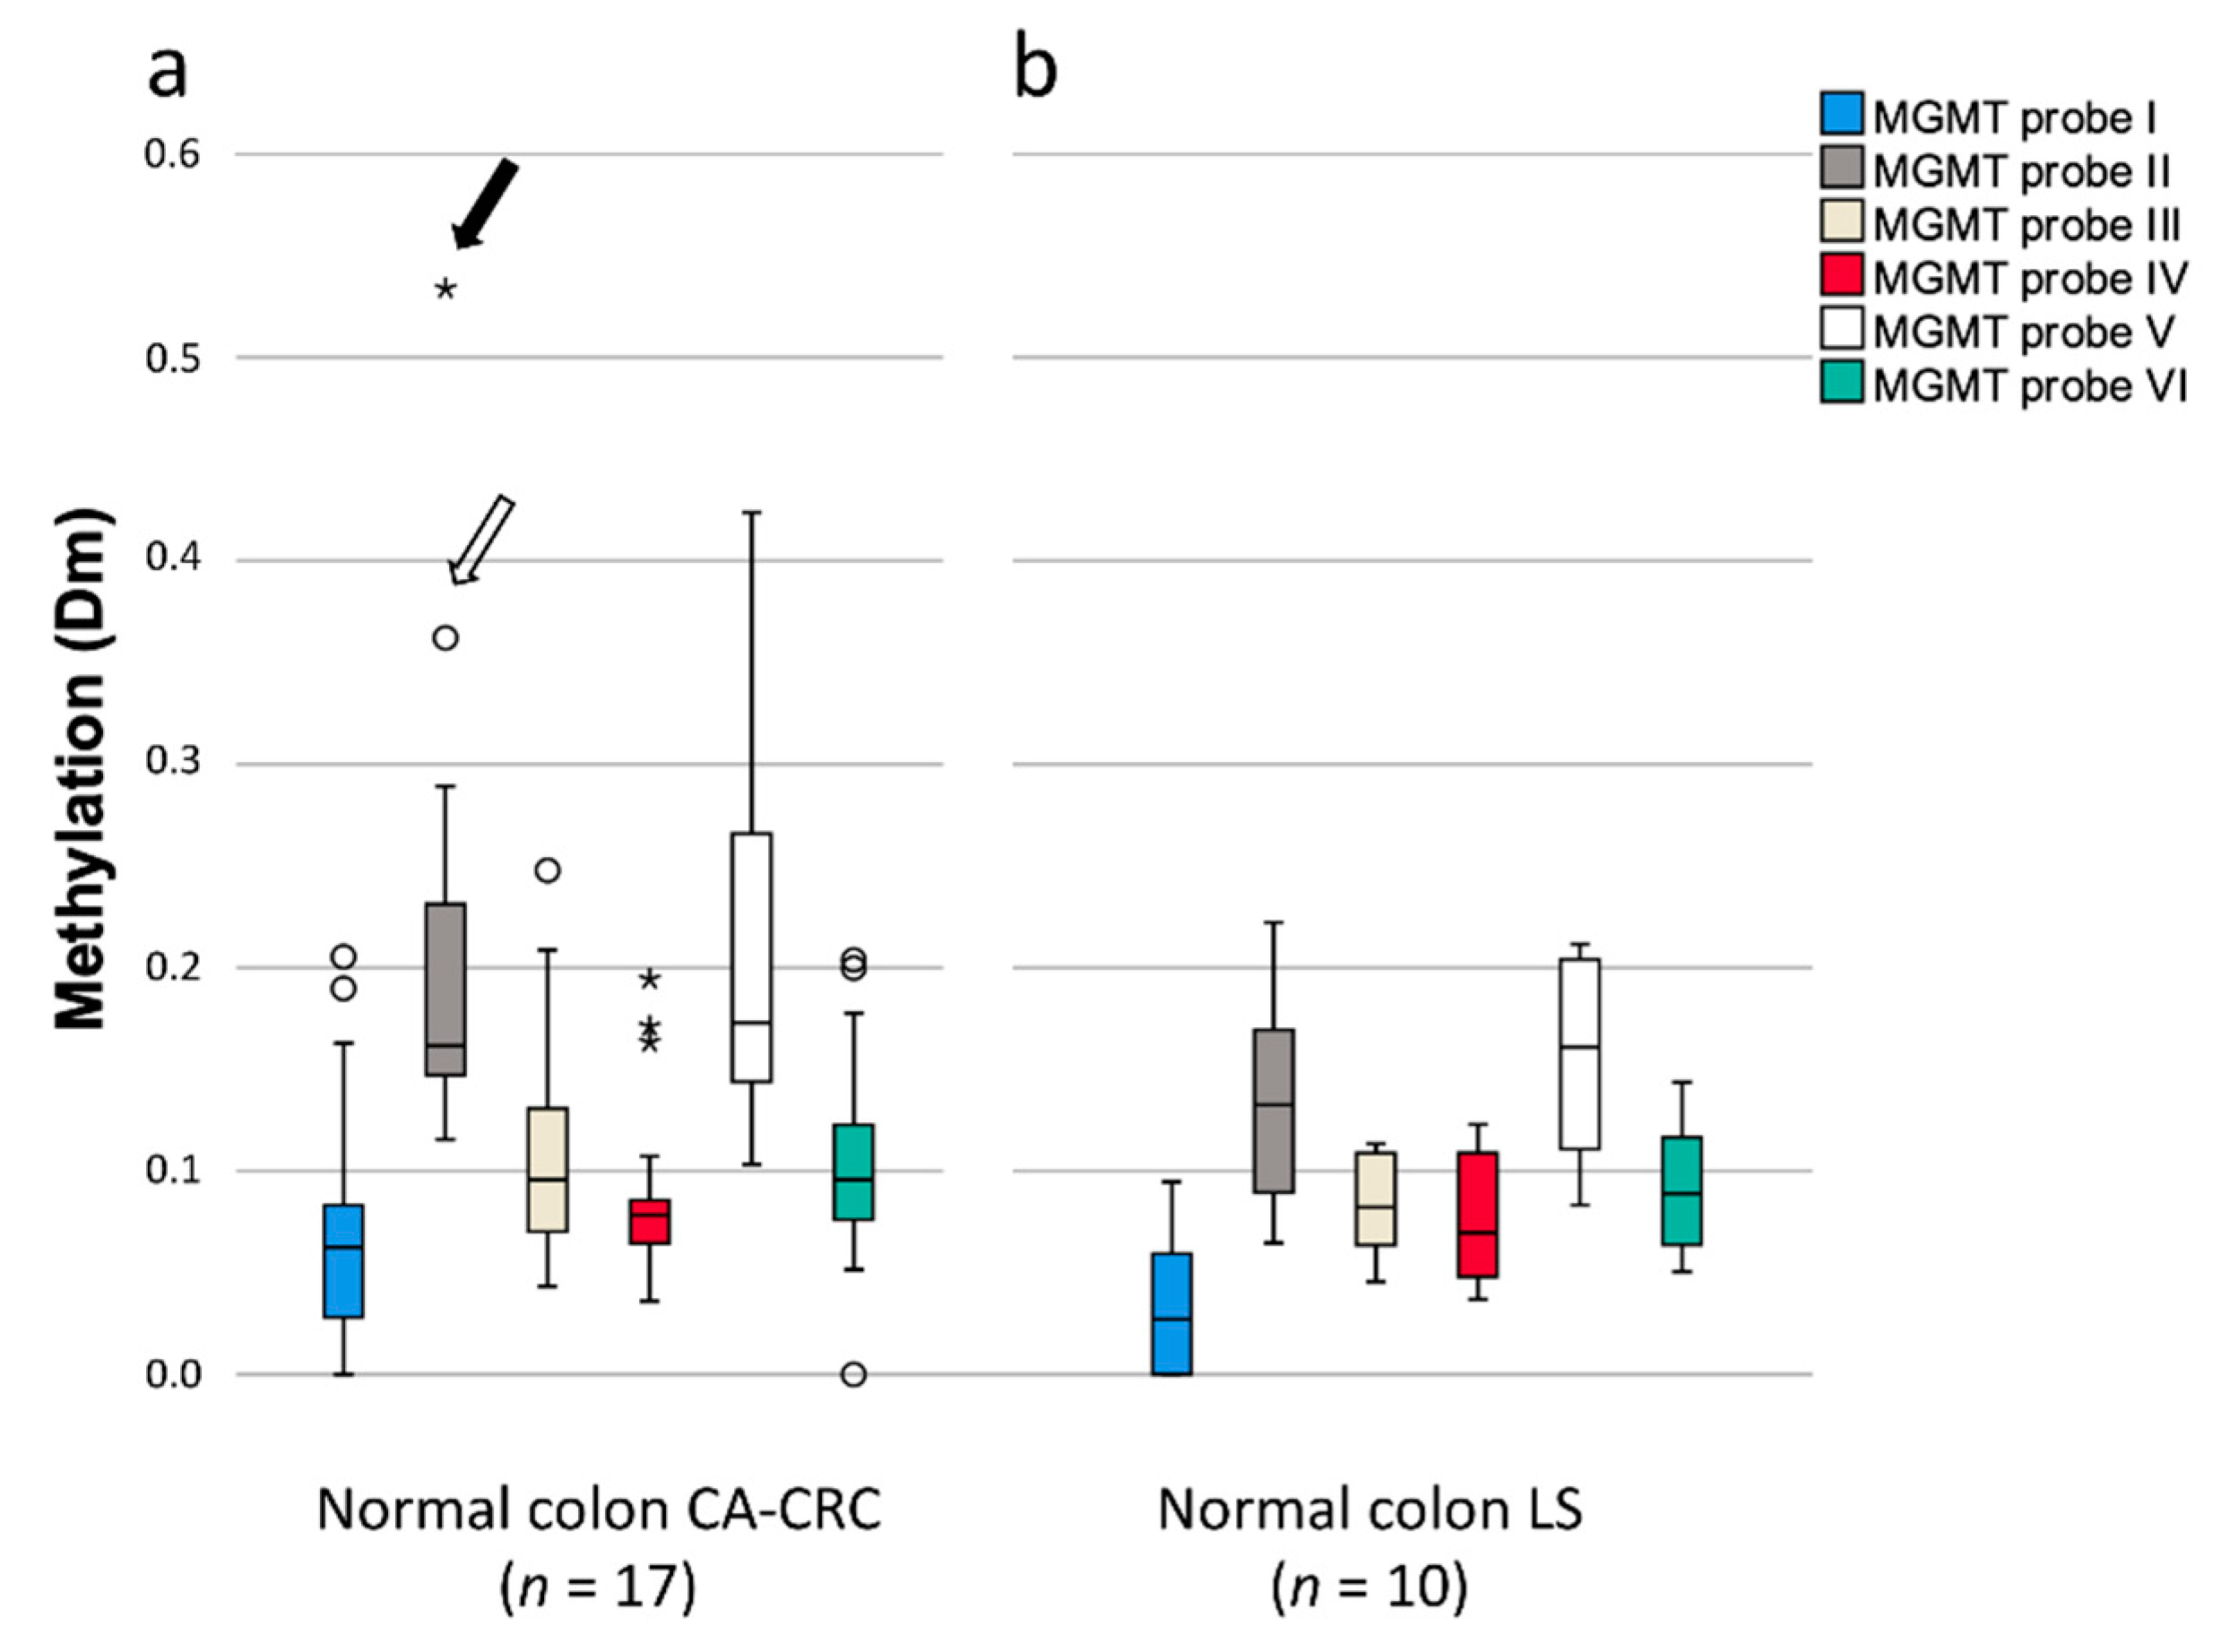
Prompted by the observations of elevated methylation of NTSR1 and CIMP marker genes as a feature of normal mucosae from CA-CRC patients (Figure 5, Supplementary Table S3), the repair gene O-6-Methylguanine-DNA Methyltransferase (MGMT) was investigated for promoter methylation, as it has been proposed to serve as an early marker for colorectal cancer [30]. In this investigation, probes III (263 bp before exon 1) and V (73 bp after exon 1) represent methylation hot spots closely associated with silencing of the MGMT gene [31]. No significant difference was seen between normal mucosae and tumors from either CA-CRC or LS patients (Supplementary Table S4), and CIMP status did not associate with the average degree of methylation of any MGMT probes. Figure 6 shows the distributions of the degrees of methylation for the different MGMT probes for normal mucosae specifically. In comparison with LS, most of the probes had higher methylation levels in CA-CRC patients, especially MGMT II, although statistical significance was not reached (p = 0.100). Some CA-CRC patients’ normal samples showed very high levels of methylation, exceeding the levels seen in their matched tumors; for probe II, for example, one case showed a Dm of 0.53 in normal tissue (solid arrow in Figure 6a) vs. 0.27 in tumor tissue, and in another case, a Dm of 0.36 in normal tissue (open arrow in Figure 6a) vs. 0.28 in tumor tissue. A similar phenomenon was not seen in LS (Figure 6b). These methylation alterations could serve as field defects in CA-CRC-related tumorigenesis.

3.5. Methylation of Inflammation-Related Genes in Cancer Cell Lines and Association with Gene Expression

To evaluate the functional impact of CpG sites studied in inflammatory marker genes, cancer cell line-derived and normal reference DNA samples were investigated for methylation by custom-made MS-MLPA (Supplementary Table S5), and the data were combined with gene expression microarray data (Supplementary Figure S3). The ovarian cell lines ES2, CAOV3, and SKOV3, the uterine cancer cell line of AN3CA, and the colorectal cancer cell lines HCT15, RKO, HCA7, LIM1215, SW48, LoVo, and KM12 were included. When mRNA expression values (log2 fold change) were plotted against the methylation dosage values (Dm), a negative correlation was observed for all probes. A statistically significant correlation between mRNA expression and methylation was found for CD274 (r = −0.680, p = 0.010), NTSR1 (r = −0.680, p = 0.010), PTGS2 (r = −0.735, p = 0.004), and PYCARD (r = −0.564, p = 0.045) (Supplementary Figure S3). The data indicate that DNA methylation of genes and regions studied is likely to regulate gene expression.

4. Discussion

Many key cytokines and transcription factors required for the differentiation and function of central component cells of innate and adaptive immunity are epigenetically regulated; conversely, altered immune responses and inflammation can drive epigenetic reprogramming [32,33]. We set out to investigate the relationship between immunological landscapes and altered DNA methylation in colorectal tumors arising in the background of inflammation (CA-CRC) or immunological activation (LS). We observed similarities and differences that suggest in part shared and in part distinctive roles for immunological and epigenetic factors in these two disease entities.
Quantification of CD3+ and CD8+ lymphocytes in the tumor core and invasive margins has turned out useful in predicting a prognosis and the response to immunotherapy [34]. Previous immunoprofiling studies on IBD-associated CRCs arrived at conflicting results. Michael-Robinson et al. [17] observed significantly higher CD3+ and CD8+ tumor-infiltrating lymphocyte counts in IBD (UC and Crohn’s disease)-associated neoplasia compared to sporadic CRC; both groups consisted of MSS tumors. In contrast, Soh et al. [19] found that IBD-associated CRCs had significantly lower levels of cells expressing CD3, CD8, and CD274 in immune cells compared to sporadic CRC (both groups included ~15% fractions of MSI cases). The choice of antibodies, diverse cut-off values used for a positive result, and the clinicopathological features of tumors may in part explain the observed variation in results [34]. We tested several commercial antibodies for immunoprofiling, and the final selection was based on performance [15]. The ICS values of our CA-CRCs (97% of which were MSS) did not significantly differ when compared to MSS sporadic CRCs or MSI LS-CRCs from our previous investigation [15] (Table 2). However, the distributions of ICS/CD274IC categories were significantly different between CA-CRC and pMMR sporadic CRC: in CA-CRC, ICShigh/CD274pos was the most frequent category (35%), as opposed to ICSlow/CD274neg (52%) in sporadic CRC. In spite of contrasting MMR statuses, the immunological pattern of CA-CRCs resembled that of LS-CRCs to a considerable extent and no significant differences between CA-CRC and LS-CRC were seen (Table 2). This investigation was not designed to study the cellular subtype specificity of CD274 expression on immune cells. With the accuracy of IHC, we can assume that the CD274-positive immune cells in CA-CRCs were mainly macrophages, as shown previously by multilabel immunofluorescent analysis of selected CRC samples [15].
A high somatic mutational burden characteristic of MMR-deficient CRCs and POLE-mutant MMR-proficient (pMMR) CRCs has been found to correlate with a high neoantigen load and high levels of CD8+ and CD4+ T-cells, predicting responsiveness to immune checkpoint inhibitors [35]. The relationship between mutational load and ICS in our CA-CRCs did not comply with this basic rule (Figure 3). Our CA-CRCs included a hypermutant (n = 10, 37%) and a non-hypermutant subset (n = 17, 63%) [21]. The frequency of ICShigh tumors was only slightly higher in the hypermutant subset (6/10, 60%, vs. 9/17, 53%). Moreover, two tumors had especially high mutation numbers (118 and 85/Mb); both fell into the ICSlow (ICS 0–2) category (Figure 3) and were late-stage tumors (III or IV). Not all cancer types show a positive correlation between CD8 T-cell levels and tumor mutational burden, and such cancers may not respond to an immune checkpoint blockade [36].
The coordinated methylation of CpG island promoters (CIMP) represents an epigenetic mechanism able to affect many CRC-relevant genes simultaneously, including those involved in immune responses and inflammation. CIMP frequencies depend on the method and classification system used. We adopted our CIMP scoring method from Berg et al. [25] which resulted in the CIMP(+) frequency of 39% for our CA-CRCs (this frequency is within the range obtained for sporadic CRCs by Berg et al. [25]). CIMP status was not significantly associated with immunological subgroup; however, our observation of the largest proportion of CIMP(+) vs. CIMP(−) tumors falling into distinct immunological subgroups (the former into ICShigh/CD274pos vs. the latter into ICSlow/CD274neg) suggests that a possible modulating role of CIMP on immunological patterns cannot be totally excluded.
For CD274, we had methylation data on patient samples (CA-CRC and LS) and cell lines, mRNA expression data on cell lines, and protein expression data on CA-CRC tumors. In tumors, increased [37] and decreased [38] methylation relative to the corresponding normal tissues has been noted, but the difference may not always be marked [38,39] in agreement with our observations (Figure 4 and Figure 5). CD274 promoter methylation is inversely correlated with mRNA expression [20,37], in compliance with our cell line findings (Supplementary Figure S3). While CD274 mRNA and protein expression may not accurately correlate with each other [37], observations of promoter hypomethylation being associated with CD274 overexpression in cancer are especially interesting from the scientific and clinical points of view. Franzen et al. [38] dichotomized CD274 methylation levels in tumors according to the median, which resulted in CD274-low and CD274-high groups; CD274 protein positivity was significantly associated with the former group. In our CA-CRC tumors, no such association was found, which was not surprising considering the narrow distribution of CD274 methylation degrees around the median (Figure 5a).
Of inflammation-associated genes, NTSR1 showed the most evident alterations between normal mucosae and tumors in both CA-CRC and LS patients (Figure 4 and Figure 5). NTSR1 signaling has been linked to tumorigenesis in various cancers, such as lung, breast, and colon [40,41]. The signaling is involved in cancer cell proliferation, survival, migration, invasion, and metastasis [42]. NTSR1 acts like an oncogene in many cancers, but its hypermethylation in colon tumors suggests a role as a tumor suppressor as well [40]. Hypermethylation of NTSR1 in CRC was associated with less invasive growth and better overall survival in the study of Kamimae et al. [40]. The wide distribution of degrees of methylation (Dm values) in our CA-CRC tumors (Figure 5) suggested the presence of two subgroups: one with NTSR1 hypermethylation and one with hypomethylation relative to normal mucosa. Our CA-CRCs included 13 hypermethylated tumors defined as having NTSR1 Dm values equal to or higher than the average Dm in reference normal mucosae plus two standard deviations (Figure 5a). Four (31%) of the hypermethylated tumors were diagnosed at advanced stages (III or IV). Tumors with Dm equal to or below the average Dm of normal mucosae minus two standard deviations were considered hypomethylated. Among a total of four such CA-CRC tumors, two (50%) were diagnosed at advanced stages. Thus, the observed trend was in line with the suggestion of a more favorable outcome for hypermethylated than hypomethylated cases [40] and warrants additional investigations with larger sample sizes.
Molecular alterations that develop in histologically normal mucosa and have the potential to progress to dysplasia and cancer are referred to as “field defects”. Such defects are a well-recognized phenomenon in UC. Inactivating somatic mutations in genes that normally downregulate pro-inflammatory signals were recently described in the inflamed intestinal mucosa from UC patients [43]. Chronic inflammation can also epigenetically alter epithelial cells; both hypomethylated [44] and hypermethylated [45] fields have been described. Compared to genetic fields, the clonality of epigenetic field defects is difficult to assess given the reversible nature of epigenetic alterations. In our investigation, methylation levels of NTSR1 (Figure 5) and at least one of the probes for all CIMP marker genes except MLH1 (Supplementary Table S3) were significantly higher in CA-CRC-derived normal mucosae compared to LS-derived normal mucosae, suggesting the existence of hypermethylated fields in the normal mucosae from CA-CRC patients. Age-related methylation may cause field defects, but there was no age difference between our CA-CRC and LS patients (Table 1). Our CA-CRC patients showed a significantly higher average degree of IGF2 methylation in normal mucosa when compared to LS patients (Supplementary Table S3). IGF2 is one of the genes whose promoter methylation increases with aging, causing predisposition to colorectal neoplasia [46]. In our study, too, methylation levels of this gene (probe IGF2 I) increased along with age in both CA-CRC (r = 0.225) and LS tumors (r = 0.612), but significantly only in LS tumors. Our normal tissues originated from tissue blocks separate from tumors blocks (see Section 2.1), except for one that was derived from the immediate vicinity of tumorous tissue. We investigated this sample for methylation (inflammation-associated genes, CIMP, and MGMT), and this sample showed methylation degrees comparable to average normal samples from CA-CRC patients.
Available results concerning the methylation of the repair gene MGMT in UC-related tumorigenesis are inconsistent. Svrcek et al. [47] detected a loss of MGMT protein expression in colonic mucosa from over 70% of IBD patients (with or without CRC), which significantly exceeded the frequencies observed in CRC patients without IBD. MGMT promoter methylation by methylation-specific PCR (a qualitative method) showed an inverse correlation with expression, although apparently discrepant cases (loss of expression without methylation and expressed protein despite promoter methylation) were also seen, especially in CA-CRC patients [47]. Svrcek et al. [47] hypothesized that an MGMT field defect may trigger CRC through G:C to A:T mismatches targeting KRAS, or through MLH1 methylation and deficient MMR. On the other hand, studies exist in which no difference in MGMT methylation between UC-related and non-inflammatory colon tumorigenesis pathways was observed [48,49]. In our investigation, MGMT methylation did not significantly differ between normal mucosa and tumor tissues, arguing against a major role of MGMT in UC-related colon tumorigenesis. Possible dilution with normal cells was unlikely to explain the lack of hypermethylation in tumor cells since we observed no correlation when tumor cell percentage was plotted against methylation degrees of MGMT probes. A few CA-CRC patients showed very high methylation levels in normal mucosa (Figure 6a), possibly serving as field defects in those patients. Interestingly, the case marked with a solid arrow in Figure 6a had a somatic KRAS G>A substitution (Gly12Asp mutation, ref. [21]) in tumor tissue, supporting the hypothesis of Svrcek et al. [47].
Our CA-CRC and LS samples were formalin-fixed, paraffin-embedded (FFPE), and the chosen approaches were tailored to archival samples. Limitations of this study include relatively small sample sizes and a reliance on targeted methylation data. Additionally, the correlation between methylation and expression could be addressed by cell line studies alone instead of patient specimens. Furthermore, many of our CA-CRC patients had received immunosuppressive medication, and stratification by treatment history was not possible. Our findings need to be confirmed in larger cohorts of CA-CRC patients, preferably taking treatment histories into account.
In conclusion, our study revealed, first, ICShigh/CD274pos as the most frequent immunological subcategory in CA-CRCs, thereby resembling LS-CRCs, and second, frequent epigenetic field defects in non-neoplastic mucosa of CA-CRC patients. From the clinical point of view, the immunological subtype may be relevant for immunotherapy [35]. Epigenetic field defects may provide early biomarkers of carcinogenesis and identify UC patients who might benefit from more intensive surveillance [50].

Supplementary Materials

The following are available online at https://www.mdpi.com/article/10.3390/biom11101440/s1, Figure S1: Illustration of CpG islands and investigated genomic regions of inflammation-associated genes included in the MS-MLPA panel, Figure S2: NTSR1 cloning experiment compared to MS-MLPA, Figure S3: Correlation between expression and methylation of inflammation-associated genes in cell lines, Table S1: MS-MLPA probes, Table S2: Cut-off methylation dosage ratios for hypermethylation, Table S3: Average methylation dosage ratios and their standard deviations of each CIMP markers, Table S4: Average methylation dosage ratios and standard deviations of each MGMT probe, Table S5: Methylation dosage ratios of inflammation-associated genes in cancer cell lines, Table S6: Bisulfite sequencing primers.

Author Contributions

Conceptualization, S.M.-N. and P.P.; methodology, S.M.-N. and P.P.; formal analysis, S.M.-N., S.U. and E.-V.W.; investigation, S.M.-N., S.U. and M.A.; resources, J.-P.M., T.T.S., A.L. and A.R.; data curation, S.M.-N.; writing—original draft preparation, S.M.-N.; writing—review and editing, P.P., E.-V.W., J.-P.M., T.T.S.; visualization, S.M.-N.; supervision, P.P.; project administration, P.P. and S.M.-N.; funding acquisition, P.P., J.-P.M., T.T.S., S.M.-N. and A.R. All authors have read and agreed to the published version of the manuscript.

Funding

This study was funded by Jane and Aatos Erkko Foundation (to P.P., J.-P.M. and T.T.S.); the Academy of Finland (grant numbers 330606 to P.P. and 331284 to S.M.-N.); the Finnish Cancer Foundation (to P.P., J.-P.M., T.T.S. and A.R.); Finnish Medical Foundation (to T.T.S.); Emil Aaltonen Foundation (to T.T.S.); the Sigrid Juselius Foundation (to P.P., T.T.S. and A.R.) and the HiLIFE Fellows 2017–2020 (to P.P.).

Institutional Review Board Statement

The Institutional Review Boards of the Helsinki University Central Hospital (466/E6/01, 2 October 2001 and amendment 17 December 2008), Jyväskylä Central Hospital (Dnro 10U/2011, 3 May 2011) and the Central Finland Health Care District (K-S shp Dnro4/2011) approved this research. The National Authority for Medicolegal Affairs (Dnro 1272/04/044/07) and the National Supervisory Authority for Welfare and Health (Valvira/Dnro 10741/06.01.03.01/2015, 14 January 2016) approved the collection of archival specimens. The study was conducted according to the guidelines of the Declaration of Helsinki.

Informed Consent Statement

In acquisition of samples and patient information, the guidelines of our ethics approvals were followed, including informed consent procedures when applicable.

Data Availability Statement

The mRNA expression profiling data is publicly available at the GEO (accession number: GSE58058). The original methylation datasets used and/or analyzed during the current study are available from the corresponding author on reasonable request.

Acknowledgments

We thank Satu Valo for coordinating UC sample collection and sharing her expertise in MS-MLPA panel design, Saila Saarinen for technical support, Pauliina Paloviita for Master’s thesis data on murine genes associated with inflammation and immune responses, and Noora Porkka for assistance in preparing display items for this paper. We also thank the Core facility Sequencing Unit at FIMM Technology Centre supported by University of Helsinki and Biocenter Finland for the sequencing facilities.

Conflicts of Interest

The authors declare no conflict of interest. The funders had no role in the design of the study; in the collection, analyses, or interpretation of data; in the writing of the manuscript, or in the decision to publish the results.

References

  1. Terzić, J.; Grivennikov, S.; Karin, E.; Karin, M. Inflammation and colon cancer. Gastroenterology 2010, 138, 2101–2114.e5. [Google Scholar] [CrossRef]
  2. Al Bakir, I.; Curtius, K.; Graham, T.A. From Colitis to Cancer: An Evolutionary Trajectory That Merges Maths and Biology. Front. Immunol. 2018, 9, 2368. [Google Scholar] [CrossRef]
  3. Rogler, G. Chronic ulcerative colitis and colorectal cancer. Cancer Lett. 2014, 345, 235–241. [Google Scholar] [CrossRef] [Green Version]
  4. Hartnett, L.; Egan, L.J. Inflammation, DNA methylation and colitis-associated cancer. Carcinogenesis 2012, 33, 723–731. [Google Scholar] [CrossRef]
  5. Watanabe, T.; Konishi, T.; Kishimoto, J.; Kotake, K.; Muto, T.; Sugihara, K.; the Japanese Society for Cancer of the Colon and Rectum. Ulcerative colitis-associated colorectal cancer shows a poorer survival than sporadic colorectal cancer: A nationwide Japanese study. Inflamm. Bowel Dis. 2011, 17, 802–808. [Google Scholar] [CrossRef]
  6. Drescher, K.M.; Sharma, P.; Lynch, H.T. Current hypotheses on how microsatellite instability leads to enhanced survival of Lynch Syndrome patients. Clin. Dev. Immunol. 2010, 2010, 170432. [Google Scholar] [CrossRef] [PubMed] [Green Version]
  7. Møller, P.; Seppala, T.T.; Bernstein, I.; Holinski-Feder, E.; Sala, P.; Gareth Evans, D.; Lindblom, A.; Macrae, F.; Blanco, I.; Sijmons, R.H.; et al. Cancer risk and survival in path_MMR carriers by gene and gender up to 75 years of age: A report from the Prospective Lynch Syndrome Database. Gut 2018, 67, 1306–1316. [Google Scholar] [CrossRef] [Green Version]
  8. Thompson, B.A.; Spurdle, A.B.; Plazzer, J.P.; Greenblatt, M.S.; Akagi, K.; Al-Mulla, F.; Bapat, B.; Bernstein, I.; Capella, G.; den Dunnen, J.T.; et al. Application of a 5-tiered scheme for standardized classification of 2,360 unique mismatch repair gene variants in the InSiGHT locus-specific database. Nat. Genet. 2014, 46, 107–115. [Google Scholar] [CrossRef] [PubMed] [Green Version]
  9. Ligtenberg, M.J.; Kuiper, R.P.; Chan, T.L.; Goossens, M.; Hebeda, K.M.; Voorendt, M.; Lee, T.Y.; Bodmer, D.; Hoenselaar, E.; Hendriks-Cornelissen, S.J.; et al. Heritable somatic methylation and inactivation of MSH2 in families with Lynch syndrome due to deletion of the 3′ exons of TACSTD1. Nat. Genet. 2009, 41, 112–117. [Google Scholar] [CrossRef] [PubMed]
  10. Cejka, P.; Stojic, L.; Mojas, N.; Russell, A.M.; Heinimann, K.; Cannavo, E.; di Pietro, M.; Marra, G.; Jiricny, J. Methylation-induced G(2)/M arrest requires a full complement of the mismatch repair protein hMLH1. EMBO J. 2003, 22, 2245–2254. [Google Scholar] [CrossRef] [Green Version]
  11. Wang, L.; Tsutsumi, S.; Kawaguchi, T.; Nagasaki, K.; Tatsuno, K.; Yamamoto, S.; Sang, F.; Sonoda, K.; Sugawara, M.; Saiura, A.; et al. Whole-exome sequencing of human pancreatic cancers and characterization of genomic instability caused by MLH1 haploinsufficiency and complete deficiency. Genome Res. 2012, 22, 208–219. [Google Scholar] [CrossRef] [Green Version]
  12. Dominguez-Valentin, M.; Seppala, T.T.; Sampson, J.R.; Macrae, F.; Winship, I.; Evans, D.G.; Scott, R.J.; Burn, J.; Moslein, G.; Bernstein, I.; et al. Survival by colon cancer stage and screening interval in Lynch syndrome: A prospective Lynch syndrome database report. Hered. Cancer Clin. Pract. 2019, 17, 28. [Google Scholar] [CrossRef] [PubMed] [Green Version]
  13. Biller, L.H.; Syngal, S.; Yurgelun, M.B. Recent advances in Lynch syndrome. Fam. Cancer 2019, 18, 211–219. [Google Scholar] [CrossRef] [PubMed]
  14. Pages, F.; Mlecnik, B.; Marliot, F.; Bindea, G.; Ou, F.S.; Bifulco, C.; Lugli, A.; Zlobec, I.; Rau, T.T.; Berger, M.D.; et al. International validation of the consensus Immunoscore for the classification of colon cancer: A prognostic and accuracy study. Lancet 2018, 391, 2128–2139. [Google Scholar] [CrossRef]
  15. Ahtiainen, M.; Wirta, E.V.; Kuopio, T.; Seppala, T.; Rantala, J.; Mecklin, J.P.; Bohm, J. Combined prognostic value of CD274 (PD-L1)/PDCDI (PD-1) expression and immune cell infiltration in colorectal cancer as per mismatch repair status. Mod. Pathol. 2019, 32, 866–883. [Google Scholar] [CrossRef]
  16. Wirta, E.V.; Seppala, T.; Friman, M.; Vayrynen, J.; Ahtiainen, M.; Kautiainen, H.; Kuopio, T.; Kellokumpu, I.; Mecklin, J.P.; Bohm, J. Immunoscore in mismatch repair-proficient and -deficient colon cancer. J. Pathol. Clin. Res. 2017, 3, 203–213. [Google Scholar] [CrossRef]
  17. Michael-Robinson, J.M.; Pandeya, N.; Walsh, M.D.; Biemer-Huttmann, A.E.; Eri, R.D.; Buttenshaw, R.L.; Lincoln, D.; Clouston, A.D.; Jass, J.R.; Radford-Smith, G.L. Characterization of tumour-infiltrating lymphocytes and apoptosis in colitis-associated neoplasia: Comparison with sporadic colorectal cancer. J. Pathol. 2006, 208, 381–387. [Google Scholar] [CrossRef]
  18. Rajamaki, K.; Taira, A.; Katainen, R.; Valimaki, N.; Kuosmanen, A.; Plaketti, R.M.; Seppala, T.T.; Ahtiainen, M.; Wirta, E.V.; Vartiainen, E.; et al. Genetic and epigenetic characteristics of inflammatory bowel disease associated colorectal cancer. Gastroenterology 2021. [Google Scholar] [CrossRef]
  19. Soh, J.S.; Jo, S.I.; Lee, H.; Do, E.J.; Hwang, S.W.; Park, S.H.; Ye, B.D.; Byeon, J.S.; Yang, S.K.; Kim, J.H.; et al. Immunoprofiling of Colitis-associated and Sporadic Colorectal Cancer and its Clinical Significance. Sci. Rep. 2019, 9, 6833. [Google Scholar] [CrossRef] [Green Version]
  20. Goltz, D.; Gevensleben, H.; Dietrich, J.; Dietrich, D. PD-L1 (CD274) promoter methylation predicts survival in colorectal cancer patients. Oncoimmunology 2017, 6, e1257454. [Google Scholar] [CrossRef] [Green Version]
  21. Maki-Nevala, S.; Ukwattage, S.; Olkinuora, A.; Almusa, H.; Ahtiainen, M.; Ristimaki, A.; Seppala, T.; Lepisto, A.; Mecklin, J.P.; Peltomaki, P. Somatic mutation profiles as molecular classifiers of ulcerative colitis-associated colorectal cancer. Int. J. Cancer 2021, 148, 2997–3007. [Google Scholar] [CrossRef]
  22. Isola, J.; DeVries, S.; Chu, L.; Ghazvini, S.; Waldman, F. Analysis of changes in DNA sequence copy number by comparative genomic hybridization in archival paraffin-embedded tumor samples. Am. J. Pathol. 1994, 145, 1301–1308. [Google Scholar]
  23. Bankhead, P.; Loughrey, M.B.; Fernandez, J.A.; Dombrowski, Y.; McArt, D.G.; Dunne, P.D.; McQuaid, S.; Gray, R.T.; Murray, L.J.; Coleman, H.G.; et al. QuPath: Open source software for digital pathology image analysis. Sci. Rep. 2017, 7, 16878. [Google Scholar] [CrossRef] [Green Version]
  24. Valo, S.; Kaur, S.; Ristimaki, A.; Renkonen-Sinisalo, L.; Jarvinen, H.; Mecklin, J.P.; Nystrom, M.; Peltomaki, P. DNA hypermethylation appears early and shows increased frequency with dysplasia in Lynch syndrome-associated colorectal adenomas and carcinomas. Clin. Epigenetics 2015, 7, 71. [Google Scholar] [CrossRef] [Green Version]
  25. Berg, M.; Hagland, H.R.; Soreide, K. Comparison of CpG island methylator phenotype (CIMP) frequency in colon cancer using different probe- and gene-specific scoring alternatives on recommended multi-gene panels. PLoS ONE 2014, 9, e86657. [Google Scholar] [CrossRef] [PubMed] [Green Version]
  26. Weisenberger, D.J.; Siegmund, K.D.; Campan, M.; Young, J.; Long, T.I.; Faasse, M.A.; Kang, G.H.; Widschwendter, M.; Weener, D.; Buchanan, D.; et al. CpG island methylator phenotype underlies sporadic microsatellite instability and is tightly associated with BRAF mutation in colorectal cancer. Nat. Genet. 2006, 38, 787–793. [Google Scholar] [CrossRef] [PubMed]
  27. UCSC Genome Browser. Available online: http://genome-euro.ucsc.edu/cgi-bin/hgGateway (accessed on 18 May 2018).
  28. Niskakoski, A.; Kaur, S.; Staff, S.; Renkonen-Sinisalo, L.; Lassus, H.; Jarvinen, H.J.; Mecklin, J.P.; Butzow, R.; Peltomaki, P. Epigenetic analysis of sporadic and Lynch-associated ovarian cancers reveals histology-specific patterns of DNA methylation. Epigenetics 2014, 9, 1577–1587. [Google Scholar] [CrossRef] [PubMed] [Green Version]
  29. Teng, M.W.; Ngiow, S.F.; Ribas, A.; Smyth, M.J. Classifying Cancers Based on T-cell Infiltration and PD-L1. Cancer Res. 2015, 75, 2139–2145. [Google Scholar] [CrossRef] [PubMed] [Green Version]
  30. Ahlquist, T.; Lind, G.E.; Costa, V.L.; Meling, G.I.; Vatn, M.; Hoff, G.S.; Rognum, T.O.; Skotheim, R.I.; Thiis-Evensen, E.; Lothe, R.A. Gene methylation profiles of normal mucosa, and benign and malignant colorectal tumors identify early onset markers. Mol. Cancer 2008, 7, 94. [Google Scholar] [CrossRef] [PubMed] [Green Version]
  31. Qian, X.C.; Brent, T.P. Methylation hot spots in the 5′ flanking region denote silencing of the O6-methylguanine-DNA methyltransferase gene. Cancer Res. 1997, 57, 3672–3677. [Google Scholar] [PubMed]
  32. Däbritz, J.; Menheniott, T.R. Linking immunity, epigenetics, and cancer in inflammatory bowel disease. Inflamm. Bowel Dis. 2014, 20, 1638–1654. [Google Scholar] [CrossRef] [PubMed] [Green Version]
  33. Yasmin, R.; Siraj, S.; Hassan, A.; Khan, A.R.; Abbasi, R.; Ahmad, N. Epigenetic regulation of inflammatory cytokines and associated genes in human malignancies. Mediat. Inflamm. 2015, 2015, 201703. [Google Scholar] [CrossRef]
  34. Yan, L.; Meizhi, H.; Yaoyao, Z.; Chen, Y.; Shuyi, W.; Xiaohui, B.; Odong, C.; Lang, X. The Prognostic and Clinicopathological Roles of PD-L1 Expression in Colorectal Cancer: A Systematic Review and Meta-Analysis. Front. Pharmacol. 2019, 28, 139. [Google Scholar] [CrossRef] [Green Version]
  35. Picard, E.; Verschoor, C.P.; Ma, G.W.; Pawelec, G. Relationships between Immune Landscapes, Genetic Subtypes and Responses to Immunotherapy in Colorectal Cancer. Front. Immunol. 2020, 11, 369. [Google Scholar] [CrossRef]
  36. McGrail, D.J.; Pilie, P.G.; Rashid, N.U.; Voorwerk, L.; Slagter, M.; Kok, M.; Jonasch, E.; Khasraw, M.; Heimberger, A.B.; Lim, B.; et al. High tumor mutation burden fails to predict immune checkpoint blockade response across all cancer types. Ann. Oncol. 2021, 32, 661–672. [Google Scholar] [CrossRef]
  37. Gevensleben, H.; Holmes, E.E.; Goltz, D.; Dietrich, J.; Sailer, V.; Ellinger, J.; Dietrich, D.; Kristiansen, G. PD-L1 promoter methylation is a prognostic biomarker for biochemical recurrence-free survival in prostate cancer patients following radical prostatectomy. Oncotarget 2016, 7, 79943–79955. [Google Scholar] [CrossRef] [PubMed]
  38. Franzen, A.; Vogt, T.J.; Muller, T.; Dietrich, J.; Schrock, A.; Golletz, C.; Brossart, P.; Bootz, F.; Landsberg, J.; Kristiansen, G.; et al. PD-L1 (CD274) and PD-L2 (PDCD1LG2) promoter methylation is associated with HPV infection and transcriptional repression in head and neck squamous cell carcinomas. Oncotarget 2018, 9, 641–650. [Google Scholar] [CrossRef] [Green Version]
  39. Marwitz, S.; Scheufele, S.; Perner, S.; Reck, M.; Ammerpohl, O.; Goldmann, T. Epigenetic modifications of the immune-checkpoint genes CTLA4 and PDCD1 in non-small cell lung cancer results in increased expression. Clin. Epigenetics 2017, 9, 51. [Google Scholar] [CrossRef] [PubMed]
  40. Kamimae, S.; Yamamoto, E.; Kai, M.; Niinuma, T.; Yamano, H.O.; Nojima, M.; Yoshikawa, K.; Kimura, T.; Takagi, R.; Harada, E.; et al. Epigenetic silencing of NTSR1 is associated with lateral and noninvasive growth of colorectal tumors. Oncotarget 2015, 6, 29975–29990. [Google Scholar] [CrossRef] [Green Version]
  41. Wu, Z.; Martinez-Fong, D.; Tredaniel, J.; Forgez, P. Neurotensin and its high affinity receptor 1 as a potential pharmacological target in cancer therapy. Front. Endocrinol. 2012, 3, 184. [Google Scholar] [CrossRef] [PubMed] [Green Version]
  42. Ouyang, Q.; Zhou, J.; Yang, W.; Cui, H.; Xu, M.; Yi, L. Oncogenic role of neurotensin and neurotensin receptors in various cancers. Clin. Exp. Pharmacol. Physiol. 2017, 44, 841–846. [Google Scholar] [CrossRef] [Green Version]
  43. Kakiuchi, N.; Yoshida, K.; Uchino, M.; Kihara, T.; Akaki, K.; Inoue, Y.; Kawada, K.; Nagayama, S.; Yokoyama, A.; Yamamoto, S.; et al. Frequent mutations that converge on the NFKBIZ pathway in ulcerative colitis. Nature 2020, 577, 260–265. [Google Scholar] [CrossRef] [PubMed]
  44. Hahn, M.A.; Li, A.X.; Wu, X.; Yang, R.; Drew, D.A.; Rosenberg, D.W.; Pfeifer, G.P. Loss of the polycomb mark from bivalent promoters leads to activation of cancer-promoting genes in colorectal tumors. Cancer Res. 2014, 74, 3617–3629. [Google Scholar] [CrossRef] [Green Version]
  45. Kang, K.; Bae, J.H.; Han, K.; Kim, E.S.; Kim, T.O.; Yi, J.M. A Genome-Wide Methylation Approach Identifies a New Hypermethylated Gene Panel in Ulcerative Colitis. Int. J. Mol. Sci. 2016, 17, 1291. [Google Scholar] [CrossRef] [PubMed]
  46. Issa, J.P.; Ahuja, N.; Toyota, M.; Bronner, M.P.; Brentnall, T.A. Accelerated age-related CpG island methylation in ulcerative colitis. Cancer Res. 2001, 61, 3573–3577. [Google Scholar] [PubMed]
  47. Svrcek, M.; Buhard, O.; Colas, C.; Coulet, F.; Dumont, S.; Massaoudi, I.; Lamri, A.; Hamelin, R.; Cosnes, J.; Oliveira, C.; et al. Methylation tolerance due to an O6-methylguanine DNA methyltransferase (MGMT) field defect in the colonic mucosa: An initiating step in the development of mismatch repair-deficient colorectal cancers. Gut 2010, 59, 1516–1526. [Google Scholar] [CrossRef]
  48. Scarpa, M.; Scarpa, M.; Castagliuolo, I.; Erroi, F.; Kotsafti, A.; Basato, S.; Brun, P.; D’Inca, R.; Rugge, M.; Angriman, I.; et al. Aberrant gene methylation in non-neoplastic mucosa as a predictive marker of ulcerative colitis-associated CRC. Oncotarget 2016, 7, 10322–10331. [Google Scholar] [CrossRef] [Green Version]
  49. Konishi, K.; Shen, L.; Wang, S.; Meltzer, S.J.; Harpaz, N.; Issa, J.P. Rare CpG island methylator phenotype in ulcerative colitis-associated neoplasias. Gastroenterology 2007, 132, 1254–1260. [Google Scholar] [CrossRef]
  50. Zeng, Z.; Mukherjee, A.; Zhang, H. From Genetics to Epigenetics, Roles of Epigenetics in Inflammatory Bowel Disease. Front. Genet. 2019, 10, 1017. [Google Scholar] [CrossRef] [Green Version]
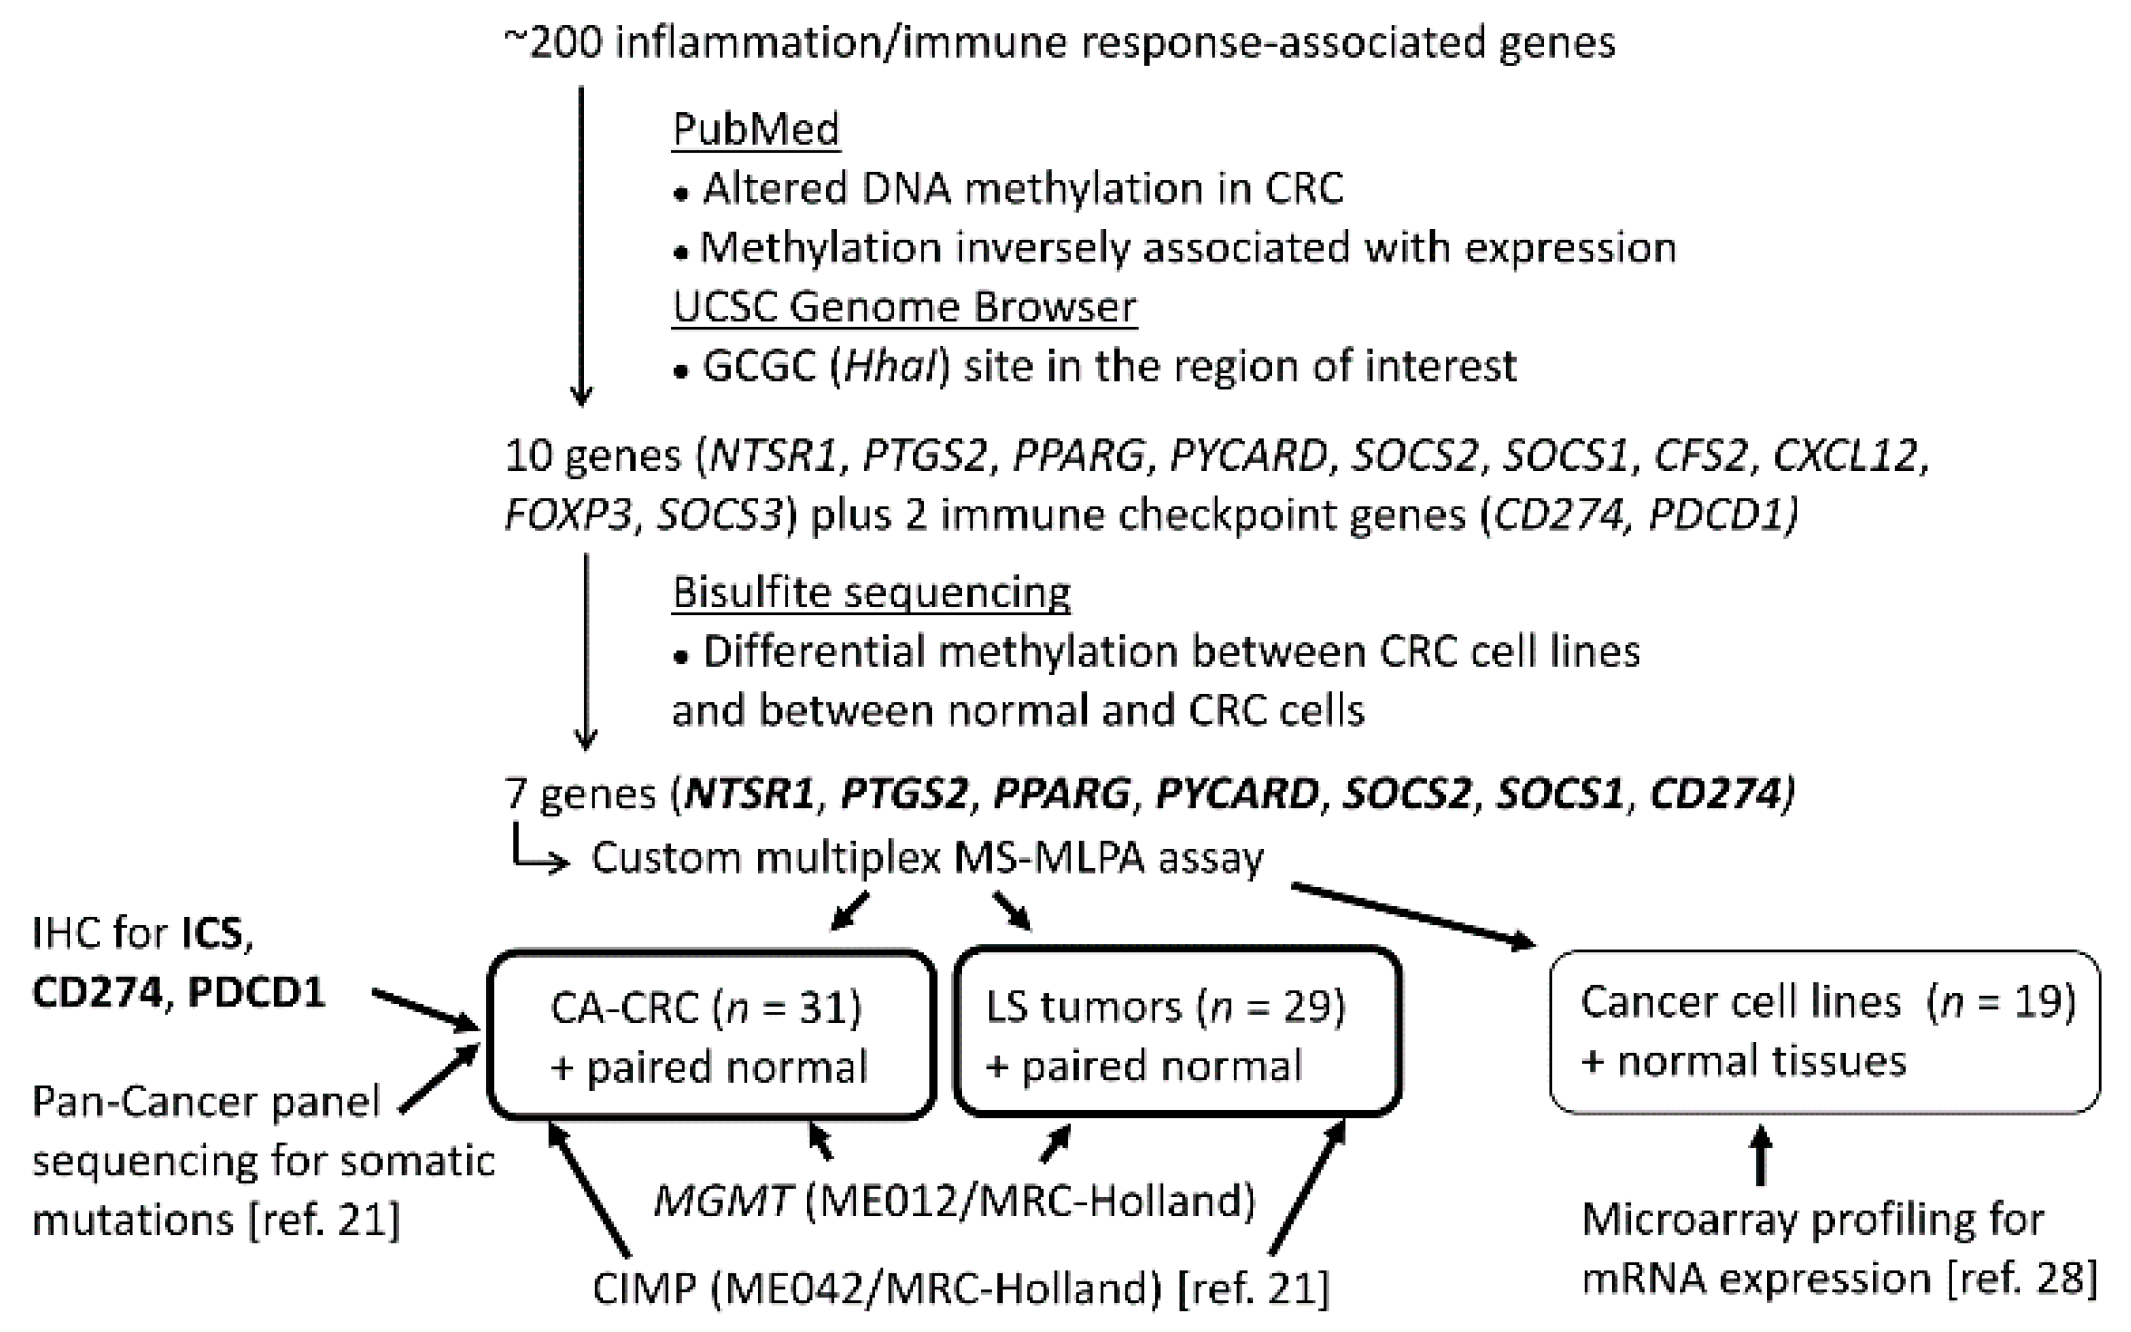
Figure 1. Flow chart of this investigation.
Biomolecules 11 01440 g001
Figure 2. IHC staining of immunoproteins. Examples of (a) CD3 high, (b) CD3 low, (c) CD8 high, (d) CD8 low, (e) PDCD1 high, (f) PDCD1 low, (g) CD274 (IC) high and (h) CD274 (IC) low expressions. Black bars in the right bottom corners indicate the size of 500 µm.
Biomolecules 11 01440 g002
Figure 3. Somatic mutation rates plotted against ICS in CA-CRC. Somatic mutations consisted of somatic non-synonymous mutations with VarScan2 (Genome Institute, Washington University, St. Louis, MO, USA) p value < 0.05 (27 tumors sequenced in our previous study were included in this analysis).
Biomolecules 11 01440 g003
Figure 4. Hypermethylation frequencies of inflammation-associated genes. (a) Hypermethylation frequencies in CA-CRC samples. (b) Hypermethylation frequencies in LS-associated samples. Bonferroni-corrected two-sided p values are presented in the tables below for pairwise comparisons, and ns stands for non-significant p value. Missing frequency values of the normal sample group indicate the hypermethylation frequency of 0%.
Biomolecules 11 01440 g004
Figure 5. Comparison of the degrees of methylation of inflammation-associated genes in normal colon and tumor specimens. (a) Distribution of methylation dosage (Dm) values in CA-CRC samples. (b) Distribution of methylation dosage values in LS samples. The upper and lower edges of the boxes are the 75th and 25th percentiles, the horizontal line inside the box indicates the median, the whiskers denote the highest and lowest values, and the asterisks and open circles represent outliers: extreme values and potential outliers, respectively (based on the interquartile range (IQR)). Bonferroni-corrected two-sided p values are presented in the tables below for pairwise comparisons, and ns stands for non-significant p value.
Biomolecules 11 01440 g005
Figure 6. MGMT methylation in normal mucosa specimens. (a) Methylation degrees in normal colon of CA-CRC patients. (b) Methylation degrees in normal colon and LS patients. Arrows in Figure 6a denote cases discussed in the text, with higher Dm values in normal than tumor tissues. The upper and lower edges of the boxes are the 75th and 25th percentiles, the horizontal line inside the box indicates the median, the whiskers denote the highest and lowest values, and the asterisks and open circles represent outliers: extreme values and potential outliers, respectively (based on the interquartile range (IQR)).
Biomolecules 11 01440 g006
Table 1. Characteristics of the patient samples.
CharacteristicsCA-CRCLS Tumors Combined 1LS Adenomas
(High-Grade Dysplasia)
LS Carcinomasp Value CA-CRC vs. LS Tumors Combined 1
No. of patients31241412NA
Male sex 220 (64%)9 (38%)5 (40%)5 (42%)0.060
Age, years (mean ± SD) 251.4 (±10.7)51.2 (±14.1)49.2 (±15.2)53.6 (±12.3)0.948
Years of colitis before CRC diagnosis (mean ± SD) 223.8 (±10.8) 3---NA
Gene mutated in germline 2
MLH1-18 (75%)12 (86%)8 (67%)NA
MSH2-3 (13%)1 (7%)2 (17%)NA
MSH6-3 (13%)1 (7%)2 (17%)NA
No. of tumors31291415NA
MSI tumors1 (3%)29 (100%) 414 (100%) 415 (100%) 4<0.00001
CIMP(+) tumors12 (39%)7 (24%)2 (14%)5 (33%)0.274
Tumor location
Proximal 513 (42%)17 (59%)6 (43%)11 (73%)0.431
Distal15 (48%)12 (41%)8 (57%)4 (27%)
NA3 (10%)000
Stage of carcinomas
I13 (42%)10 (67%)-10 (67%)0.190
II6 (19%)3 (20%)-3 (20%)
III9 (29%)1 (7%)-1 (7%)
IV3 (10%)0-0
NA01 (7%)-1 (7%)
1: LS-associated adenomas and carcinomas combined. 2: Calculated per patients. 3: Information for eight cases not available. 4: MSI information for one adenoma and three carcinoma cases not available, but immunohistochemical analysis suggested MMR defect in the samples. 5: From caecum to splenic flexure (included). Note regarding LS samples: Multiple samples were available from three LS patients (three carcinomas and two carcinomas from one patient each, and a carcinoma plus adenoma from two patients each). If sampling took place at different time points (metachronous neoplasias), different ages were included in the calculation of age at diagnosis. Abbreviations: CA-CRC, colitis-associated colorectal cancer; CIMP, CpG island methylator phenotype; CRC, colorectal cancer; LS, Lynch syndrome; MSI, microsatellite unstable; NA, not available or applicable; SD, standard deviation.
Table 2. PDCD1, CD274, and ICSs in CA-CRC (this study), compared with sporadic pMMR-CRC and LS-CRC from our previous investigation.
Ahtiainen et al. [15]p Value
Immunoprofile Characteristics CA-CRCpMMR-CRCLS-CRCCA-CRC vs.
(n = 31)(n = 100)(n = 48)pMMR-CRCLS-CRC
PDCD1 1
Low 13 (42%)5117 (35%)nsns
High18 (58%)4931 (65%)
CD274 on tumor cells
Negative31 (100%)9945 (94%)nsns
Positive013 (6%)
CD274 on immune cells
Negative15 (48%)7018 (37%)0.033ns
Positive16 (52%)3030 (63%)
ICS
Low (0–2)14 (45%) 26013 (27%)nsns
High (3–4)17 (55%) 34035 (73%)
ICS/CD274IC (immunological group) 4
ICShigh/CD274pos (type I)11 (35%)1621 (44%)0.023ns
ICSlow/CD274neg (type II)9 (29%)529 (19%)
ICShigh/CD274neg (type III)6 (19%)2514 (29%)
ICSlow/CD274pos (type IV)5 (16%)74 (8%)
1: PDCD1 classification was based on PDCD1-positive lymphocytes in tumor center (cut-off 57 cells/mm2 for CA-CRC and 55 cells/mm2 for the remaining groups), 2: ICS was 0 for 7 (23%), 1 for 3 (10%), and 2 for 4 (13%) CA-CRCs. 3: ICS was 3 for 5 (16%) and 4 for 12 (38%) CA-CRCs. 4: CD274 expression in tumor-infiltrating immune cells. Abbreviations: IC, immune cell; pMMR, MMR-proficient; ns, non-significant.
Publisher’s Note: MDPI stays neutral with regard to jurisdictional claims in published maps and institutional affiliations.