A 3D Tissue Model of Traumatic Brain Injury with Excitotoxicity That Is Inhibited by Chronic Exposure to Gabapentinoids

 ,
,  ,
,  and
and 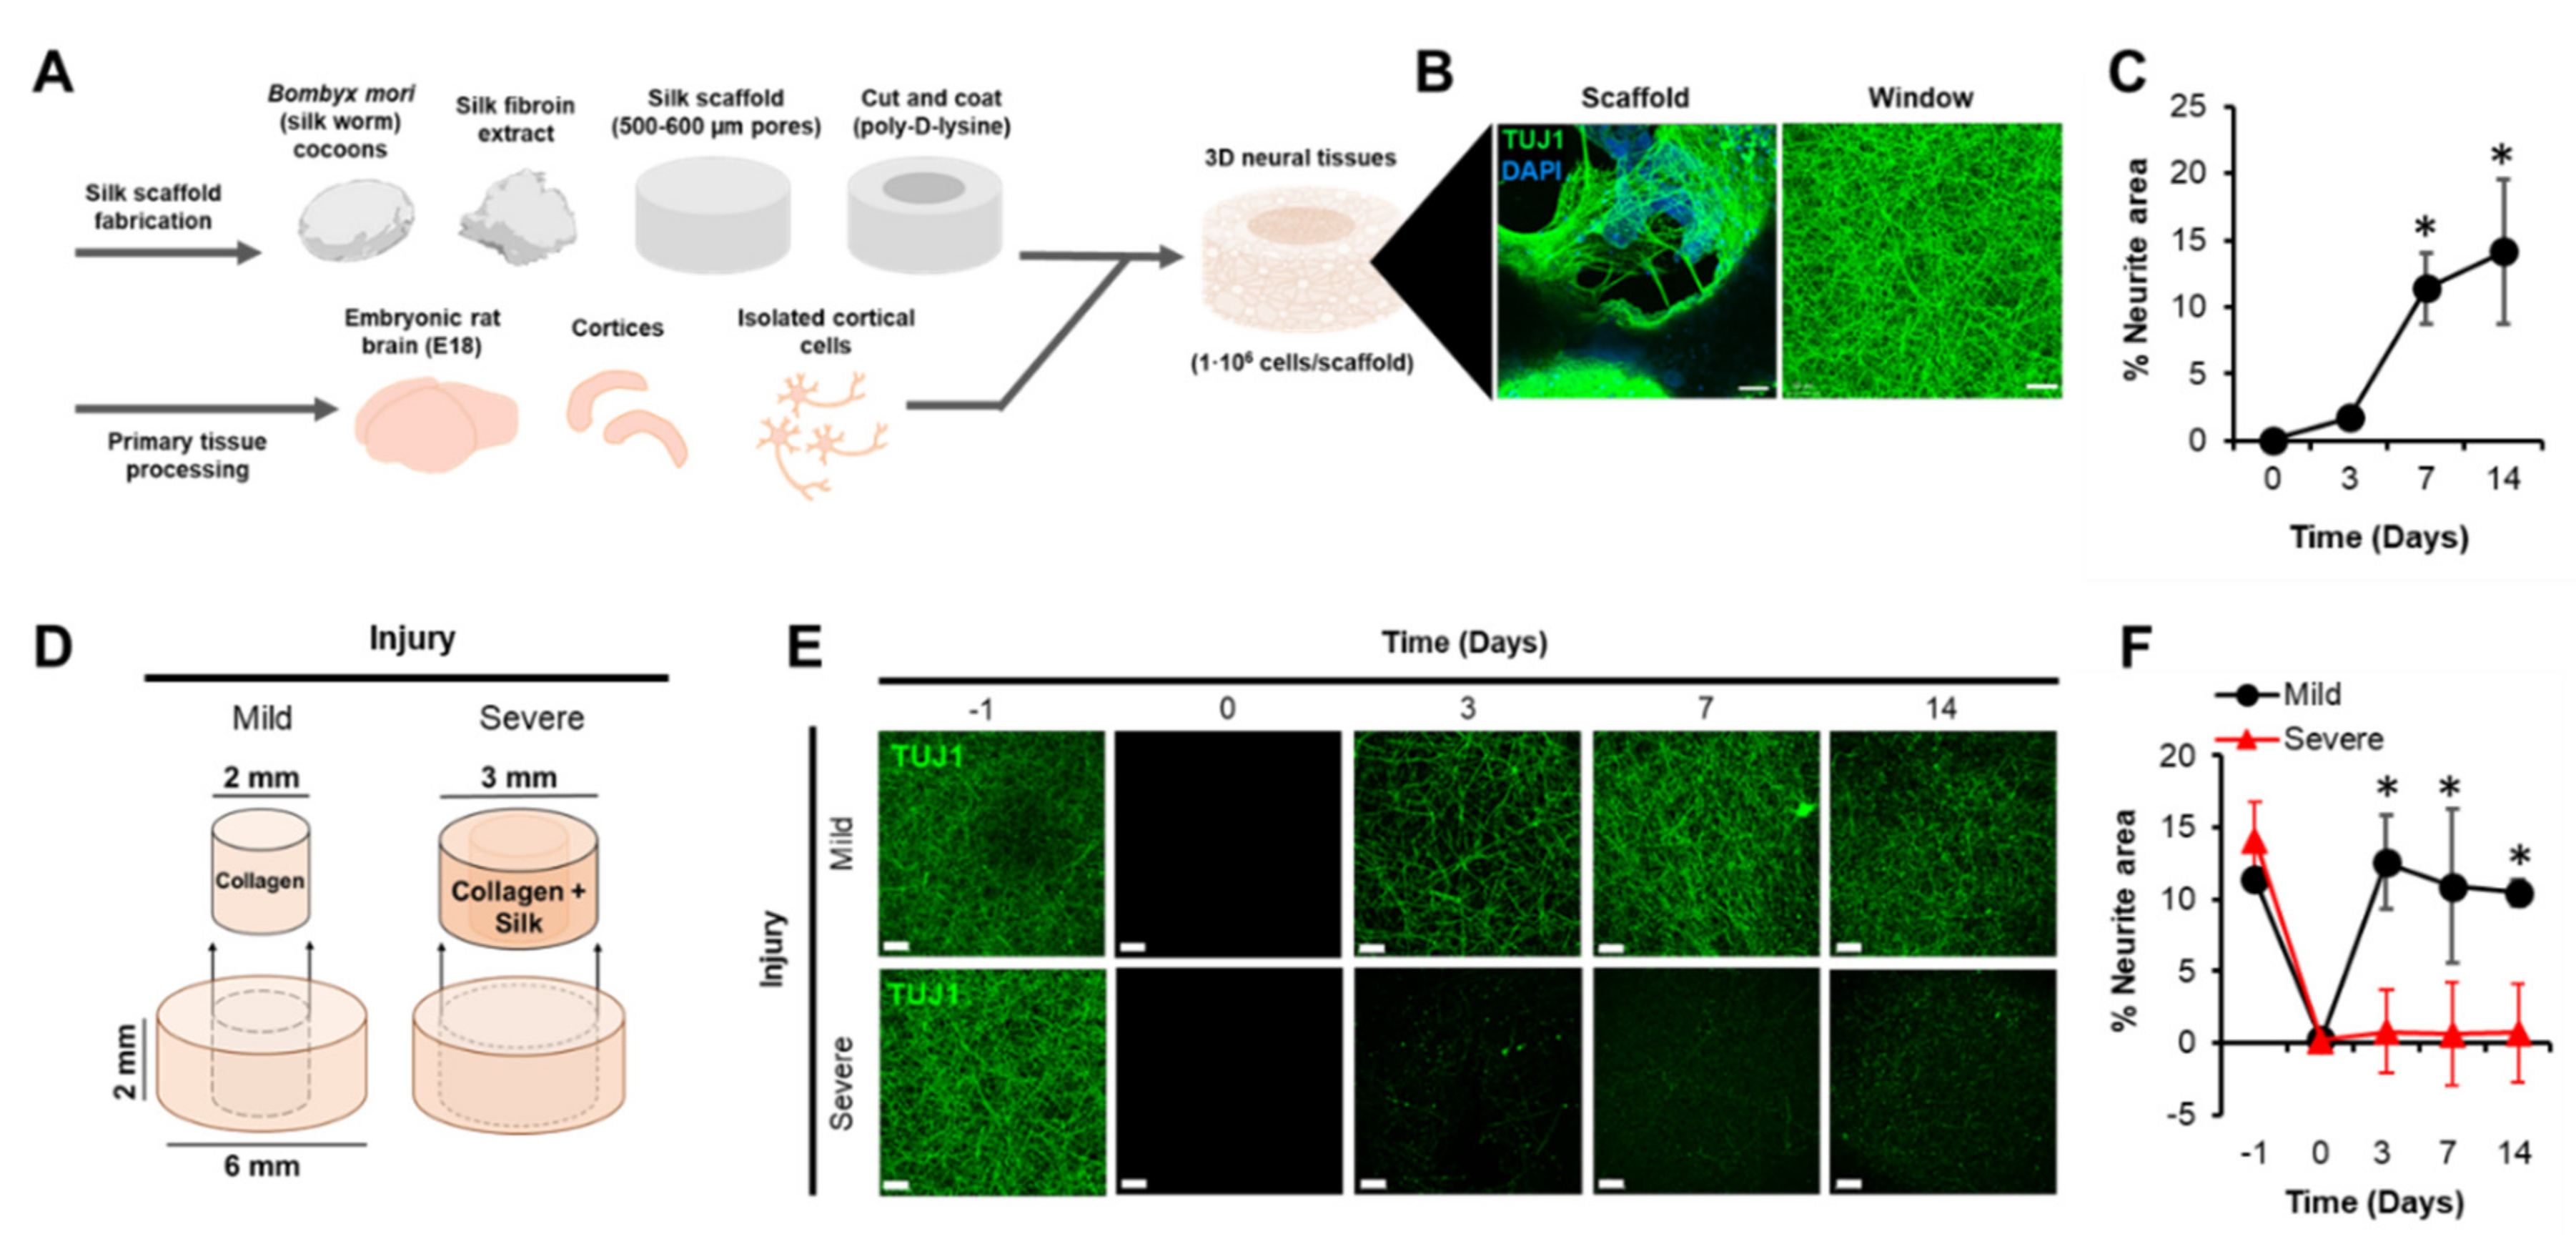
Abstract
1. Introduction
2. Methods and Materials
2.1. 3D Neural Tissue Fabrication
2.2. Laceration Procedure
2.3. Treatments
2.4. DNA Quantification
2.5. Glutamate Quantification
2.6. Immunocytochemistry
2.7. Live Cell Imaging
2.8. Local Field Potentials
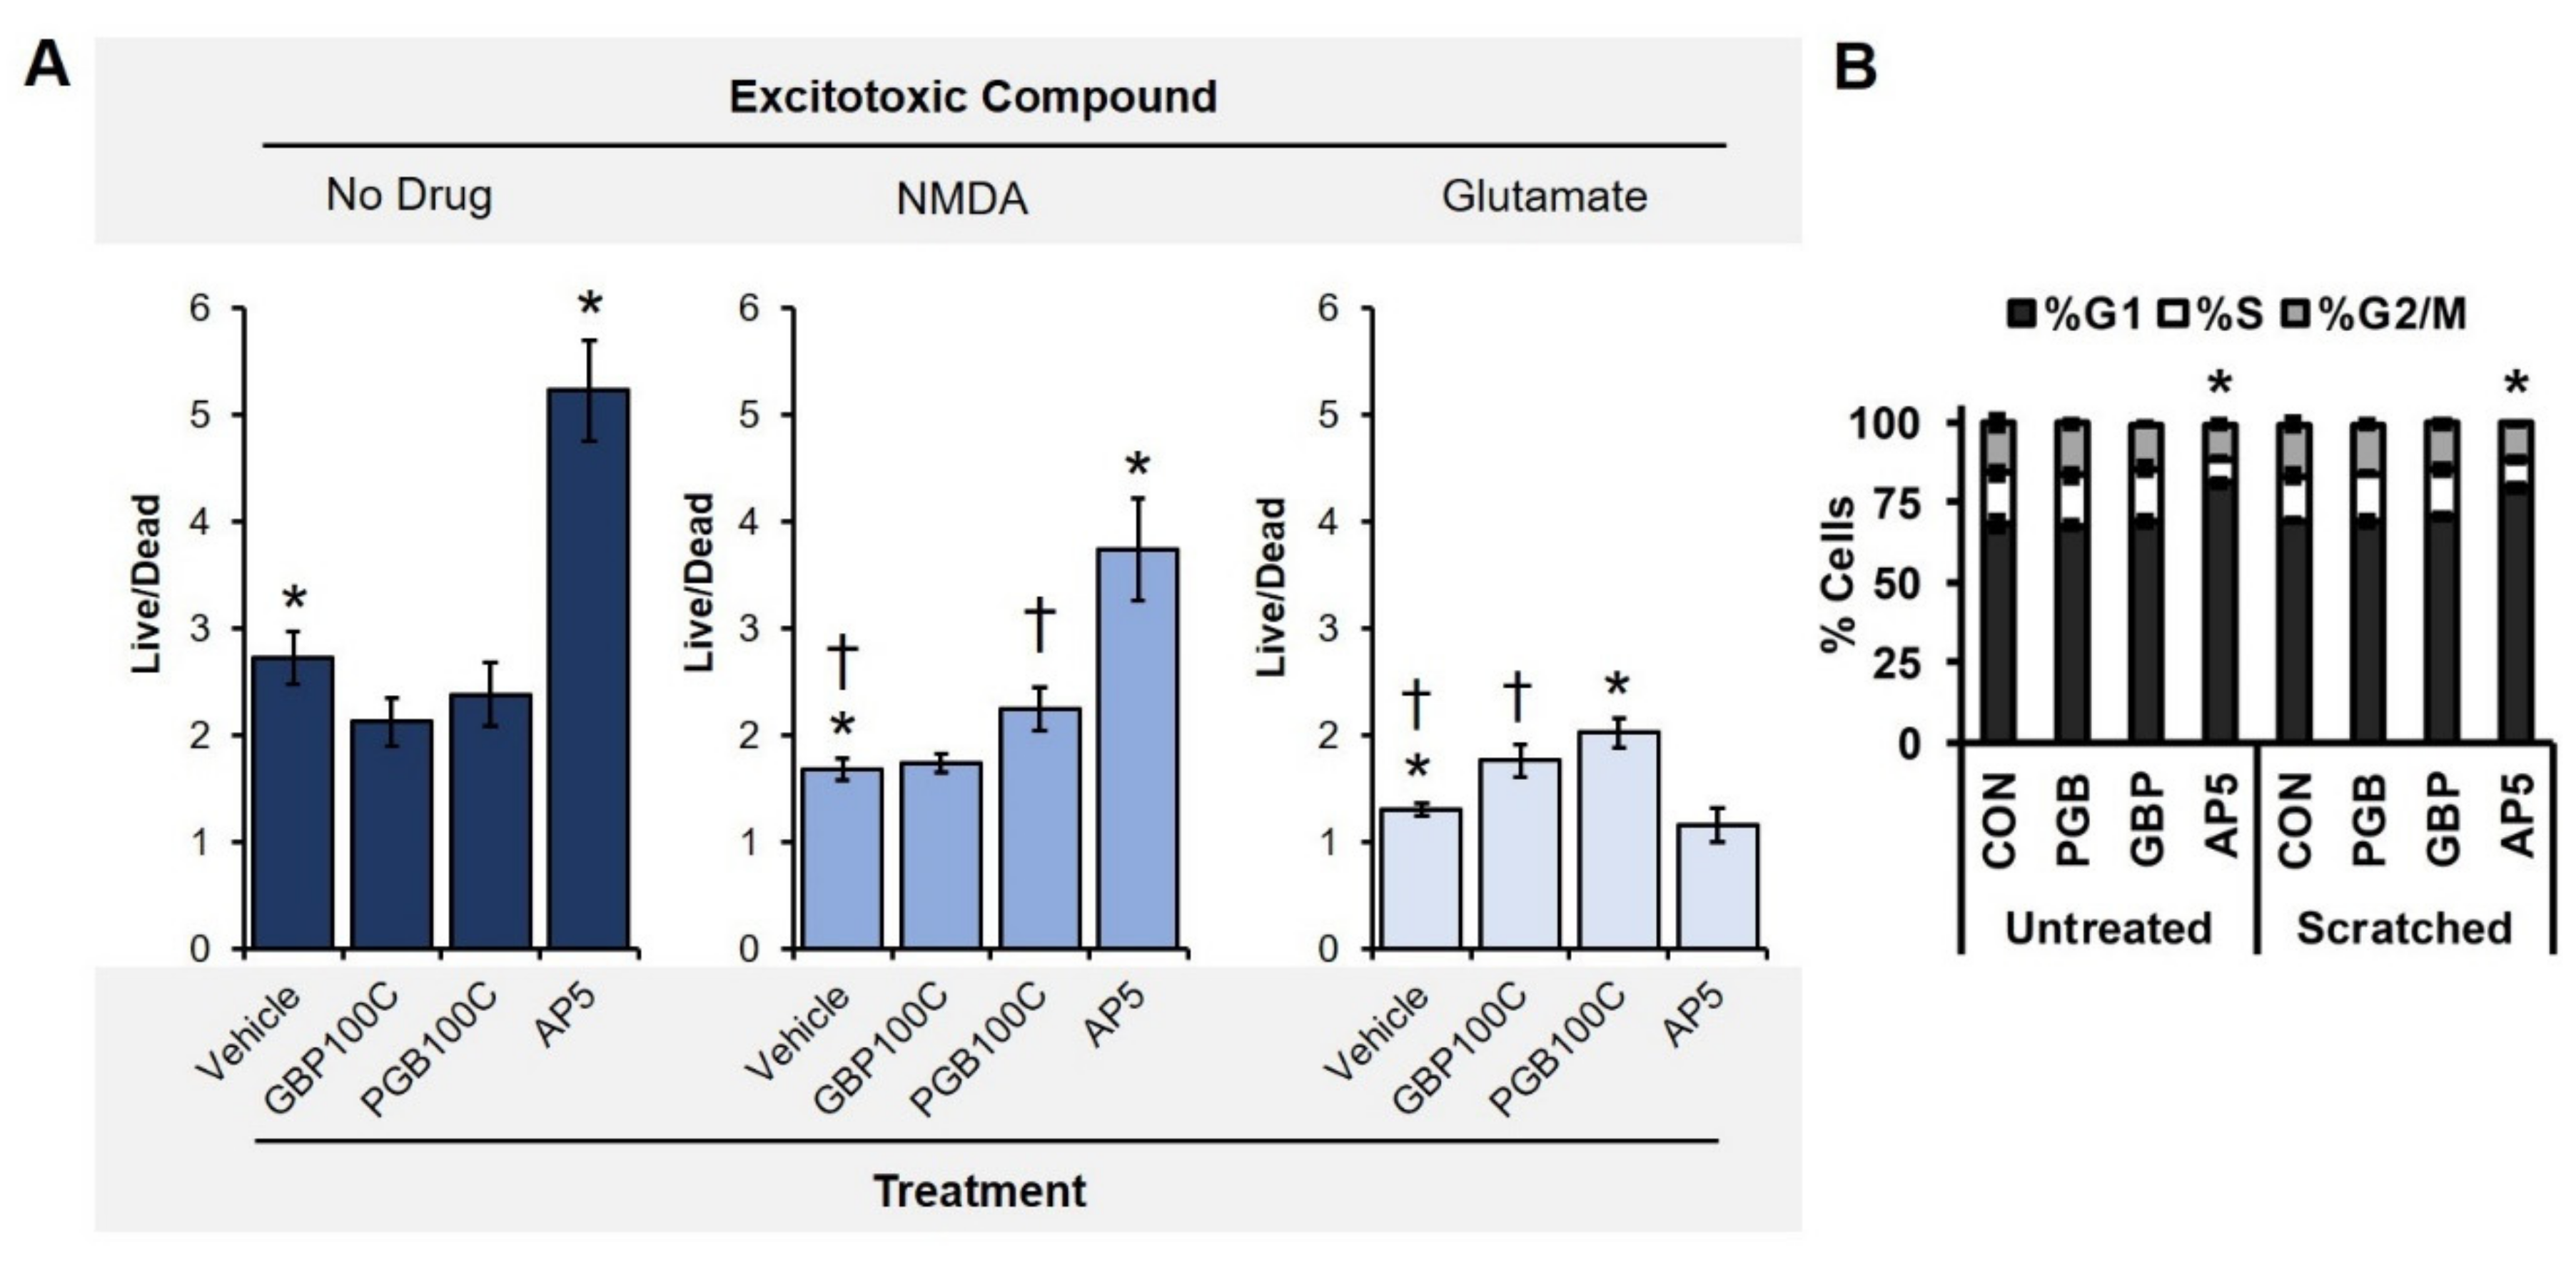
2.9. Excitotoxicity Assay
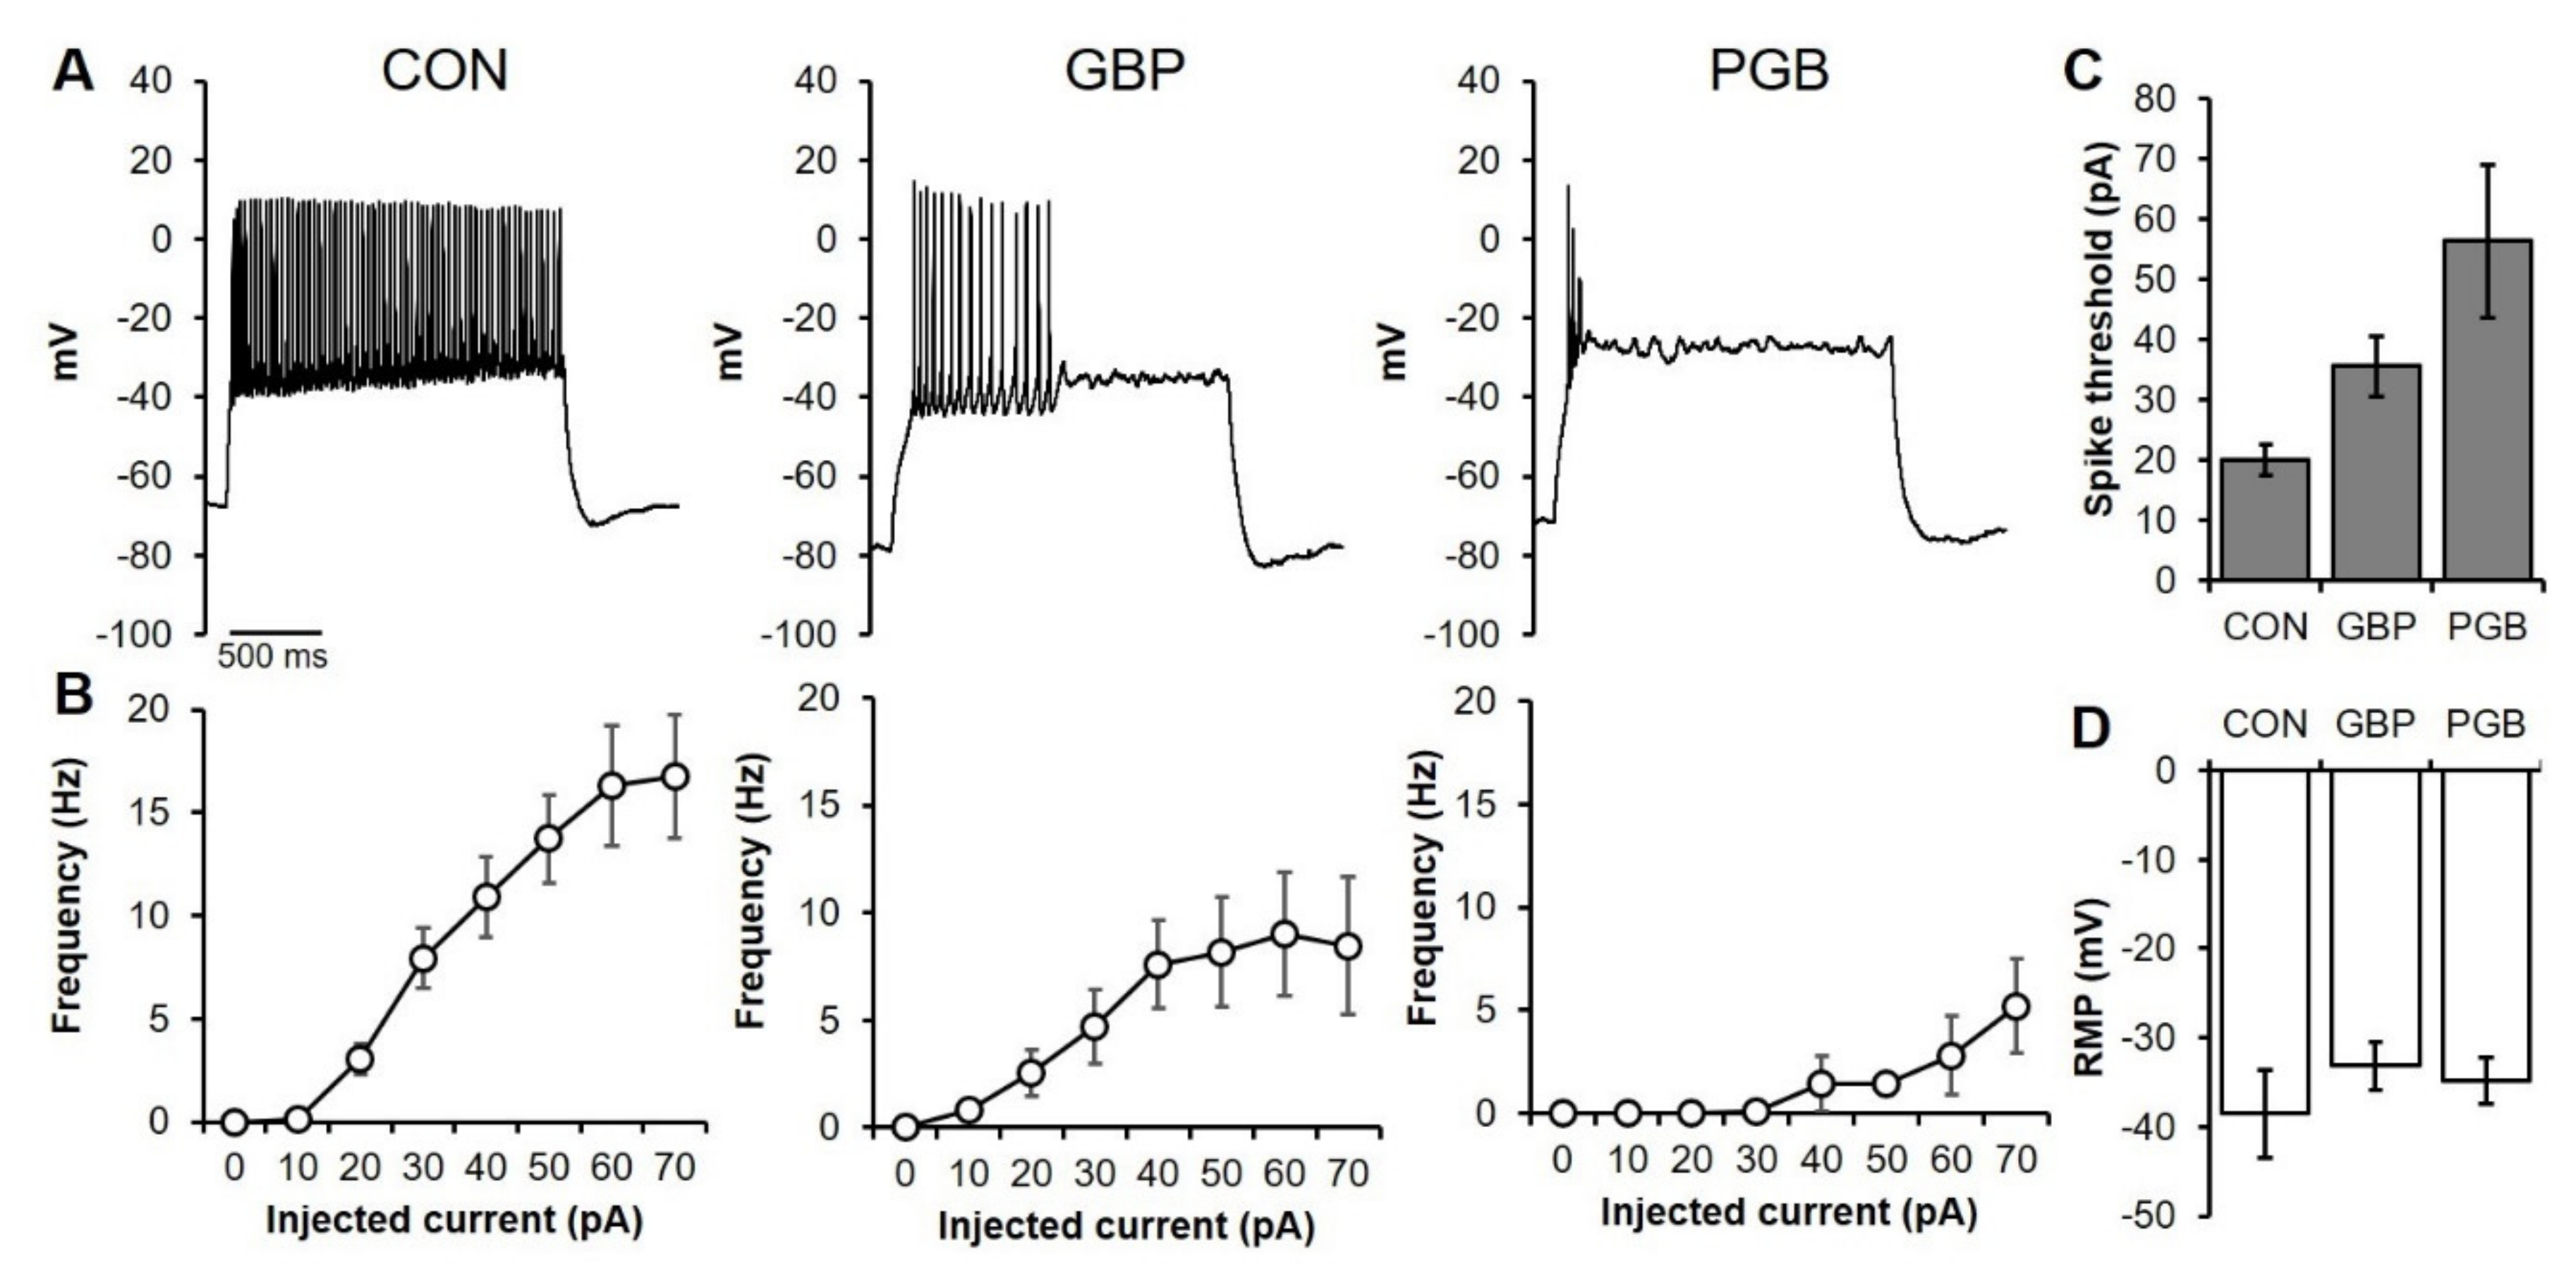
2.10. Patch-Clamp Electrophysiology
2.11. Cell Cycle Analysis with Flow Cytometry and Propidium Iodide
3. Results
3.1. A 3D Model of TBI that Expresses an Excitotoxic Phenotype
3.2. TBI-Induced Cell Death Was Mitigated by Chronic Exposure to Gabapentinoids
3.3. Spontaneous Electrical Activity Was Restored in TBI Samples Treated with Gabapentinoids
3.4. Neuroprotection as a Reduction of Neuronal Excitability
3.5. Primary Neuronal Monolayers Did Not Display Signs of Increased Proliferation after Treatment
3.6. Chronic PGB Exposure Induced Sustained Reductions in Neuronal Excitability
4. Discussion
Supplementary Materials
Author Contributions
Funding
Acknowledgments
Conflicts of Interest
References
- Faul, M.; Wald, M.M.; Xu, L.; Coronado, V.G. Traumatic Brain Injury in the United States; Emergency Department Visits, Hospitalizations, and Deaths, 2002–2006; CDC: Atlanta, GA, USA, 2010. [Google Scholar]
- Graham, D.I.; Adams, J.H.; Nicoll, J.A.; Maxwell, W.L.; Gennarelli, T.A. The nature, distribution and causes of traumatic brain injury. Brain Pathol. 1995, 5, 397–406. [Google Scholar] [CrossRef]
- Taylor, C.P.; Angelotti, T.; Fauman, E. Pharmacology and mechanism of action of pregabalin: The calcium channel α2–δ (alpha2–delta) subunit as a target for antiepileptic drug discovery. Epilepsy Res. 2007, 73, 137–150. [Google Scholar] [CrossRef]
- Elias, P.Z.; Spector, M. Implantation of a collagen scaffold seeded with adult rat hippocampal progenitors in a rat model of penetrating brain injury. J. Neurosci. Methods. 2012, 209, 199–211. [Google Scholar] [CrossRef]
- McKee, A.C.; Daneshvar, D.H. The neuropathology of traumatic brain injury. In Handbook of Clinical Neurology; Elsevier: Amsterdam, The Netherlands, 2015; Volume 127, pp. 45–66. [Google Scholar]
- Park, E.; Bell, J.D.; Baker, A.J. Traumatic brain injury: Can the consequences be stopped? Cmaj 2008, 178, 1163–1170. [Google Scholar] [CrossRef]
- Siesjö, B.K.; Siesjö, P. Mechanisms of secondary brain injury. Eur. J. Anaesthesiol. 1996, 13, 247–268. [Google Scholar] [CrossRef]
- Werner, C.; Engelhard, K. Pathophysiology of traumatic brain injury. BJA Br. J. Anaesth. 2007, 99, 4–9. [Google Scholar] [CrossRef]
- Bramlett, H.M.; Dietrich, D.W. Quantitative structural changes in white and gray matter 1 year following traumatic brain injury in rats. Acta Neuropathol. 2002, 103, 607–614. [Google Scholar] [CrossRef] [PubMed]
- Rodriguez-Paez, A.C.; Brunschwig, J.P.; Bramlett, H.M. Light and electron microscopic assessment of progressive atrophy following moderate traumatic brain injury in the rat. Acta Neuropathol. 2005, 109, 603–616. [Google Scholar] [CrossRef] [PubMed]
- Hinzman, J.M.; di Napoli, V.A.; Mahoney, E.J.; Gerhardt, G.A.; Hartings, J.A. Spreading depolarizations mediate excitotoxicity in the development of acute cortical lesions. Exp. Neurol. 2015, 267, 243–253. [Google Scholar] [CrossRef]
- Palmer, A.M.; Marion, D.W.; Botscheller, M.L.; Swedlow, P.E.; Styren, S.D.; de Kosky, S.T. Traumatic brain injury-induced excitotoxicity assessed in a controlled cortical impact model. J. Neurochem. 1993, 61, 2015–2024. [Google Scholar] [CrossRef] [PubMed]
- Yi, J.H.; Hazell, A.S. Excitotoxic mechanisms and the role of astrocytic glutamate transporters in traumatic brain injury. Neurochem. Int. 2006, 48, 394–403. [Google Scholar] [CrossRef] [PubMed]
- Vespa, P.; Prins, M.; Ronne-Engstrom, E.; Caron, M.; Shalmon, E.; Hovda, D.A.; Martin, N.A.; Becker, D.P. Increase in extracellular glutamate caused by reduced cerebral perfusion pressure and seizures after human traumatic brain injury: A microdialysis study. J. Neurosurg. 1998, 89, 971–982. [Google Scholar] [CrossRef] [PubMed]
- Herman, S.T. Epilepsy after brain insult: Targeting epileptogenesis. Neurology 2002, 59, S21–S26. [Google Scholar] [CrossRef] [PubMed]
- Pitkänen, A.; Immonen, R. Epilepsy related to traumatic brain injury. Neurotherapeutics 2014, 11, 286–296. [Google Scholar] [CrossRef]
- Sidaros, A.; Skimminge, A.; Liptrot, M.G.; Sidaros, K.; Engberg, A.W.; Herning, M.; Paulson, O.B.; Jernigan, T.L.; Rostrup, E. Long-term global and regional brain volume changes following severe traumatic brain injury: A longitudinal study with clinical correlates. Neuroimage 2009, 44, 1–8. [Google Scholar] [CrossRef]
- Pakkenberg, B.; Gundersen, H.J. Neocortical neuron number in humans: Effect of sex and age. J. Comp. Neurol. 1997, 384, 312–320. [Google Scholar] [CrossRef]
- Saing, T.; Dick, M.; Nelson, P.T.; Kim, R.C.; Cribbs, D.H.; Head, E. Frontal cortex neuropathology in dementia pugilistica. J. Neurotrauma 2012, 29, 1054–1070. [Google Scholar] [CrossRef]
- Cole, J.H.; Leech, R.; Sharp, D.J. Alzheimer’s Disease Neuroimaging Initiative. Prediction of brain age suggests accelerated atrophy after traumatic brain injury. Ann. Neurol. 2015, 77, 571–581. [Google Scholar] [CrossRef]
- Gorelova, N.A.; Koroleva, V.I.; Amemori, T.; Pavlik, V.; Bureš, J. Ketamine blockade of cortical spreading depression in rats. Electroencephalogr. Clin. Neurophysiol. 1987, 66, 440–447. [Google Scholar] [CrossRef]
- Smith, D.H.; Okiyama, K.; Gennarelli, T.A.; McIntosh, T.K. Magnesium and ketamine attenuate cognitive dysfunction following experimental brain injury. Neurosci. Lett. 1993, 157, 211–214. [Google Scholar] [CrossRef]
- Ward, J.L.; Harting, M.T.; Cox, C.S., Jr.; Mercer, D.W. Effects of ketamine on endotoxin and traumatic brain injury induced cytokine production in the rat. J. Trauma 2011, 70, 1471. [Google Scholar] [CrossRef] [PubMed]
- Sakowitz, O.W.; Kiening, K.L.; Krajewski, K.L.; Sarrafzadeh, A.S.; Fabricius, M.; Strong, A.J.; Unterberg, A.W.; Dreier, J.P. Preliminary evidence that ketamine inhibits spreading depolarizations in acute human brain injury. Stroke 2009, 40, e519–e522. [Google Scholar] [CrossRef] [PubMed]
- Gurkoff, G.; Shahlaie, K.; Lyeth, B.; Berman, R. Voltage-gated calcium channel antagonists and traumatic brain injury. Pharmaceuticals 2013, 6, 788–812. [Google Scholar] [CrossRef] [PubMed]
- Lee, L.L.; Galo, E.; Lyeth, B.G.; Muizelaar, J.P.; Berman, R.F. Neuroprotection in the rat lateral fluid percussion model of traumatic brain injury by SNX-185, an N-type voltage-gated calcium channel blocker. Exp. Neurol. 2004, 190, 70–78. [Google Scholar] [CrossRef]
- Regan, R.F.; Choi, D.W. The effect of NMDA, AMPA/kainate, and calcium channel antagonists on traumatic cortical neuronal injury in culture. Brain Res. 1994, 633, 236–242. [Google Scholar] [CrossRef]
- Tang-Schomer, M.D.; White, J.D.; Tien, L.W.; Schmitt, L.I.; Valentin, T.M.; Graziano, D.J.; Hopkins, A.M.; Omenetto, F.G.; Haydon, P.G.; Kaplan, D.L. Bioengineered functional brain-like cortical tissue. Proc. Natl. Acad. Sci. USA 2014, 111, 13811–13816. [Google Scholar] [CrossRef]
- Morrison III, B.; Elkin, B.S.; Dollé, J.P.; Yarmush, M.L. In vitro models of traumatic brain injury. Annu. Rev. Biomed. Eng. 2011, 13, 91–126. [Google Scholar] [CrossRef]
- Cairns, D.M.; Chwalek, K.; Moore, Y.E.; Kelley, M.R.; Abbott, R.D.; Moss, S.; Kaplan, D.L. Expandable and rapidly differentiating human induced neural stem cell lines for multiple tissue engineering applications. Stem Cell Rep. 2016, 13, 557–570. [Google Scholar] [CrossRef]
- Cantley, W.L.; Du, C.; Lomoio, S.; de Palma, T.; Peirent, E.; Kleinknecht, D.; Hunter, M.; Tang-Schomer, M.D.; Tesco, G.; Kaplan, D.L. Functional and sustainable 3D human neural network models from pluripotent stem cells. ACS Biomater. Sci. Eng. 2018, 4, 4278–4288. [Google Scholar] [CrossRef]
- Collins, W.; Rouleau, N.; Bonzanni, M.; Kapner, K.; Jeremiah, A.; Du, C.; Pothos, E.N.; Kaplan, D.L. Functional Effects of a Neuromelanin Analogue on Dopaminergic Neurons in 3D Cell Culture. ACS Biomater. Sci. Eng. 2018, 5, 308–317. [Google Scholar] [CrossRef]
- Grosenick, L.; Marshel, J.H.; Deisseroth, K. Closed-loop and activity-guided optogenetic control. Neuron 2015, 86, 106–139. [Google Scholar] [CrossRef] [PubMed]
- Nazarov, R.; Jin, H.J.; Kaplan, D.L. Porous 3-D scaffolds from regenerated silk fibroin. Biomacromolecules 2004, 5, 718–726. [Google Scholar] [CrossRef] [PubMed]
- Rockwood, D.N.; Preda, R.C.; Yücel, T.; Wang, X.; Lovett, M.L.; Kaplan, D.L. Materials fabrication from Bombyx mori silk fibroin. Nat. Protoc. 2011, 6, 1612. [Google Scholar] [CrossRef] [PubMed]
- Vepari, C.; Kaplan, D.L. Silk as a biomaterial. Prog. Polym. Sci. 2007, 32, 991–1007. [Google Scholar] [CrossRef]
- Chwalek, K.; Tang-Schomer, M.D.; Omenetto, F.G.; Kaplan, D.L. In vitro bioengineered model of cortical brain tissue. Nat. Protoc. 2015, 10, 1362–1373. [Google Scholar] [CrossRef] [PubMed]
- Rouleau, N.; Cantley, W.L.; Liaudanskaya, V.; Berk, A.; Du, C.; Rusk, W.; Peirent, E.; Koester, C.; Nieland, T.J.; Kaplan, D.L. A Long-Living Bioengineered Neural Tissue Platform to Study Neurodegeneration. Macromol. Biosci. 2020, 20, 2000004. [Google Scholar] [CrossRef] [PubMed]
- Sills, G.J. The mechanisms of action of gabapentin and pregabalin. Curr. Opin. Pharmacol. 2006, 6, 108–113. [Google Scholar] [CrossRef]
- Liaudanskaya, V.; Jgamadze, D.; Berk, A.N.; Bischoff, D.J.; Gu, B.J.; Hawks-Mayer, H.; Whalen, M.J.; Chen, H.I.; Kaplan, D.L. Engineering advanced neural tissue constructs to mitigate acute cerebral inflammation after brain transplantation in rats. Biomaterialia 2019, 192, 510–522. [Google Scholar] [CrossRef]
- Du, C.; Collins, W.; Cantley, W.; Sood, D.; Kaplan, D.L. Tutorials for electrophysiological recordings in neuronal tissue engineering. ACS Biomater. Sci. Eng. 2017, 3, 2235–2246. [Google Scholar] [CrossRef]
- Peng, B.W.; Justice, J.A.; Zhang, K.; Li, J.X.; He, X.H.; Sanchez, R.M. Gabapentin promotes inhibition by enhancing hyperpolarization-activated cation currents and spontaneous firing in hippocampal CA1 interneurons. Neurosci. Lett. 2011, 494, 19–23. [Google Scholar] [CrossRef]
- Surges, R.; Freiman, T.M.; Feuerstein, T.J. Gabapentin increases the hyperpolarization-activated cation current Ih in rat CA1 pyramidal cells. Epilepsia 2003, 44, 150–156. [Google Scholar] [CrossRef] [PubMed]
- Yang, Y.; Herrup, K. Cell division in the CNS: Protective response or lethal event in post-mitotic neurons? Biochim. Biophys. Acta Mol. Basis Dis. 2007, 1772, 457–466. [Google Scholar] [CrossRef] [PubMed]
- Keller, M.; Yang, J.; Griesmaier, E.; Gorna, A.; Sarkozy, G.; Urbanek, M.; Gressens, P.; Simbruner, G. Erythropoietin is neuroprotective against NMDA-receptor-mediated excitotoxic brain injury in newborn mice. Neurobiol. Dis. 2006, 24, 357–366. [Google Scholar] [CrossRef] [PubMed]
- Krajewska, M.; You, Z.; Rong, J.; Kress, C.; Huang, X.; Yang, J.; Kyoda, T.; Leyva, R.; Banares, S.; Hu, Y.; et al. Neuronal deletion of caspase 8 protects against brain injury in mouse models of controlled cortical impact and kainic acid-induced excitotoxicity. PLoS ONE 2011, 6, e24341. [Google Scholar] [CrossRef]
- Wei, J.; Pan, X.; Pei, Z.; Wang, W.; Qiu, W.; Shi, Z.; Xiao, G. The beta-lactam antibiotic, ceftriaxone, provides neuroprotective potential via anti-excitotoxicity and anti-inflammation response in a rat model of traumatic brain injury. J. Trauma Acute Care Surg. 2012, 73, 654–660. [Google Scholar] [CrossRef]
- Johnston, M.V. Excitotoxicity in perinatal brain injury. Brain Pathol. 2005, 15, 234–240. [Google Scholar] [CrossRef]
- Hilton, G.D.; Nunez, J.L.; Bambrick, L.; Thompson, S.M.; McCarthy, M.M. Glutamate-mediated excitotoxicity in neonatal hippocampal neurons is mediated by mGluR-induced release of Ca++ from intracellular stores and is prevented by estradiol. Eur. J. Neurosci. 2006, 24, 3008–3016. [Google Scholar] [CrossRef]
- Luo, P.; Li, X.; Wu, X.; Dai, S.; Yang, Y.; Xu, H.; Jing, D.; Rao, W.; Xu, H.; Gao, X.; et al. Preso regulates NMDA receptor-mediated excitotoxicity via modulating nitric oxide and calcium responses after traumatic brain injury. Cell Death Dis. 2019, 10, 1–4. [Google Scholar] [CrossRef]
- Dixit, R.K.; Bhargava, V.K. Neurotransmitter mechanisms in gabapentin antinociception. Pharmacology 2002, 65, 198–203. [Google Scholar] [CrossRef]
- Singh, N.S.; Paul, R.K.; Torjman, M.C.; Wainer, I.W. Gabapentin and (S)-pregabalin decrease intracellular D-serine concentrations in PC-12 cells. Neurosci. Lett. 2013, 535, 90–94. [Google Scholar] [CrossRef][Green Version]
- Silverman, R.B.; Andruszkiewicz, R.; Nanavati, S.M.; Taylor, C.P.; Vartanian, M.G. 3-Alkyl-4-aminobutyric acids: The first class of anticonvulsant agents that activates L-glutamic acid decarboxylase. J. Med. Chem. 1991, 34, 2295–2298. [Google Scholar] [CrossRef] [PubMed]
- Li, Y.; Yang, X.; Ma, C.; Qiao, J.; Zhang, C. Necroptosis contributes to the NMDA-induced excitotoxicity in rat’s cultured cortical neurons. Neurosci. Lett. 2008, 447, 120–123. [Google Scholar] [CrossRef] [PubMed]
- Martin, L.J.; Al-Abdulla, N.A.; Brambrink, A.M.; Kirsch, J.R.; Sieber, F.E.; Portera-Cailliau, C. Neurodegeneration in excitotoxicity, global cerebral ischemia, and target deprivation: A perspective on the contributions of apoptosis and necrosis. Brain Res. Bull. 1998, 46, 281–309. [Google Scholar] [CrossRef]
- Portera-Cailliau, C.; Price, D.L.; Martin, L.J. Excitotoxic neuronal death in the immature brain is an apoptosis-necrosis morphological continuum. J. Comp. Neurol. 1997, 378, 10–87. [Google Scholar] [CrossRef]
- Zhang, T.; Yan, Y.; Wang, X.; Xiong, Z.; Lin, F.; Wu, R.; Zhang, R. Three-dimensional gelatin and gelatin/hyaluronan hydrogel structures for traumatic brain injury. J. Bioact. Compat. Polym. 2007, 22, 19–29. [Google Scholar] [CrossRef]


© 2020 by the authors. Licensee MDPI, Basel, Switzerland. This article is an open access article distributed under the terms and conditions of the Creative Commons Attribution (CC BY) license (http://creativecommons.org/licenses/by/4.0/).
Share and Cite
Rouleau, N.; Bonzanni, M.; Erndt-Marino, J.D.; Sievert, K.; Ramirez, C.G.; Rusk, W.; Levin, M.; Kaplan, D.L. A 3D Tissue Model of Traumatic Brain Injury with Excitotoxicity That Is Inhibited by Chronic Exposure to Gabapentinoids. Biomolecules 2020, 10, 1196. https://doi.org/10.3390/biom10081196
Rouleau N, Bonzanni M, Erndt-Marino JD, Sievert K, Ramirez CG, Rusk W, Levin M, Kaplan DL. A 3D Tissue Model of Traumatic Brain Injury with Excitotoxicity That Is Inhibited by Chronic Exposure to Gabapentinoids. Biomolecules. 2020; 10(8):1196. https://doi.org/10.3390/biom10081196
Chicago/Turabian StyleRouleau, Nicolas, Mattia Bonzanni, Joshua D. Erndt-Marino, Katja Sievert, Camila G. Ramirez, William Rusk, Michael Levin, and David L. Kaplan. 2020. "A 3D Tissue Model of Traumatic Brain Injury with Excitotoxicity That Is Inhibited by Chronic Exposure to Gabapentinoids" Biomolecules 10, no. 8: 1196. https://doi.org/10.3390/biom10081196
APA StyleRouleau, N., Bonzanni, M., Erndt-Marino, J. D., Sievert, K., Ramirez, C. G., Rusk, W., Levin, M., & Kaplan, D. L. (2020). A 3D Tissue Model of Traumatic Brain Injury with Excitotoxicity That Is Inhibited by Chronic Exposure to Gabapentinoids. Biomolecules, 10(8), 1196. https://doi.org/10.3390/biom10081196