Article

Transcriptome Analysis Reveals Potential Roles of Abscisic Acid and Polyphenols in Adaptation of Onobrychis viciifolia to Extreme Environmental Conditions in the Qinghai-Tibetan Plateau

1
State Key Laboratory of Plateau Ecology and Agriculture, Qinghai University, Xining 810016, China
2
The Key Laboratory of Restoration Ecology in Cold Region of Qinghai Province, Northwest Institute of Plateau Biology, Chinese Academy of Science, Xining 810008, China
3
School of Life Science, Qinghai Normal University, Xining 810008, China
4
Institute of Research and Development, Duy Tan University, 03 Quang Trung, Da Nang 550000, Vietnam
5
College of Eco-Environmental Engineering, Qinghai University, Xining 810016, China
*
Authors to whom correspondence should be addressed.
Biomolecules 2020, 10(6), 967; https://doi.org/10.3390/biom10060967
Submission received: 16 May 2020 / Revised: 22 June 2020 / Accepted: 23 June 2020 / Published: 26 June 2020
(This article belongs to the Special Issue Phytohormones 2020)

Abstract

:
A detailed understanding of the molecular mechanisms of plant stress resistance in the face of ever-changing environmental stimuli will be helpful for promoting the growth and production of crop and forage plants. Investigations of plant responses to various single abiotic or biotic factors, or combined stresses, have been extensively reported. However, the molecular mechanisms of plants in responses to environmental stresses under natural conditions are not clearly understood. In this study, we carried out a transcriptome analysis using RNA-sequencing to decipher the underlying molecular mechanisms of Onobrychis viciifolia responding and adapting to the extreme natural environment in the Qinghai-Tibetan Plateau (QTP). The transcriptome data of plant samples collected from two different altitudes revealed a total of 8212 differentially expressed genes (DEGs), including 5387 up-regulated and 2825 down-regulated genes. Detailed analysis of the identified DEGs uncovered that up-regulation of genes potentially leading to changes in hormone homeostasis and signaling, particularly abscisic acid-related ones, and enhanced biosynthesis of polyphenols play vital roles in the adaptive processes of O. viciifolia. Interestingly, several DEGs encoding uridine diphosphate glycosyltransferases, which putatively regulate phytohormone homeostasis to resist environmental stresses, were also discovered. Furthermore, numerous DEGs encoding transcriptional factors, such as members of the myeloblastosis (MYB), homeodomain-leucine zipper (HD-ZIP), WRKY, and nam-ataf1,2-cuc2 (NAC) families, might be involved in the adaptive responses of O. viciifolia to the extreme natural environmental conditions. The DEGs identified in this study represent candidate targets for improving environmental stress resistance of O. viciifolia grown in higher altitudes of the QTP, and can provide deep insights into the molecular mechanisms underlying the responses of this plant species to the extreme natural environmental conditions of the QTP.

1. Introduction

As sessile organisms, plants are continuously exposed to a plethora of environmental stresses, including abiotic and biotic stresses, which severely constrain their growth and productivity. The major abiotic stresses are salinity, drought, heat, cold, chilling, flooding, ultraviolet (UV) radiation, and heavy metal toxicity [1,2,3,4,5]. Abiotic stress is the prominent threat in natural conditions under continuous climate change, and has caused more than 50% of crop losses worldwide [6]. A better understanding of plant resistance to abiotic stresses, especially under natural conditions, is therefore of fundamental importance and has been one of the major research topics studied for improving plant production.
Facing with various environmental threats, plants have evolved a diverse array of protective mechanisms at biochemical, molecular, and physiological levels, with responses and changes in hormone homeostasis, transcriptional factors (TFs), photosynthesis, antioxidants, and the biosyntheses of osmotic adjustment-related substances [7,8,9,10,11]. The responsive mechanisms of plants to various specific abiotic/biotic stress conditions have been extensively investigated in the past decades; however, many studies have mainly focused on a single stress factor. Consequently, these findings could not provide a whole picture on how a given plant species may respond to combined stresses under truly uncontrolled natural conditions [12]. For example, the model plant Arabidopsis thaliana presented a specific molecular responsive mechanism in which over 770 specific transcripts were only displayed under combined drought and heat stress in comparison to the single stress [7]. Similar changes in metabolite and protein contents were also found, in which several metabolites and at least 45 proteins were only accumulated under the stress combination of drought and heat [7,8]. Additionally, transcriptome analyses of the sunflower (Helianthus annuus) plants exposed to a combination of heat and intensive light stress revealed numerous specific transcripts, compared with individual stresses [13]. These findings together indicated that the responsive mechanisms of plants to existing stresses under natural conditions are quite complicated. Unlike single or combined stresses, plants under natural conditions will be exposed to cross interactions of multiple stress factors, the consequence of which will not just be overlaid with their separately triggering responses. However, responsive mechanisms of plants to natural conditions, especially the extreme environment, still remain elusive. To further complicate the situation, the responses may also vary dependently on plant species.
In the past 10 to 15 years, the application of transcriptomics has substantially facilitated a deep understanding of responsiveness or resistance mechanisms of plants in the face of various specific stresses at a molecular level, especially with regard to unravelling differentially expressed genes (DEGs), signaling pathways and regulation of metabolic networks involved in responses to diverse stresses [14,15]. For example, an increasing number of TFs involved in plant responses to abiotic stresses have been discovered in many plant species, such as C-repeat binding factor/dehydration responsive element-binding (CBF/DREB), myeloblastosis (MYB), WRKY, nam-ataf1,2-cuc2 (NAC) and basic region/leucine zipper motif (bZIP) TFs, the biological functions of which have been confirmed by transgenic studies [16,17,18,19,20]. Additionally, molecular mechanisms underlying the metabolic changes and signal transduction in plant responses to stresses have been extensively documented [16,17,18,19,20,21]. Phytohormone pathways, including those of abscisic acid (ABA), ethylene, cytokinin (CK), indole 3-acetic acid (IAA), gibberellic acid (GA), and jasmonic acid (JA), play crucial roles in the regulation of plant resistance to various abiotic or biotic stresses [20,21,22]. For instance, the biosynthesis of ABA is known to be promoted under drought and osmotic stress, which triggers significant transcriptional, biochemical, and physiological changes in stressed plants [23,24,25].
Onobrychis viciifolia, also called sainfoin, belonging to Leguminosae, is a perennial forage crop widely planted in the Qinghai-Tibetan Plateau (QTP). O. viciifolia contains condensed tannins (CTs), or proanthocyanidins that belong to a class of polyphenols [26]. CTs in high concentrations are thought to contribute to reduce methane emissions, and increase nitrogen-use efficiency, anthelmintic properties, as well as bloat prevention for ruminants in contrary to other legumes like alfalfa (Medicago sativa) [27,28]. Given the importance of CTs for considering O. viciifolia as an excellent forge crop, numerous studies have focused on their composition and identification in recent years [26,29,30,31,32]. In addition to CTs, a range of other types of chemical compounds, such as flavonoids, isoflavonoids, and hydroxycinnamic acids, are also enriched in O. viciifolia, and were proposed to be correlated with its drought tolerance [33]. Furthermore, O. viciifolia has better forage quality and higher total sugar and crude protein contents than the other forage legumes like trefoil (Lotus corniculatus) and chicory (Cichorium intybus) [34]. Therefore, O. viciifolia wins a reputation as ‘the queen of forages’ due to these benefits that suggest O. viciifolia to be an alternative to M. sativa as a valuable forage crop in the QTP [35].
Being known as the Earth’s third pole and the highest plateau (average elevation of more than 4000 m above sea level), the QTP possesses extreme environmental factors, including low temperature, strong UV radiation, severe drought, low oxygen, and soil nutritional deficiency [36,37,38]. Notably, O. viciifolia appears to be increasingly resistant to extreme natural conditions of higher altitudes in the QTP, showing better overwintering and higher yields year after year. Thus, O. viciifolia is recognized as an ideal plant material for investigating the molecular mechanisms of plants in acclimatization to extreme circumstances in the QTP. Such mechanisms of O. viciifolia with regard to the QTP natural conditions have not been reported yet. Thus, to obtain a global molecular understanding, and identify key responsive genes of the forage crop O. viciifolia, which are involved in its acclimatization to extreme natural conditions, we applied RNA-sequencing (RNA-seq) to obtain transcriptomes of O. viciifolia plants naturally planted at Tongde (TD, high altitude) and Minhe (MH, low altitude) counties in the QTP for a comparative transcriptome analysis.
Based on the climatic parameters from Qinghai Institute of Meteorology Science, these two counties have significantly different climatic characteristics due to location at different altitudes. In recent three years, TD has the annual average temperature of 3.92 °C, annual average precipitation of 611.4 mm, and annual accrued sunlight of 2476.4 h, whereas MH has relative mild climatic factors with the annual average temperature of 9.44 °C, annual average precipitation of 407.7 mm, and annual accrued sunlight of 2335.5 h. Although the annual average precipitation in TD is higher than that in MH, the annual average water evaporation in TD (~1616.7 mm) is almost 3-times higher than that at MH (~629.7 mm), resulting in a more water-deficit TD when compared with MH. Thus, comparative transcriptome analysis of O. viciifolia plants naturally planted at the high-altitude TD and low-altitude MH with different natural conditions will allow us to understand the acclimatization process of O. viciifolia to extreme natural conditions occurring at higher altitude. Additionally, this work will also provide the first-ever transcriptome resource for O. viciifolia field-grown in the two different altitudes of the QTP. Identification of DEGs from this study will therefore help decipher the molecular mechanisms underlying the responses of this forage crop to their surrounding detrimental natural conditions, which could contribute to genetic engineering and to improving the environmental stress resistance of O. viciifolia grown in higher altitudes of the QTP.

2. Materials and Methods

2.1. Plant Materials

Onobrychis viciifolia was planted in May at the germplasm breeding farms of Tongde (TD, E 100°39′26′′, N 35°09′45′′; H 3830 m) and Minhe (MH, E 102°34′46′′, N 36°15′56′′; H 1840 m) counties that are located in the three-river headwater region and the most eastern edge of the QTP in Qinghai province, respectively. To elucidate the stress resistance mechanisms under natural plateau conditions, two-year-old O. viciifolia forages field-grown at TD and MH (around 80–100 cm in height) were collected in the seventh day during flowering on 6 July and 23 June in 2018, respectively, as investigated objectives. To avoid the sampling bias, the sampling time of the two locations were both at 10:00 a.m. with the same sampling method. Five plants were randomly selected for each repetition (5 independent plants/replication). Then, the three fresh and undamaged leaves from the middle position of the herbage (3 leaves from each plant) were collected and washed with distilled water, cut into pieces, and mixed together as a biological replicate. All collected samples were immediately frozen in liquid nitrogen and stored at −80 °C until further use. RNA-seq and RT-qPCR analyses were both performed using three independent biological replications.

2.2. Total RNA Extraction, and Construction and Sequencing of mRNA Libraries

Total RNA was extracted from the biological replicates using the MiniBEST kit (Takara, Dalian, China) following the manufacturer’s instructions, and the concentration and integrity of each RNA sample were determined using a NanoDrop (Thermo Scientific, Waltham, MA, USA) and an Agilent 2100 BioAnalyzer (Agilent Technologies, Palo Alto, CA, USA), respectively. Construction and sequencing of the cDNA libraries of six samples were performed at the Gene Denovo Biotechnology Co., Ltd., Guangzhou, China. All transcriptome sequencing data have been uploaded to the NCBI Sequence Read Archive (SRA) database (https://www.ncbi.nlm.nih.gov/sra) under the SRA accession number PRJNA612135.

2.3. Transcriptome Sequencing Data Processing and Analysis

The clean reads, namely high-quality reads, were obtained by removing the adapters, ploy-N sequences, and low-quality (Q-value ≤ 10) reads from the raw reads. Meanwhile, the values of Q20, Q30, N50, and GC content of the clean reads were calculated. Transcriptome de novo assembly was then carried out with the clean reads using the Trinity Program with default parameters [39]. Clean datasets of six libraries were pooled for de novo assembly to create a reference genome of O. viciifolia. The annotation of assembled unigenes was conducted using the nucleotide Basic Local Alignment Search Tool (BLASTn) against various public databases, including the Nr (https://ftp.ncbi.nlm.nih.gov/blast/db/FASTA/), Swiss-Prot (https://www.uniprot.org/), KOG (https://ftp.ncbi.nih.gov/pub/COG/KOG/) and KEGG (KEGG, https://www.kegg.jp/) ortholog databases, with an e-value cutoff of 10−10. Gene expression levels were calculated and normalized to reads per kilobases per million reads (RPKM) values [40].

2.4. Identification and Functional Annotation of DEGs

DEGs across the samples were identified according to their expression levels with the thresholds of |log2 (fold change)| ≥  1 and p-value < 0.05. The GO and KEGG enrichment analyses for O. viciifolia were conducted using the GO and KEGG databases to gain functional annotation of the DEGs. TFs were predicted by searching against the Plant Transcriptional Factor Database (PlantTFDB 4.0, http://www.plntfdb.bio.uni-potsdam.de/v3.0/) [41]. Further annotation and classification of DEGs were visualized in the MapMan version 3.6.0RC1, and the annotated files for MapMan visualization were generated with Mercator version 3.6 (https://www.plabipd.de/portal/web/guest/mercator-sequence-annotation) [42].

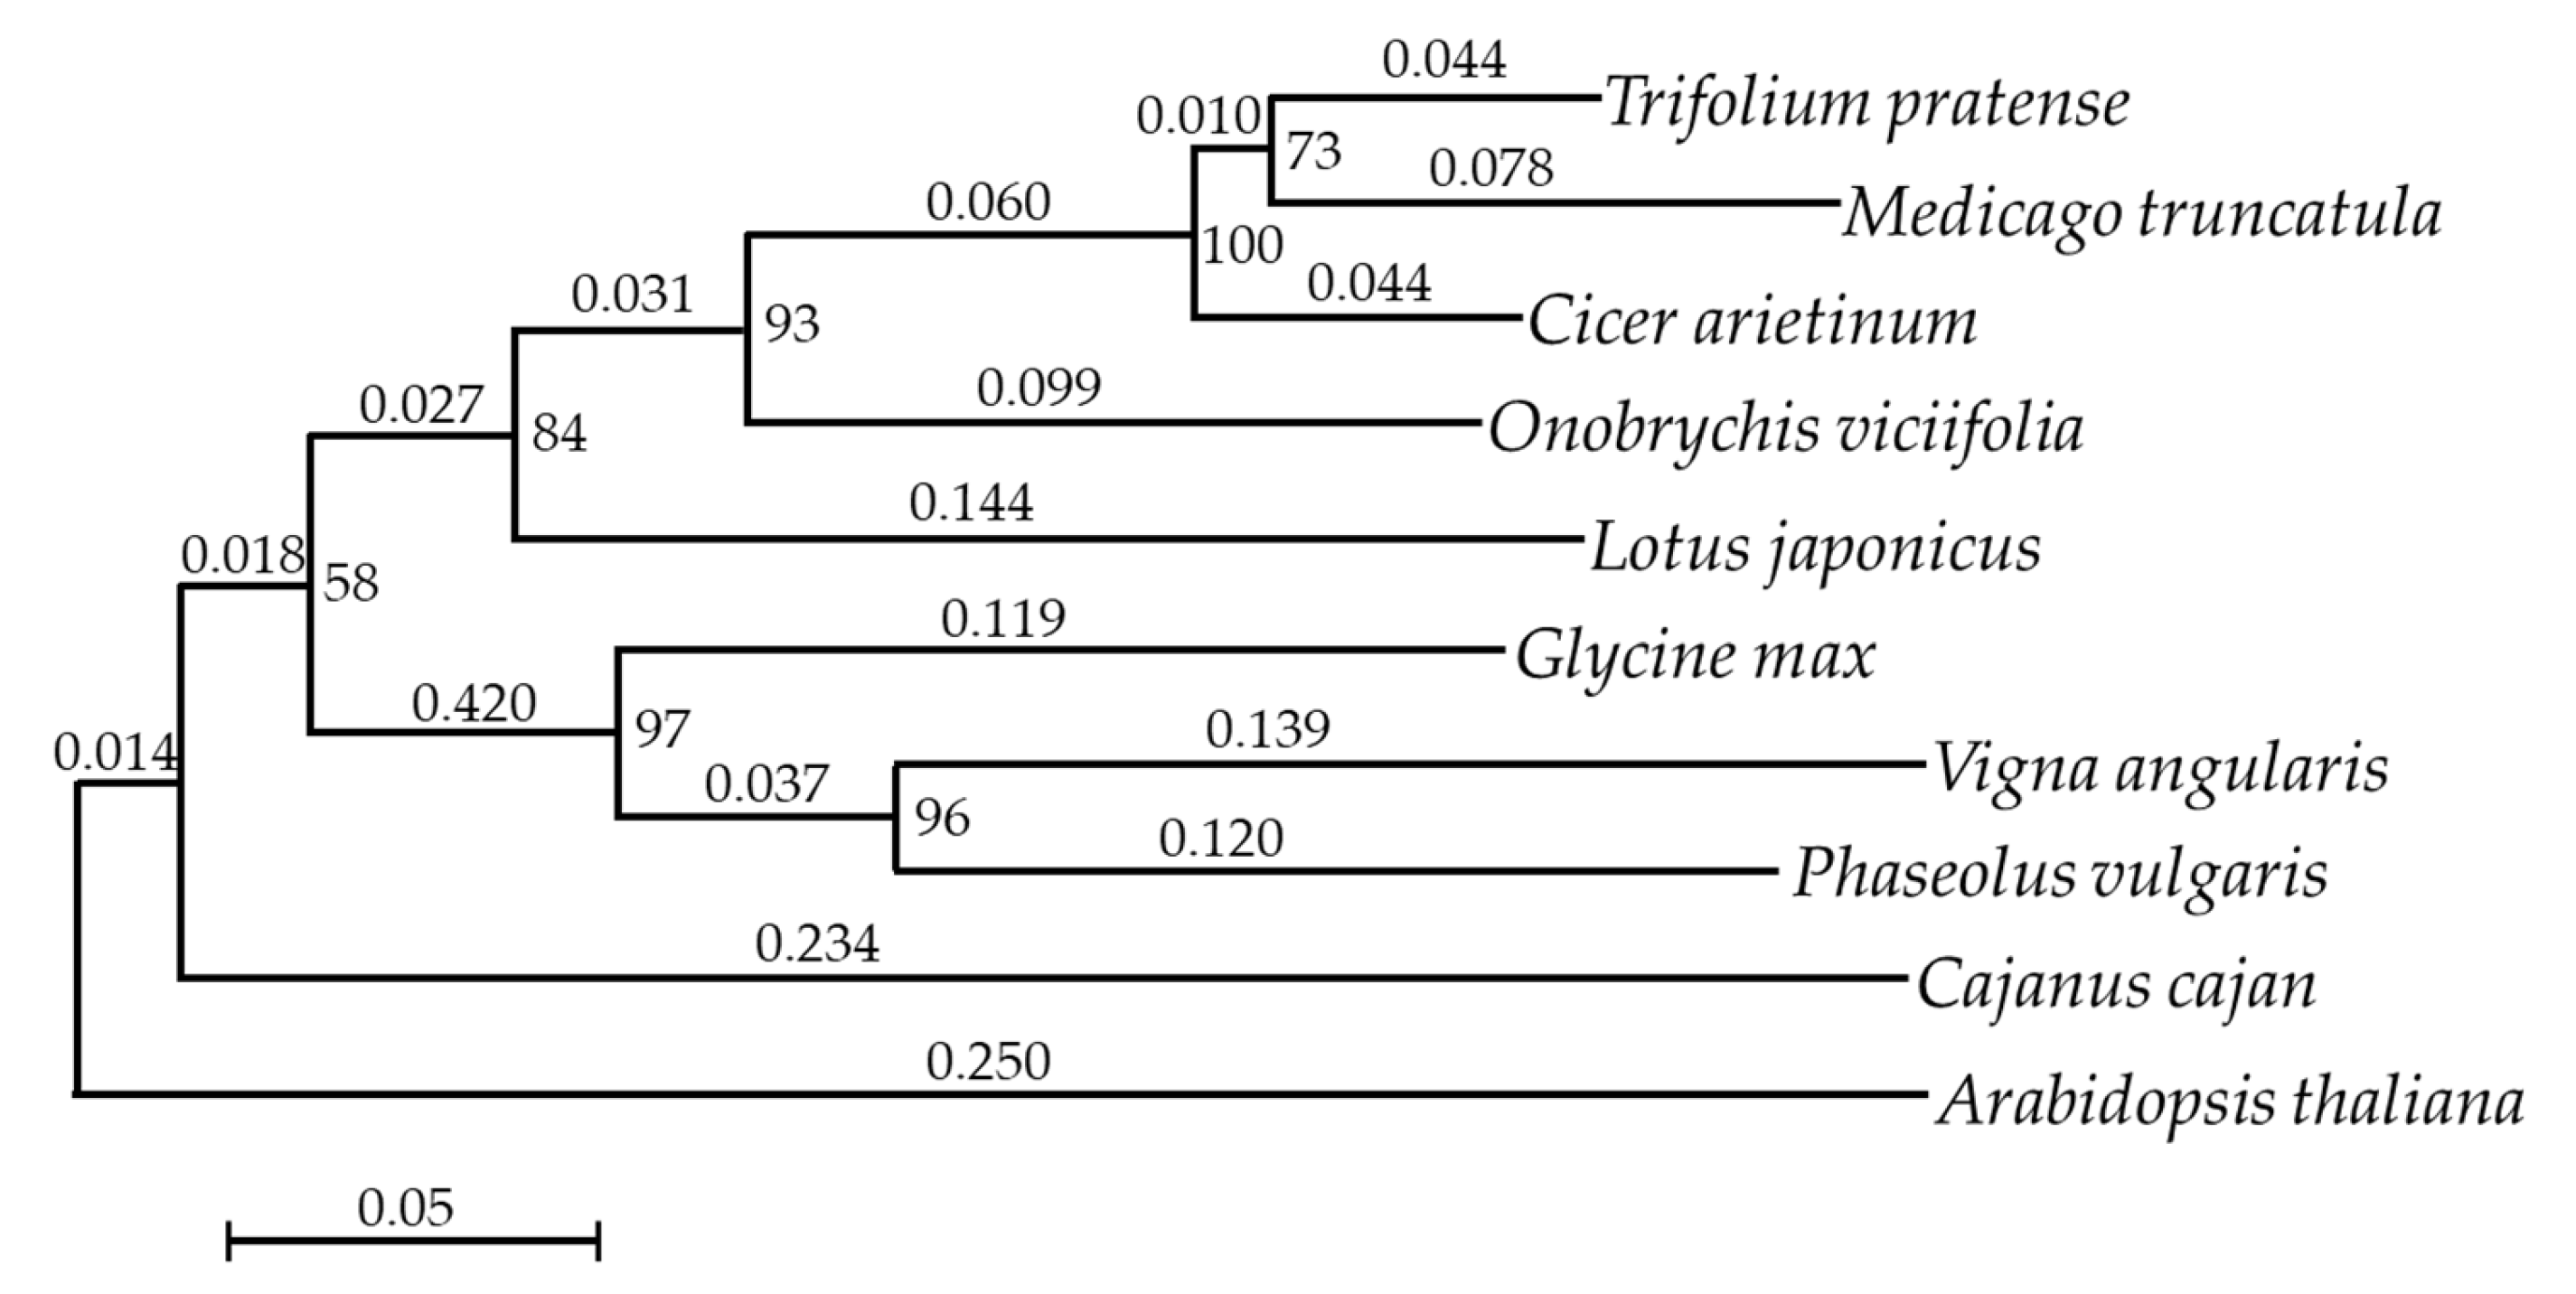
2.5. Phylogenetic Analysis
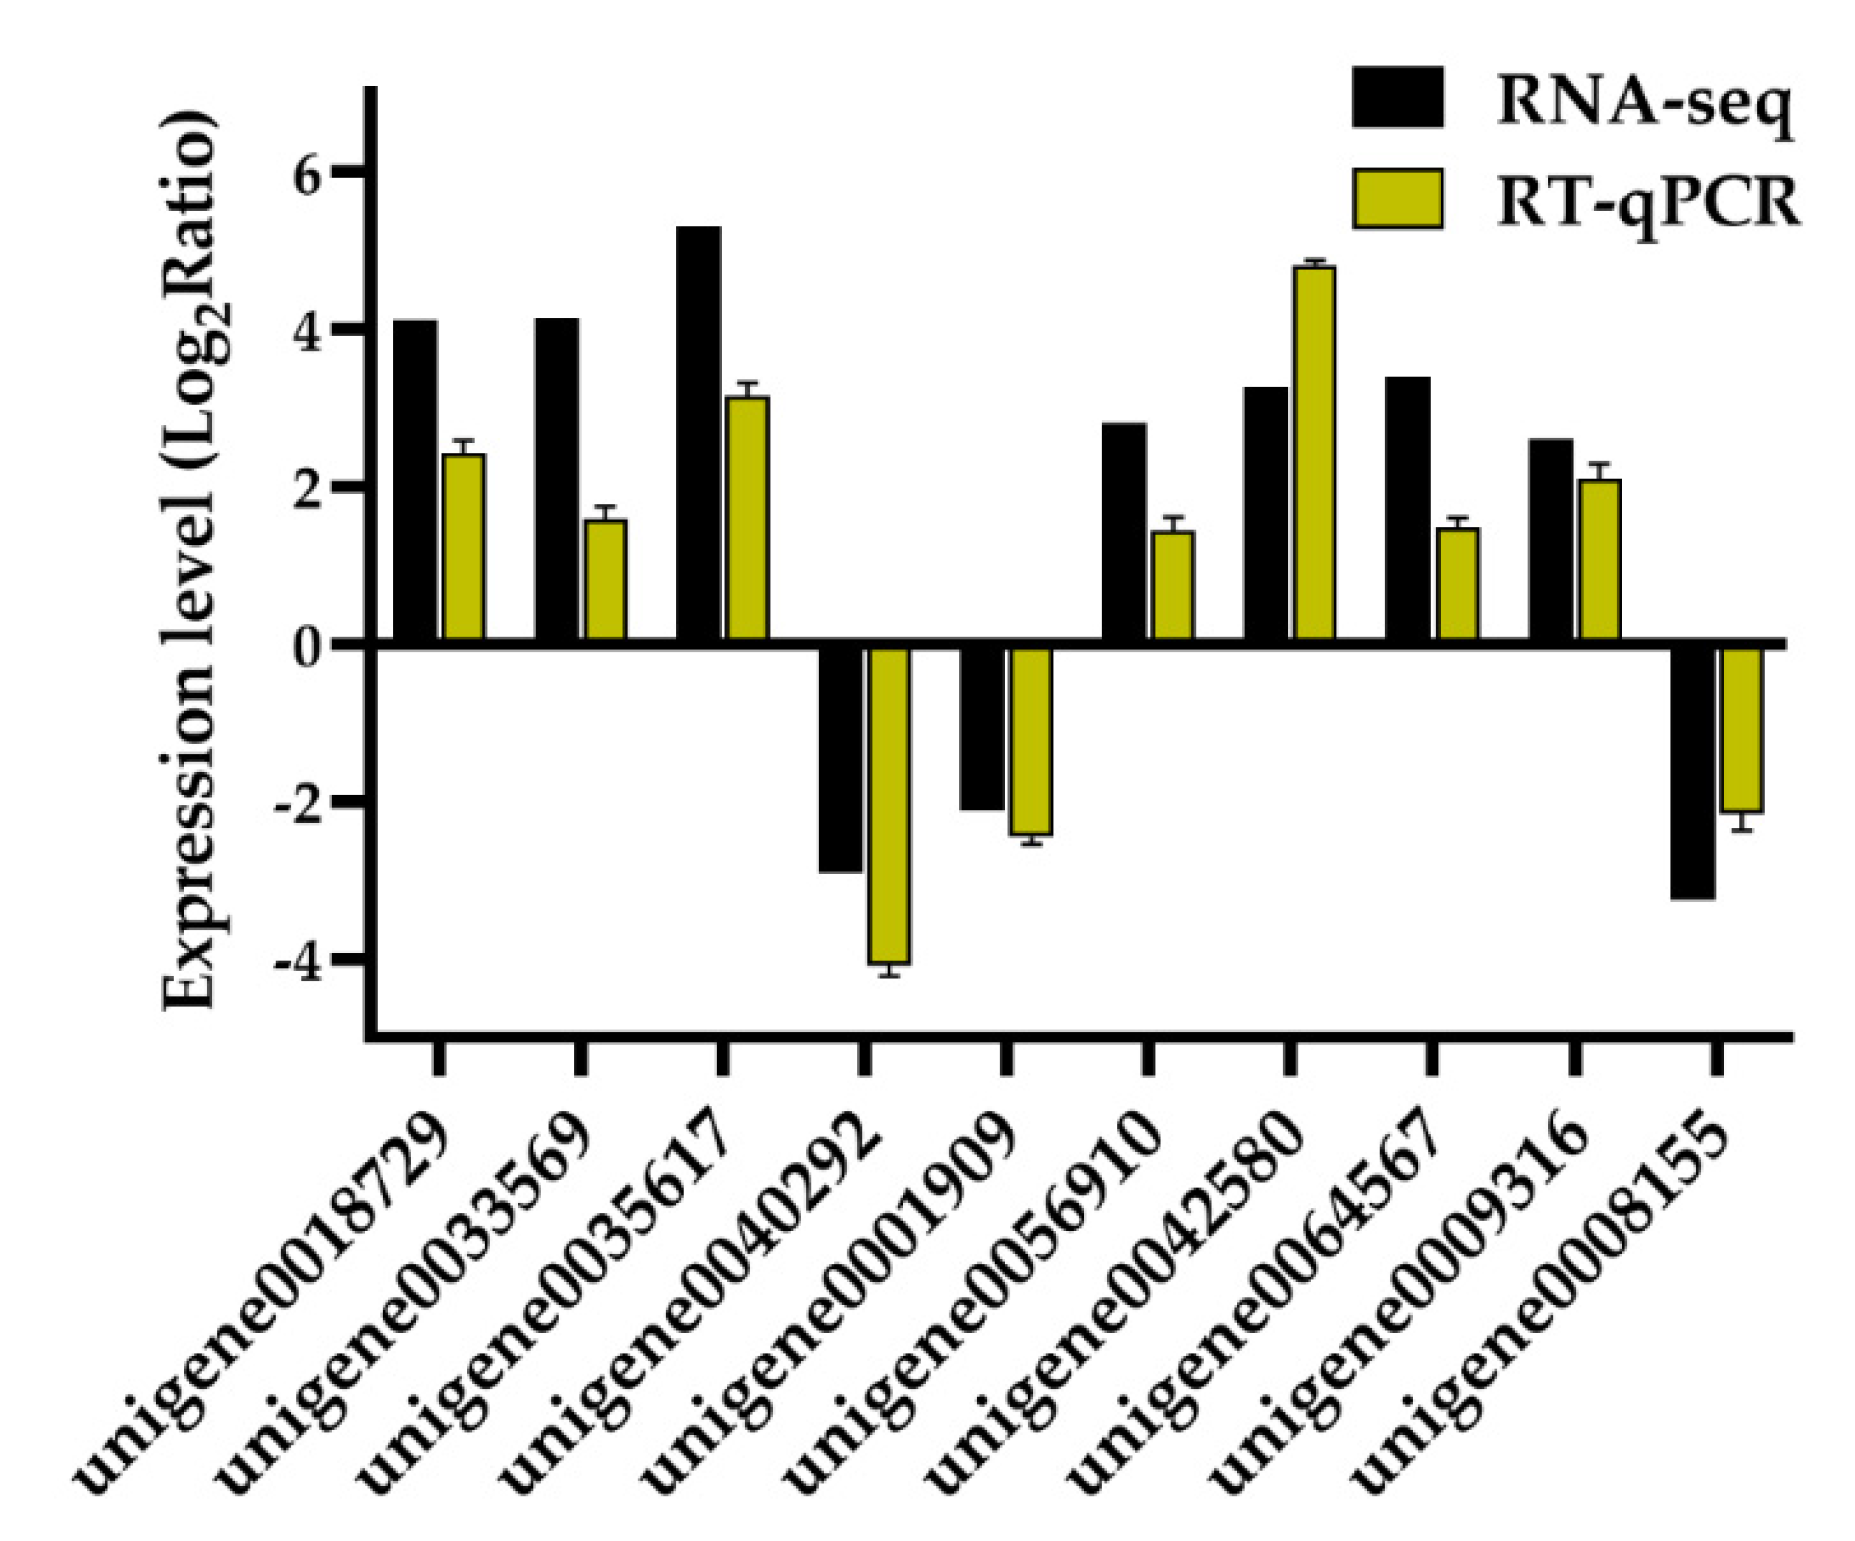
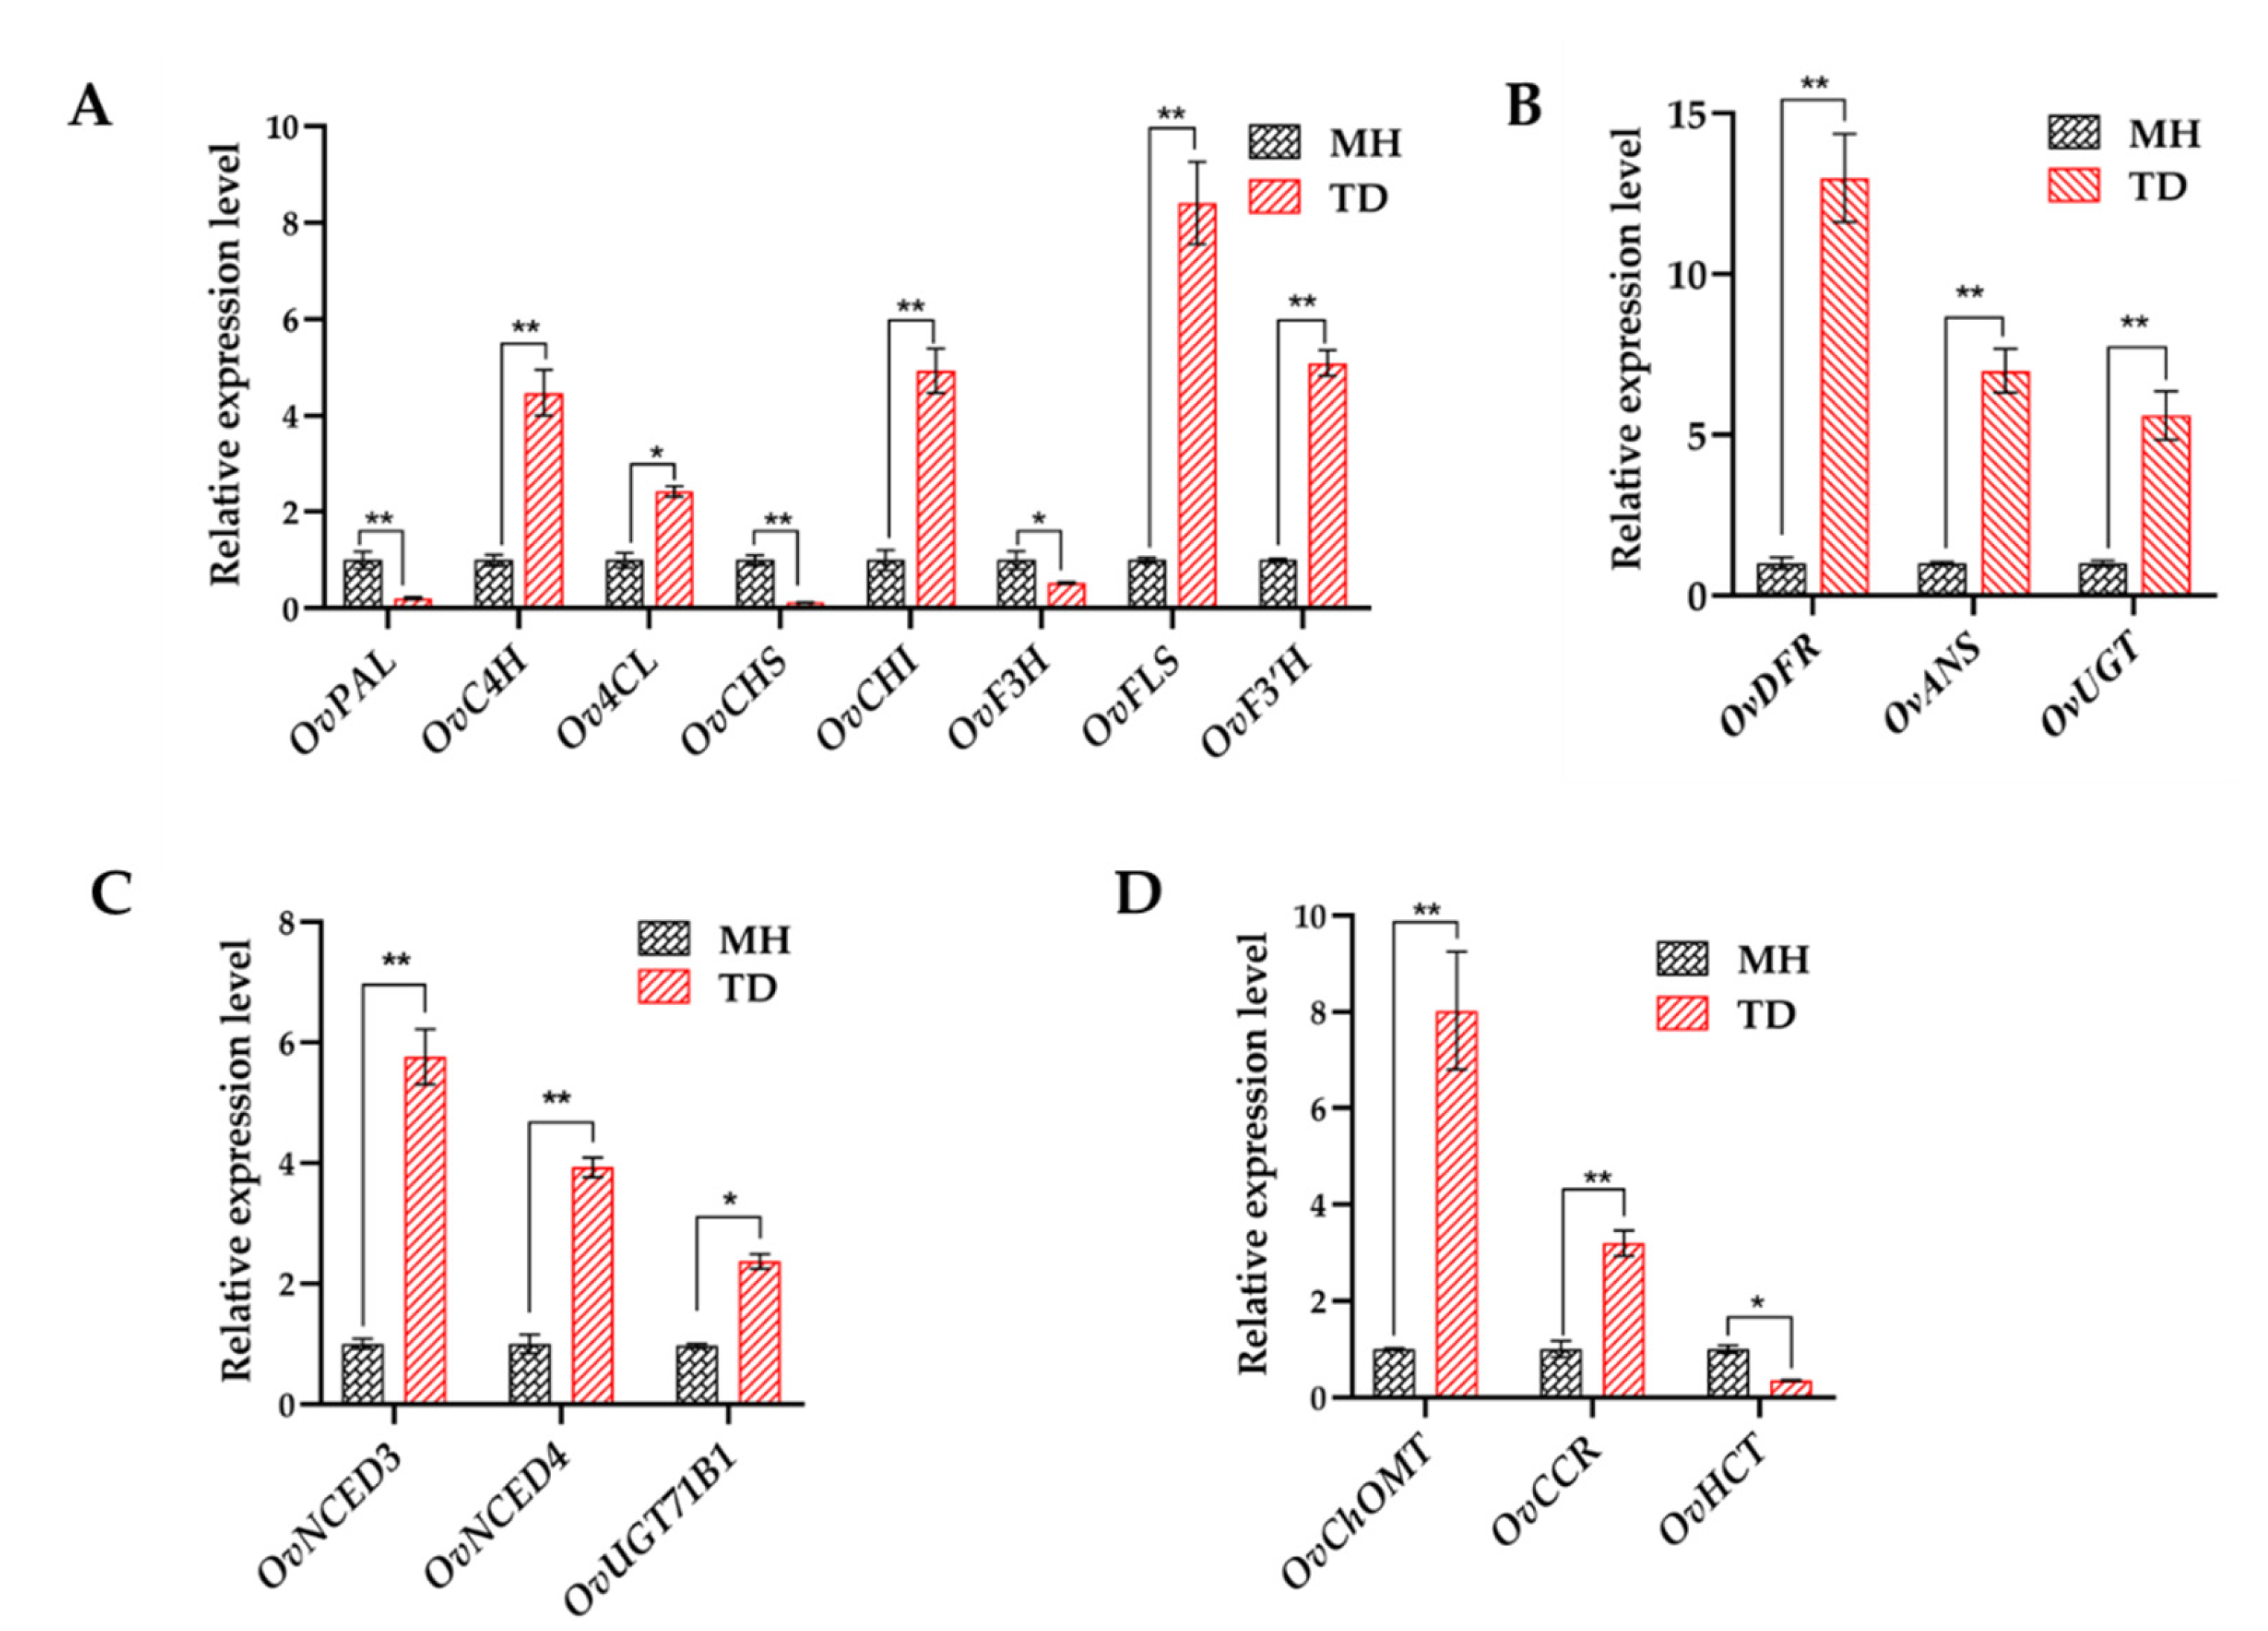
Phylogenetic tree was created using internal transcribed spacer sequences of indicated legume species and A. thaliana, which were downloaded from Genebank with the following accession numbers: AF053171.1 (T. pretense), JQ858260.1 (M. truncatula), AY594660.1 (C. arietinum), JQ858258.1 (Lotus japonicus), EU727147.1 (Vigna angularis), MH547408.1 (Phaseolus vulgaris), MG991099.1 (C. cajan) as well as AJ232900.1 (A. thaliana) that was set as an outgroup. The phylogenetic tress was constructed by the Neighbor-Joining method using software MEGA 6.0 with 1000 bootstrap.

2.6. RT-qPCR

Genomic DNA was removed from extracted total RNA using the PrimeScriptRT reagent Kit with gDNA Eraser (Takara, Dalian, China). DNA-free total RNA samples were then used to synthesize cDNA using the PrimeScriptRT reagent kit with the gDNA Eraser (Takara, Dalian, China), according to the manufacturer’s instructions. Detailed information on the primers used in the study is provided in Supplementary Table S10. The transcriptional levels of selected DEGs were detected using the TB Green Premix Ex TaqTM II (Tli RNaseH Plus) (Takara, Dalian, China) and the LightCycler 480 System (Roche, Basel, Switzerland). Three independent biological replicates were used in the RT-qPCR analysis, and the relative fold change was calculated based on the Ct values, with 18S rRNA being used as a reference gene [43].

2.7. Determination of the Contents of Total Flavonoids, Total Anthocyanins and Other Flavonoid Compounds

Fresh leaves of O. viciifolia plants were dried with a vacuum freeze dryer (EYELA, Tokyo, Japan), and then ground into powder and subjected to a sieve with aperture size of 0.15 mm. Subsequently, 0.1 g sample was then extracted with 1 mL methanol for 2 h at 60 °C using the ultrasonic extraction method, then centrifuged for 15 min at a speed of 13,500 rpm. The supernatant was subsequently used for determination of the contents of total flavonoids and total anthocyanins using the aluminum colorimetric method as described previously at the wavelengths of 510 and 530 nm, respectively, with rutin as a standard [44,45].
The qualitative and quantitative analyses of four flavonoid compounds rutin, quercetin, kaempferol, and myricetin were performed using the LC-20AT equipment equipped with a PDA detector (Shimadzu, Japan). Standard solutions of rutin, quercetin, kaempferol, and myricetin (purchased from Chengdu Herbpurity Co. Ltd., Chengdu, China) were dissolved in methanol at a final concentration of 0.37–0.60 mg/mL. The injection volume of samples or standards was 10 uL in each experiment. HPLC analysis of flavonoids was performed on a reverse phase C18 column (250 mm × 4.6 mm, 5 μm, Shimadzu, Japan) at a flow rate of 1 mL/min over a 60 min gradient program with 0.5% formic acid (solvent A) and acetonitrile containing 0.1% formic acid (solvent B) in a linear step: T = 0 min, 5% solvent B; T = 30 min, 35% solvent B; T = 45 min, 70% solvent B; T = 52 min, 100% solvent B; B; T = 53 min, 5% solvent B; T= 60 min, 5% solvent B. The column temperature was set at 30 °C.

3. Results

3.1. Transcriptome Profiling of O. viciifolia Grown under Two Different Natural Environmental Conditions

To understand how O. viciifolia plants acclimatize to extreme natural conditions under high altitude in the QTP at molecular level, we first obtained two comprehensive transcriptome profiles of leaves of O. viciifolia grown at two different altitudes of the QTP. Totally, six RNA-seq libraries of leaves collected from O. viciifolia plants planted in the high-altitude TD (E 100°39′26′’, N 35°09′45′’; H 3830 m) and low-altitude MH (E 102°34′46′’, N 36°15′56′’; H 1840 m) regions were generated. After conducting RNA-seq with the Illumina HiSeq 4000 platform, a total of 44,392,764, 81,922,056, 69,023,986, 53,001,304, 44,778,542, and 48,966,846 raw reads were obtained from three high-altitude plant samples (TD group; TD-1, TD-2, and TD-3) and three low-altitude plant samples (MH group; MH-1, MH-2, and MH-3), respectively (Table 1). Subsequently, low-quality reads and adapters were stringently trimmed, and a total of ~556 million high-quality reads accounting for more than 97.60% of the raw reads were obtained. De novo transcriptome assembly using Trinity [39] generated 74,791 unigenes, with an average sequence length of 820 bp and an average N50 of 1458 bp. The lengths of these unigenes were mainly distributed in the range of 200–500 bp (40,604 unigenes), followed by 500–1000 bp (14,805 unigenes), 1000–2000 bp (12,038 unigenes), and >2000 bp (7344 unigenes) (Supplementary Figure S1).

3.2. Annotation of Assembled Unigenes

To obtain the maximum number of annotated genes, all of the assembled unigenes were searched against public databases, namely the Non-Redundant Protein Sequence Database (Nr), Swiss Institute of Bioinformatics databases (Swiss-Prot), Kyoto Encyclopedia of Genes and Genomes (KEGG), and EuKaryotic Orthologous Groups (KOG) databases. In total, 46,508 unigenes were annotated by four databases, accounting for 62.18% of all assembled unigenes. Specifically, the numbers of unigenes with significant similarity to sequences annotated by Nr, Swiss-Prot, KOG and KEGG databases were 43,717 (58.45%), 32,973 (44.09%), 24,841 (33.21%), and 16,305 (21.08%), respectively, with an e-value ≤ 10−5 (Table 2 and Supplementary Figure S2).
A further analysis of annotated sequences revealed the best hits to Medicago truncatula (24.92% matched genes), followed by Cicer arietinum (20.98% matches), Glycine max (7.64%), and Cajanus cajan (7.22%) (Table 3). This result was reliable and could be explained by the fact that O. viciifolia is the closest species to M. truncatula and C. arietinum in terms of the phylogenetic relationship [46,47]. Additionally, a phylogenetic tree of O. viciifolia and its related legumes was generated, which also demonstrated the closest relationships of O. viciifolia with C. arietinum and M. truncatula (Figure 1).

3.3. DEGs from O. viciifolia Plants Grown at Different Altitudes

Since we were interested in exploring the molecular changes of O. viciifolia plants in acclimatization to high-altitude natural conditions, the samples harvested at low altitude were used as the control in the comparison. Thus, leaf transcriptome data of O. viciifolia plants grown at high-altitude TD and low-altitude MH were used in subsequent comparative transcriptome analyses (TD/MH comparison hereafter). A total of 8212 differentially expressed genes (DEGs) were identified in TD/MH with the threshold of |log2 (fold change, FC)| ≥  1 and p < 0.05. Of these DEGs, 5387 unigenes were up-regulated and 2825 unigenes were down-regulated in TD/MH comparison (Supplementary Table S1). The top 50 DEGs are displayed in Supplementary Table S2.
Ten DEGs were randomly chosen to verify the reliability of the obtained RNA-seq data using real time-quantitative PCR (RT-qPCR). The results showed that the tendency of transcriptional changes of all tested genes were consistent between the two methods (Figure 2 and Supplementary Figure S3), confirming the accuracy of our high-throughput RNA-seq data.

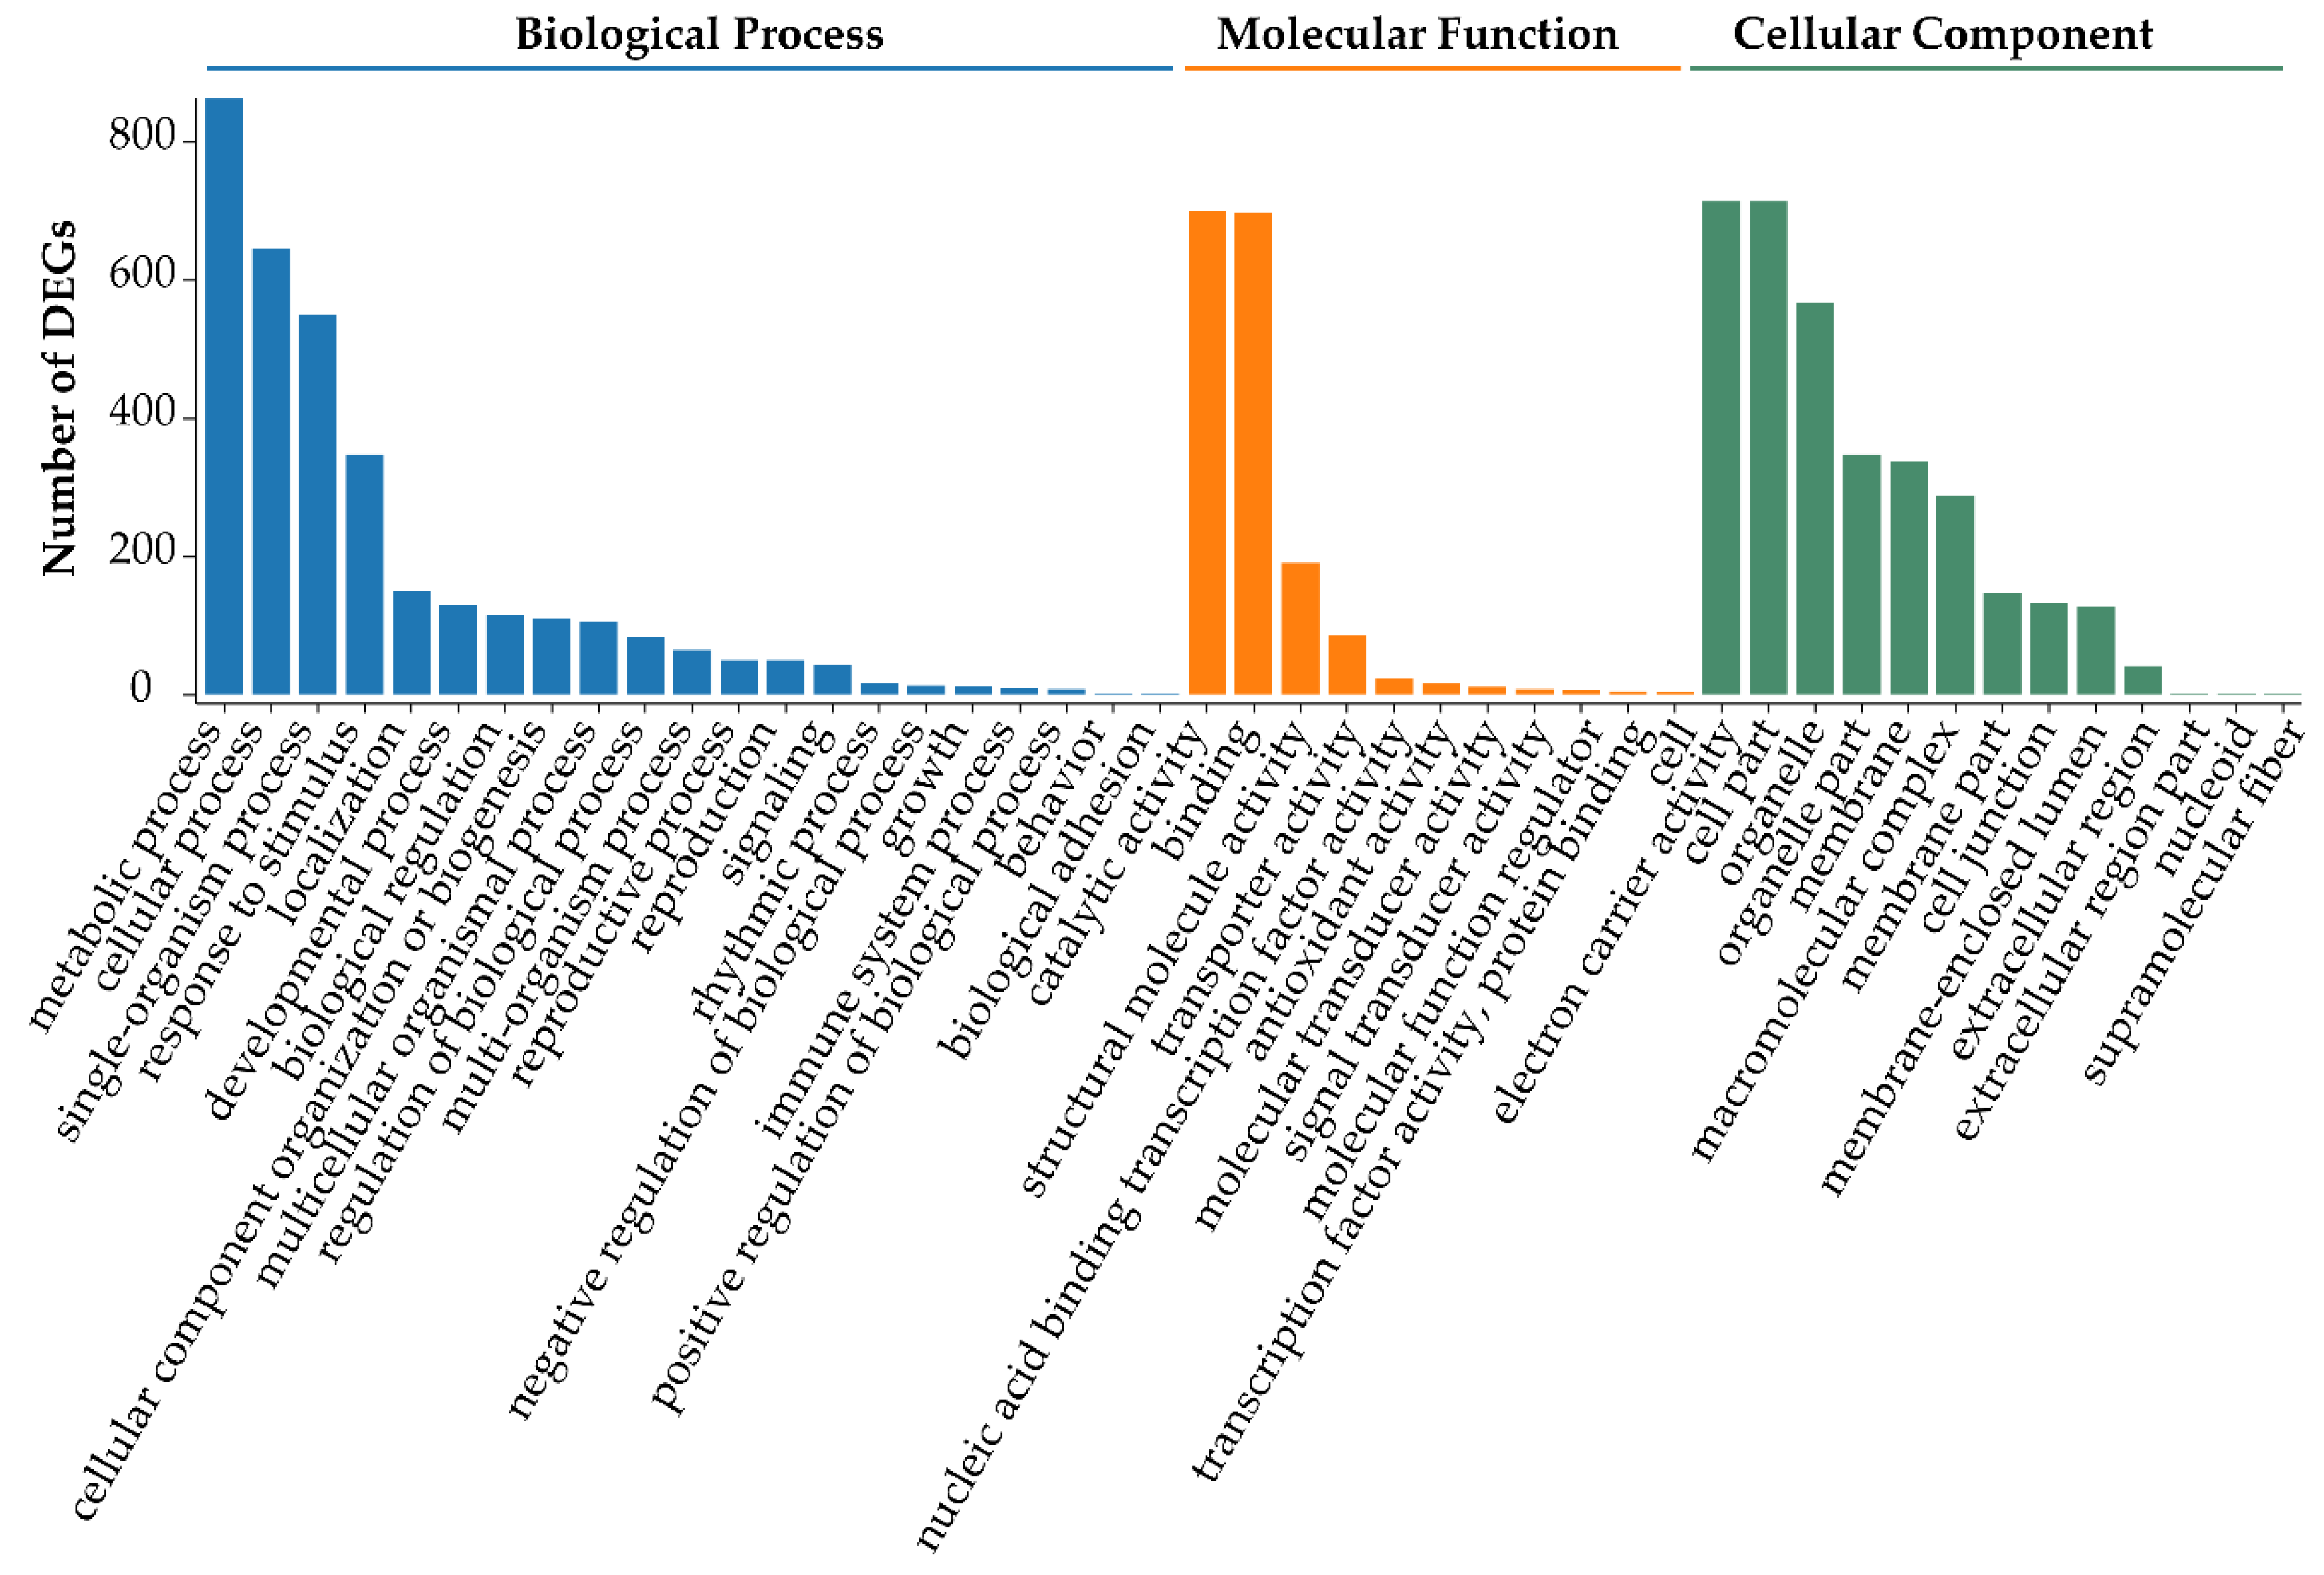
3.4. Functional Enrichment Analysis of DEGs

To further understand the functions of DEGs obtained from TD/MH comparison, gene ontology (GO, http://geneontology.org/) enrichment analysis was carried out to functionally classify the DEGs. Overall, the identified DEGs were enriched in 45 GO terms and assigned to the three categories of the GO database, namely ‘Biological Process’ (21 subcategories), ‘Cellular Component’ (13 subcategories), and ‘Molecular Function’ (11 subcategories) (Figure 3). GO subcategories ‘metabolic process’, ‘cellular process’, and ‘single-organism process’ in ‘Biological Process’, ‘catalytic activity’ and ‘binding’ in ‘Molecular Function’, and ‘electron carrier activity’, ‘cell part’, and ‘organelle’ in ‘Cellular Component’ were significantly enriched (Figure 3 and Supplementary Table S3).
In addition, the GO terms ‘response to light intensity’ (GO:0009642), ‘response to UV’ (GO:0009411), ‘rhythmic process’ (GO:0048511), and ‘response to osmotic stress’ (GO:0006970) were highly enriched with the DEGs (Supplementary Table S3), further confirming that the influence of solar radiation on gene expression patterns in plants at the higher altitude was more remarkable than that at the lower altitude [48]. Furthermore, of the 50 DEGs shown in Supplementary Table S2, numerous genes were involved in the biological processes responding to environmental stimuli, such as unigene0043850 (log2 (FC) = 4.34), unigene0054807 (log2 (FC) = 5.54), and unigene0060124 (log2 (FC) = 3.77). Interestingly, the highly expressed unigene0054137 (log2 (FC) = 11.43) was annotated to participate in the biological processes of ‘response to radiation’, ‘response to abiotic stimulus’, ‘rhythmic process’, and ‘long-day photoperiodism, flowering’ (Supplementary Table S3), suggesting that it might be involved in responses to solar radiation, light intensity and photoperiod. Thus, these results collectively indicate that the specific QTP natural conditions at higher altitude, such as strong solar radiation and long-day periods in the summer, will inevitably induce gene expression changes in O. viciifolia, leading to its acclimatization responses to such conditions. The unigene0054137, therefore, might be a promising candidate target for improving resistance of O. viciifolia to natural conditions of higher altitude.
To dissect the metabolic pathways, in which the DEGs are involved, the identified DEGs were mapped to the KEGG database. In total, 19 KEGG pathways were enriched into five categories, including ‘Genetic Information Processing’ (4 terms), ‘Metabolism’ (11 terms), ‘Organism Systems’ (1 term), ‘Cellular Processes’ (1 term), and ‘Environmental Information Processing’ (2 terms), suggesting that the most enriched metabolic processes could predominantly act in responses to environmental cues (Figure 4). Interestingly, DEGs were mainly overrepresented in ‘global and overview maps’, followed by ‘translation’, ‘carbohydrate metabolism’, ‘amino acid metabolism’, and ‘energy metabolism’ KEGG terms (Figure 4).
Given the difference in daily cycles between the high and low altitudes [49], we next took a closer look at the putative functions of the DEGs involved in the ‘circadian rhythm–plant’ pathway using a KEGG analysis (Figure 5 and Supplementary Table S4). The DEGs encoding phytochrome-interacting factor 3 (OvPIF3; unigene0042002, (log2 (FC) = 1.51)), cryptochrome (OvCRY; unigene0013838, (log2 (FC) = 1.01); unigene0054923, (log2 (FC) = 1.85); unigene0065731, (log2 (FC) = 1.41)), constitutive photomorphogenic 1 (OvCOP1; unigene0001254, (log2 (FC) = 1.50)), ZEITLUPE (OvZTL; unigene0039545, (log2 (FC) = 1.19)), and late elongated hypocotyl (OvLHY; unigene0039545, (log2 (FC) = 1.19); unigene0067673, (log2 (FC) = 6.42)) were significantly up-regulated (Figure 5). In contrast, the down-regulated DEGs involved in the ‘circadian rhythm–plant’ pathway consisted of pseudo-response regulator 5 (OvPRR5; unigene0001332, (log2 (FC) = −1.37)), flavin-binding kelch repeat F-box protein 1 (OvFKF1; unigene0035551, (log2 (FC) = −2.09)), chalcone synthase (OvCHS; unigene0004754, (log2 (FC) = −1.70); unigene0016510, (log2 (FC) = −2.40)), and timing of cab expression 1 (OvTOC1; unigene0002982, (log2 (FC) = −2.12)). The positive roles of PIF3, CRY, and PRR5 in responses to various abiotic stresses have been well-documented in plants [50,51,52]. Our analysis suggested that these changes in gene expression may be closely related to the acclimatization of O. viciifolia plants to the long-day photoperiod occurring at higher altitude in the QTP.

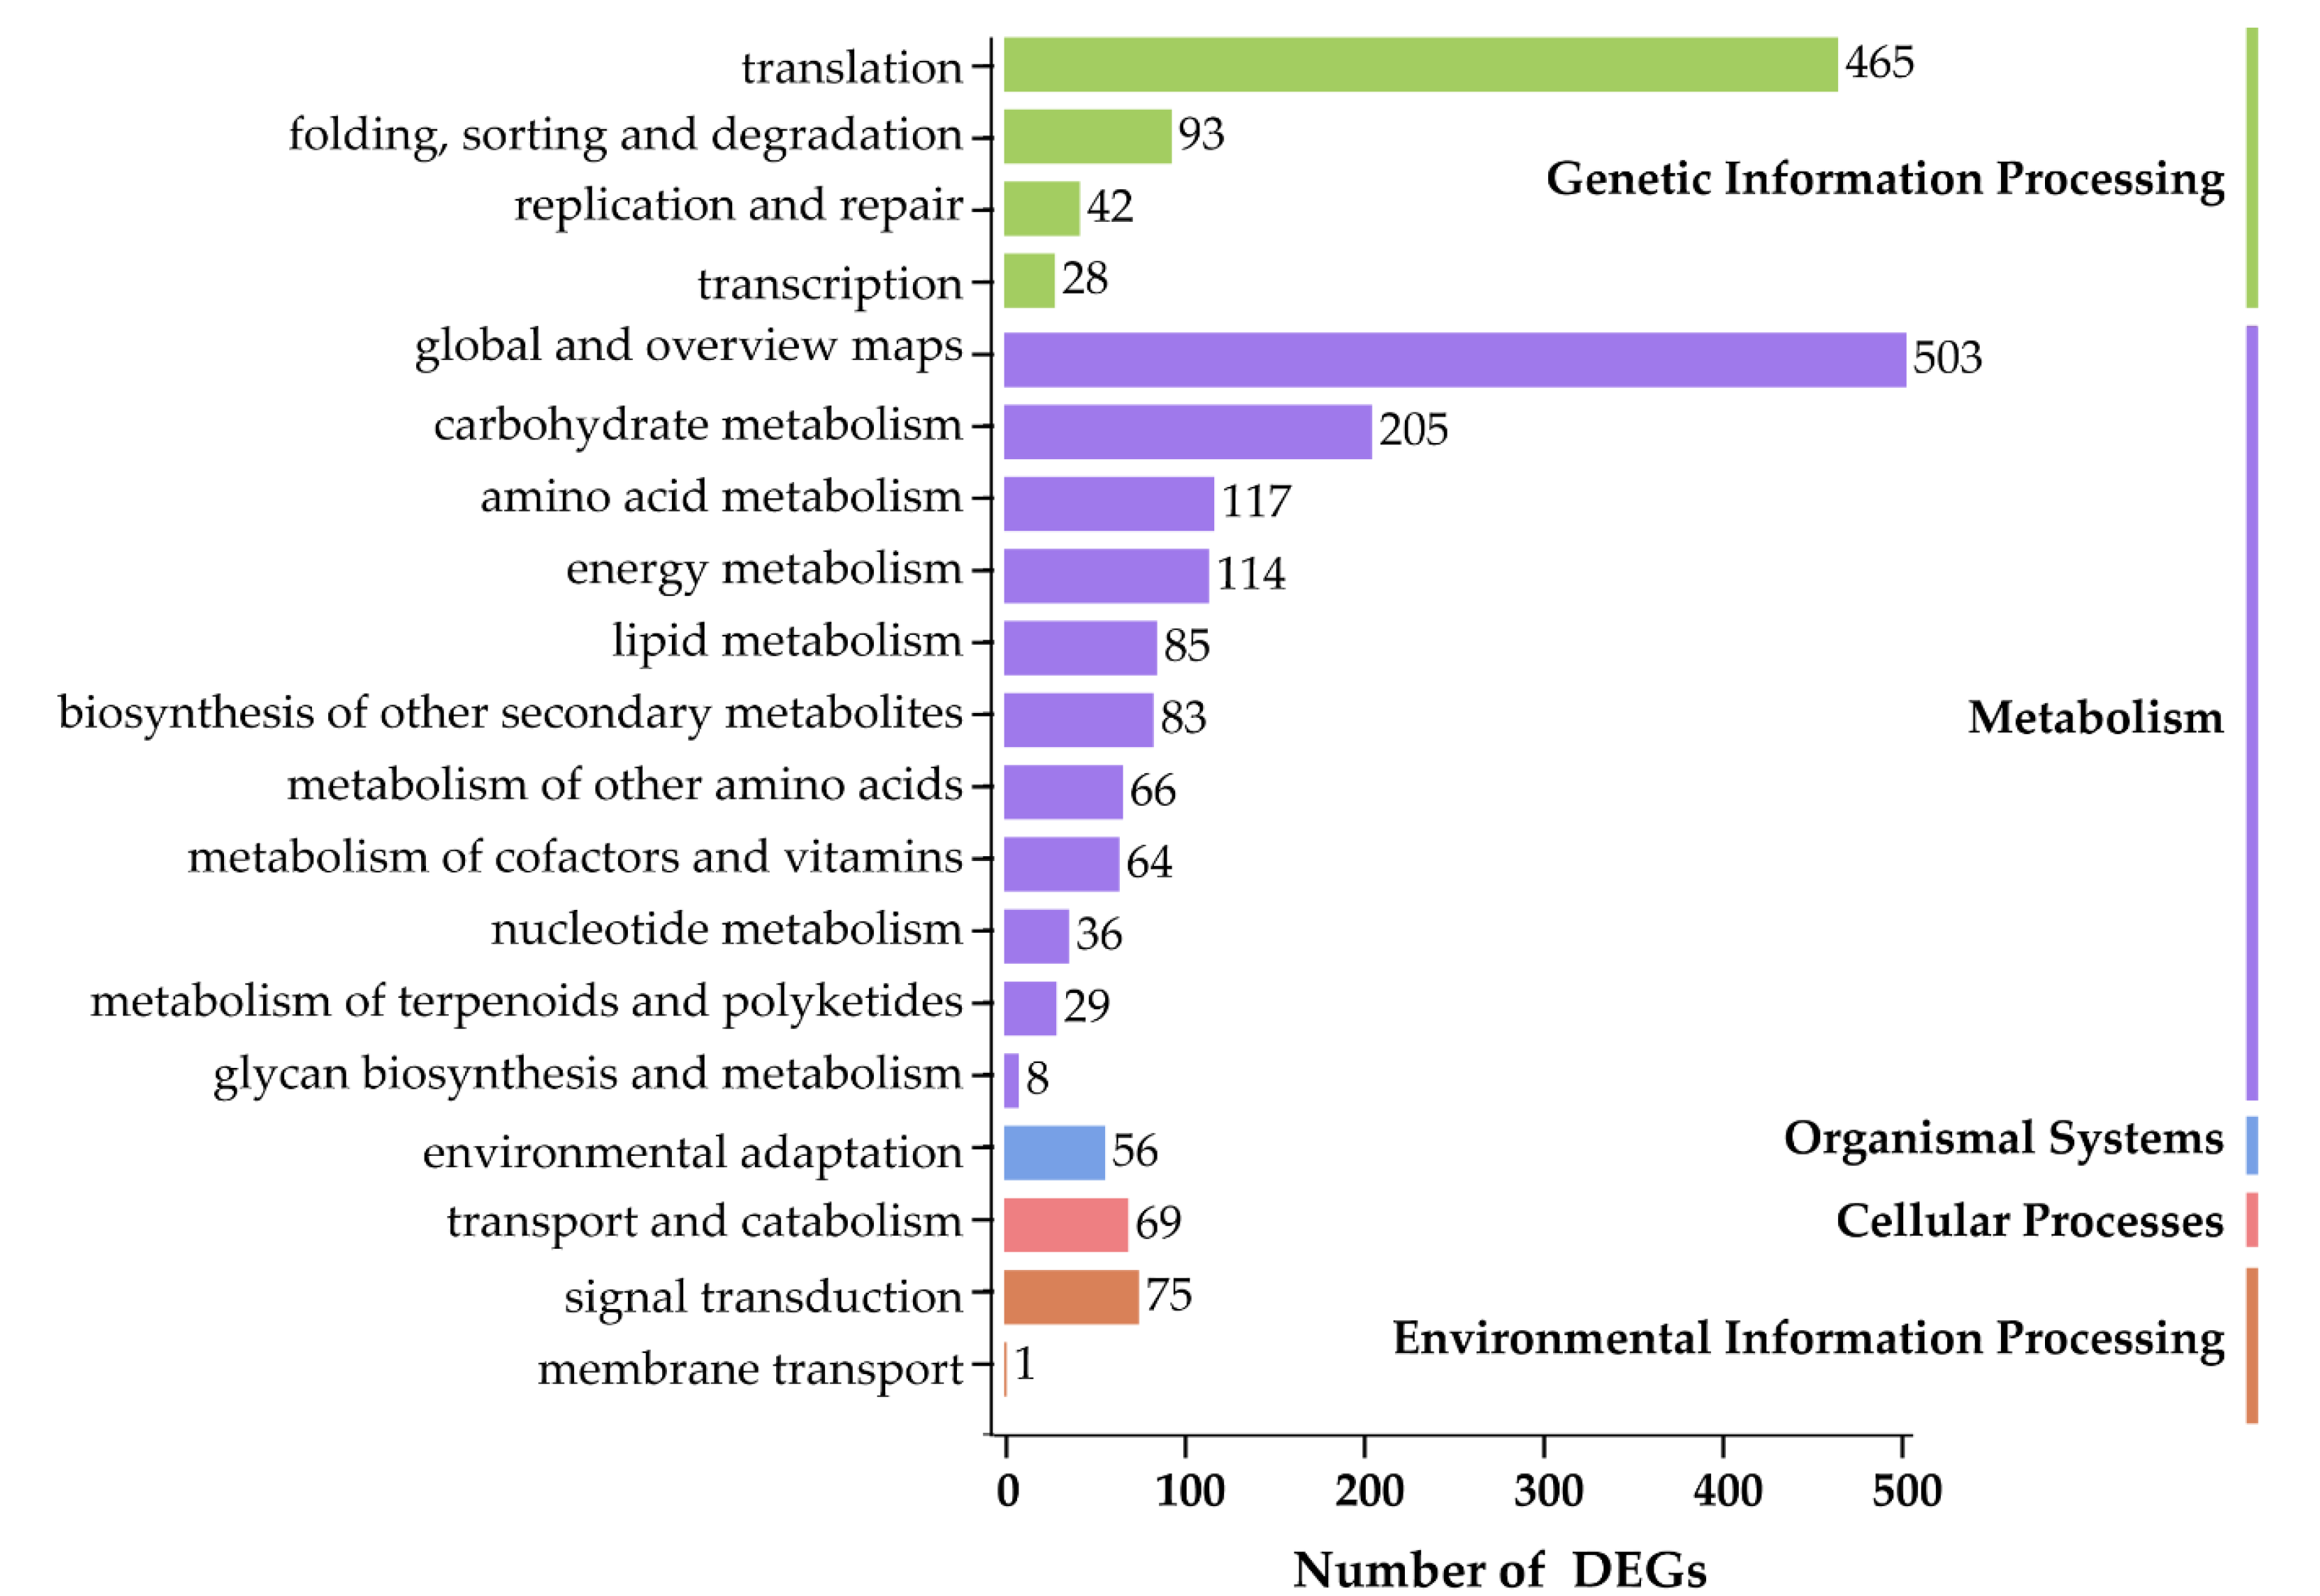
3.5. Global Environmental Stress Responses Revealed by MapMan Analysis

To extend our understanding of the biological functions of the identified DEGs, a MapMan analysis was (http://mapman.gabipd.org/) performed to visualize the pathways involved in the environmental stress responses. The DEGs and their mapping files were annotated and generated with an online tool of the Mercator version 3.6 (https://www.plabipd.de/portal/web/guest/mercator-sequence-annotation) [42]. Results revealed that a total of 8212 DEGs were mapped to 845 pathways, of which 52 pathways were filtered and enriched by the DEGs with the cutoff p < 0.05 (Figure 6 and Supplementary Table S5). Among these metabolic pathways, the majority of DEGs were overrepresented in three pathways, namely ‘TCA/org. transformation. TCA’, ‘flavonoids’ and ‘phenylpropanoids and phenolics’ (Figure 6), suggesting that these pathways might contribute the most to resisting adverse natural conditions of the QTP. Due to the antioxidative functions of flavonoids and phenylpropanoids in many plant species under stress conditions [53,54], we more closely investigated the DEGs involved in their biosynthetic pathways (Figure 7 and Supplementary Figure S4; Supplementary Table S6). Genes encoding key enzymes involved in the flavonoid biosynthetic pathway, such as flavonol synthase (OvFLS; unigene0046947, log2 (FC) = 5.26), uridine diphosphate glycosyltransferase (OvUGT; unigene0015711, log2 (FC) = 1.92; unigene0046763, log2 (FC) = 1.96), ferulate 5-hydroxylase (OvF3′H; unigene0043777, log2 (FC) = 5.00), and dihydroflavonol reductase (OvDFR; unigene0002996, log2 (FC) = 9.78), were significantly up-regulated, whereas those encoding OvCHS (unigene0016510, log2 (FC) = −2.40; unigene0004754, log2 (FC) = −1.70) and flavanone-3-hydroxylase (OvF3H; unigene0051593, log2 (FC) = −2.20) were down-regulated (Figure 7). The number of genes putatively encoding OvFLS enzymes was mostly represented, suggesting that their end-products of three biosynthesized small molecules quercetin, kaempferol, and myricetin might play positive roles in promoting the environmental stress resistance of O. viciifolia grown in the higher altitudes of QTP (Figure 7). Furthermore, derivatives of these three compounds, such as glycosylated compounds [55], might also play substantial roles in the resistance of O. viciifolia.
In the phenylpropanoid biosynthetic pathway, genes encoding 4-coumarate-CoA ligase (Ov4CL; unigene0063881, log2 (FC) = 1.87; unigene0059064, log2 (FC) = 1.51), chalcone O-methyltransferase (OvChOMT; unigene0021581, log2 (FC) = 9.37; unigene0046268, log2 (FC) = 8.50), and cinnamoyl CoA reductase (OvCCR; unigene0039454, log2 (FC) = 3.10; unigene0059064, log2 (FC) = 1.51) showed distinct up-regulation, whereas those encoding hydroxycinnamoyl transferases (OvHCT; unigene0023010, log2 (FC) = −6.06; unigene0034833, log2 (FC) = −2.34) were down-regulated (Supplementary Figure S4 and Supplementary Table S6). The polyphenols like flavonoids and phenylpropanoids, as important components of the non-enzymatic antioxidant system have important roles in plant resistance to environmental stresses through scavenging excessive reactive oxygen species (ROS) induced by stresses [54]. The dramatic increase in biosynthesis of these secondary metabolites in the TD-grown plants, compared with the MH-grown plants, would aid O. viciifolia plants in their acclimatization to the extreme conditions in higher altitude regions of the QTP, such as extremely low temperature, drought, and strong UV radiation.

3.6. Responses of DEGs Involved in Phytohormone Pathways

Important roles of phytohormones in regulating plant growth and development, and their responses to resist abiotic and biotic stresses have been published by numerous studies [4,20,56,57]. According to the results of MapMan analysis, 108 DEGs including 92 up-regulated and 16 down-regulated genes were shown to be involved in various hormone-related metabolic and signaling pathways (Supplementary Table S7). Interestingly, most hormone-related genes were discovered in the ABA (24), IAA (18), and ethylene (18) metabolic and signaling pathways, followed by those associated with other hormones like GA, JA, CK, brassinosteroid (BR), and salicylic acid (SA) (Supplementary Table S7). As shown in Figure 8, the majority of genes involved in hormone pathways were up-regulated. Particularly, 24 identified genes, including OvNCED3, OvNCED4, and OvUGT71B1, related to ABA pathway all showed up-regulation. Ethylene and IAA were the two other hormones that displayed the second highest number (18 genes/each hormone) of related DEGs, and the majority of these DEG also exhibited up-regulated expression patterns. Our data suggest that the changes in expression of the identified DEGs associated with these hormones, particularly ABA, might contribute to better acclimatization of O. viciifolia plants to the adverse environmental conditions of higher altitude at the QTP.

3.7. Responses of DEGs Encoding TFs

TFs have been shown to play crucial roles in regulating the expression of downstream genes, and impact different physiological characteristics of plants in responses to environmental stresses [20]. In the present study, we identified 155 DEGs putatively referred to as TFs. These TFs were assigned to 21 different TF families, among which 126 TFs were up-regulated and 29 TFs were down-regulated (Supplementary Table S8). The five most abundant TF families were MYB (21), homeodomain-leucine zipper (HD-ZIP, 18), WRKY (14), NAC (13), and apetala2/ethylene responsive factor (AP2/ERF, 13), followed by basic helix-loop-helix (bHLH, 10), C(2)-C(2) zinc finger constans like (C2C2-CO-like, 8), auxin response factor (ARF, 8), heat shock factor (HSF, 7) and other TF families (43). The majority of NAC, AP2/ERF and WRKY family genes in the two group samples presented significantly diverse expression patterns (Figure 9), suggesting that these TFs would functionally play major roles in the environmental stress resistance of O. viciifolia grown at high altitude. In comparison, most members of MYB, bHLH, C2C2-CO-like, and HSF families were highly expressed either in the plants grown at TD or MH. In addition, the majority of C2C2 (5), B3 (4), bZIP (3), and gibberellic acid insensitive, repressor of GAI, scarecrow (GRAS, 3) family genes were only highly expressed in the TD-grown plants. In the past decades, the ectopic expression/overexpression of many TFs leading to enhanced resistance to environmental cues in diverse plant species has been reported in numerous studies. For instance, DREB genes encoding AP2/ERF-type stress-responsive TFs modulate the expression of many downstream stress-inducible genes [58]. Ectopic expression of StDREB2 of Solanum tuberosum in cotton (Gossypium barbadense) enhanced the drought resistance, while ectopic expression of ScDREB10 of Syntrichia caninervis in Arabidopsis increased osmotic and salt tolerance of transgenic plants. Furthermore, overexpression of TaDREB3 improved frost resistance of transgenic wheat seedlings [59,60,61]. In addition, DEAR4 which is a member of the DREB subfamily was reported to positively regulate the cell death and leaf senescence, and to be responsive to multiple stressors in A. thaliana [62,63]. In our study, unigene0036544, homologous to DEAR4, was significantly up-regulated (log2 (FC) value of 5.04), which might also be correlated with the responses of O. viciifolia to natural conditions in the higher altitude. The TFs identified in our study represent potential targets for promoting O. viciifolia plants to be more resistant to the extreme QTP conditions.

3.8. Quantitative Analyses of Flavonoids and Anthocyanins

To validate whether the contents of flavonoids and anthocyanins in O. viciifolia plants were changed under different altitudes, their total contents were measured using colorimetric method, and four flavonoids including myricetin, quercetin, kaempferol, and rutin were determined by high performance liquid chromatograph (HPLC). Results showed that the contents of total flavonoids and anthocyanins in high-altitude O. viciifolia (TD) were 41.58 and 39.96 mg/g dry weight (DW), respectively, which were significantly higher than those (36.75 and 36.42 mg/g DW, respectively) in MH-grown plants at low altitude (Figure 10A and Supplementary Table S9). Furthermore, the contents of four flavonoids also showed higher tendency in the TD- than MH-grown plants. Specifically, myricetin, quercetin, and kaempferol displayed the contents of 0.58, 0.62, and 0.45 mg/g DW, respectively, whereas the respective values were 0.53, 0.4 and 0.35 mg/g DW in the MH-grown plants (Figure 10B,C and Supplementary Table S9). In addition, rutin showed the highest contents among the four compounds with 17.17 and 15.74 mg/g DW in TD and MH, respectively (Figure 10B,C and Supplementary Table S9). These results are agreement with rutin levels previously reported in O. viciifolia [32].

4. Discussion

As an excellent quality forage legume that has enriched nutritional constituents and anthelmintic properties, and ability to reduce methane emissions and increase nitrogen-use efficiency [28,34], O. viciifolia is being increasingly recognized as a high-quality alternative to traditional forage alfalfa in the QTP; and thus, it has a great potential to be widely planted in the QTP. However, the underlying molecular mechanisms of O. viciifolia adapting to extreme conditions, especially when growing at higher altitudes, are largely unclear. In this study, using a comparative transcriptome analysis of leaves of O. viciifolia plants grown at high altitude (TD) and low altitude (MH), 8,212 DEGs were identified to be involved in the plant responses to higher altitude conditions. This result will greatly increase our understanding with respect to molecular mechanisms underlying acclimatization of O. viciifolia plants grown at higher altitudes, enable us to develop adaption-related molecular markers, as well as provide a way to improve quality and yield of this important forage.
The transcriptome of seven-day-old O. viciifolia whole seedlings was previously reported, and numerous flavonoid biosynthesis-related genes, simple sequence repeats and single nucleotide polymorphisms were identified [64]. However, the earlier study [64] was conducted using O. viciifolia plants grown under the controlled conditions; and thus, the results could not reflect how O. viciifolia can respond and adapt to extreme natural conditions in the QTP. Nevertheless, the phylogenetic tree constructed previously showed the closest relationships of O. viciifolia with red clover (Trifolium pratense) and M. truncatula [64]; however, the authors did not include C. arietinum in their study. In the present study, C. arietinum was included in the phylogenetic analysis, and the results revealed that O. viciifolia exhibited the closest relationships to C. arietinum, followed by M. truncatula and T. pratense (Figure 1). Additionally, the annotated sequences in our transcriptome data showed the highest homology to those of C. arietinum and M. truncatula, further strengthening their closest phylogenetic relationships among others (Table 3).
It is well documented that phenotypic traits of plants are influenced by environmental gradients [65,66,67]. Intriguingly, some phenotypic traits of O. viciifolia plants grown at two different altitudes showed a great difference according to our filed survey in the last three years. For example, with the increase of elevation, the plant height and tiller number of O. viciifolia plants grown at the high-altitude TD (87.6 cm and 7, respectively) were slightly shorter and much lower, respectively, than those grown at the lower-altitude MH (94.7 cm and 13, respectively) (Supplementary Figure S5). The decrease in plant height along with the altitude elevation was also observed in other species grown in the QTP, including most of the Rhododendron species [68], suggesting that this phenotypic change is a common acclimatization strategy of plants growing under adverse natural conditions of the QTP. It was also reported that tiller numbers in two teosintes (Zea mays ssp. Parviglumis and Z. mays ssp. mexicana) were decreased with the increase of elevation [66]. Since decreased tiller numbers could also be triggered by drought stress [23], drier and cooler climate in the high-altitude TD region might cause decrease in tiller number of O. viciifolia plants grown in that area in comparison with those grown in the low-altitude MH. In addition, the flowering time of O. viciifolia plants in TD is delayed and the flower longevity is shorter in comparison with MH-grown plants. O. viciifolia generally flowers around the beginning of July at the high-altitude TD, whereas it flowers around mid-June at the low-altitude MH. Compared with the MH-grown plants, the flower longevity in the TD-grown plants is shorten by 5 to 10 days based on a filed survey. These observations in phenotypic defects of the TD-grown plants versus the MH-grown plants could be plausibly explained by the cooler weather and longer solar radiation period in higher-altitude regions, which lead to delay in flowering time and shorter flowering period to avoid adverse environmental conditions to allow plants to switch rapidly to the reproductive stage to complete their life cycle [69,70]. Accordingly, transcriptional changes of many circadian rhythm-related genes were detected from the TD/MH comparison. For example, flowering-related genes OvTOC1 (unigene0002982), OvFKF1 (unigene0035551), and OvPRR5 (unigene0001332) were found to be significantly down-regulated with log2 (FC) values of −2.12, −2.09, and −1.37, respectively, under long-day photoperiod in the TD/MH comparison (Figure 5). These genes are believed to negatively regulate flowering time in A. thaliana and rice (Oryza sativa) [23,71,72,73,74], suggesting that down-regulation of these genes may lead to delaying flowering time in O. viciifolia plants grown at the high-altitude TD as discussed earlier. Furthermore, OvPIF3 and its target gene OvLHY also negatively regulate flowering time in Arabidopsis [75]. Interestingly, unigene0042002 and unigene0067673 homologous to OvPIF3 and OvLYH, respectively, were up-regulated in TD/MH comparison in this study (Figure 5), implying a complex circadian rhythm-related mechanism regulating late flowering of O. viciifolia plants growing at high altitudes with extreme natural conditions.
Plant secondary metabolites, in particular flavonoids, phenylpropanoids, and anthocyanins that all derive from phenylalanine biosynthetic pathway, play essential roles in resisting environmental stimuli [76,77]. Moreover, flavonoids and anthocyanins have critical functions in regulating fruit colors and qualities. MapMan analysis of 8212 DEGs displayed that flavonoid, anthocyanin, and phenylpropanoid biosynthetic pathways were the most highly enriched with the DEGs among all detected secondary metabolite pathways, and the majority of related genes were up-regulated (Supplementary Table S7), suggesting the importance of these three classes of polyphenols in acclimatization of O. viciifolia to high-altitude conditions. Generally, when facing with detrimental environmental stresses, plants initiate a wide range of enzymatic and non-enzymatic antioxidants to scavenge excess free radicals, including ROS [54,78,79]. The polyphenolic compounds are the central components of non-enzymatic antioxidants [54]; and thus, promotion of their biosynthesis is a defense strategy against adverse environmental conditions [76,80,81]. Consistent with the results of transcriptome analysis, results of RT-qPCR analysis also verified up-regulation of several key flavonoid, phenylpropanoid, and anthocyanin biosyntheses-related genes, especially OvFLS, in the TD/MH comparison (Figure 11A,B).
Intriguingly, although OvPAL, OvCHS, and OvF3H, which are involved in flavonoid biosynthesis, showed decreased expression levels in TD/MH comparison (Figure 11A), the content of total flavonoids in TD-grown plants was significantly higher than in MH-grown plants, indicating a complex regulation of flavonoid biosynthesis where these three genes might not play rate-limiting roles. Nevertheless, this result demonstrates the importance of enhanced flavonoid biosynthesis in acclimatization of O. viciifolia to high-altitude conditions. In addition, three end-products of OvFLS enzyme, namely myricetin, quercetin, and kaempferol, were also highly produced in the TD- than MH-grown plants (Figure 10 and Supplementary Table S9). This result suggests that low molecular weight antioxidants are more highly produced to help O. viciifolia resist oxidative stress triggered by extreme natural conditions at higher altitudes. In addition to the three above-mentioned flavonoids, the compound rutin, a glycosylated derivative of quercetin, displayed the highest contents in both TD- and MH-grown plants, which TD-grown plants possessing higher rutin content than MH-grown plants (Figure 10 and Supplementary Table S9). A recent investigation also revealed the critical roles of rutin in abiotic stress tolerance of Fagopyrum tataricum [82]. It is plausible that induction of rutin biosynthesis in O. viciifolia is important for its adaption to extreme natural conditions at high altitudes in the QTP as well.
In comparison with MH, three key genes, namely OvDFR, OvANS, and OvUGT, that are involved in anthocyanin biosynthesis were up-regulated in the range of 5- to 13-fold in leaves of TD-grown versus MH-grown O. viciifolia plants (Figure 11B), which is consistent with the observed higher anthocyanin contents in TD plants than MH plants (Figure 10A). In the phenylpropanoid biosynthetic pathway, the OvChOMT and OvCCR were also dramatically up-regulated, whereas OvHCT was down-regulated in the TD/MH comparison (Figure 11C), which might be explained by the fact that the biosynthesis of phenylpropanoid is independent of HCT enzymes [83]. Taken together, our results indicate that, the biosyntheses of polyphenolic antioxidants are activated in O. viciifolia along with increasing altitudes to adapt to more extreme natural conditions.
Important roles of phytohormones in regulating plant growth and development, and their responses to resist abiotic and biotic stresses have been published by numerous studies [4,20,56,57]. Notably, in the ABA biosynthetic pathway, two genes OvNCED3 (unigene0064567) and OvNCED4 (unigene0008736) belonging to the nine-cis-epoxycarotenoid dioxygenase (NCED) family, were both significantly up-regulated in TD/MH comparison with log2 (FC) values of 3.40 and 3.10, respectively (Supplementary Table S7), as also verified by RT-qPCR (Figure 11D). Members of the NCED family have been shown to encode key rate-limiting enzymes through the oxidative cleavage of cis-epoxycarotenoids in the ABA biosynthetic pathway to accumulate ABA for further signal transduction in order to resist abiotic stresses [84,85,86,87]. In recent studies, overexpression of AtNCED3 in Arabidopsis enhanced the drought tolerance by promoting the levels of ABA [88,89]. In rice, the overexpression of OsNCED3 resulted in increased ABA content and promote water stress tolerance of the transgenic plants [90]. These results clearly demonstrated a positive correlation between expression levels of NCED genes and ABA accumulation, which suggests that up-regulation of OvNCED3 and OvNCED4 in TD/MH comparison might accelerate ABA biosynthesis and accumulation in TD-grown O. viciifolia plants, compared with MH-grown plants, leading to their enhanced resistance to adverse climate conditions at high altitude of the QTP. In addition, the majority of the IAA-related genes identified showed homology to small auxin-up RNA (SAUR) genes, among which unigene0034372 showing high homology to SAUR31 of A. thaliana was the most highly up-regulated gene (log2 (FC) = 5.02) (Supplementary Table S7). Auxin affects almost every aspect of plant development, and is also an important regulator of the interaction between plants and their growth environment [91]. During the regulation processes by auxin, SAUR genes are of paramount importance in the regulation of dynamic and adaptive growth in plant responses to environmental cues [92]. Our data suggested that the highly induced expression levels of putative SAUR genes in O. viciifolia might also be linked to its responses to the extreme environmental conditions of the QTP.
Uridine diphosphate glucosyltransferases (UGTs) are extensively believed to modulate the endogenous phytohormone homeostasis to further promote abiotic stress resistance in plants via their glycosylated function that is referred to the formation of hormone conjugates [93,94,95,96,97,98]. As expected, numerous DEGs encoding UGTs were identified to participate in various hormone-related pathways (Figure 8 and Supplementary Table S7). For instance, according to the transcriptome data, unigene0037761, encoding OvUGT71B1 involved in ABA metabolic pathway, was up-regulated (log2 (FC) = 2.96) in the TD/MH comparison (Supplementary Table S7), as also confirmed by RT-qPCR analysis (Figure 11D). A previous study reported that three UGT genes of A. thaliana, namely UGT71B6, UGT71B7, and UGT71B8, to which OvUGT71B1 shows high homology, play pivotal roles in regulating ABA homeostasis, and in Arabidopsis adaptation to osmotic stress, dehydration and salinity [94,96]. In the CK-related pathway, two OvUGT-encoding genes, unigene0018949 and unigene0055908 coding for OvUGT85A2 and OvUGT73C1, were up-regulated with log2 (FC) values of 2.60 and 1.60, respectively, while unigene0039749 encoding OvUGT85A1 was significantly down-regulated with the log2 (FC) value of −8.92 (Figure 8 and Supplementary Table S7). Additionally, all eight SA metabolism-related DEGs were up-regulated with the log2 (FC) values in the range of 1.09 to 1.81 (Figure 8 and Supplementary Table S7). Six of these DEGs putatively encode OvUGT74F1 that produces the SA conjugate in the form of SA 2-O-β-D-glucose [99]. Taken together, these results suggest that the identified putative OvUGTs, including OvUGT71B1, OvUGT85A2, OvUGT73C1, OvUGT85A1, and OvUGT74F1 (Supplementary Table S7), might act to adjust the levels of different hormones in O. viciifolia, thereby contributing to its proper growth and resistance to the adverse natural conditions of the high altitude of QTP. Such adjustment in the expression levels of genes related to the hormone dynamic detected in the O. viciifolia plants grown at the high altitude versus low altitude was probably due to continuous climate fluctuation at the higher altitude.

5. Conclusions

To survive, plants have evolved different machineries to respond and adapt to the ever-changing environments. An in-depth understanding of the molecular mechanisms involved in plant responses to diverse environmental stresses will enable us to improve plant stress resistance via genetic engineering, and subsequently promote the quality and productivity of crops. In our study, a total of 8212 DEGs, including 5387 up- and 2825 down-regulated genes, were identified from leaves of O. viciifolia grown at a higher altitude (TD) in comparison to a lower altitude (MH) in the QTP for the first time using the RNA-seq technology. These DEGs were revealed to be involved in various stress response-related processes, including hormone metabolism, circadian rhythm, secondary metabolite metabolism, and signaling transduction pathways. Particularly, numerous identified genes were found to be participated in the flavonoid and phenylpropanoid biosynthesis, suggesting the involvement of these compounds in O. viciifolia responses to the more extreme natural conditions at higher altitude of the QTP. Furthermore, many genes related to hormone metabolism and signaling, as well as regulatory networks modulated by different types of TFs were found to participate in O. viciifolia responses to adverse natural conditions at higher altitudes. In conclusion, the transcriptome datasets obtained from the leaves of O. viciifolia plants field-grown at two different altitudes of the QTP allowed us to identify a series of candidate genes associated with their differential responses to environmental stresses under natural conditions, which could provide the basis for understanding and further elucidating the molecular regulatory mechanisms involved in O. viciifolia acclimatization to the QTP extreme environment.

Supplementary Materials

The following are available online at https://www.mdpi.com/2218-273X/10/6/967/s1, Figure S1: Length distribution of assembled unigenes, Figure S2: Venn diagram of functional annotations of unigenes using various public databases, Figure S3: Relative expression levels of selected genes used for validating the accuracy of RNA-seq data obtained from leaves of Onobrychis viciifolia under high (Tongde, TD) and low altitudes (Minhe, MH). Figure S4: Key differentially expressed genes involved in the phenylpropanoid pathway, Figure S5: Comparison of height and tiller number of Onobrychis viciifolia plants grown under high (Tongde, TD) and low altitudes (Minhe, MH), Table S1: Information on the 5387 up- and 2825 down-regulated unigenes in leaves of Onobrychis viciifolia plants grown at high-altitude Tongde (TD) vs. those grown at low-altitude Minhe (MH), Table S2: Top 50 DEGs obtained from the comparison of Onobrychis viciifolia plants grown at high-altitude Tongde (TD) and low-altitude Minhe (MH), Table S3: GO enrichment analysis of differentially expressed genes, Table S4: Enriched KEGG pathways of differentially expressed genes, Table S5: Metabolic pathway enrichment analysis of differentially expressed genes identified in leaves of Onobrychis viciifolia grown at high-altitude Tongde (TD) vs. those grown at low-altitude Minhe (MH), Table S6: Mapman annotation of key differentially expressed genes involved in flavonoid and phenylpropanoid biosynthetic pathways, Table S7: Differentially expressed genes involved in hormone pathways as annotated by MapMan analysis, Table S8: Differentially expressed genes encoding transcriptional factors identified from transcriptome analysis of Onobrychis viciifolia leaf samples, Table S9: Contents of total flavonoids, anthocyanins, and other flavonoid compounds found in leaves of Onobrychis viciifolia plants grown at high-altitude Tongde (TD) and low-altitude Minhe (MH), Table S10: Unigenes and their specific primers used in RT-qPCR analysis.

Author Contributions

Conceptualization, H.Y. and B.Z.; methodology, H.Y.; software, H.Y., B.Z., and W.W.; validation, H.Y. and H.Z.; formal analysis, H.Y. and B.Z.; investigation, H.Y. and B.Z.; resources, H.Y. and H.Z.; data curation, H.Y. and B.Z.; writing—original draft preparation, H.Y. and B.Z.; writing—review and editing, B.Z. and L.-S.P.T.; visualization, B.Z. and L.-S.P.T.; supervision, B.Z.; project administration, H.Y., H.Z., W.W., and B.Z.; funding acquisition, H.Y., H.Z., W.W., and B.Z. All authors have read and agreed to the published version of the manuscript.

Funding

This research was funded by the National Natural Science Foundation of China (Nos 31860060 and 41761107), Natural Science Foundation of Qinghai Province (Nos 2017-ZJ-940Q, 2017-ZJ-943Q and 2019-ZJ-908), the Open Project of State Key Laboratory of Plateau Ecology and Agriculture of Qinghai University (No. 2017-ZZ-09), the Open Project of Key Laboratory of Restoration Ecology for Cold Regions in Qinghai (No. 2019-KF-09), the Qinghai Innovation Platform Construction Project (No. 2017-ZJ-Y20), and the Second Tibetan Plateau Scientific Expedition and Research (STEP) program (Nos 2019QZKK0302 and 2019QZKK0502).

Acknowledgments

We appreciate Li Yaping (Gene Denovo Biotechnology Co., Ltd.) for providing support in data analysis, and Bingrong Zhou (Qinghai Institute of Meteorology Science) for providing us climate-related data.

Conflicts of Interest

The authors declare no conflicts of interest.

References

  1. Abdelrahman, M.; Burritt, D.J.; Gupta, A.; Tsujimoto, H.; Tran, L.P. Heat stress effects on source-sink relationships and metabolome dynamics in wheat. J. Exp. Bot. 2020, 71, 543–554. [Google Scholar] [CrossRef] [PubMed]
  2. Atkinson, N.J.; Urwin, P.E. The interaction of plant biotic and abiotic stresses: From genes to the field. J. Exp. Bot. 2012, 63, 3523–3543. [Google Scholar] [CrossRef] [PubMed] [Green Version]
  3. Cramer, G.R.; Urano, K.; Delrot, S.; Pezzotti, M.; Shinozaki, K. Effects of abiotic stress on plants: A systems biology perspective. BMC Plant Biol. 2011, 11, 163. [Google Scholar] [CrossRef] [PubMed] [Green Version]
  4. Gupta, A.; Sinha, R.; Fernandes, J.L.; Abdelrahman, M.; Burritt, D.J.; Tran, L.P. Phytohormones regulate convergent and divergent responses between individual and combined drought and pathogen infection. Crit. Rev. Biotechnol. 2020, 40, 320–340. [Google Scholar] [CrossRef]
  5. Mohanta, T.K.; Bashir, T.; Hashem, A.; Abd Allah, E.F. Systems biology approach in plant abiotic stresses. Plant Physiol. Biochem. 2017, 121, 58–73. [Google Scholar] [CrossRef]
  6. Bray, E.A. Response to abiotic stress. Biochem. Mol. Biol. Plants 2000, 1158–1203. [Google Scholar]
  7. Atkinson, N.J.; Lilley, C.J.; Urwin, P.E. Identification of genes involved in the response of Arabidopsis to simultaneous biotic and abiotic stresses. Plant Physiol. 2013, 162, 2028–2041. [Google Scholar] [CrossRef] [Green Version]
  8. Iyer, N.J.; Tang, Y.; Mahalingam, R. Physiological, biochemical and molecular responses to a combination of drought and ozone in Medicago truncatula. Plant Cell. Environ. 2013, 36, 706–720. [Google Scholar] [CrossRef]
  9. Koussevitzky, S.; Suzuki, N.; Huntington, S.; Armijo, L.; Sha, W.; Cortes, D.; Shulaev, V.; Mittler, R. Ascorbate peroxidase 1 plays a key role in the response of Arabidopsis thaliana to stress combination. J. Biol. Chem. 2008, 283, 34197–34203. [Google Scholar] [CrossRef] [Green Version]
  10. Rasmussen, S.; Barah, P.; Suarez-Rodriguez, M.C.; Bressendorff, S.; Friis, P.; Costantino, P.; Bones, A.M.; Nielsen, H.B.; Mundy, J. Transcriptome responses to combinations of stresses in Arabidopsis. Plant Physiol. 2013, 161, 1783–1794. [Google Scholar] [CrossRef] [Green Version]
  11. Rizhsky, L.; Liang, H.; Shuman, J.; Shulaev, V.; Davletova, S.; Mittler, R. When defense pathways collide. The response of Arabidopsis to a combination of drought and heat stress. Plant Physiol. 2004, 134, 1683–1696. [Google Scholar] [CrossRef] [PubMed] [Green Version]
  12. Suzuki, N.; Rivero, R.M.; Shulaev, V.; Blumwald, E.; Mittler, R. Abiotic and biotic stress combinations. New Phytologist 2014, 203, 32–43. [Google Scholar] [CrossRef] [PubMed]
  13. Hewezi, T.; Leger, M.; Gentzbittel, L. A comprehensive analysis of the combined effects of high light and high temperature stresses on gene expression in sunflower. Ann. Bot. 2008, 102, 127–140. [Google Scholar] [CrossRef] [PubMed] [Green Version]
  14. Imadi, S.R.; Kazi, A.G.; Ahanger, M.A.; Gucel, S.; Ahmad, P. Plant transcriptomics and responses to environmental stress: An overview. J. Genet. 2015, 94, 525–537. [Google Scholar] [CrossRef]
  15. Nejat, N.; Ramalingam, A.; Mantri, N. Advances in Transcriptomics of Plants. Adv. Biochem. Eng. Biotechnol. 2018, 164, 161–185. [Google Scholar]
  16. Banerjee, A.; Roychoudhury, A. Abscisic-acid-dependent basic leucine zipper (bZIP) transcription factors in plant abiotic stress. Protoplasma 2017, 254, 3–16. [Google Scholar] [CrossRef]
  17. Jiang, J.; Ma, S.; Ye, N.; Jiang, M.; Cao, J.; Zhang, J. WRKY transcription factors in plant responses to stresses. J. Integr. Plant Biol. 2017, 59, 86–101. [Google Scholar] [CrossRef]
  18. Mizoi, J.; Shinozaki, K.; Yamaguchi-Shinozaki, K. AP2/ERF family transcription factors in plant abiotic stress responses. Biochim. Biophys. Acta 2012, 1819, 86–96. [Google Scholar] [CrossRef]
  19. Muller, M.; Munne-Bosch, S. Ethylene Response Factors: A Key Regulatory Hub in Hormone and Stress Signaling. Plant Physiol. 2015, 169, 32–41. [Google Scholar] [CrossRef] [Green Version]
  20. Zhu, J.K. Abiotic Stress Signaling and Responses in Plants. Cell 2016, 167, 313–324. [Google Scholar] [CrossRef] [Green Version]
  21. Verma, V.; Ravindran, P.; Kumar, P.P. Plant hormone-mediated regulation of stress responses. BMC Plant Biol. 2016, 16, 86. [Google Scholar] [CrossRef] [PubMed] [Green Version]
  22. Kollist, H.; Zandalinas, S.I.; Sengupta, S.; Nuhkat, M.; Kangasjarvi, J.; Mittler, R. Rapid Responses to Abiotic Stress: Priming the Landscape for the Signal Transduction Network. Trends Plant Sci. 2019, 24, 25–37. [Google Scholar] [CrossRef] [PubMed] [Green Version]
  23. Du, H.; Huang, F.; Wu, N.; Li, X.; Hu, H.; Xiong, L. Integrative Regulation of Drought Escape through ABA-Dependent and -Independent Pathways in Rice. Mol. Plant 2018, 11, 584–597. [Google Scholar] [CrossRef] [PubMed] [Green Version]
  24. Shinozaki, K.; Yamaguchi-Shinozaki, K. Gene networks involved in drought stress response and tolerance. J. Exp. Bot. 2007, 58, 221–227. [Google Scholar] [CrossRef] [PubMed] [Green Version]
  25. Tran, L.S.; Nakashima, K.; Shinozaki, K.; Yamaguchi-Shinozaki, K. Plant gene networks in osmotic stress response: From genes to regulatory networks. Methods Enzymol. 2007, 428, 109–128. [Google Scholar] [PubMed]
  26. Malisch, C.S.; Lüscher, A.; Baert, N.; Engström, M.T.; Studer, B.; Fryganas, C.; Suter, D.; Mueller-Harvey, I.; Salminen, J.P. Large Variability of Proanthocyanidin Content and Composition in Sainfoin (Onobrychis viciifolia). J. Agric. Food Chem. 2015, 63, 10234–10242. [Google Scholar] [CrossRef] [Green Version]
  27. Barrau, E.; Fabre, N.; Fouraste, I.; Hoste, H. Effect of bioactive compounds from Sainfoin (Onobrychis viciifolia Scop.) on the in vitro larval migration of Haemonchus contortus: Role of tannins and flavonol glycosides. Parasitology 2005, 131, 531–538. [Google Scholar] [CrossRef] [Green Version]
  28. Mueller-Harvey, I. Unravelling the conundrum of tannins in animal nutrition and health. J. Sci. Food Agric. 2006, 86, 2010–2037. [Google Scholar] [CrossRef]
  29. Lu, Y.; Sun, Y.; Foo, L.Y.; McNabb, W.C.; Molan, A.L. Phenolic glycosides of forage legume Onobrychis viciifolia. Phytochemistry 2000, 55, 67–75. [Google Scholar] [CrossRef]
  30. Regos, I.; Urbanella, A.; Treutter, D. Identification and Quantification of Phenolic Compounds from the Forage Legume Sainfoin (Onobrychis viciifolia). J. Agric. Food Chem. 2009, 57, 5843–5852. [Google Scholar] [CrossRef]
  31. Stringano, E.; Cramer, R.; Hayes, W.; Smith, C.; Gibson, T.; Mueller-Harvey, I. Deciphering the complexity of sainfoin (Onobrychis viciifolia) proanthocyanidins by MALDI-TOF mass spectrometry with a judicious choice of isotope patterns and matrixes. Anal. Chem. 2011, 83, 4147–4153. [Google Scholar] [CrossRef]
  32. Veitch, N.C.; Regos, I.; Kite, G.C.; Treutter, D. Acylated flavonol glycosides from the forage legume, Onobrychis viciifolia (sainfoin). Phytochemistry 2011, 72, 423–429. [Google Scholar] [CrossRef]
  33. Malisch, C.S.; Salminen, J.P.; Kölliker, R.; Engström, M.T.; Suter, D.; Studer, B.; Lüscher, A. Drought Effects on Proanthocyanidins in Sainfoin (Onobrychis viciifolia Scop.) Are Dependent on the Plant’s Ontogenetic Stage. J. Agric. Food Chem. 2016, 64, 9307–9316. [Google Scholar] [CrossRef]
  34. Scharenberg, A.; Arrigo, Y.; Gutzwiller, A.; Soliva, C.R.; Wyss, U.; Kreuzer, M.; Dohme, F. Palatability in sheep and in vitro nutritional value of dried and ensiled sainfoin (Onobrychis viciifolia) birdsfoot trefoil (Lotus corniculatus), and chicory (Cichorium intybus). Arch. Anim. Nutr. 2007, 61, 481–496. [Google Scholar] [CrossRef]
  35. Liu, X.M.; Zhang, R.; Dou, W.; Gao, Z.Q.; Bu-man, A.; Meng, X.J. Study on adaptability of Onobrychis viciaefolia cv. Gansu and Medicago sativa cv. Algonguin in alpine pastoral area. Grassland Turf 2010, 30, 51–54. [Google Scholar]
  36. Cao, M.; Jin, Y.; Liu, N.; Ji, W. Effects of the Qinghai-Tibetan Plateau uplift and environmental changes on phylogeographic structure of the Daurian Partridge (Perdix dauuricae) in China. Mol. Phylogenet. Evol. 2012, 65, 823–830. [Google Scholar] [CrossRef]
  37. Ge, R.L.; Cai, Q.; Shen, Y.Y.; San, A.; Ma, L.; Zhang, Y.; Yi, X.; Chen, Y.; Yang, L.; Huang, Y.; et al. Draft genome sequence of the Tibetan antelope. Nat. Commun. 2013, 4, 1858. [Google Scholar] [CrossRef] [Green Version]
  38. Wang, P.; Lassoie, J.P.; Morreale, S.J.; Dong, S. A critical review of socioeconomic and natural factors in ecological degradation on the Qinghai-Tibetan Plateau, China. Rangel. J. 2015, 37, 1–9. [Google Scholar] [CrossRef]
  39. Grabherr, M.G.; Haas, B.J.; Yassour, M.; Levin, J.Z.; Thompson, D.A.; Amit, I.; Adiconis, X.; Fan, L.; Raychowdhury, R.; Zeng, Q.; et al. Full-length transcriptome assembly from RNA-Seq data without a reference genome. Nat. Biotechnol. 2011, 29, 644–652. [Google Scholar] [CrossRef] [Green Version]
  40. Mortazavi, A.; Williams, B.A.; McCue, K.; Schaeffer, L.; Wold, B. Mapping and quantifying mammalian transcriptomes by RNA-Seq. Nat. Methods 2008, 5, 621–628. [Google Scholar] [CrossRef]
  41. Jin, J.; Tian, F.; Yang, D.C.; Meng, Y.Q.; Kong, L.; Luo, J.; Gao, G. PlantTFDB 4.0: Toward a central hub for transcription factors and regulatory interactions in plants. Nucleic Acids Res. 2017, 45, D1040–D1045. [Google Scholar] [CrossRef] [PubMed] [Green Version]
  42. Lohse, M.; Nagel, A.; Herter, T.; May, P.; Schroda, M.; Zrenner, R.; Tohge, T.; Fernie, A.R.; Stitt, M.; Usadel, B. Mercator: A fast and simple web server for genome scale functional annotation of plant sequence data. Plant Cell Environ. 2014, 37, 1250–1258. [Google Scholar] [CrossRef] [PubMed] [Green Version]
  43. Livak, K.J.; Schmittgen, T.D. Analysis of relative gene expression data using real-time quantitative PCR and the 2(-Delta Delta C(T)) Method. Methods 2001, 25, 402–408. [Google Scholar] [CrossRef] [PubMed]
  44. Abu Bakar, M.F.; Mohamed, M.; Rahmat, A.; Fry, J. Phytochemicals and antioxidant activity of different parts of bambangan (Mangifera pajang) and tarap (Artocarpus odoratissimus). Food Chem. 2009, 113, 479–483. [Google Scholar] [CrossRef]
  45. Zhishen, J.; Mengcheng, T.; Jianming, W. The determination of flavonoid contents in mulberry and their scavenging effects on superoxide radicals. Food Chem. 1999, 64, 555–559. [Google Scholar] [CrossRef]
  46. Montiel, J.; Szűcs, A.; Boboescu, I.Z.; Gherman, V.D.; Kondorosi, É.; Kereszt, A. Terminal Bacteroid Differentiation Is Associated With Variable Morphological Changes in Legume Species Belonging to the Inverted Repeat-Lacking Clade. Mol. Plant Microbe Interact. 2016, 29, 210–219. [Google Scholar] [CrossRef] [Green Version]
  47. Wang, J.; Sun, P.; Li, Y.; Liu, Y.; Yu, J.; Ma, X.; Sun, S.; Yang, N.; Xia, R.; Lei, T.; et al. Hierarchically Aligning 10 Legume Genomes Establishes a Family-Level Genomics Platform. Plant Physiol. 2017, 174, 284–300. [Google Scholar] [CrossRef] [Green Version]
  48. Wang, F.; Xu, Z.; Fan, X.; Zhou, Q.; Cao, J.; Ji, G.; Jing, S.; Feng, B.; Wang, T. Transcriptome Analysis Reveals Complex Molecular Mechanisms Underlying UV Tolerance of Wheat (Triticum aestivum, L.). J. Agric. Food Chem. 2019, 67, 563–577. [Google Scholar] [CrossRef]
  49. Hut, R.A.; Beersma, D.G. Evolution of time-keeping mechanisms: Early emergence and adaptation to photoperiod. Philos. Trans. R Soc. Lond. B Biol. Sci. 2011, 366, 2141–2154. [Google Scholar] [CrossRef] [Green Version]
  50. D’Amico-Damiao, V.; Carvalho, R.F. Cryptochrome-Related Abiotic Stress Responses in Plants. Front. Plant Sci. 2018, 9, 1897. [Google Scholar] [CrossRef]
  51. Jiang, B.; Shi, Y.; Zhang, X.; Xin, X.; Qi, L.; Guo, H.; Li, J.; Yang, S. PIF3 is a negative regulator of the CBF pathway and freezing tolerance in Arabidopsis. Proc. Natl. Acad. Sci. USA 2017, 114, E6695–E6702. [Google Scholar] [CrossRef] [PubMed] [Green Version]
  52. Nakamichi, N.; Takao, S.; Kudo, T.; Kiba, T.; Wang, Y.; Kinoshita, T.; Sakakibara, H. Improvement of Arabidopsis Biomass and Cold, Drought and Salinity Stress Tolerance by Modified Circadian Clock-Associated PSEUDO-RESPONSE REGULATORs. Plant Cell. Physiol. 2016, 57, 1085–1097. [Google Scholar] [CrossRef] [PubMed] [Green Version]
  53. Nakabayashi, R.; Saito, K. Integrated metabolomics for abiotic stress responses in plants. Curr. Opin. Plant Biol. 2015, 24, 10–16. [Google Scholar] [CrossRef] [PubMed] [Green Version]
  54. Sharma, A.; Shahzad, B.; Rehman, A.; Bhardwaj, R.; Landi, M.; Zheng, B. Response of Phenylpropanoid Pathway and the Role of Polyphenols in Plants under Abiotic Stress. Molecules 2019, 24, 2452. [Google Scholar] [CrossRef] [Green Version]
  55. Li, Q.; Yu, H.M.; Meng, X.F.; Lin, J.S.; Li, Y.J.; Hou, B.K. Ectopic expression of glycosyltransferase UGT76E11 increases flavonoid accumulation and enhances abiotic stress tolerance in Arabidopsis. Plant Biol. (Stuttg.) 2018, 20, 10–19. [Google Scholar] [CrossRef]
  56. Li, W.; Herrera-Estrella, L.; Tran, L.P. Do Cytokinins and Strigolactones Crosstalk during Drought Adaptation? Trends Plant Sci. 2019, 24, 669–672. [Google Scholar] [CrossRef]
  57. Mostofa, M.G.; Li, W.; Nguyen, K.H.; Fujita, M.; Tran, L.P. Strigolactones in plant adaptation to abiotic stresses: An emerging avenue of plant research. Plant Cell. Environ. 2018, 41, 2227–2243. [Google Scholar] [CrossRef]
  58. Sarkar, T.; Thankappan, R.; Mishra, G.P.; Nawade, B.D. Advances in the development and use of DREB for improved abiotic stress tolerance in transgenic crop plants. Physiol. Mol. Biol. Plants 2019, 25, 1323–1334. [Google Scholar] [CrossRef]
  59. El-Esawi, M.A.; Alayafi, A.A. Overexpression of StDREB2 Transcription Factor Enhances Drought Stress Tolerance in Cotton (Gossypium barbadense L.). Genes (Basel) 2019, 10, 142. [Google Scholar] [CrossRef] [Green Version]
  60. Li, X.; Liang, Y.; Gao, B.; Mijiti, M.; Bozorov, T.A.; Yang, H.; Zhang, D.; Wood, A.J. ScDREB10, an A-5c type of DREB Gene of the Desert Moss Syntrichia caninervis, Confers Osmotic and Salt Tolerances to Arabidopsis. Genes (Basel) 2019, 10, 146. [Google Scholar] [CrossRef] [Green Version]
  61. Yang, Y.; Al-Baidhani, H.H.J.; Harris, J.; Riboni, M.; Li, Y.; Mazonka, I.; Bazanova, N.; Chirkova, L.; Sarfraz Hussain, S.; Hrmova, M.; et al. DREB/CBF expression in wheat and barley using the stress-inducible promoters of HD-Zip I genes: Impact on plant development, stress tolerance and yield. Plant Biotechnol. J. 2020, 18, 829–844. [Google Scholar] [CrossRef] [PubMed] [Green Version]
  62. Coego, A.; Brizuela, E.; Castillejo, P.; Ruíz, S.; Koncz, C.; del Pozo, J.C.; Piñeiro, M.; Jarillo, J.A.; Paz-Ares, J.; León, J. The TRANSPLANTA collection of Arabidopsis lines: A resource for functional analysis of transcription factors based on their conditional overexpression. Plant J. 2014, 77, 944–953. [Google Scholar] [CrossRef] [PubMed]
  63. Zhang, Z.; Li, W.; Gao, X.; Xu, M.; Guo, Y. DEAR4, a Member of DREB/CBF Family, Positively Regulates Leaf Senescence and Response to Multiple Stressors in Arabidopsis thaliana. Front. Plant Sci. 2020, 11, 367. [Google Scholar] [CrossRef] [PubMed]
  64. Mora-Ortiz, M.; Swain, M.T.; Vickers, M.J.; Hegarty, M.J.; Kelly, R.; Smith, L.M.; Skøt, L. De-novo transcriptome assembly for gene identification, analysis, annotation, and molecular marker discovery in Onobrychis viciifolia. BMC Genomics 2016, 17, 756. [Google Scholar] [CrossRef] [PubMed] [Green Version]
  65. Etterson, J.R. Evolutionary potential of Chamaecrista fasciculata in relation to climate change. I. Clinal patterns of selection along an environmental gradient in the great plains. Evolution 2004, 58, 1446–1458. [Google Scholar] [CrossRef] [PubMed]
  66. Fustier, M.A.; Martínez-Ainsworth, N.E.; Aguirre-Liguori, J.A.; Venon, A.; Corti, H.; Rousselet, A.; Dumas, F.; Dittberner, H.; Camarena, M.G.; Grimanelli, D.; et al. Common gardens in teosintes reveal the establishment of a syndrome of adaptation to altitude. PLoS Genet. 2019, 15, e1008512. [Google Scholar] [CrossRef] [Green Version]
  67. Leger, E.A.; Rice, K.J. Assessing the speed and predictability of local adaptation in invasive California poppies (Eschscholzia californica). J. Evol. Biol. 2007, 20, 1090–1103. [Google Scholar] [CrossRef]
  68. Wang, Y.; Wang, J.; Lai, L.; Jiang, L.; Zhuang, P.; Zhang, L.; Zheng, Y.; Baskin, J.M.; Baskin, C.C. Geographic variation in seed traits within and among forty-two species of Rhododendron (Ericaceae) on the Tibetan plateau: Relationships with altitude, habitat, plant height, and phylogeny. Ecol. Evol. 2014, 4, 1913–1923. [Google Scholar] [CrossRef]
  69. Kollas, C.; Körner, C.; Randin, C.F. Spring frost and growing season length co-control the cold range limits of broad-leaved trees. J. Biogeogr. 2014, 41, 773–783. [Google Scholar] [CrossRef]
  70. Suter, L.; Rüegg, M.; Zemp, N.; Hennig, L.; Widmer, A. Gene regulatory variation mediates flowering responses to vernalization along an altitudinal gradient in Arabidopsis. Plant Physiol. 2014, 166, 1928–1942. [Google Scholar] [CrossRef] [Green Version]
  71. Ito, S.; Niwa, Y.; Nakamichi, N.; Kawamura, H.; Yamashino, T.; Mizuno, T. Insight into Missing Genetic Links Between Two Evening-Expressed Pseudo-Response Regulator Genes TOC1 and PRR5 in the Circadian Clock-Controlled Circuitry in Arabidopsis thaliana. Plant Cell. Physiol. 2008, 49, 201–213. [Google Scholar] [CrossRef] [PubMed] [Green Version]
  72. Lee, B.D.; Kim, M.R.; Kang, M.Y.; Cha, J.Y.; Han, S.H.; Nawkar, G.M.; Sakuraba, Y.; Lee, S.Y.; Imaizumi, T.; McClung, C.R.; et al. The F-box protein FKF1 inhibits dimerization of COP1 in the control of photoperiodic flowering. Nat. Commun. 2017, 8, 2259. [Google Scholar] [CrossRef] [PubMed] [Green Version]
  73. Nakamichi, N.; Kita, M.; Niinuma, K.; Ito, S.; Yamashino, T.; Mizoguchi, T.; Mizuno, T. Arabidopsis Clock-Associated Pseudo-Response Regulators PRR9, PRR7 and PRR5 Coordinately and Positively Regulate Flowering Time Through the Canonical CONSTANS-Dependent Photoperiodic Pathway. Plant Cell. Physiol. 2007, 48, 822–832. [Google Scholar] [CrossRef] [Green Version]
  74. Nakamichi, N.; Kudo, T.; Makita, N.; Kiba, T.; Kinoshita, T.; Sakakibara, H. Flowering time control in rice by introducing Arabidopsis clock-associated PSEUDO-RESPONSE REGULATOR 5. Biosci. Biotechnol. Biochem. 2020, 84, 970–979. [Google Scholar] [CrossRef] [PubMed]
  75. Oda, A.; Fujiwara, S.; Kamada, H.; Coupland, G.; Mizoguchi, T. Antisense suppression of the Arabidopsis PIF3 gene does not affect circadian rhythms but causes early flowering and increases FT expression. FEBS Lett. 2004, 557, 259–264. [Google Scholar] [CrossRef] [Green Version]
  76. Isah, T. Stress and defense responses in plant secondary metabolites production. Biol. Res. 2019, 52, 39. [Google Scholar] [CrossRef] [Green Version]
  77. Yang, L.; Wen, K.S.; Ruan, X.; Zhao, Y.X.; Wei, F.; Wang, Q. Response of Plant Secondary Metabolites to Environmental Factors. Molecules 2018, 23, 762. [Google Scholar] [CrossRef] [Green Version]
  78. Hossain, M.A.; Bhattacharjee, S.; Armin, S.M.; Qian, P.; Xin, W.; Li, H.Y.; Burritt, D.J.; Fujita, M.; Tran, L.S. Hydrogen peroxide priming modulates abiotic oxidative stress tolerance: Insights from ROS detoxification and scavenging. Front. Plant Sci. 2015, 6, 420. [Google Scholar] [CrossRef] [Green Version]
  79. Mostofa, M.G.; Rahman, M.M.; Siddiqui, M.N.; Fujita, M.; Tran, L.P. Salicylic acid antagonizes selenium phytotoxicity in rice: Selenium homeostasis, oxidative stress metabolism and methylglyoxal detoxification. J. Hazard. Mater. 2020, 394, 122572. [Google Scholar] [CrossRef]
  80. Li, W.; Nguyen, K.H.; Chu, H.D.; Watanabe, Y.; Osakabe, Y.; Sato, M.; Toyooka, K.; Seo, M.; Tian, L.; Tian, C.; et al. Comparative functional analyses of DWARF14 and KARRIKIN INSENSITIVE 2 in drought adaptation of Arabidopsis thaliana. Plant J. 2020. [Google Scholar] [CrossRef]
  81. Li, W.; Nguyen, K.H.; Tran, C.D.; Watanabe, Y.; Tian, C.; Yin, X.; Li, K.; Yang, Y.; Guo, J.; Miao, Y.; et al. Negative Roles of Strigolactone-Related SMXL6, 7 and 8 Proteins in Drought Resistance in Arabidopsis. Biomolecules 2020, 10, 607. [Google Scholar] [CrossRef] [Green Version]
  82. Zhang, L.; Li, X.; Ma, B.; Gao, Q.; Du, H.; Han, Y.; Li, Y.; Cao, Y.; Qi, M.; Zhu, Y.; et al. The Tartary Buckwheat Genome Provides Insights into Rutin Biosynthesis and Abiotic Stress Tolerance. Mol. Plant 2017, 10, 1224–1237. [Google Scholar] [CrossRef] [Green Version]
  83. Besseau, S.; Hoffmann, L.; Geoffroy, P.; Lapierre, C.; Pollet, B.; Legrand, M. Flavonoid accumulation in Arabidopsis repressed in lignin synthesis affects auxin transport and plant growth. Plant Cell 2007, 19, 148–162. [Google Scholar] [CrossRef] [Green Version]
  84. Milborrow, B.V. The pathway of biosynthesis of abscisic acid in vascular plants: A review of the present state of knowledge of ABA biosynthesis. J. Exp. Bot. 2001, 52, 1145–1164. [Google Scholar] [CrossRef]
  85. Osakabe, Y.; Osakabe, K.; Shinozaki, K.; Tran, L.S. Response of plants to water stress. Front. Plant Sci. 2014, 5, 86. [Google Scholar] [CrossRef] [Green Version]
  86. Osakabe, Y.; Yamaguchi-Shinozaki, K.; Shinozaki, K.; Tran, L.S. ABA control of plant macroelement membrane transport systems in response to water deficit and high salinity. New Phytol. 2014, 202, 35–49. [Google Scholar] [CrossRef]
  87. Tan, B.C.; Schwartz, S.H.; Zeevaart, J.A.; McCarty, D.R. Genetic control of abscisic acid biosynthesis in maize. Proc. Natl. Acad. Sci. USA 1997, 94, 12235–12240. [Google Scholar] [CrossRef] [Green Version]
  88. Kalladan, R.; Lasky, J.R.; Sharma, S.; Kumar, M.N.; Juenger, T.E.; Des Marais, D.L.; Verslues, P.E. Natural Variation in 9-Cis-Epoxycartenoid Dioxygenase 3 and ABA Accumulation. Plant Physiol. 2019, 179, 1620–1631. [Google Scholar] [CrossRef] [Green Version]
  89. Sato, H.; Takasaki, H.; Takahashi, F.; Suzuki, T.; Iuchi, S.; Mitsuda, N.; Ohme-Takagi, M.; Ikeda, M.; Seo, M.; Yamaguchi-Shinozaki, K.; et al. Arabidopsis thaliana NGATHA1 transcription factor induces ABA biosynthesis by activating NCED3 gene during dehydration stress. Proc. Natl. Acad. Sci. USA 2018, 115, E11178–E11187. [Google Scholar] [CrossRef] [Green Version]
  90. Huang, Y.; Guo, Y.; Liu, Y.; Zhang, F.; Wang, Z.; Wang, H.; Wang, F.; Li, D.; Mao, D.; Luan, S.; et al. 9-cis-Epoxycarotenoid Dioxygenase 3 Regulates Plant Growth and Enhances Multi-Abiotic Stress Tolerance in Rice. Front. Plant Sci. 2018, 9, 162. [Google Scholar] [CrossRef]
  91. Ori, N. Dissecting the Biological Functions of ARF and Aux/IAA Genes. Plant Cell 2019, 31, 1210–1211. [Google Scholar] [CrossRef] [Green Version]
  92. Stortenbeker, N.; Bemer, M. The SAUR gene family: The plant’s toolbox for adaptation of growth and development. J. Exp. Bot. 2018, 70, 17–27. [Google Scholar] [CrossRef] [Green Version]
  93. Chen, T.T.; Liu, F.F.; Xiao, D.W.; Jiang, X.Y.; Li, P.; Zhao, S.M.; Hou, B.K.; Li, Y.J. The Arabidopsis UDP-glycosyltransferase75B1, conjugates abscisic acid and affects plant response to abiotic stresses. Plant Mol. Biol. 2020, 102, 389–401. [Google Scholar] [CrossRef]
  94. Dong, T.; Hwang, I. Contribution of ABA UDP-glucosyltransferases in coordination of ABA biosynthesis and catabolism for ABA homeostasis. Plant Signal. Behav. 2014, 9, e28888. [Google Scholar] [CrossRef] [Green Version]
  95. Liu, Z.; Yan, J.P.; Li, D.K.; Luo, Q.; Yan, Q.; Liu, Z.B.; Ye, L.M.; Wang, J.M.; Li, X.F.; Yang, Y. UDP-glucosyltransferase71c5, a major glucosyltransferase, mediates abscisic acid homeostasis in Arabidopsis. Plant Physiol. 2015, 167, 1659–1670. [Google Scholar] [CrossRef] [Green Version]
  96. Priest, D.M.; Ambrose, S.J.; Vaistij, F.E.; Elias, L.; Higgins, G.S.; Ross, A.R.; Abrams, S.R.; Bowles, D.J. Use of the glucosyltransferase UGT71B6 to disturb abscisic acid homeostasis in Arabidopsis thaliana. Plant J. 2006, 46, 492–502. [Google Scholar] [CrossRef]
  97. Sun, Y.; Ji, K.; Liang, B.; Du, Y.; Jiang, L.; Wang, J.; Kai, W.; Zhang, Y.; Zhai, X.; Chen, P.; et al. Suppressing ABA uridine diphosphate glucosyltransferase (SlUGT75C1) alters fruit ripening and the stress response in tomato. Plant J. 2017, 91, 574–589. [Google Scholar] [CrossRef] [Green Version]
  98. Tanaka, K.; Hayashi, K.; Natsume, M.; Kamiya, Y.; Sakakibara, H.; Kawaide, H.; Kasahara, H. UGT74D1 catalyzes the glucosylation of 2-oxindole-3-acetic acid in the auxin metabolic pathway in Arabidopsis. Plant Cell Physiol. 2014, 55, 218–228. [Google Scholar] [CrossRef] [Green Version]
  99. Dean, J.V.; Delaney, S.P. Metabolism of salicylic acid in wild-type, ugt74f1 and ugt74f2 glucosyltransferase mutants of Arabidopsis thaliana. Physiol. Plant 2008, 132, 417–425. [Google Scholar] [CrossRef]
Figure 1. Phylogenetic relationships of Onobrychis viciifolia with its related legumes. Arabidopsis thaliana was included as an outgroup. Numbers at the branchpoints and above the branches represent the percentage of bootstrap values and distances between clusters, respectively.
Biomolecules 10 00967 g001
Figure 2. Validation of 10 differentially expressed genes (DEGs) obtained from the comparison of leaf transcriptomes of Onobrychis viciifolia plants grown at high-altitude Tongde (TD) and low-altitude Minhe (MH) using RT-qPCR. The Y-axis represents expression changes in log2 (fold change) of ten DEGs (TD/MH comparison) obtained by RNA-sequencing (RNA-seq) and RT-qPCR methods. The X-axis indicates randomly selected DEGs for RT-qPCR validation. Bars represent means ± SDs of three biological replicates.
Biomolecules 10 00967 g002
Figure 3. Functional classification of the differentially expressed genes (DEGs) obtained from the comparison of leaf transcriptomes of Onobrychis viciifolia plants grown at high-altitude Tongde (TD) and low-altitude Minhe (MH). Unigenes with BLAST hits were classified into three major categories, namely ‘Biological Process’, ‘Molecular Function’, and ‘Cellular Component’, according to a GO analysis. The Y-axis represents the number of DEGs (TD/MH comparison) in each subcategory. The X-axis indicates the most enriched 45 GO subcategories.
Biomolecules 10 00967 g003
Figure 4. KEGG enrichment analysis of differentially expressed genes (DEGs) in leaves of Onobrychis viciifolia plants collected from the high-altitude Tongde (TD) versus the low-altitude Minhe (MH). The Y-axis represents the KEGG terms. The X-axis represents the number of DEGs (TD/MH comparison). The number corresponding to each KEGG term indicates the number of enriched DEGs in each term. All KEGG pathways are classified into five categories, namely ‘Genetic Information Processing’, ‘Metabolism’, ‘Organismal Systems’, ‘Cellular Processes’, and ‘Environmental Information Processing’ as displayed by different colors.
Biomolecules 10 00967 g004
Figure 5. A putative ‘circadian rhythm–plant’ pathway was generated from the KEGG database based on the log2 (FC) values of identified differentially expressed genes (DEGs). The symbols in boxes indicate the enzyme codes. Red and green colors depict the up- and down-regulated genes, respectively. OvPHYA, phytochrome A; OvPHYB, phytochrome B; OvELF3, EARLY FLOWERING 3; OvPIF3, phytochrome-interacting factor 3; OvPRR5, pseudo-response regulator 5; OvPRR7, pseudo-response regulator 7; OvPRR9, pseudo-response regulator 9; OvCRY, cryptochrome; OvCOP1, constitutive photomorphogenic 1; OvSPA1, suppressor of PHYA-105 1; OvGI, GIGANTEA; OvHY5, transcriptional factor HY5; OvCHE, transcription factor TCP21; OvZTL, ZEITLUPE; OvLHY, late elongated hypocotyl; OvCCA1, circadian clock associated 1; OvFKF1, flavin-binding kelch repeat F-box protein; OvCDF1, cycling dof factor 1; OvCHS, chalcone synthase; OvTOC1, timing of cab expression 1; OvCO, zinc finger protein CONSTANS; OvFT, FLOWERING LOCUS T; OvCK2α, casein kinase II subunit alpha; OvCK2β, casein kinase II subunit beta.
Biomolecules 10 00967 g005
Figure 6. Global view of the identified differentially expressed genes (DEGs) involved in diverse metabolic pathways using a MapMan analysis. Gray shapes containing colored boxes represent different metabolic pathways with related DEGs. Heatmaps in gray boxes indicates expression changes of related genes in leaves of Onobrychis viciifolia plants collected from the high-altitude Tongde (TD) versus the low-altitude Minhe (MH). Red and green colors represent up-regulated and down-regulated DEGs (TD/MH comparison), respectively, based on their log2 (FC) values.
Biomolecules 10 00967 g006
Figure 7. Flavonoid and anthocyanin biosynthetic pathways and expression changes of related genes in leaves of Onobrychis viciifolia grown at high-altitude Tongde (TD) and low-altitude Minhe (MH). Capital letters above/next to the arrows represent enzymes encoded by respective biosynthetic genes involved in every reaction step. The corresponding compound name is shown below each chemical structure. The details of key biosynthetic enzymes are as follows: OvPAL, phenylalanine ammonium lyase; OvC4H, cinnamic acid 4-hydroxylase; Ov4CL, 4-coumarate-CoA ligase; OvCHS, chalcone synthase; OvCHI, chalcone isomerase; OvF3H, flavanone-3-hydroxylase; OvF3′H, flavonoid-3′-hydroxylase; OvF3′,5′H, flavonoid-3′,5′-hydroxylase; OvFLS, flavonol synthase; OvDFR, dihydroflavonol reductase; OvANS, anthocyanin synthase; OvANR, anthocyanin reductase; OvUGT, uridine diphosphate glucosyltransferase. Colored boxes and scale indicate expression changes of related genes (TD/MH comparison). Red and green colors represent up- and down-regulation, respectively, based on log2 (FC) in expression values of related genes (TD/MH comparison).
Biomolecules 10 00967 g007
Figure 8. MapMan overview of differentially expressed genes (DEGs) related to phytohormone metabolic and signaling processes, which were identified in Onobrychis viciifolia plants of high (Tongde, TD) versus low (Minhe, MH) altitudes. Colored boxes and scale indicate expression changes of related genes. Red and green colors represent up- and down-regulation, respectively, based on log2 (FC) values of TD-grown versus MH-grown plants. IAA, indole 3-acetic acid; ABA, abscisic acid; BR, brassinosteroid; CK, cytokinin; JA, jasmonic acid; SA, salicylic acid; GA, gibberellic acid.
Biomolecules 10 00967 g008
Figure 9. Changes in expression of genes encoding members of several representative transcription factor families in Onobrychis viciifolia grown at high-altitude Tongde (TD) and low-altitude Minhe (MH). The heatmaps are constructed according to log2 (FC) of differentially expressed genes (TD/MH comparison). Up- and down-regulation are indicated by red and blue, respectively. The colored scale represents expression changes based on the log2 (FC) values of TD/MH comparison.
Biomolecules 10 00967 g009
Figure 10. Contents and HPLC profiles of flavonoids and anthocyanins in leaves of Onobrychis viciifolia grown at high-altitude Tongde (TD) and low-altitude Minhe (MH). (A) Contents of total flavonoids and anthocyanins in TD-grown and MH-grown plant samples. (B) Contents of four flavonoids myricetin, quercetin, kaempferol, and rutin. (C) HPLC profiles of secondary metabolites (absorption at the wavelength of 275 nm). a, standards; b, TD-grown plants; c, MH-grown plants; 1–4 peaks represent myricetin, rutin, quercetin and kaempferol, respectively. Bars represent means ± SDs of three biological replicates. * and ** indicate statistically significant differences between TD-grown and MH-grown plants at p < 0.05 and p < 0.01, respectively, as determined by a Student’s t-test.
Biomolecules 10 00967 g010
Figure 11. Relative expression levels of key genes involved in the metabolism of flavonoids, anthocyanins, phenylpropanoid and ABA in leaves of Onobrychis viciifolia under high-altitude Tongde (TD) and low-altitude Minhe (MH). (A) Flavonoid metabolism-related genes. (B) Anthocyanin metabolism-related genes. (C) Phenylpropanoid metabolism-related genes. (D) ABA metabolism-related genes. The expression level of each gene in MH-grown plants was set as 1. Bars represent means ± SDs of three biological replicates. * and ** indicate statistically significant differences between TD-grown and MH-grown plants at p < 0.05 and p < 0.01, respectively, as determined by a Student’s t-test.
Biomolecules 10 00967 g011
Table 1. Summary of the de novo assembly of transcriptome sequence reads from the TD- and MH-grown plants. TD and MH indicated high-altitude and low-altitude samples collected from the Tongde and Minhe regions located in the Qinghai-Tibetan Plateau, respectively. Q20 and Q30 are referred to the base call accuracy rate of 99% and 99.9%, respectively. N50 is defined as the read length when such reads added to all the longer reads reach to 50% sum of reads of all lengths.
ContentTotalTD-1TD-2TD-3MH-1MH-2MH-3
Total raw reads57,014,25044,392,76481,922,05669,023,98653,001,30444,778,54248,966,846
Total clean reads55,645,07043,177,36279,839,43867,258,66251,867,53843,809,04447,918,378
GC percentage (%) 43.25%43.43%44.07%44.08%43.67%43.94%
Clean reads Q20 (%) 97.51%97.66%97.66%97.76%97.76%97.80%
Clean reads Q30 (%) 93.59%93.95%93.95%94.09%94.14%94.22%
Clean reads (%) 97.26%97.46%97.44%97.86%97.83%97.86%
Total mapped reads (%) 88.04%88.71%89.16%89.54%88.91%89.33%
Total expressed genes74,79164,33162,88759,21956,90360,21860,218
Total transcripts218,482
Total unigenes74,791
N50 (bp)1458
Mean length of unigenes (bp)820
Table 2. Number of unigenes annotated using the public databases.
Annotated DatabaseNumber of UnigenesPercentage (%)
Annotated in Nr43,71758.45
Annotated in SwissPort32,97344.09
Annotated in KOG24,84133.21
Annotated in KEGG16,30521.80
Annotated in all databases46,50862.18
All assembled unigenes74,791100
Table 3. Summary of annotations of assembled Onobrychis viciifolia consensus sequences.
SpeciesNumber of Matched UnigenesPercentage
Medicago truncatula11,59224.92%
Cicer arietinum975820.98%
Glycine max35537.64%
Cajanus cajan33587.22%
Glycine soja17333.73%
Vigna angularis11133.39%
Vigna radiata11092.38%

