Molecularly Imprinted Polymers and Magnetic Molecularly Imprinted Polymers for Selective Determination of Estrogens in Water by ESI-MS/FAPA-MS


Abstract
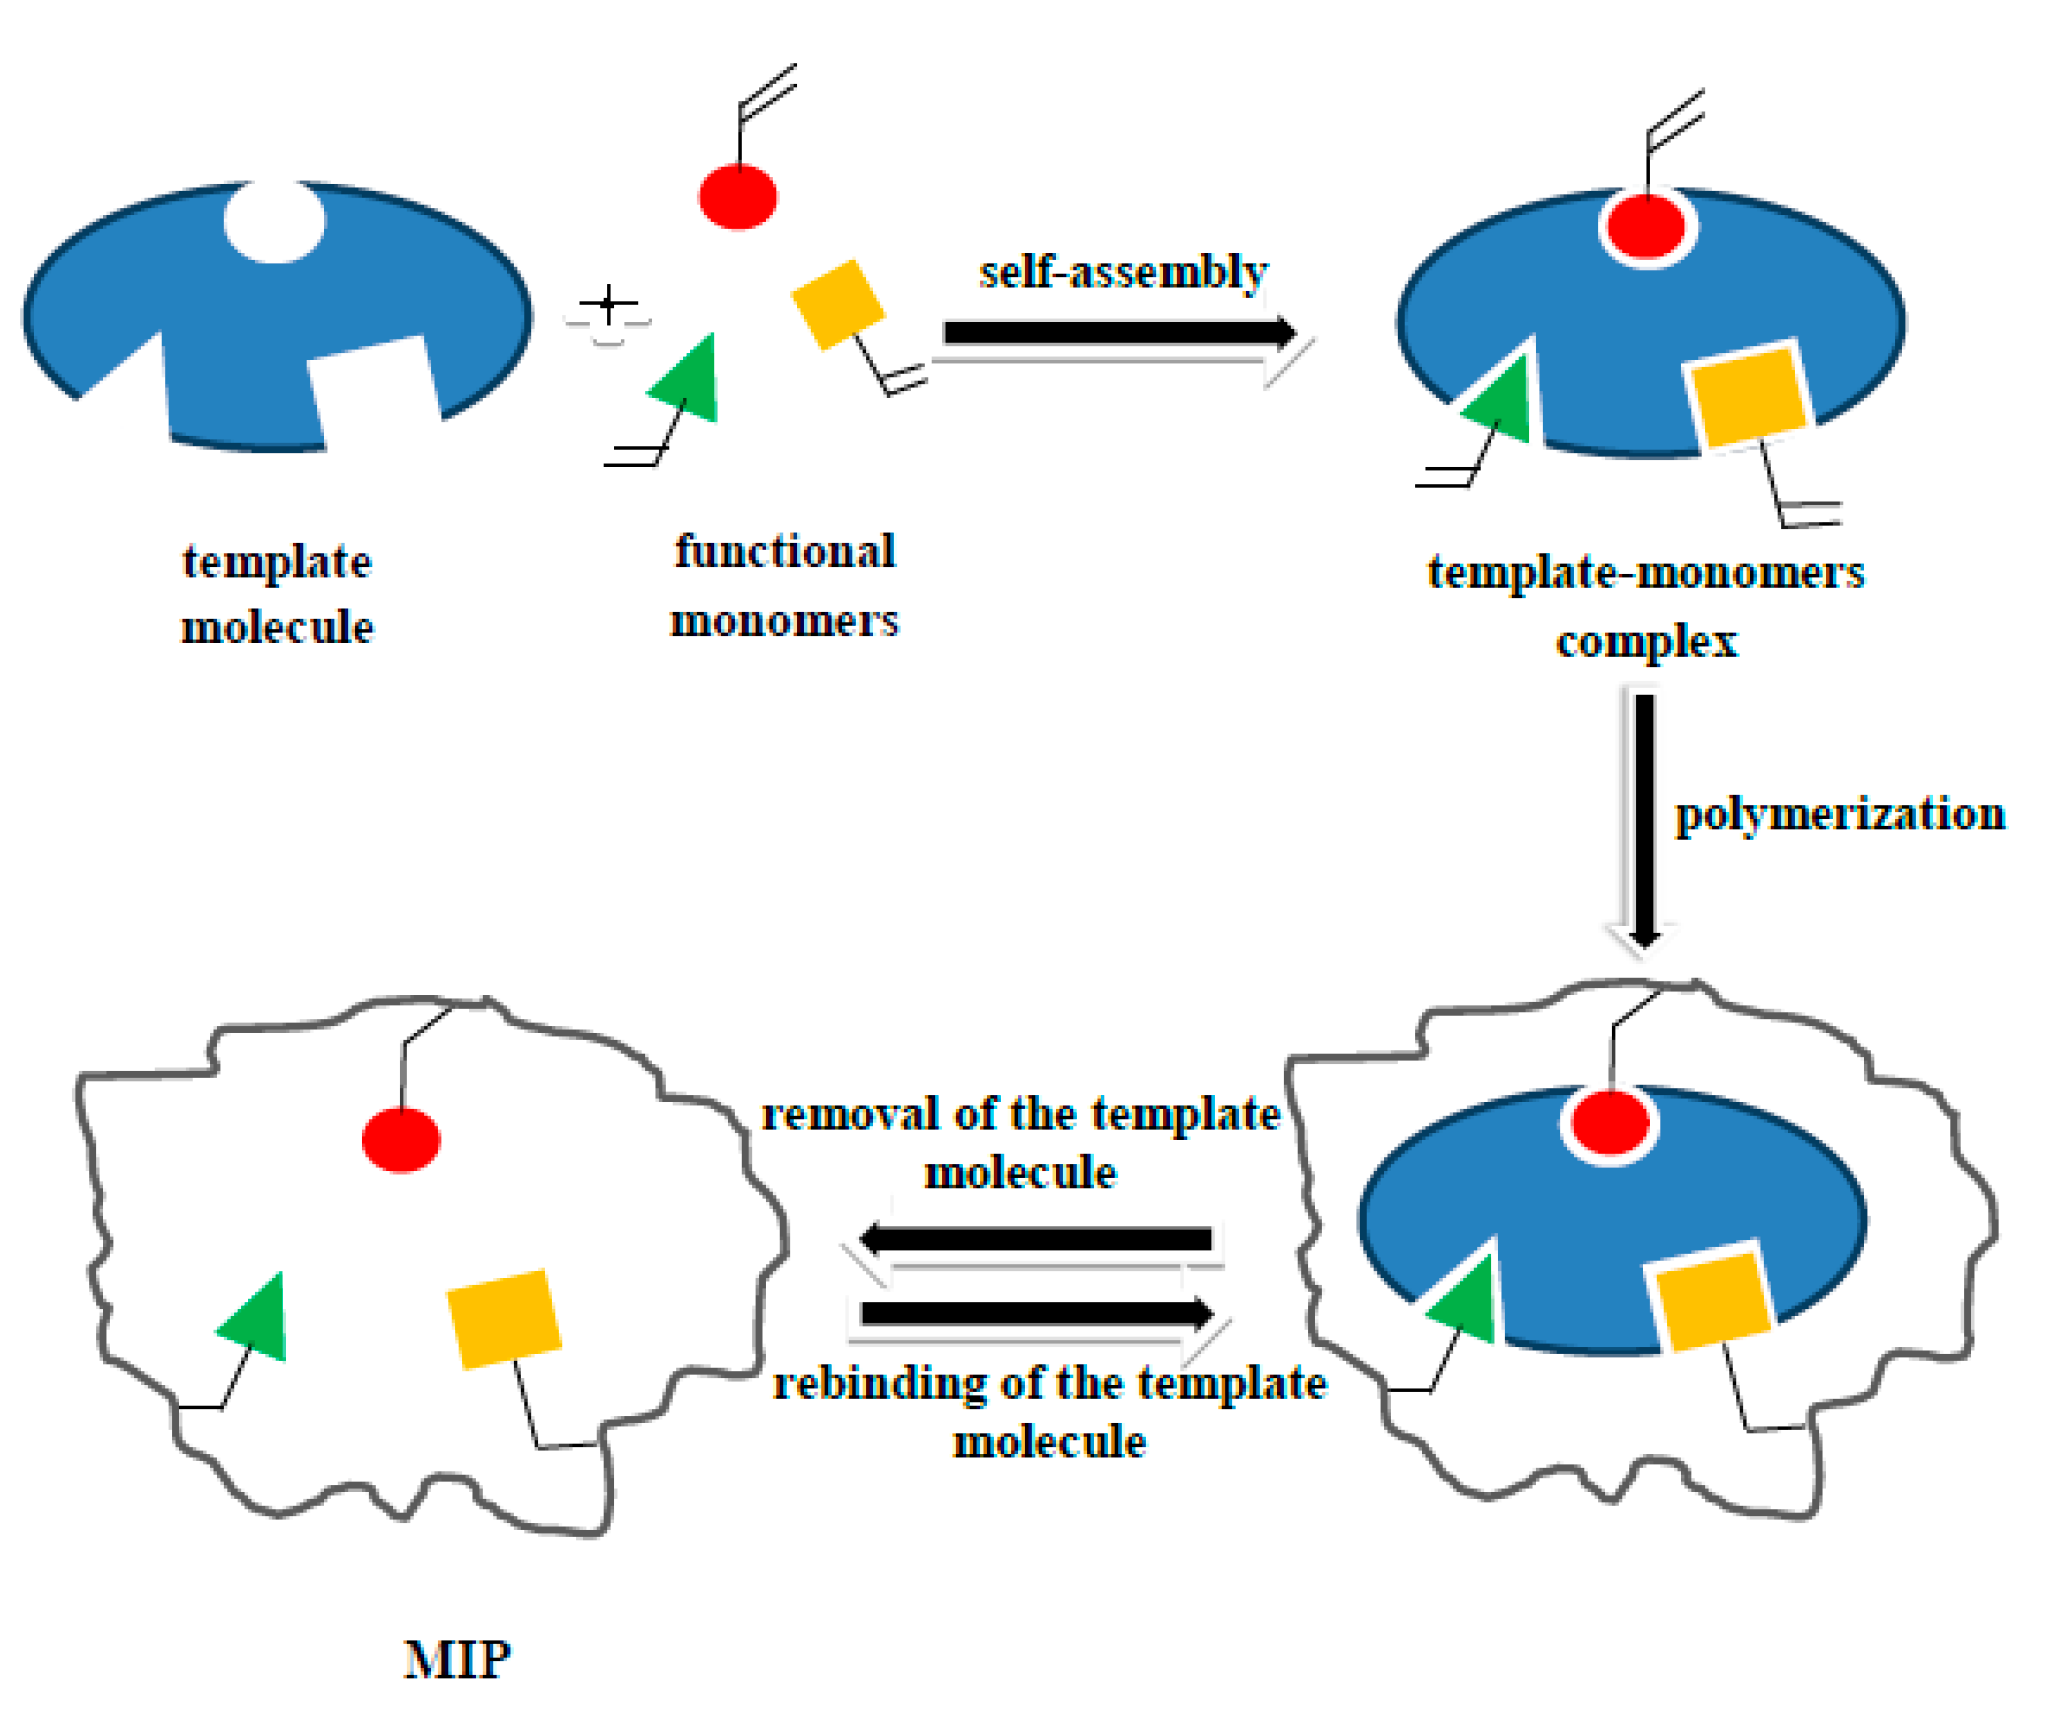
1. Introduction
2. Materials and Methods
2.1. Chemicals
2.2. Synthesis
2.2.1. E1- or E2-MIP
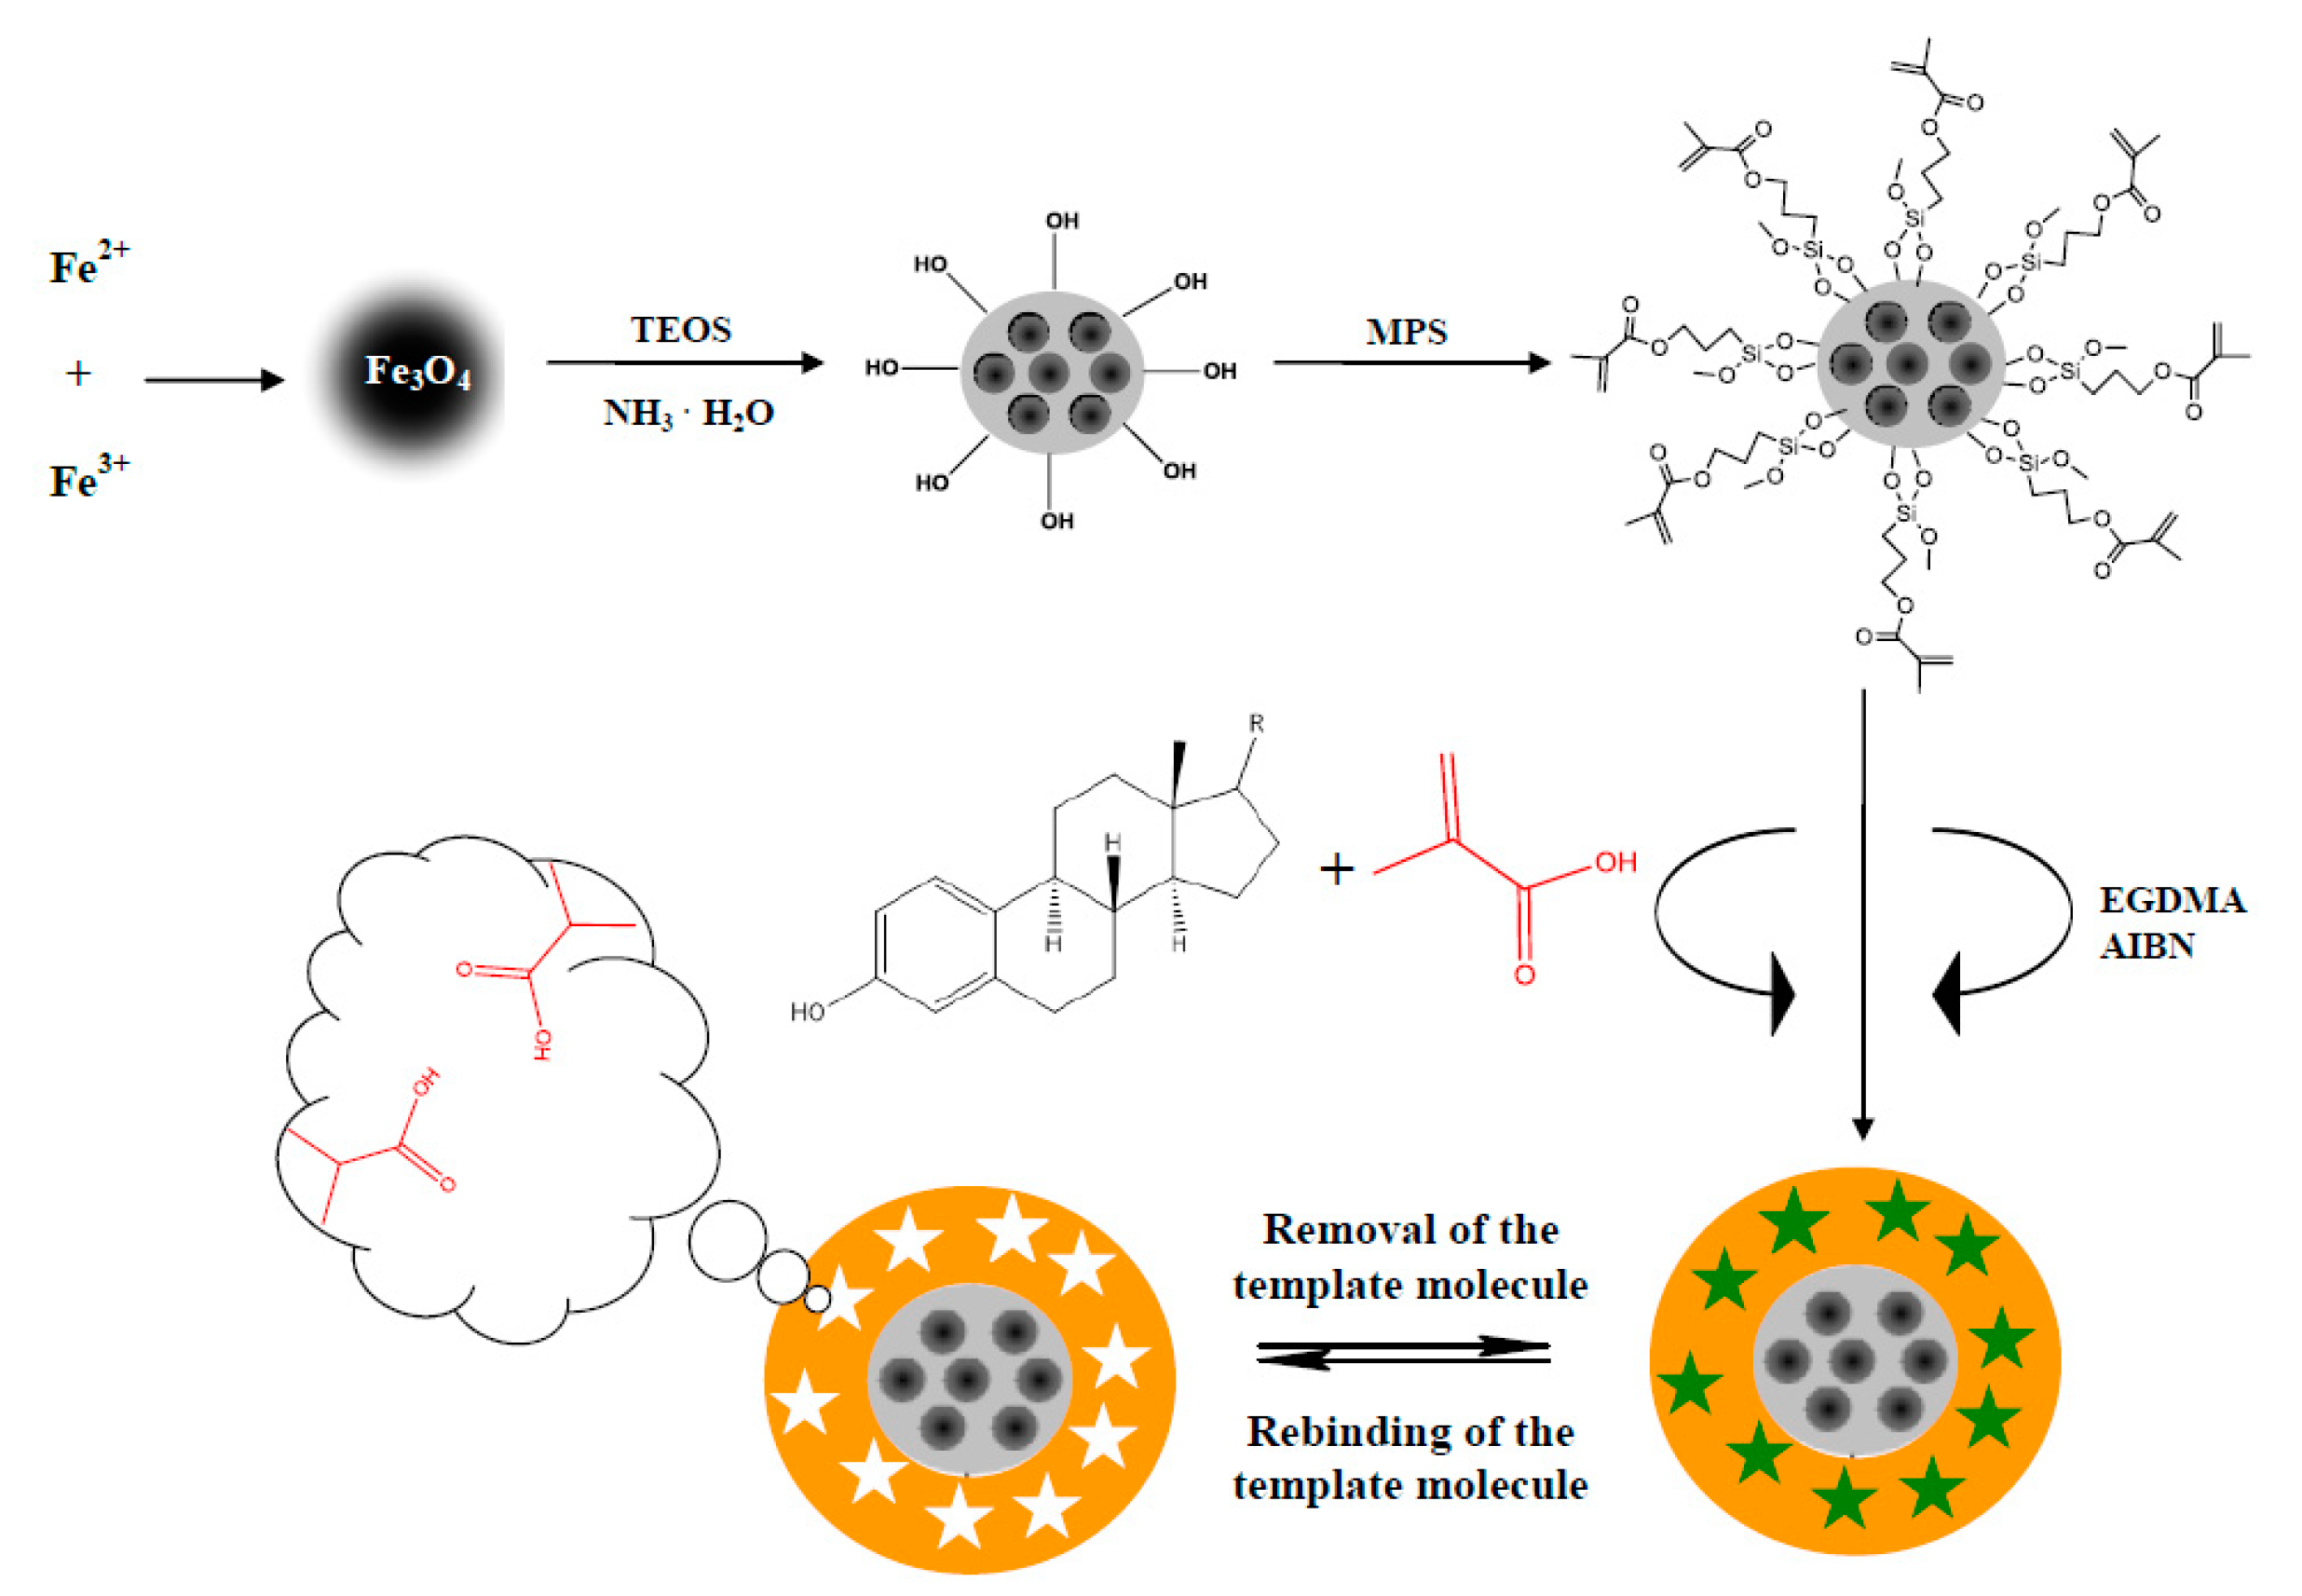
2.2.2. E1- or E2-Mag-MIP
Magnetic Core
Polymer Shell
2.2.3. NIP and Mag-NIP
2.3. Instruments
2.4. Analysis
2.4.1. Calibration Curve
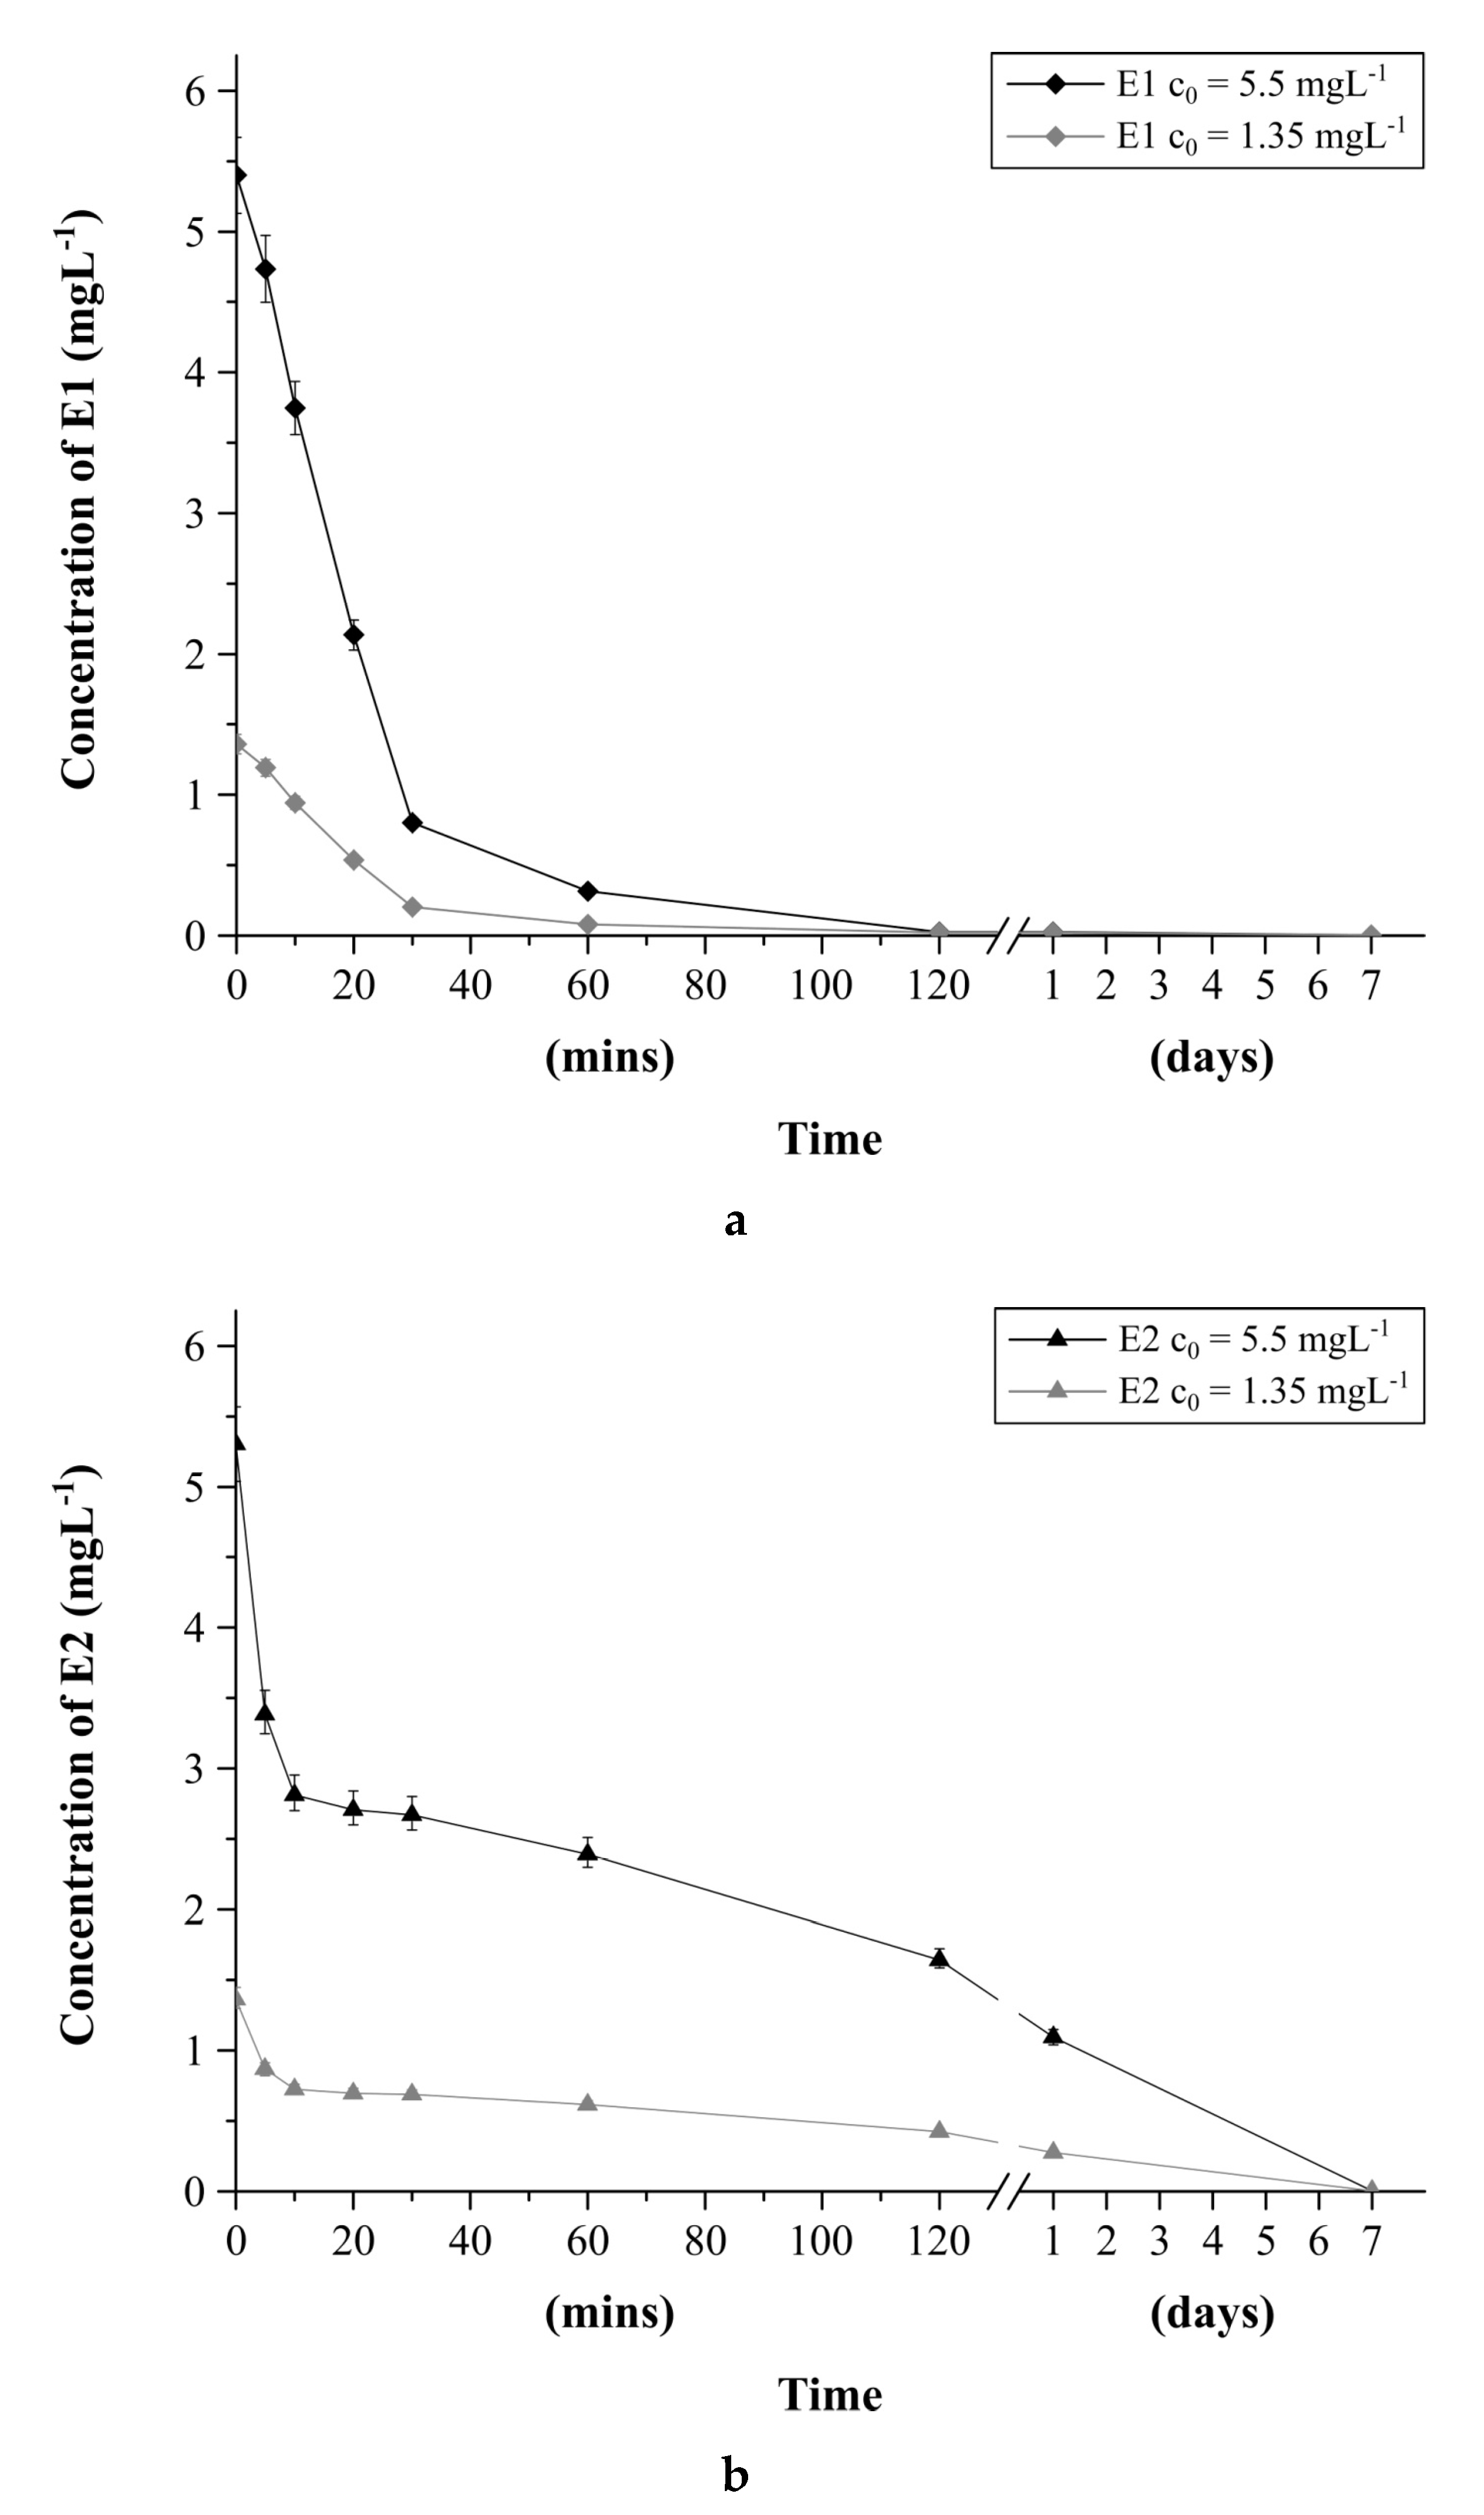
2.4.2. Estrogens Degradation in Water as a Function of Time
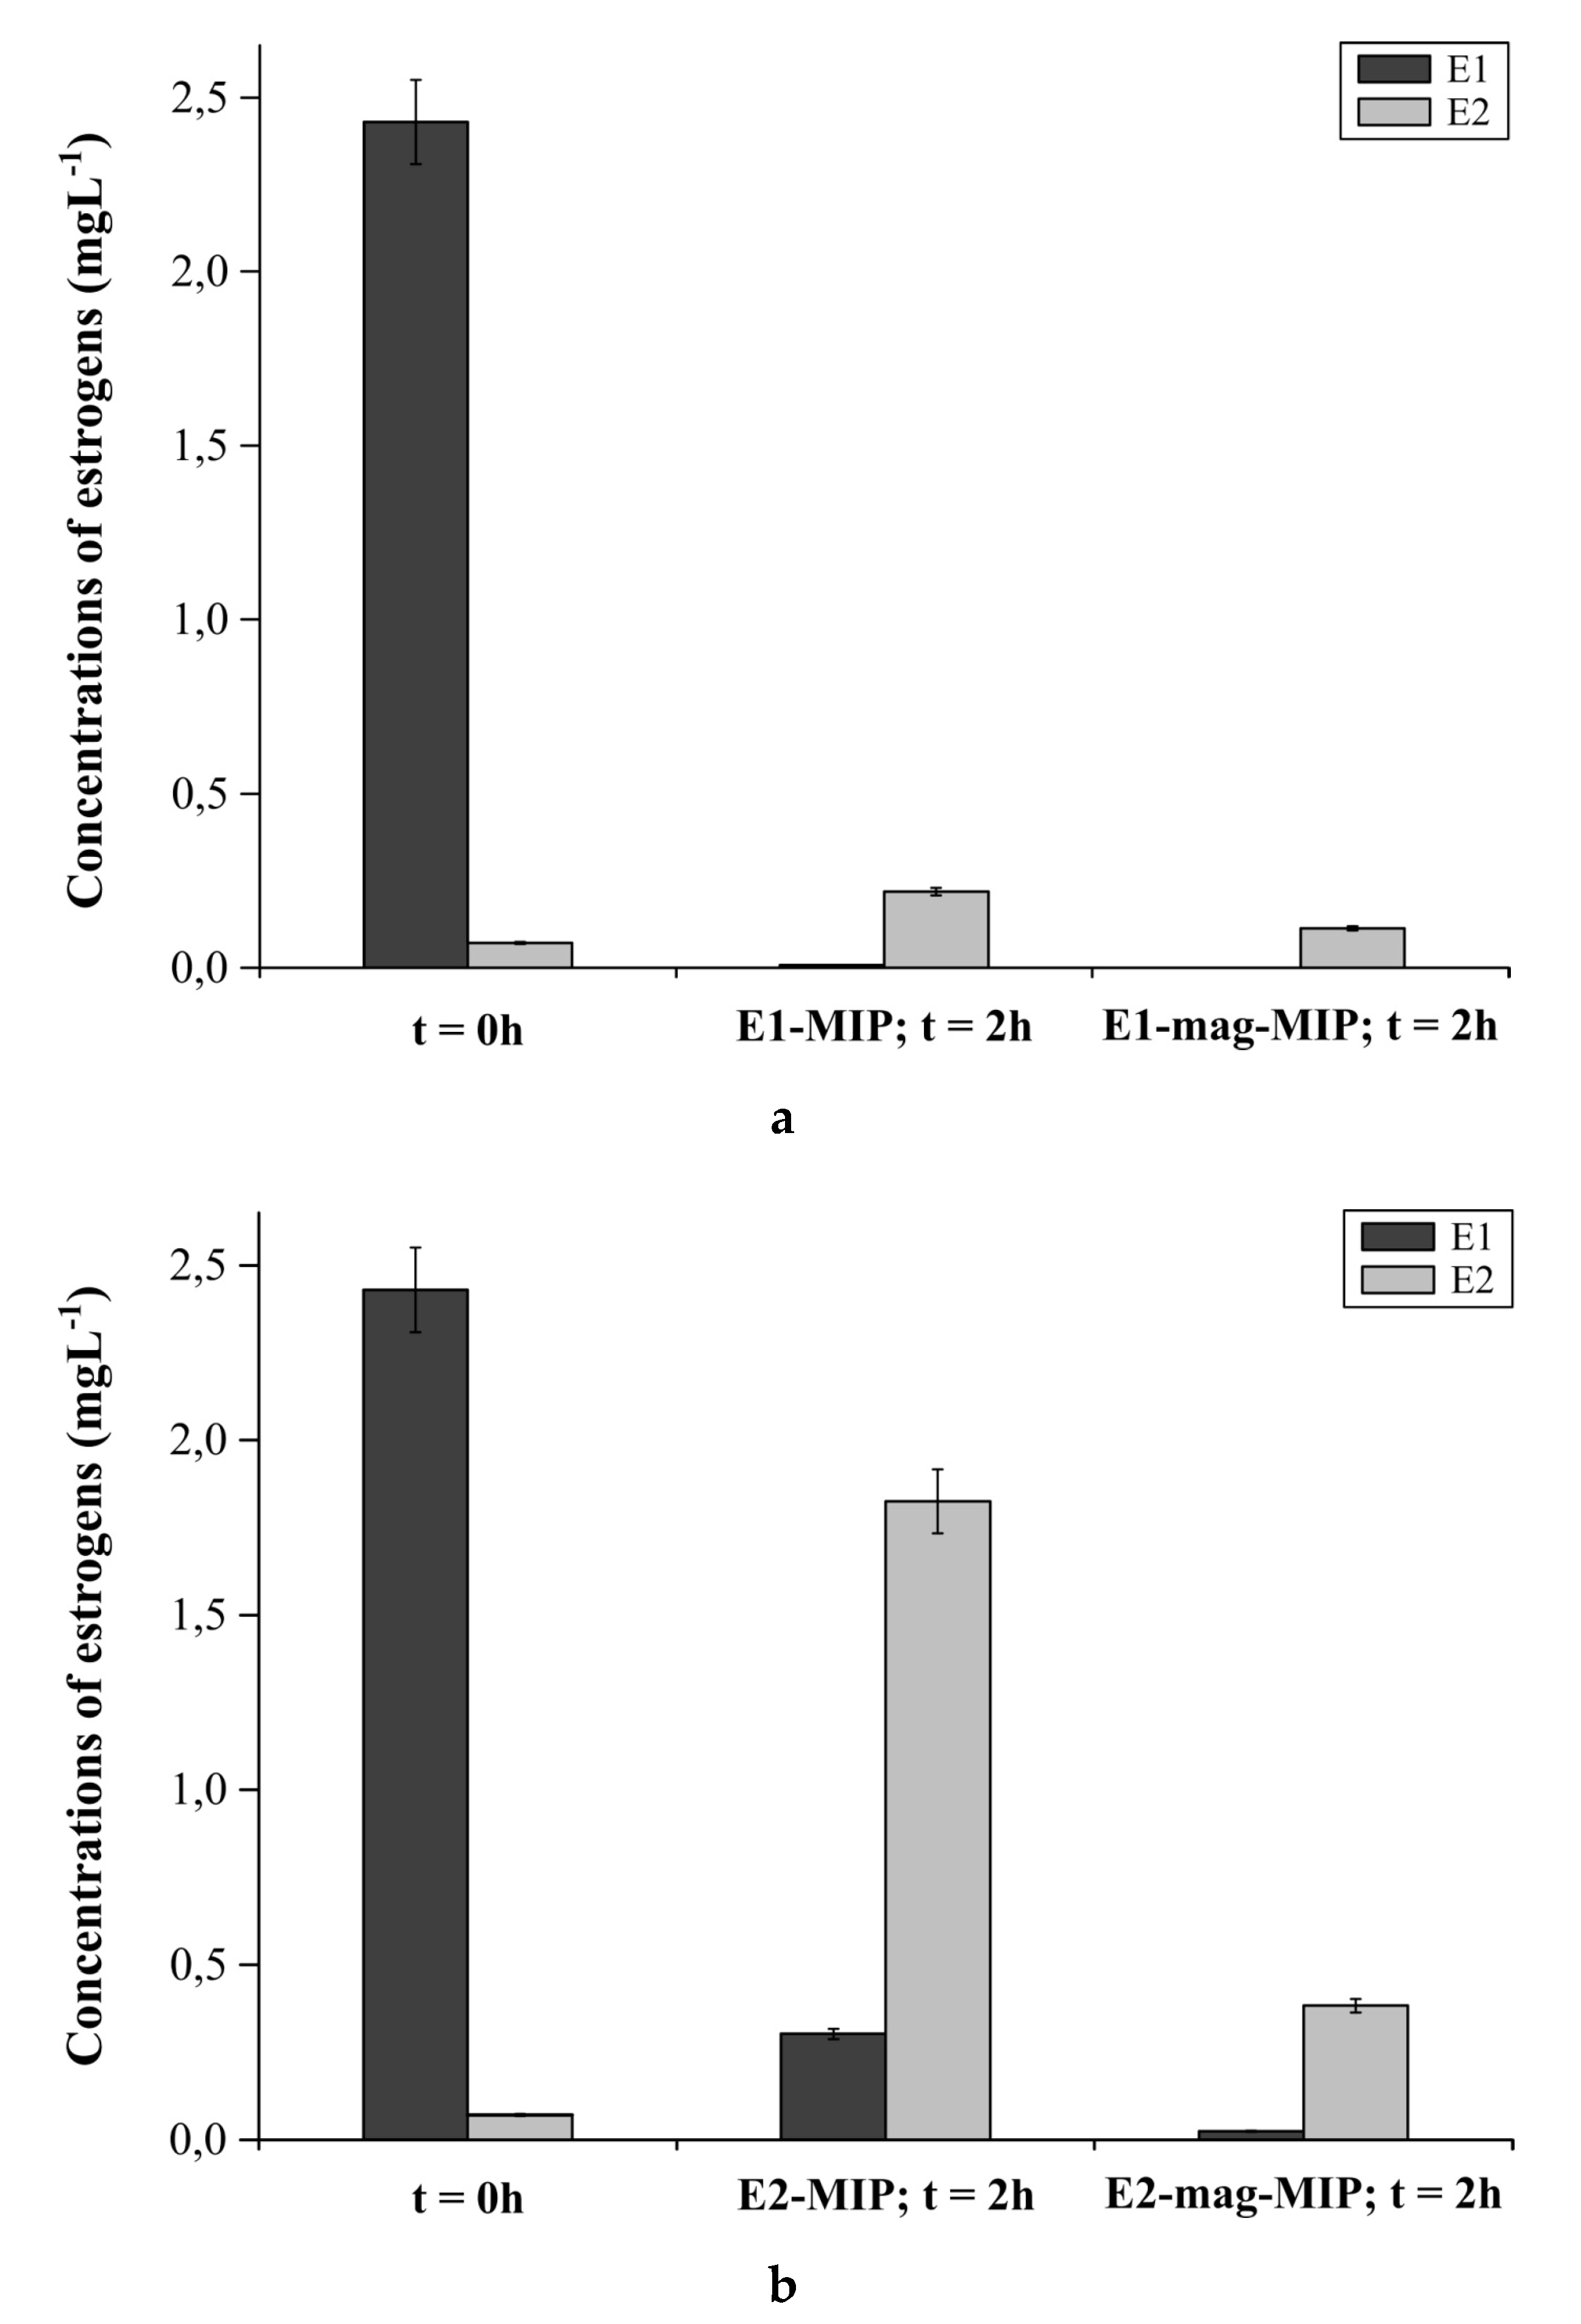
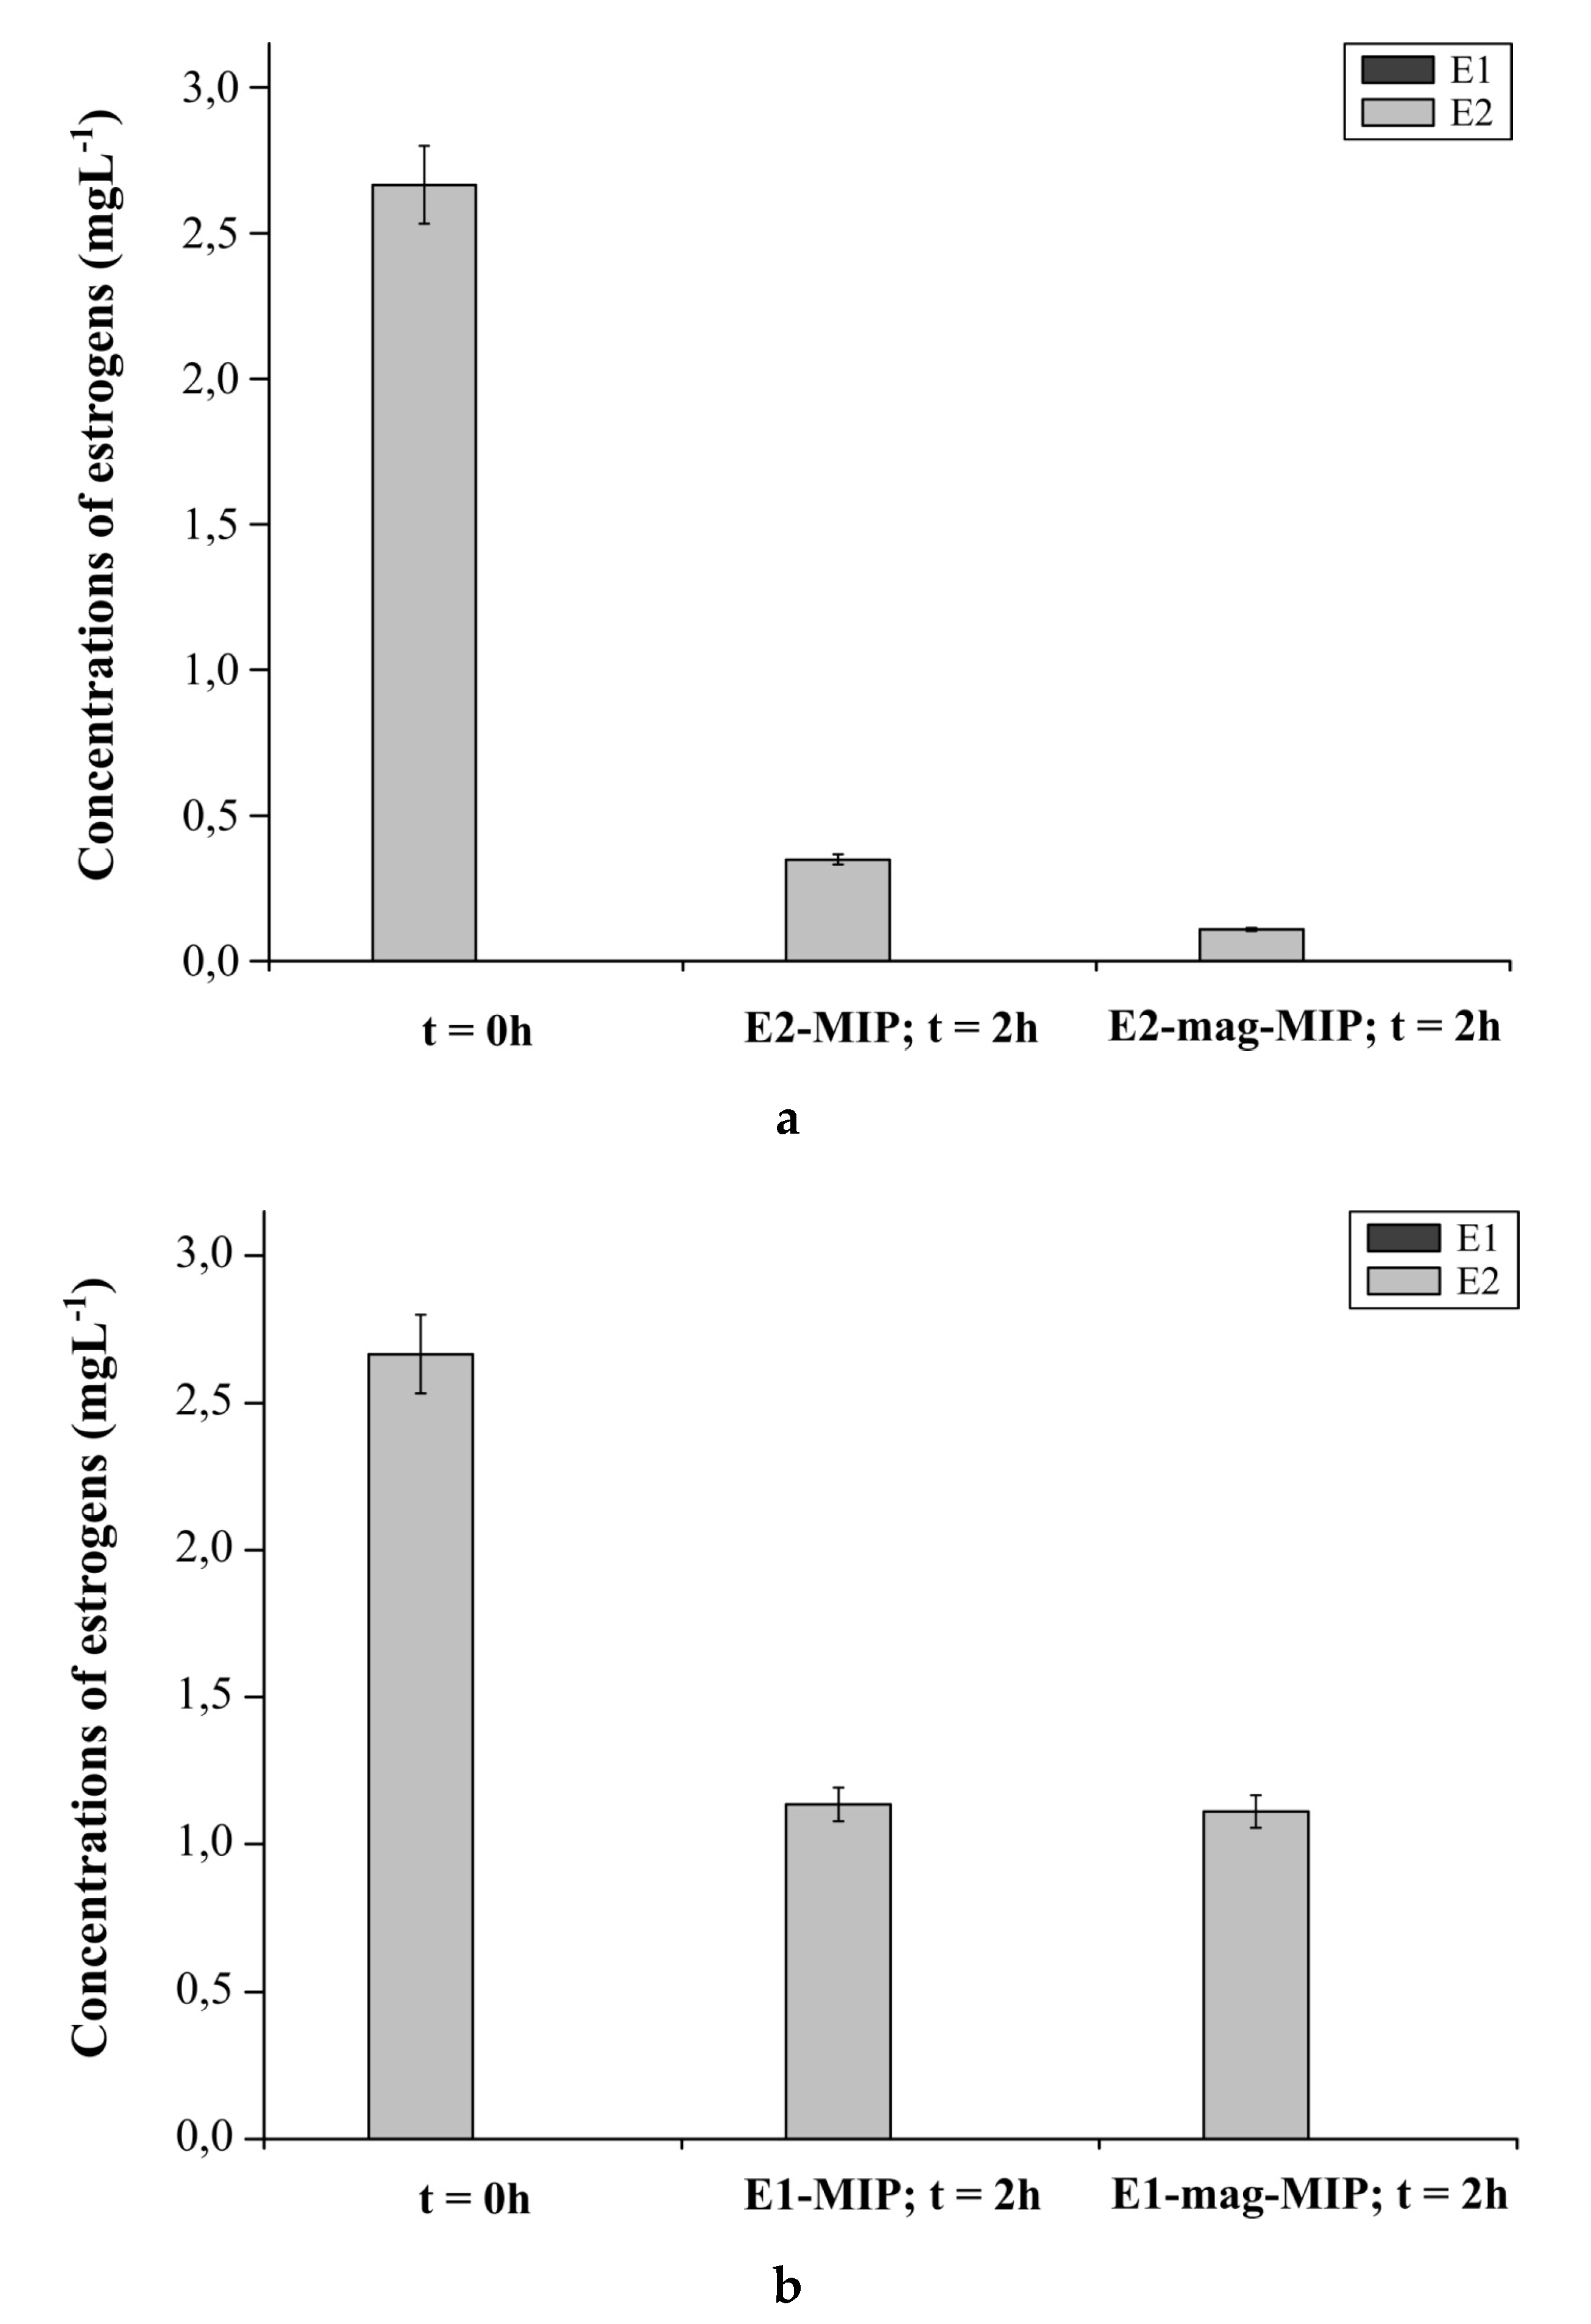
2.4.3. E1-MIP, E2-MIP, E1-Mag-MIP and E2-Mag-MIP Selectivity for E1 or E2 in Hormone Aqueous Solutions
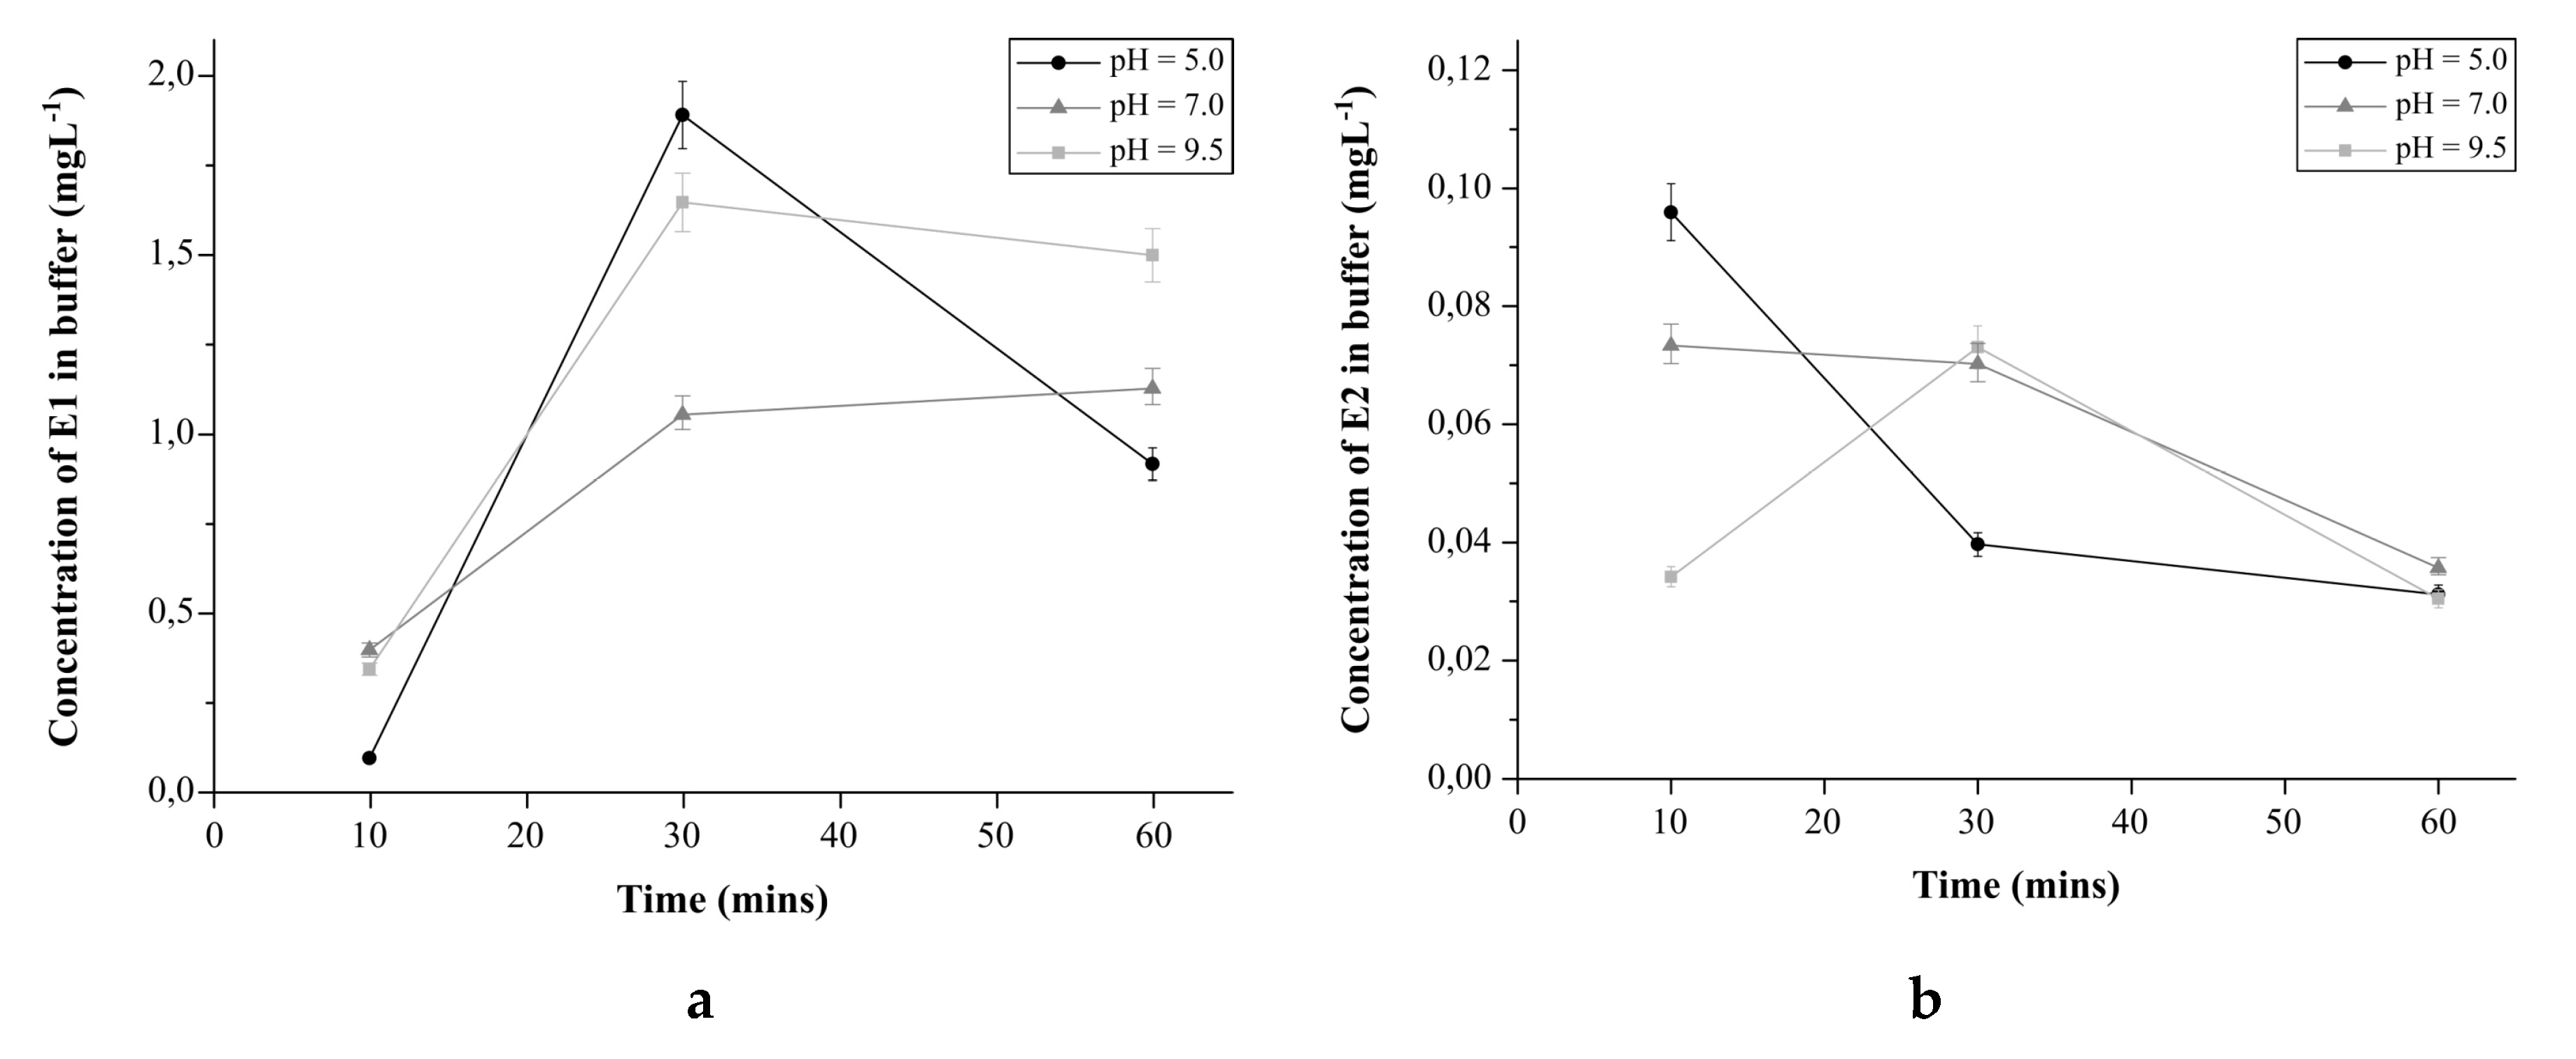
2.4.4. The Effect of pH on Estrogens Release from E1-Mag-MIP and E2-Mag-MIP
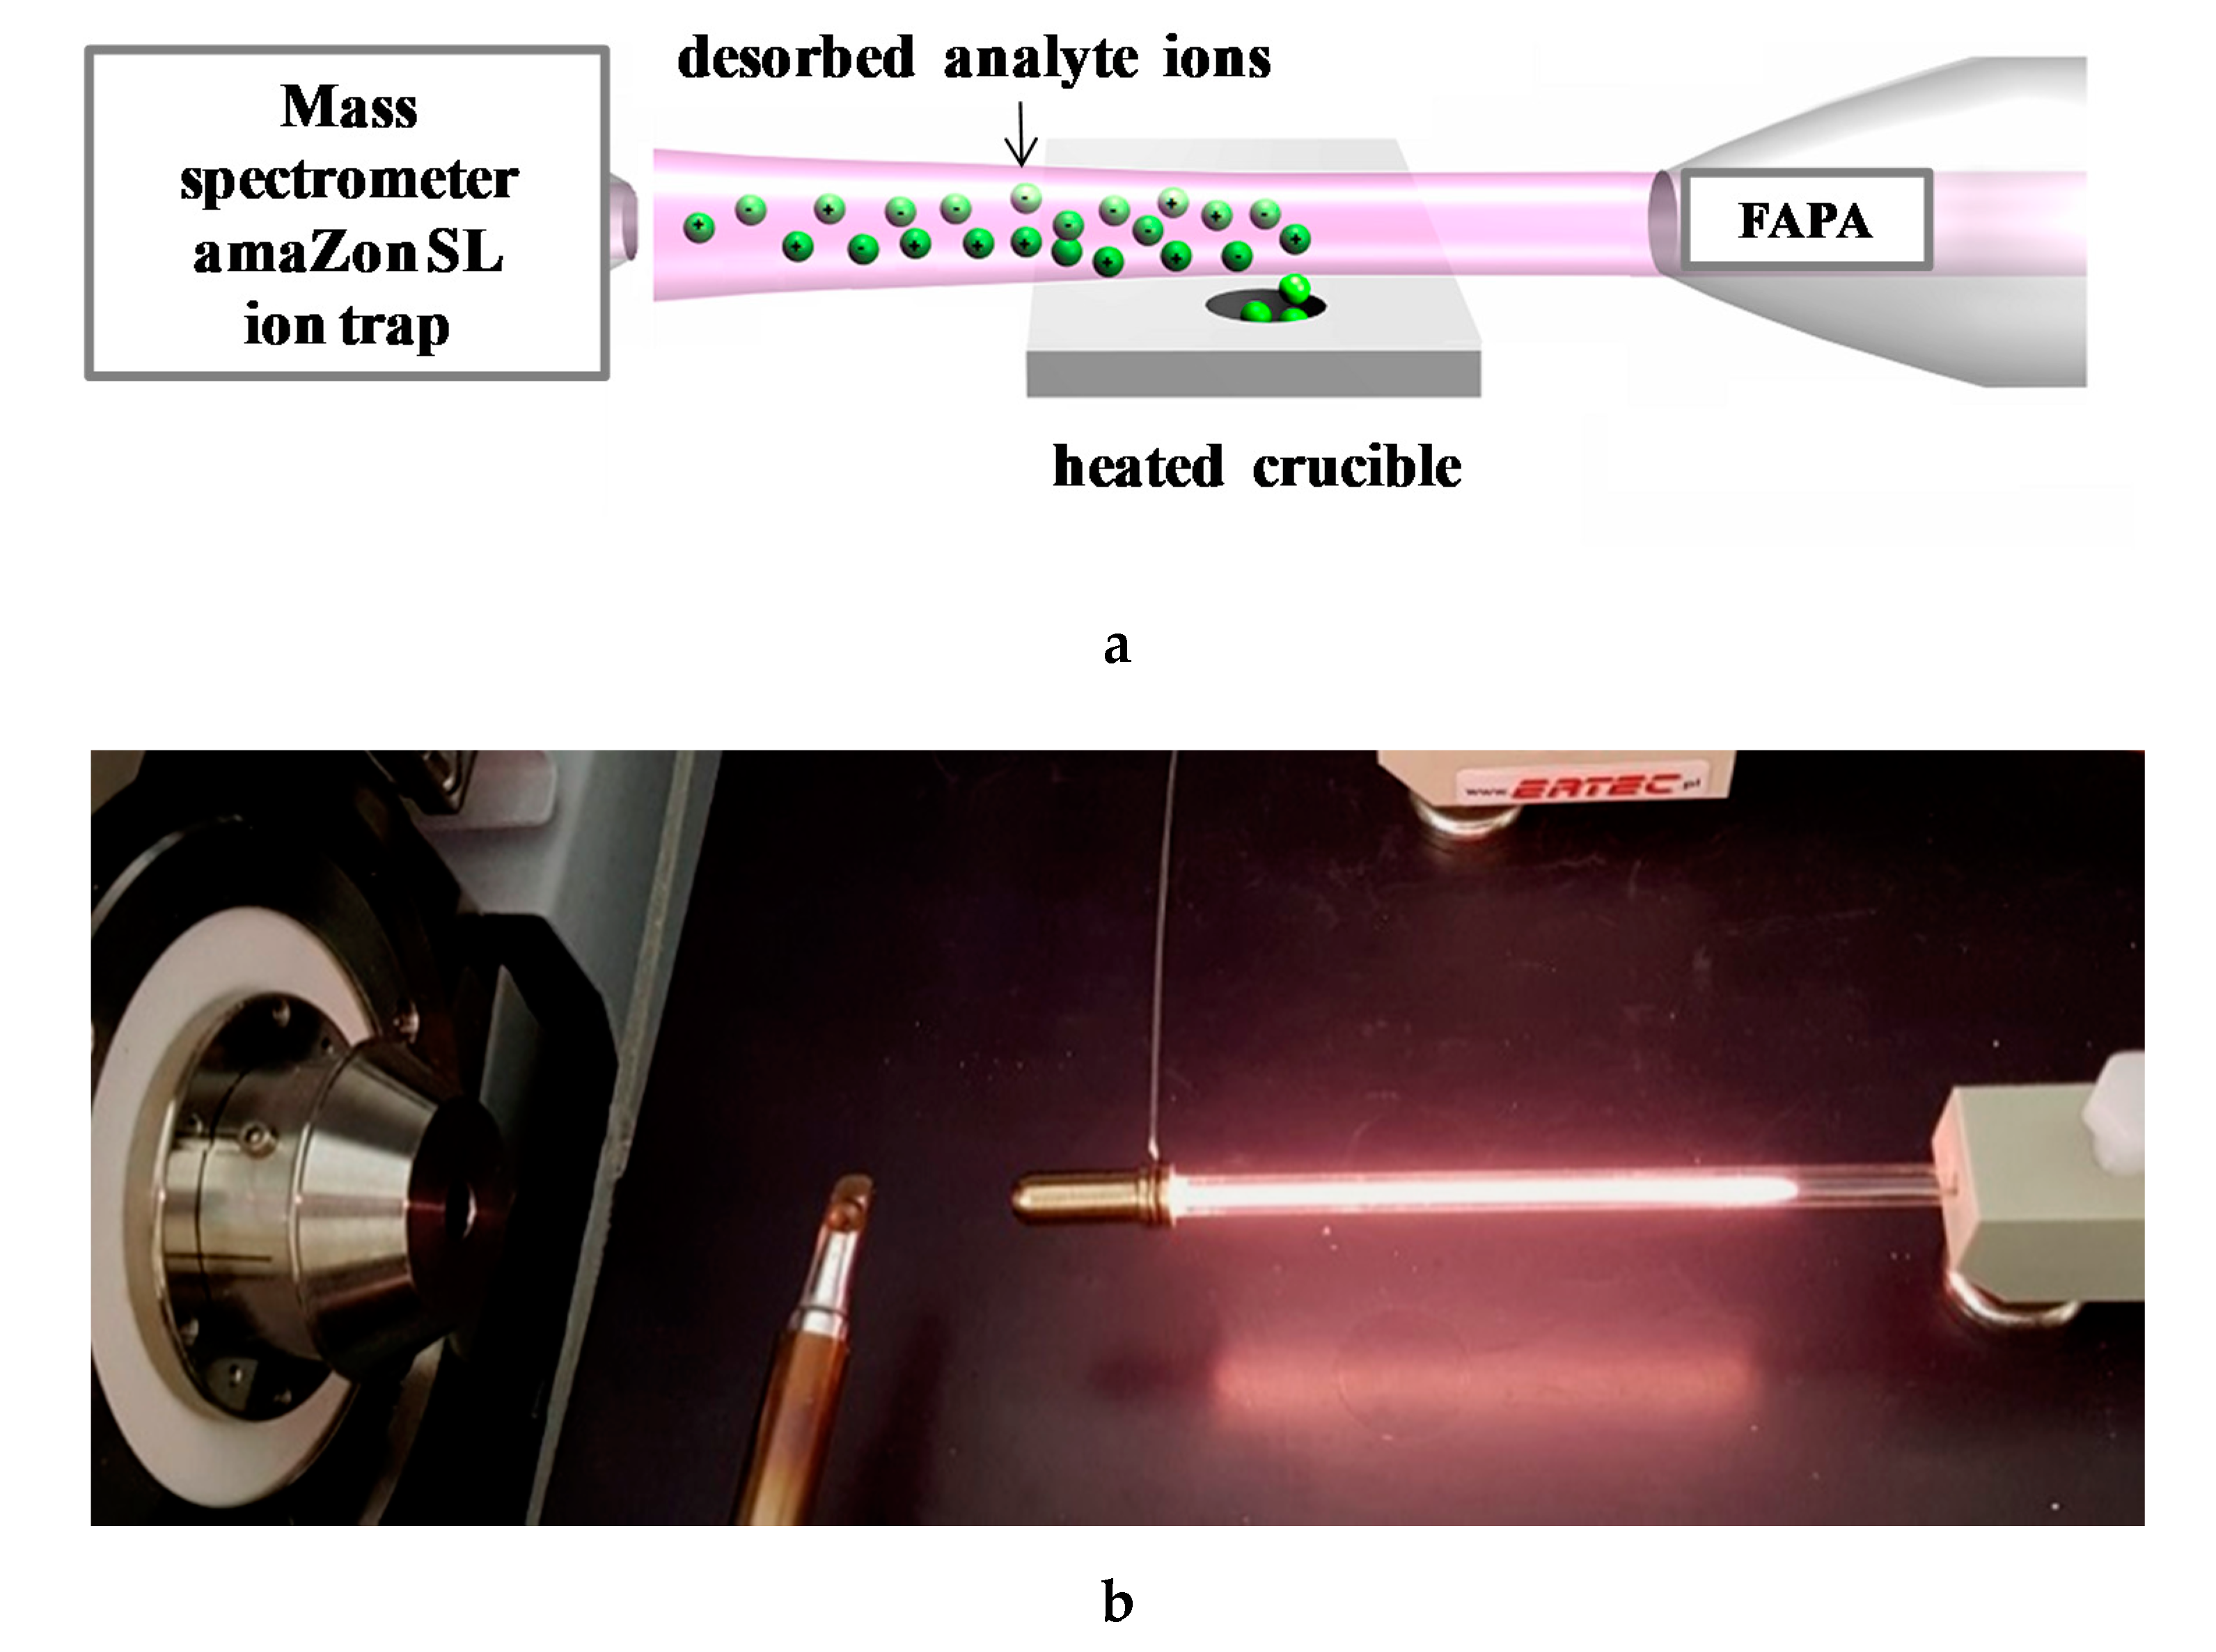
2.4.5. Determination of Estrogens in Water Using E1-Mag-MIP and E2-Mag-MIP Combining with FAPA-MS Method
3. Results and Discussion
3.1. Synthesis
3.2. Analysis
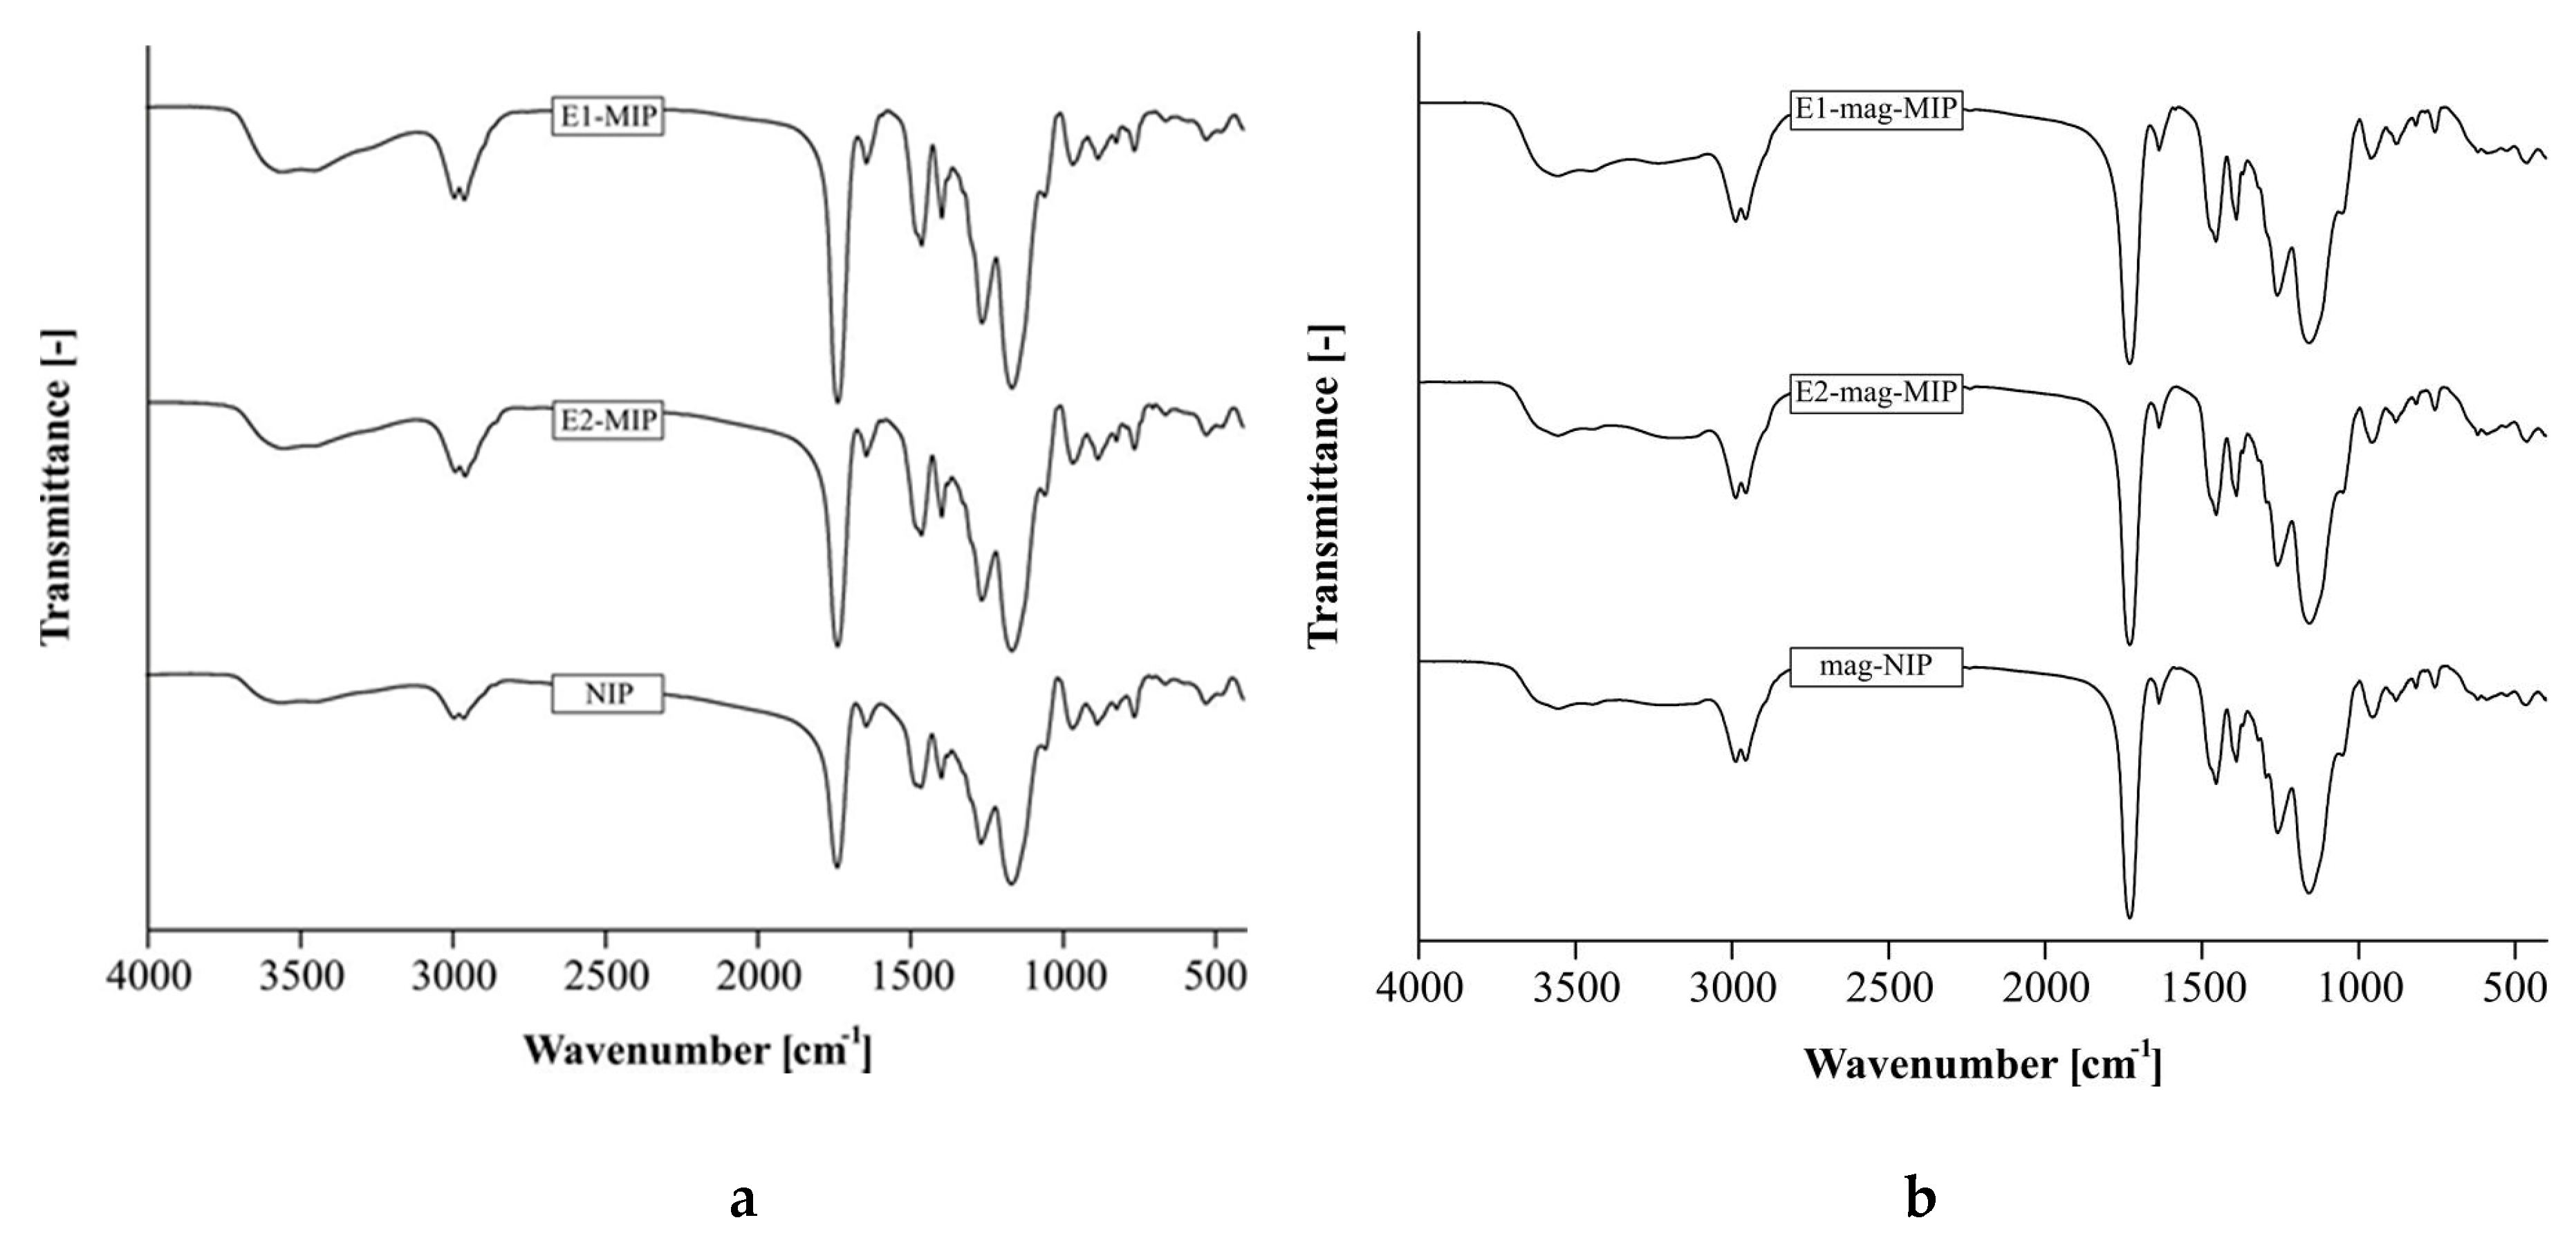
3.2.1. FT-IR Spectra
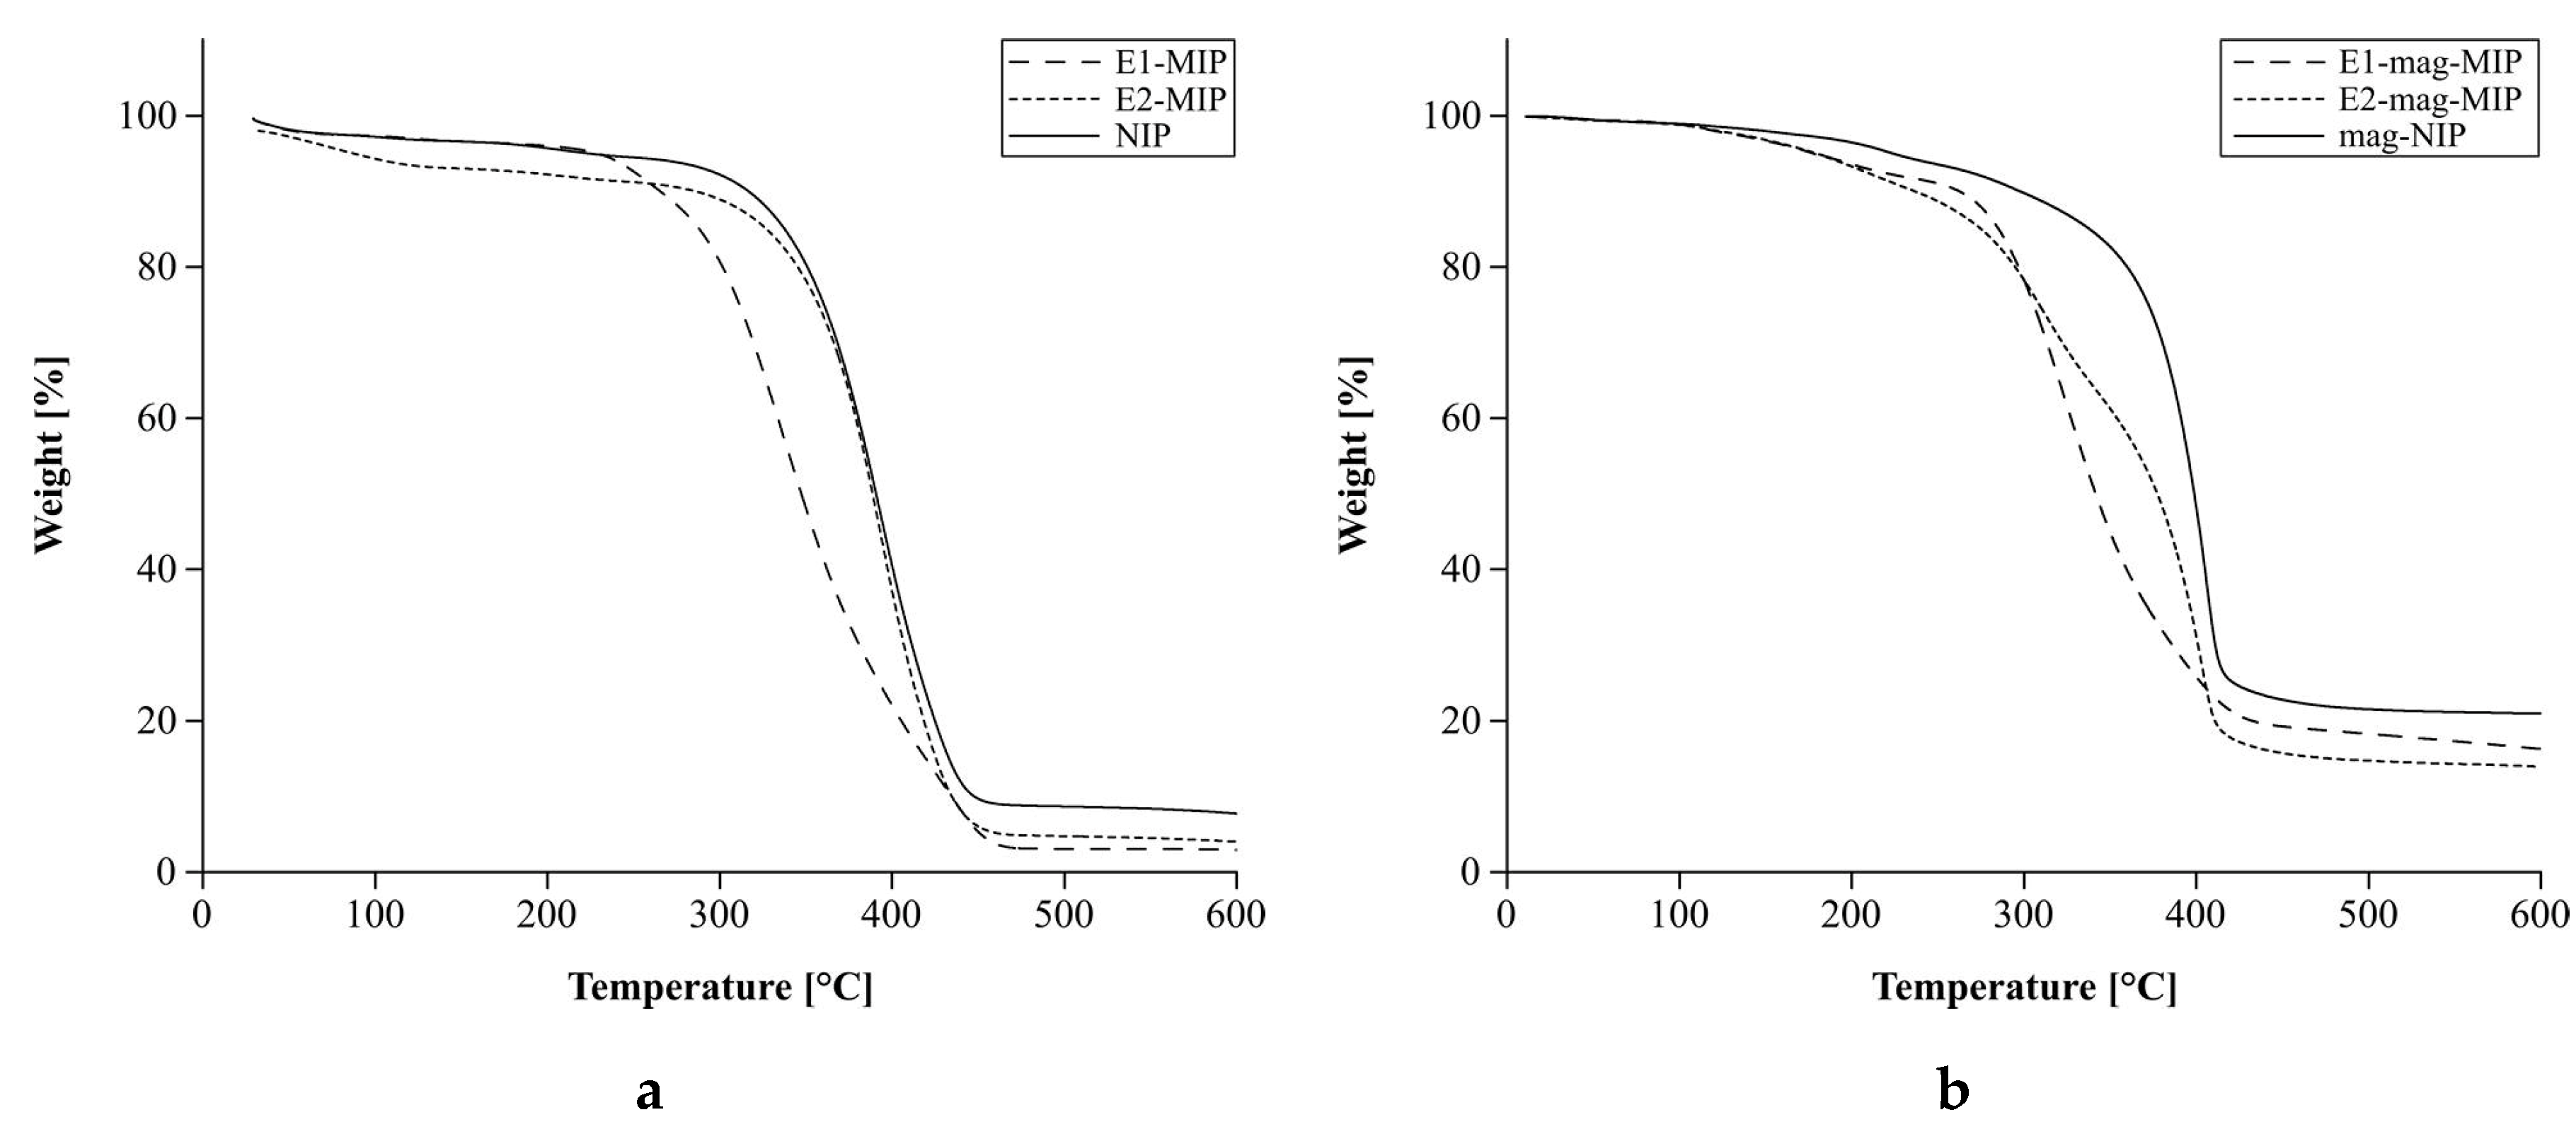
3.2.2. Thermal Analysis
3.2.3. SEM Images
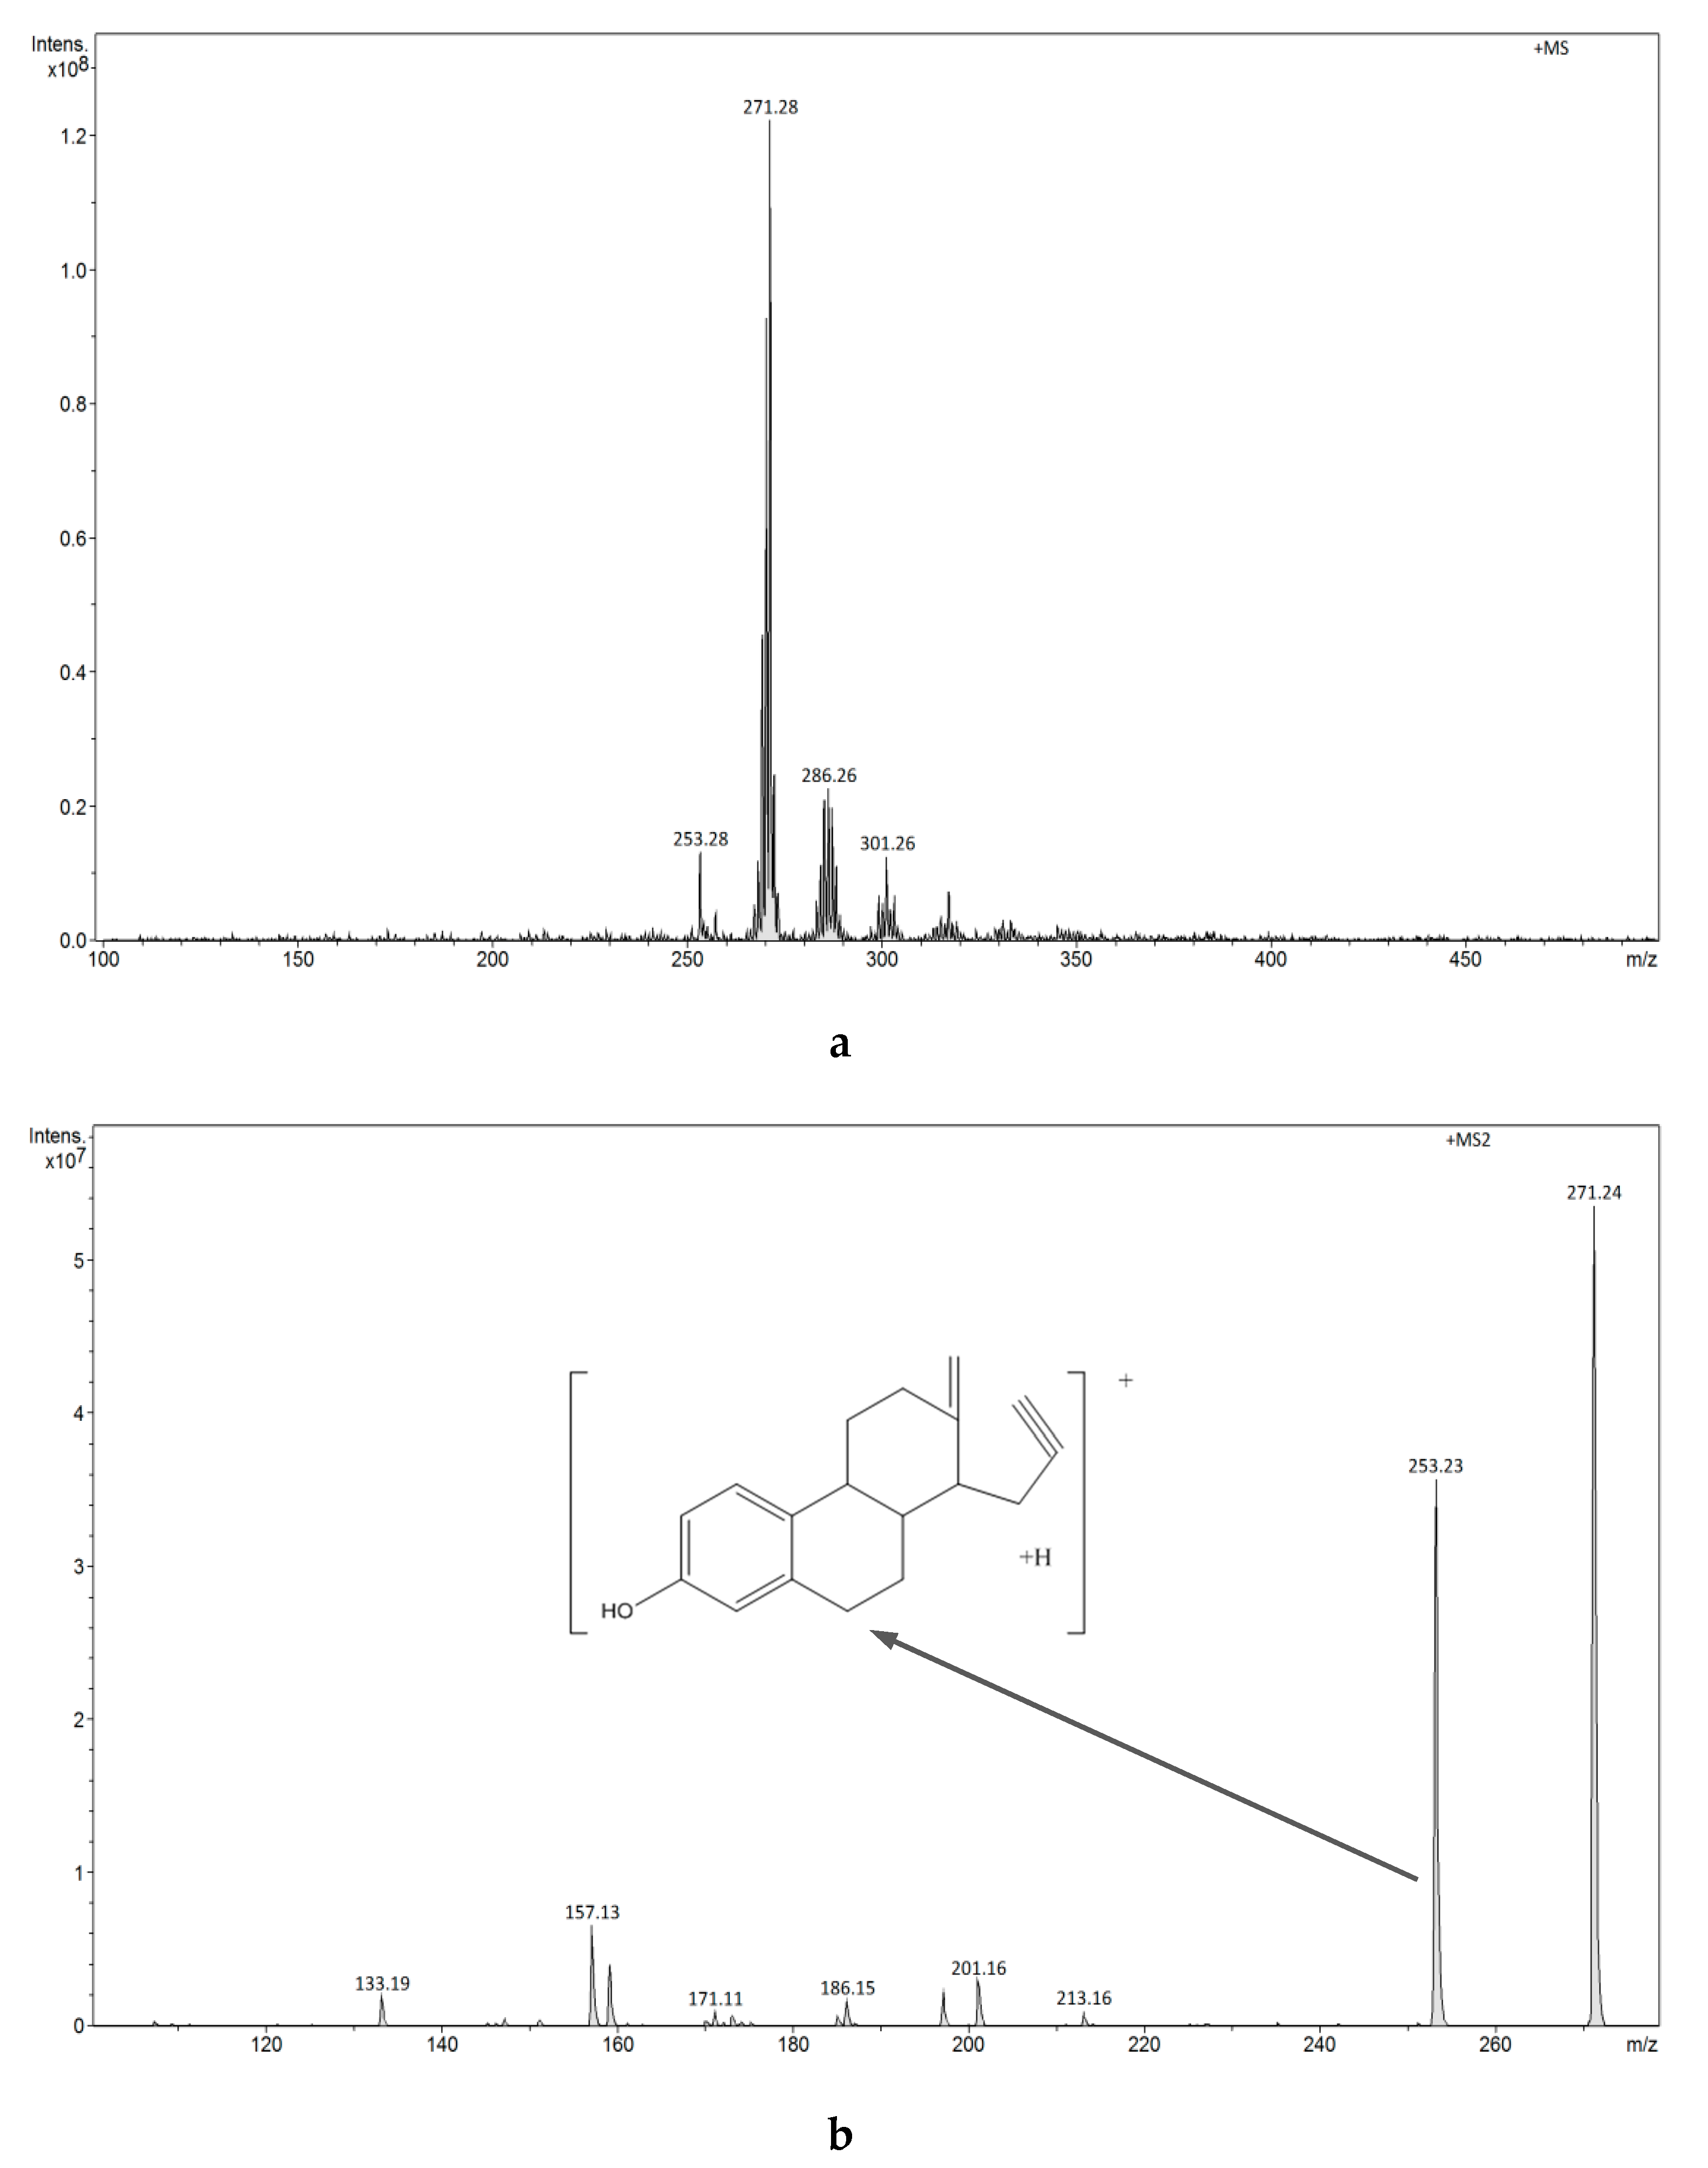
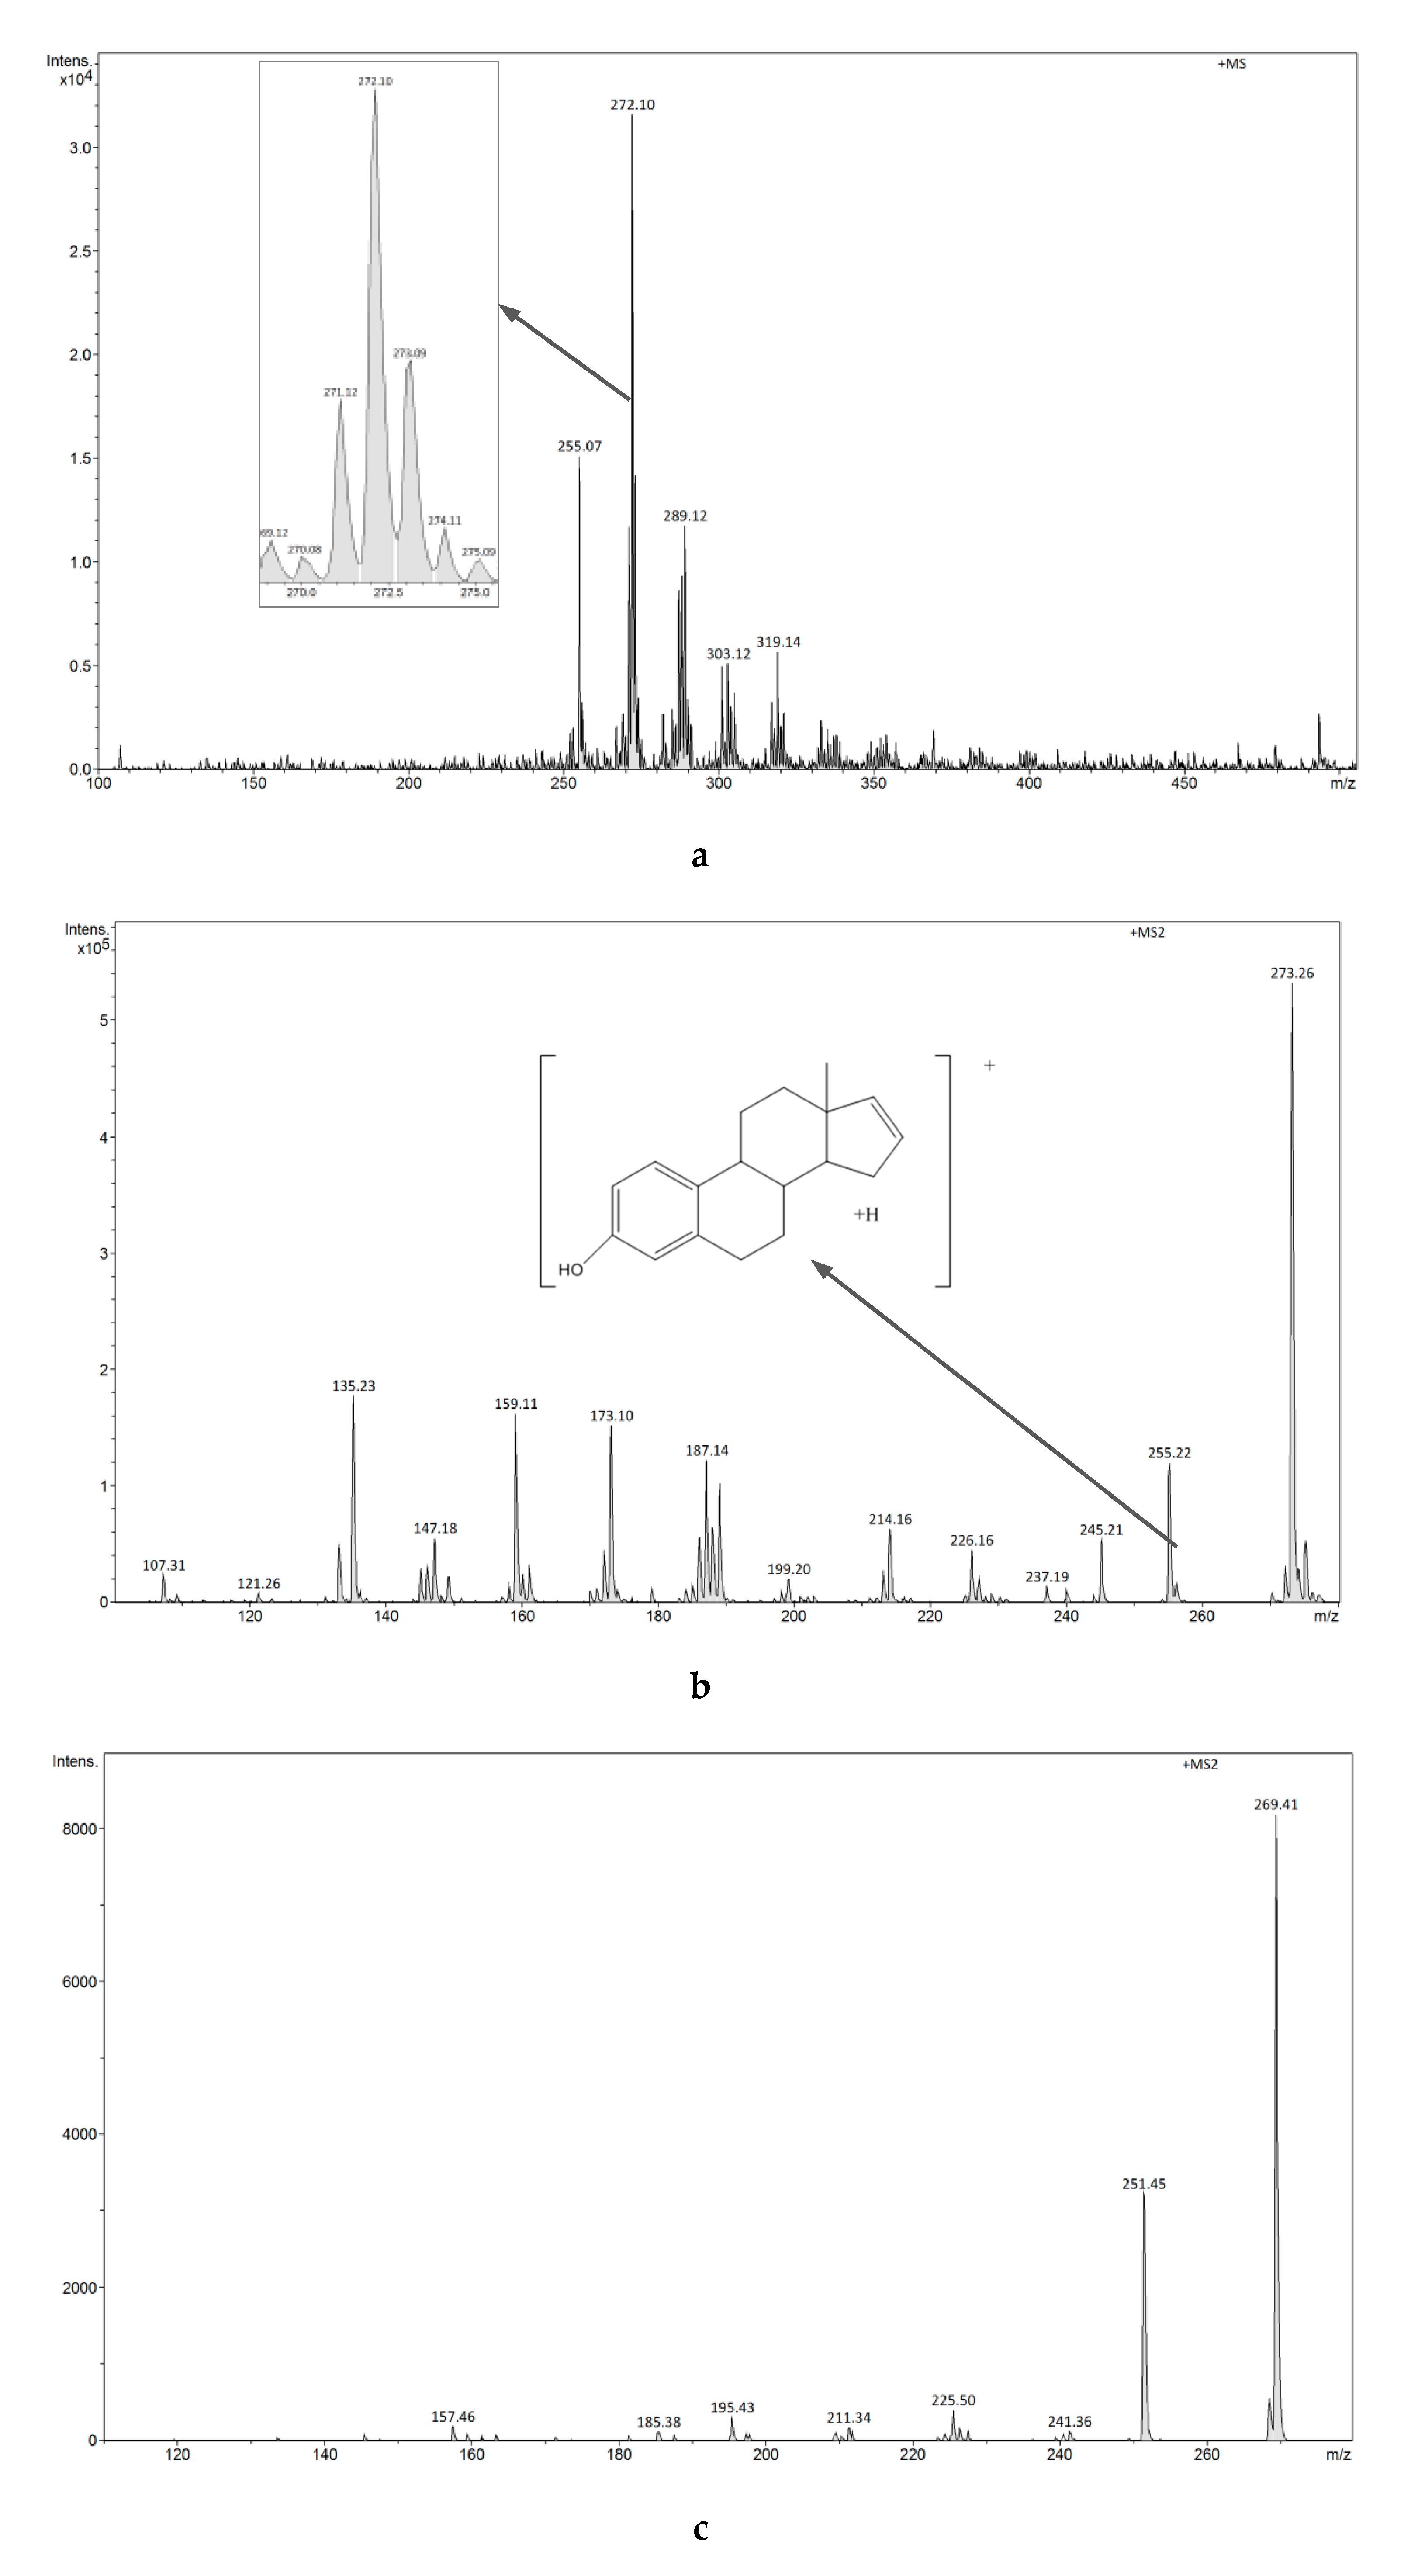
3.2.4. Analysis of Estrogens in Aqueous Solution Using the ESI-MS Technique
3.2.5. E1-MIP, E2-MIP, E1-Mag-MIP and E2-Mag-MIP Selectivity for E1 or E2 in Hormone Aqueous Solutions
3.2.6. The Effect of pH on the Estrogens Release from E1-Mag-MIP and E2-Mag-MIP
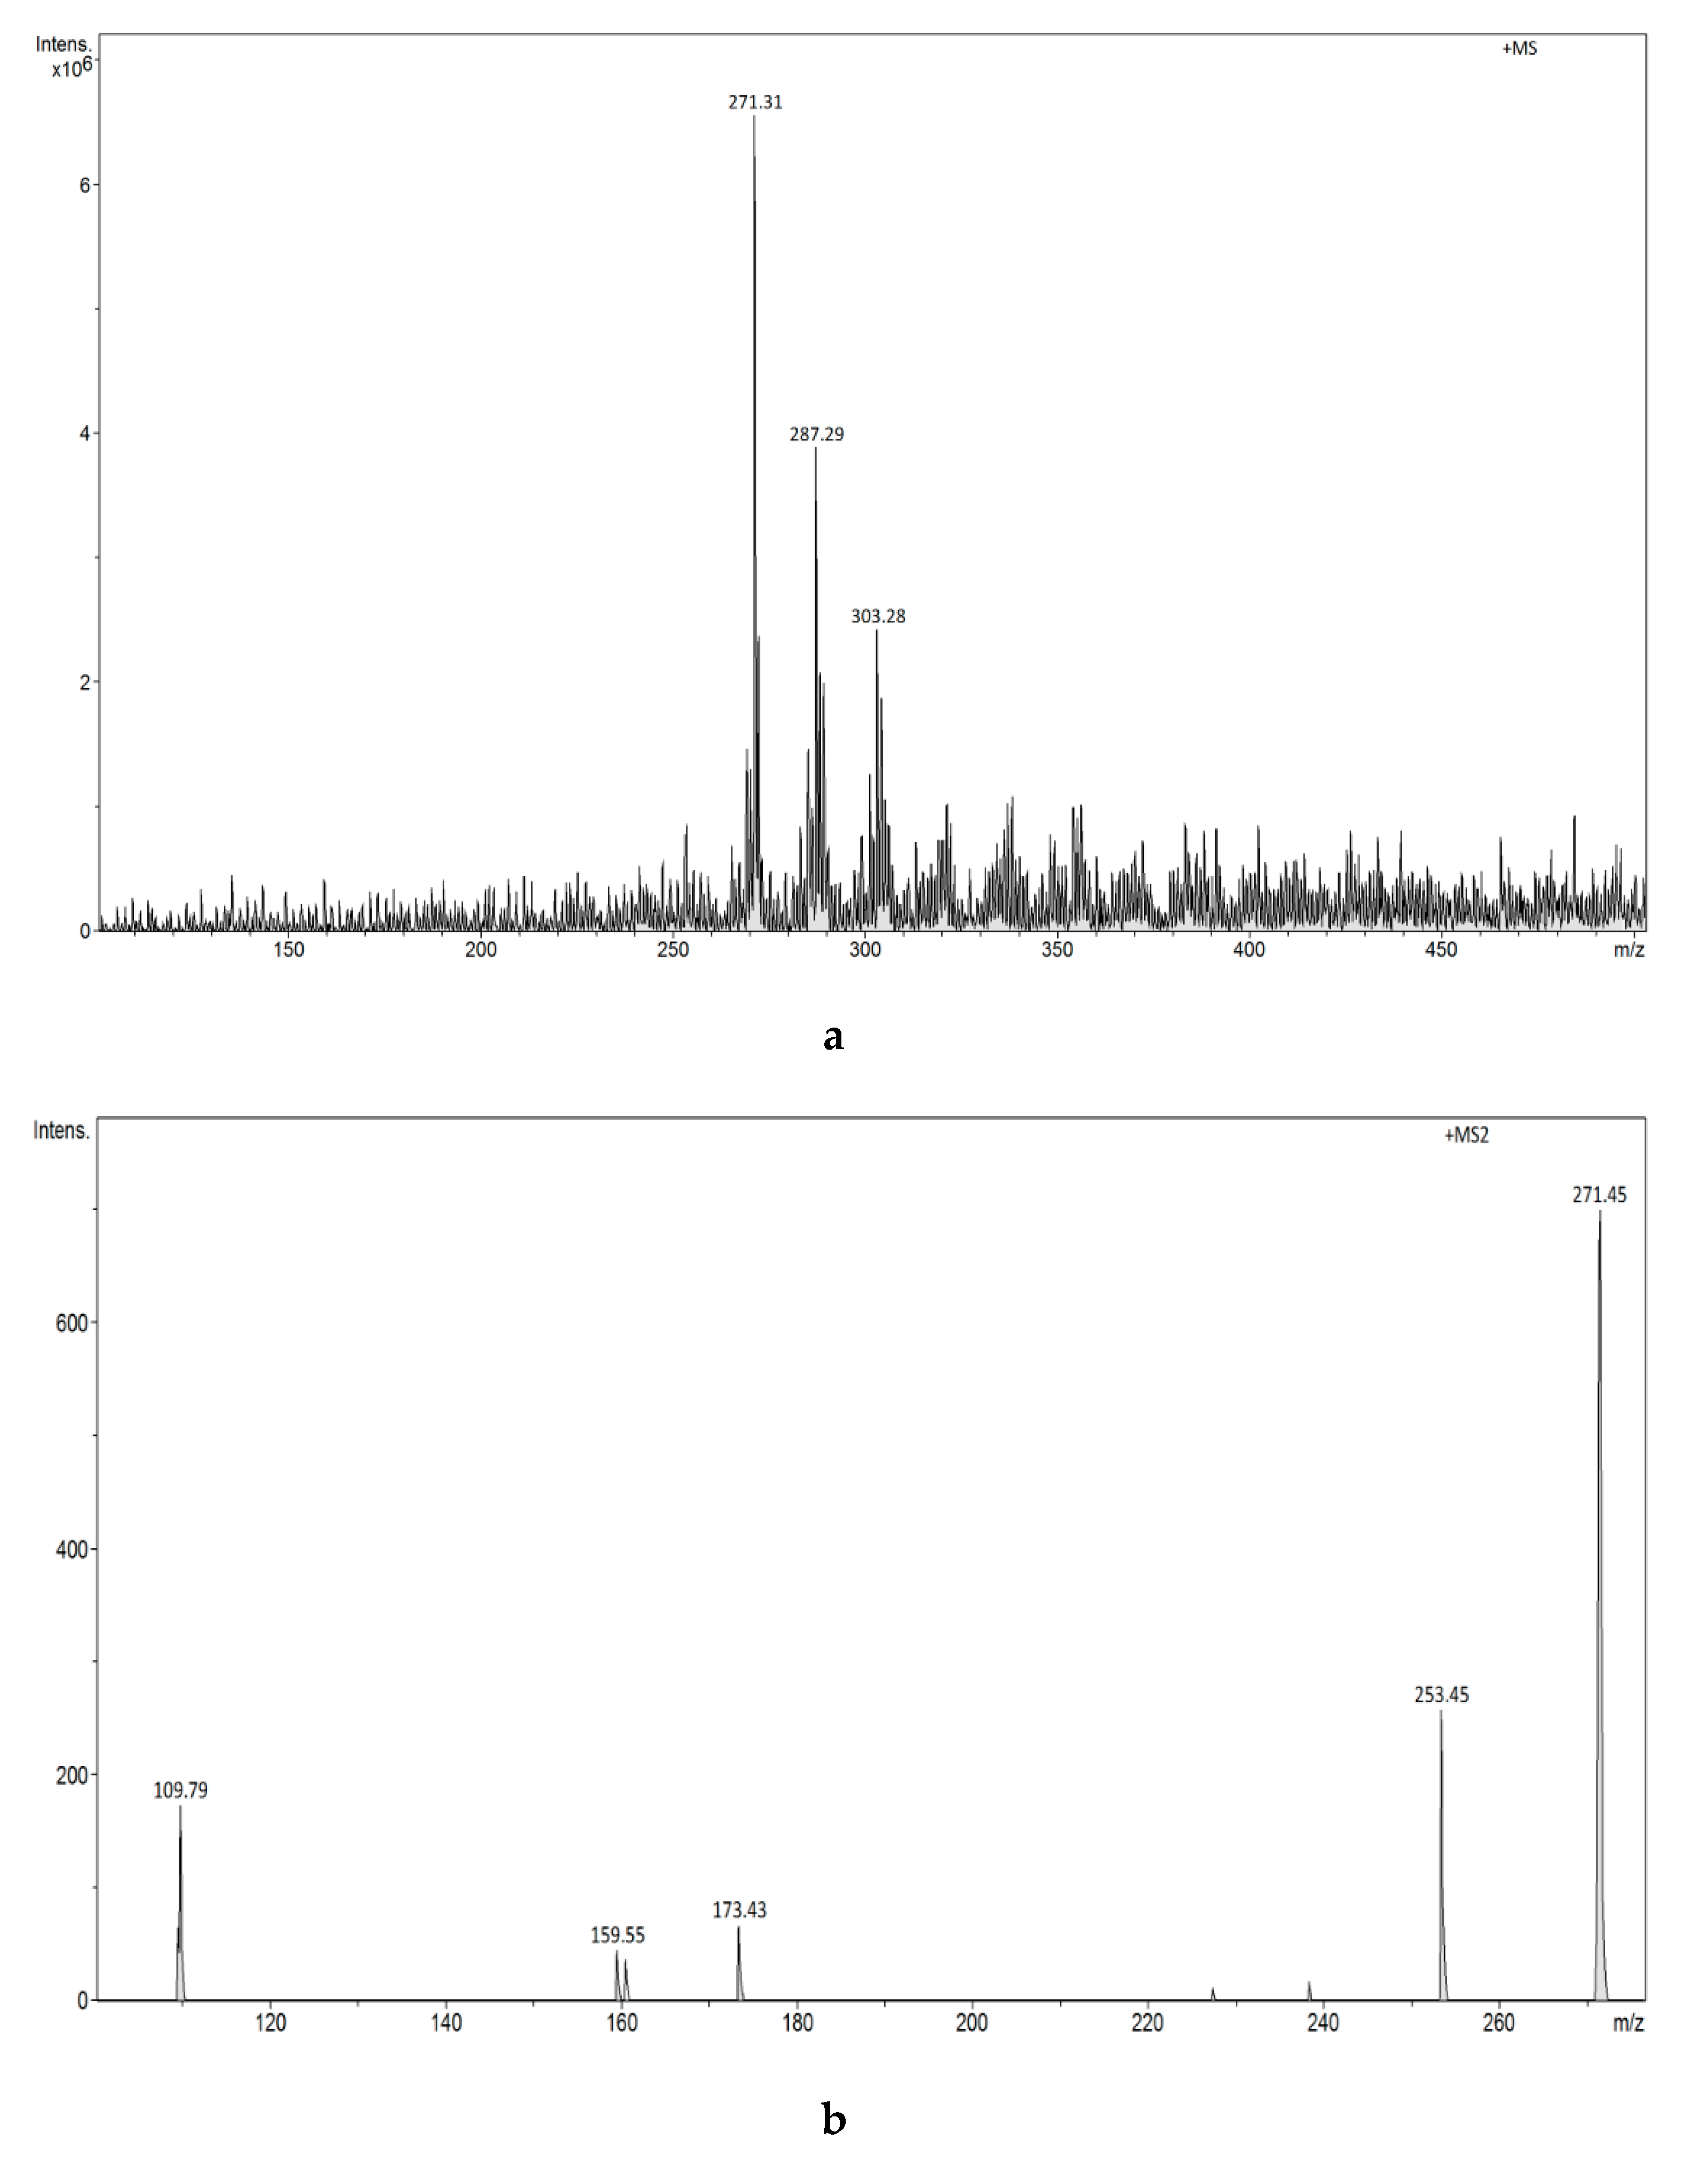
3.2.7. Analysis of Estrogens in an Aqueous Solution Using E1-/E2-Mag-MIP and FAPA-MS Technique
4. Conclusions
Supplementary Materials
Author Contributions
Funding
Conflicts of Interest
References
- De López Aida, M.J.; Barceló, D. Review of analytical methods for the determination of estrogens and progestogens in waste waters. Anal. Bioanal. Chem. 2001, 371, 437–447. [Google Scholar]
- Pichon, V.; Chapuis-Hugon, F. Role of molecularly imprinted polymers for selective determination of environmental pollutants-A review. Anal. Chim. Acta 2008, 622, 48–61. [Google Scholar] [CrossRef] [PubMed]
- Silva, C.P.; Otero, M.; Esteves, V. Processes for the elimination of estrogenic steroid hormones from water: A review. Environ. Pollut. 2012, 165, 38–58. [Google Scholar] [CrossRef] [PubMed]
- Jung, M.Y.; Seo, C.S.; Baek, S.E.; Lee, J.; Shin, M.S.; Kang, K.S.; Lee, S.; Yoo, J.E. Analysis and identification of active compounds from gami-soyosan toxic to MCF-7 human breast adenocarcinoma cells. Biomolecules 2019, 9, 272. [Google Scholar] [CrossRef] [PubMed]
- Xiao, X.Y.; McCalley, D.V.; McEvoy, J. Analysis of estrogens in river water and effluents using solid-phase extraction and gas chromatography-negative chemical ionisation mass spectrometry of the pentafluorobenzoyl derivatives. J. Chromatogr. A 2001, 923, 195–204. [Google Scholar] [CrossRef]
- Briciu, R.D.; Kot-Wasik, A.; Namiesnik, J. Analytical challenges and recent advances in the determination of estrogens in water environments. J. Chromatogr. Sci. 2009, 47, 127–139. [Google Scholar] [CrossRef]
- Česen, M.; Heath, E. Disk-based solid phase extraction for the determination of diclofenac and steroidal estrogens E1, E2 and EE2 listed in the WFD watch list by GC–MS. Sci. Total Environ. 2017, 590–591, 832–837. [Google Scholar]
- Adeel, M.; Song, X.; Wang, Y.; Francis, D.; Yang, Y. Environmental impact of estrogens on human, animal and plant life: A critical review. Environ. Int. 2017, 99, 107–119. [Google Scholar] [CrossRef]
- Wulff, G.; Sarhan, A. Über die Anwendung von enzymanalog gebauten Polymeren zur Racemattrennung. Angew. Chemie 1972, 84, 364. [Google Scholar] [CrossRef]
- Pereira, I.; Rodrigues, M.F.; Chaves, A.R.; Vaz, B.G. Molecularly imprinted polymer (MIP) membrane assisted direct spray ionization mass spectrometry for agrochemicals screening in foodstuffs. Talanta 2018, 178, 507–514. [Google Scholar] [CrossRef]
- Gadzala-Kopciuch, R.; Sadowski, R.; Piwonska, A.; Buszewski, B.A. Applications of Molecularly Imprinted Polymers for Isolation of Estrogens from Environmental Water Samples. Curr. Anal. Chem. 2015, 12, 315–323. [Google Scholar]
- Guć, M.; Schroeder, G. Application of molecularly imprinted polymers (MIP) and magnetic molecularly imprinted polymers (mag-MIP) to selective analysis of quercetin in flowing atmospheric-pressure afterglow mass spectrometry (FAPA-MS) and in electrospray ionization mass spectrom. Molecules 2019, 24, 2364. [Google Scholar]
- Mieloch, A.A.; Żurawek, M.; Giersig, M.; Rozwadowska, N.; Rybka, J.D. Bioevaluation of superparamagnetic iron oxide nanoparticles (SPIONs) functionalized with dihexadecyl phosphate (DHP). Sci. Rep. 2020, 10, 1–11. [Google Scholar] [CrossRef] [PubMed]
- Wang, X.; Wang, L.; He, X.; Zhang, Y.; Chen, L. A molecularly imprinted polymer-coated nanocomposite of magnetic nanoparticles for estrone recognition. Talanta 2009, 78, 327–332. [Google Scholar] [CrossRef] [PubMed]
- Lu, H.; Xu, S. Mesoporous structured estrone imprinted Fe3O4@SiO2@mSiO2 for highly sensitive and selective detection of estrogens from water samples by HPLC. Talanta 2015, 144, 303–311. [Google Scholar] [CrossRef]
- Han, Q.; Shen, X.; Zhu, W.; Zhu, C.; Zhou, X.; Jiang, H. Magnetic sensing film based on Fe3O4@Au-GSH molecularly imprinted polymers for the electrochemical detection of estradiol. Biosens. Bioelectron. 2016, 79, 180–186. [Google Scholar] [CrossRef]
- Xu, S.; Lu, H.; Chen, L.; Wang, X. Molecularly imprinted TiO2hybridized magnetic Fe3O4nanoparticles for selective photocatalytic degradation and removal of estrone. RSC Adv. 2014, 4, 45266–45274. [Google Scholar] [CrossRef]
- Xiao, L.; Zhang, Z.; Wu, C.; Han, L.; Zhang, H. Molecularly imprinted polymer grafted paper-based method for the detection of 17β-estradiol. Food Chem. 2017, 221, 82–86. [Google Scholar] [CrossRef]
- Wackerlig, J.; Schirhagl, R. Applications of Molecularly Imprinted Polymer Nanoparticles and Their Advances toward Industrial Use: A Review. Anal. Chem. 2016, 88, 250–261. [Google Scholar] [CrossRef]
- Gao, W.L.; Wu, L.S.; Zi, J.H.; Wu, B.; Li, Y.Z.; Song, Y.C.; Cai, D.Z. Measurement of serum estrogen and estrogen metabolites in pre- and postmenopausal women with osteoarthritis using high-performance liquid chromatography-electrospray ionization-tandem mass spectrometry. Brazilian J. Med. Biol. Res. 2015, 48, 146–153. [Google Scholar] [CrossRef][Green Version]
- Vanderford, B.J.; Pearson, R.A.; Rexing, D.J.; Snyder, S.A. Analysis of Endocrine Disruptors, Pharmaceuticals, and Personal Care Products in Water Using Liquid Chromatography/Tandem Mass Spectrometry. Anal. Chem. 2003, 75, 6265–6274. [Google Scholar] [CrossRef] [PubMed]
- Chun, S.; Lee, J.; Geyer, R.; White, D.C. Comparison of three extraction methods for 17β-estradiol in sand, bentonite, and organic-rich silt loam. J. Environ. Sci. Health Part B Pestic. Food Contam. Agric. Wastes 2005, 40, 731–740. [Google Scholar] [CrossRef] [PubMed]
- Kopperi, M.; Riekkola, M.L. Non-targeted evaluation of selectivity of water-compatible class selective adsorbents for the analysis of steroids in wastewater. Anal. Chim. Acta 2016, 920, 47–53. [Google Scholar] [CrossRef] [PubMed]
- Uzuriaga-Sánchez, R.J.; Khan, S.; Wong, A.; Picasso, G.; Pividori, M.I.; Sotomayor, M.D.P.T. Magnetically separable polymer (Mag-MIP) for selective analysis of biotin in food samples. Food Chem. 2016, 190, 460–467. [Google Scholar]
- Guć, M.; Reszke, E.; Cegłowski, M.; Schroeder, G. The Application of the Microwave Plasma Ionization Source in Ambient Mass Spectrometry. Plasma Chem. Plasma Process. 2019, 1–17. [Google Scholar]
- Guć, M.; Reszke, E.; Cegłowski, M.; Schroeder, G. Construction of Plasma Ion Sources to be Applied in Analysis of Small Organic Compounds Using Mass Spectrometry. Plasma Chem. Plasma Process. 2020, 40, 235–260. [Google Scholar]
- Smoluch, M.; Gierczyk, B.; Reszke, E.; Babij, M.; Gotszalk, T.; Schroeder, G.; Silberring, J. FAPA mass spectrometry of designer drugs. Talanta 2016, 146, 29–33. [Google Scholar] [CrossRef]
- Nikolaou, A.; Meric, S.; Fatta, D. Occurrence patterns of pharmaceuticals in water and wastewater environments. Anal. Bioanal. Chem. 2007, 387, 1225–1234. [Google Scholar] [CrossRef]
- Pedrouzo, M.; Borrull, F.; Pocurull, E.; Marcé, R.M. Presence of pharmaceuticals and hormones in waters from sewage treatment plants. Water. Air. Soil Pollut. 2011, 217, 267–281. [Google Scholar] [CrossRef]
- Vulliet, E.; Cren-Olivé, C.; Grenier-Loustalot, M.F. Occurrence of pharmaceuticals and hormones in drinking water treated from surface waters. Environ. Chem. Lett. 2011, 9, 103–114. [Google Scholar] [CrossRef]
- Furchgott, R.F.; Rosenkrantz, H.; Shorr, E. Infra-red absorption spectra of steroids; estrogens. J. Biol. Chem. 1946, 164, 621–630. [Google Scholar] [PubMed]
- Minaev, B.F.; Minaeva, V.A. Study of IR spectrum of the 17β-estradiol using quantum-chemical density functional theory. Biopolym. Cell 2006, 22, 363–374. [Google Scholar] [CrossRef][Green Version]
- Lee, S.H.; Doong, R.A. Adsorption and selective recognition of 17β-estradiol by molecularly imprinted polymers. J. Polym. Res. 2012, 19, 1–12. [Google Scholar] [CrossRef]


© 2020 by the authors. Licensee MDPI, Basel, Switzerland. This article is an open access article distributed under the terms and conditions of the Creative Commons Attribution (CC BY) license (http://creativecommons.org/licenses/by/4.0/).
Share and Cite
Guć, M.; Schroeder, G. Molecularly Imprinted Polymers and Magnetic Molecularly Imprinted Polymers for Selective Determination of Estrogens in Water by ESI-MS/FAPA-MS. Biomolecules 2020, 10, 672. https://doi.org/10.3390/biom10050672
Guć M, Schroeder G. Molecularly Imprinted Polymers and Magnetic Molecularly Imprinted Polymers for Selective Determination of Estrogens in Water by ESI-MS/FAPA-MS. Biomolecules. 2020; 10(5):672. https://doi.org/10.3390/biom10050672
Chicago/Turabian StyleGuć, Maria, and Grzegorz Schroeder. 2020. "Molecularly Imprinted Polymers and Magnetic Molecularly Imprinted Polymers for Selective Determination of Estrogens in Water by ESI-MS/FAPA-MS" Biomolecules 10, no. 5: 672. https://doi.org/10.3390/biom10050672
APA StyleGuć, M., & Schroeder, G. (2020). Molecularly Imprinted Polymers and Magnetic Molecularly Imprinted Polymers for Selective Determination of Estrogens in Water by ESI-MS/FAPA-MS. Biomolecules, 10(5), 672. https://doi.org/10.3390/biom10050672