Uric Acid Has Direct Proinflammatory Effects on Human Macrophages by Increasing Proinflammatory Mediators and Bacterial Phagocytosis Probably via URAT1


 , ,
, ,
Abstract
1. Introduction
2. Materials and Methods
2.1. Subjects
2.2. Monocyte Isolation and Macrophage Culture
2.3. Flow Cytometry Assays
2.4. Macrophage Phagocytic Activity
2.5. URAT1 Gene Expression by qPCR
2.6. Statistics
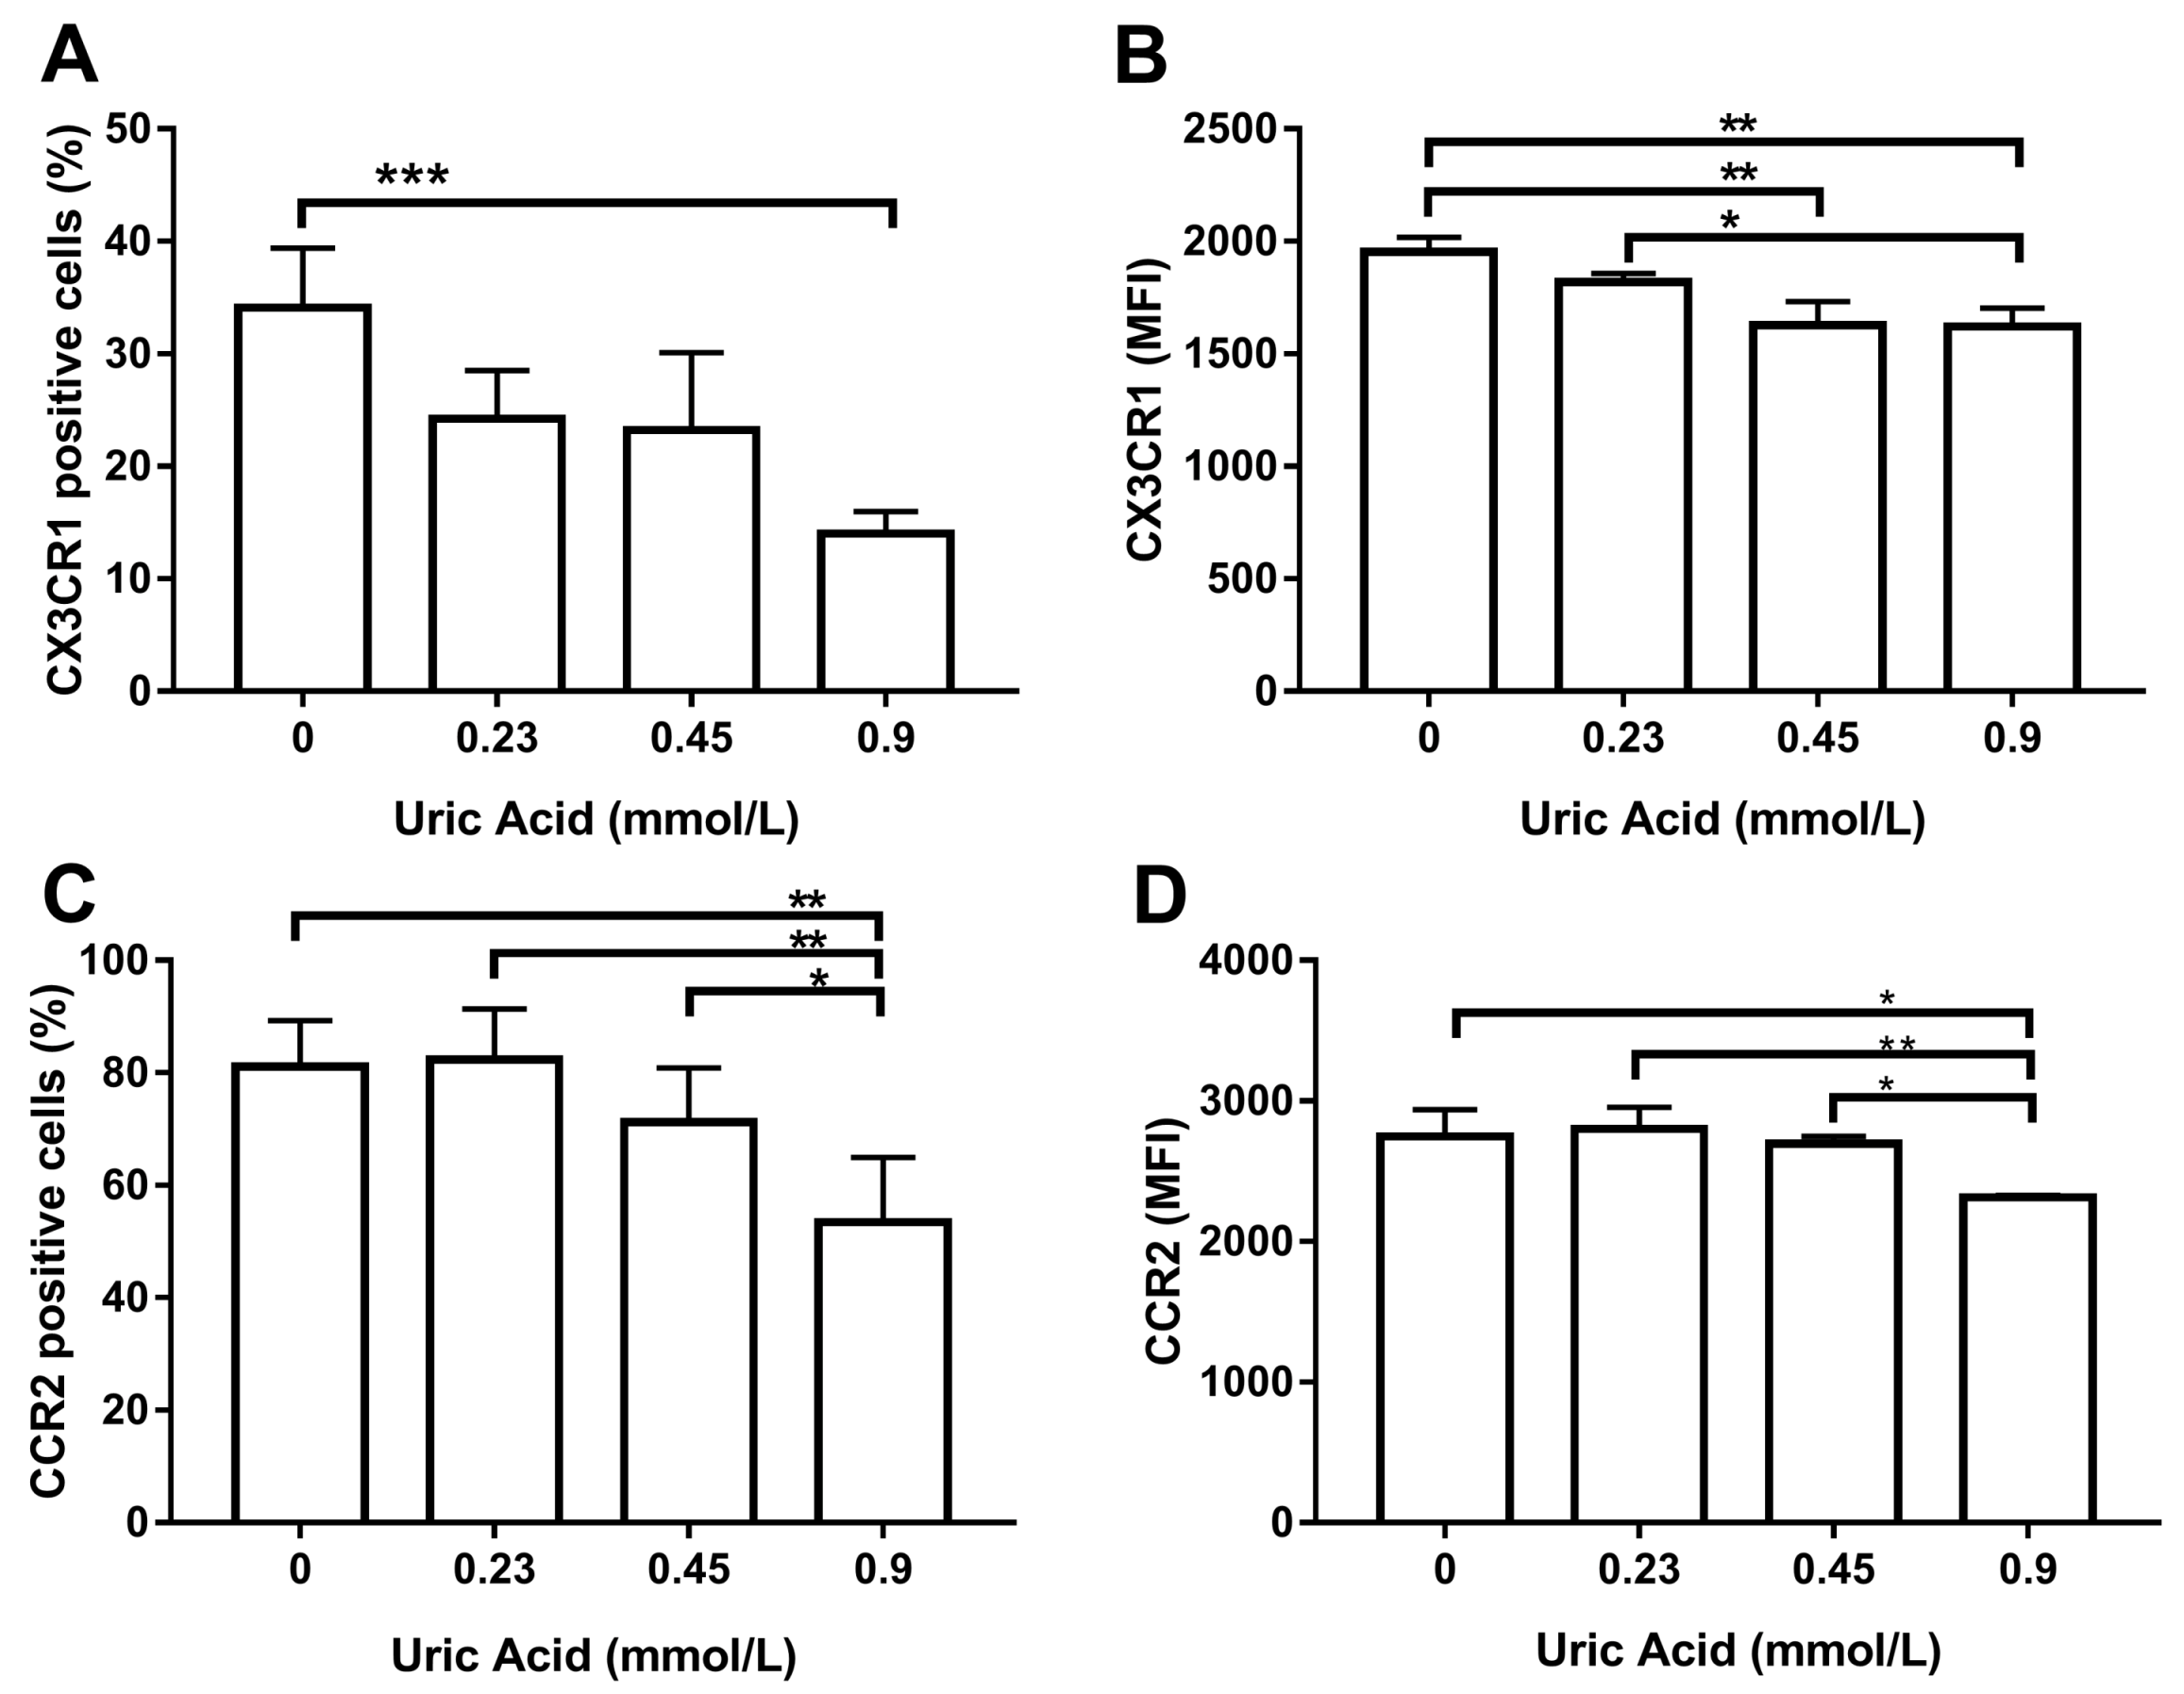
3. Results
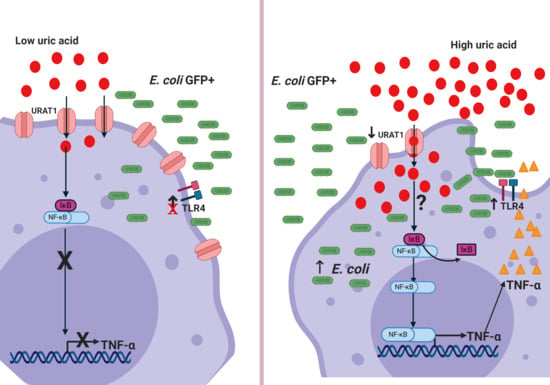
4. Discussion
5. Conclusions
Author Contributions
Funding
Acknowledgments
Conflicts of Interest
References
- Enomoto, A.; Kimura, H.; Chairoungdua, A.; Shigeta, Y.; Jutabha, P.; Cha, S.H.; Hosoyamada, M.; Takeda, M.; Sekine, T.; Igarashi, T.; et al. Molecular identification of a renal urate anion exchanger that regulates blood urate levels. Nature 2002, 417, 447–452. [Google Scholar] [CrossRef] [PubMed]
- Price, K.L.; Sautin, Y.Y.; Long, D.A.; Zhang, L.; Miyazaki, H.; Mu, W.; Endou, H.; Johnson, R.J. Human vascular smooth muscle cells express a urate transporter. J. Am. Soc. Nephrol. 2006, 17, 1791–1795. [Google Scholar] [CrossRef] [PubMed]
- Sautin, Y.Y.; Nakagawa, T.; Zharikov, S.; Johnson, R.J. Adverse effects of the classic antioxidant uric acid in adipocytes: NADPH oxidase-mediated oxidative/nitrosative stress. Am. J. Physiol. Cell Physiol. 2007, 293, C584–C596. [Google Scholar] [CrossRef] [PubMed]
- Sugihara, S.; Hisatome, I.; Kuwabara, M.; Niwa, K.; Maharani, N.; Kato, M.; Ogino, K.; Hamada, T.; Ninomiya, H.; Higashi, Y.; et al. Depletion of Uric Acid Due to SLC22A12 (URAT1) Loss-of-Function Mutation Causes Endothelial Dysfunction in Hypouricemia. Circ. J. 2015, 79, 1125–1132. [Google Scholar] [CrossRef]
- Zhang, B.; Duan, M.; Long, B.; Zhang, B.; Wang, D.; Zhang, Y.; Chen, J.; Huang, X.; Jiao, Y.; Zhu, L.; et al. Urate transport capacity of glucose transporter 9 and urate transporter 1 in cartilage chondrocytes. Mol. Med. Rep. 2019, 20, 1645–1654. [Google Scholar] [CrossRef]
- Bardin, T.; Richette, P. Definition of hyperuricemia and gouty conditions. Curr. Opin. Rheumatol. 2014, 26, 186–191. [Google Scholar] [CrossRef]
- Chen-Xu, M.; Yokose, C.; Rai, S.K.; Pillinger, M.H.; Choi, H.K. Contemporary Prevalence of Gout and Hyperuricemia in the United States and Decadal Trends: The National Health and Nutrition Examination Survey, 2007–2016. Arthritis Rheumatol. 2019, 71, 991–999. [Google Scholar] [CrossRef]
- Liu, Z.; Que, S.; Zhou, L.; Zheng, S. Dose-response Relationship of Serum Uric Acid with Metabolic Syndrome and Non-alcoholic Fatty Liver Disease Incidence: A Meta-analysis of Prospective Studies. Sci. Rep. 2015, 5, 14325. [Google Scholar] [CrossRef]
- Yu, T.Y.; Jee, J.H.; Bae, J.C.; Jin, S.M.; Baek, J.H.; Lee, M.K.; Kim, J.H. Serum uric acid: A strong and independent predictor of metabolic syndrome after adjusting for body composition. Metabolism 2016, 65, 432–440. [Google Scholar] [CrossRef]
- Lyngdoh, T.; Marques-Vidal, P.; Paccaud, F.; Preisig, M.; Waeber, G.; Bochud, M.; Vollenweider, P. Elevated serum uric acid is associated with high circulating inflammatory cytokines in the population-based Colaus study. PLoS ONE 2011, 6, e19901. [Google Scholar] [CrossRef]
- Wu, J.; Qiu, L.; Cheng, X.Q.; Xu, T.; Wu, W.; Zeng, X.J.; Ye, Y.C.; Guo, X.Z.; Cheng, Q.; Liu, Q.; et al. Hyperuricemia and clustering of cardiovascular risk factors in the Chinese adult population. Sci. Rep. 2017, 7, 5456. [Google Scholar] [CrossRef] [PubMed]
- Kushiyama, A.; Okubo, H.; Sakoda, H.; Kikuchi, T.; Fujishiro, M.; Sato, H.; Kushiyama, S.; Iwashita, M.; Nishimura, F.; Fukushima, T.; et al. Xanthine oxidoreductase is involved in macrophage foam cell formation and atherosclerosis development. Arterioscler. Thromb. Vasc. Biol. 2012, 32, 291–298. [Google Scholar] [CrossRef] [PubMed]
- Wynn, T.A.; Chawla, A.; Pollard, J.W. Macrophage biology in development, homeostasis and disease. Nature 2013, 496, 445–455. [Google Scholar] [CrossRef]
- Murray, P.J. Macrophage Polarization. Annu. Rev. Physiol 2017, 79, 541–566. [Google Scholar] [CrossRef]
- Martinez, F.O.; Gordon, S.; Locati, M.; Mantovani, A. Transcriptional profiling of the human monocyte-to-macrophage differentiation and polarization: New molecules and patterns of gene expression. J. Immunol. 2006, 177, 7303–7311. [Google Scholar] [CrossRef]
- Li, G.; Qiao, W.; Zhang, W.; Li, F.; Shi, J.; Dong, N. The shift of macrophages toward M1 phenotype promotes aortic valvular calcification. J. Thorac. Cardiovasc. Surg. 2017, 153, 1318–1327.e1. [Google Scholar] [CrossRef]
- Amsellem, V.; Abid, S.; Poupel, L.; Parpaleix, A.; Rodero, M.; Gary-Bobo, G.; Latiri, M.; Dubois-Rande, J.L.; Lipskaia, L.; Combadiere, C.; et al. Roles for the CX3CL1/CX3CR1 and CCL2/CCR2 Chemokine Systems in Hypoxic Pulmonary Hypertension. Am. J. Respir. Cell. Mol. Biol. 2017, 56, 597–608. [Google Scholar] [CrossRef]
- Deci, M.B.; Ferguson, S.W.; Scatigno, S.L.; Nguyen, J. Modulating Macrophage Polarization through CCR2 Inhibition and Multivalent Engagement. Mol. Pharm. 2018, 15, 2721–2731. [Google Scholar] [CrossRef]
- Zhang, M.; Hutter, G.; Kahn, S.A.; Azad, T.D.; Gholamin, S.; Xu, C.Y.; Liu, J.; Achrol, A.S.; Richard, C.; Sommerkamp, P.; et al. Anti-CD47 Treatment Stimulates Phagocytosis of Glioblastoma by M1 and M2 Polarized Macrophages and Promotes M1 Polarized Macrophages In Vivo. PLoS ONE 2016, 11, e0153550. [Google Scholar] [CrossRef]
- Lam, R.S.; O’Brien-Simpson, N.M.; Holden, J.A.; Lenzo, J.C.; Fong, S.B.; Reynolds, E.C. Unprimed, M1 and M2 Macrophages Differentially Interact with Porphyromonas gingivalis. PLoS ONE 2016, 11, e0158629. [Google Scholar] [CrossRef]
- Gille, C.; Spring, B.; Tewes, L.; Poets, C.F.; Orlikowsky, T. A new method to quantify phagocytosis and intracellular degradation using green fluorescent protein-labeled Escherichia coli: Comparison of cord blood macrophages and peripheral blood macrophages of healthy adults. Cytom. A 2006, 69, 152–154. [Google Scholar] [CrossRef] [PubMed]
- Haryono, A.; Nugrahaningsih, D.A.A.; Sari, D.C.R.; Romi, M.M.; Arfian, N. Reduction of Serum Uric Acid Associated with Attenuation of Renal Injury, Inflammation and Macrophages M1/M2 Ratio in Hyperuricemic Mice Model. Kobe. J. Med. Sci. 2018, 64, E107–E114. [Google Scholar] [PubMed]
- Lu, W.; Xu, Y.; Shao, X.; Gao, F.; Li, Y.; Hu, J.; Zuo, Z.; Shao, X.; Zhou, L.; Zhao, Y.; et al. Uric Acid Produces an Inflammatory Response through Activation of NF-kappaB in the Hypothalamus: Implications for the Pathogenesis of Metabolic Disorders. Sci. Rep. 2015, 5, 12144. [Google Scholar] [CrossRef] [PubMed]
- McGeough, M.D.; Wree, A.; Inzaugarat, M.E.; Haimovich, A.; Johnson, C.D.; Pena, C.A.; Goldbach-Mansky, R.; Broderick, L.; Feldstein, A.E.; Hoffman, H.M. TNF regulates transcription of NLRP3 inflammasome components and inflammatory molecules in cryopyrinopathies. J. Clin. Investig. 2017, 127, 4488–4497. [Google Scholar] [CrossRef]
- Patel, H.J.; Patel, B.M. TNF-alpha and cancer cachexia: Molecular insights and clinical implications. Life Sci. 2017, 170, 56–63. [Google Scholar] [CrossRef]
- Kaplanov, I.; Carmi, Y.; Kornetsky, R.; Shemesh, A.; Shurin, G.V.; Shurin, M.R.; Dinarello, C.A.; Voronov, E.; Apte, R.N. Blocking IL-1beta reverses the immunosuppression in mouse breast cancer and synergizes with anti-PD-1 for tumor abrogation. Proc. Natl. Acad. Sci. USA 2019, 116, 1361–1369. [Google Scholar] [CrossRef]
- Peracoli, M.T.; Bannwart, C.F.; Cristofalo, R.; Borges, V.T.; Costa, R.A.; Witkin, S.S.; Peracoli, J.C. Increased reactive oxygen species and tumor necrosis factor-alpha production by monocytes are associated with elevated levels of uric acid in pre-eclamptic women. Am. J. Reprod. Immunol. 2011, 66, 460–467. [Google Scholar] [CrossRef]
- Tang, L.; Xu, Y.; Wei, Y.; He, X. Uric acid induces the expression of TNFalpha via the ROSMAPKNFkappaB signaling pathway in rat vascular smooth muscle cells. Mol. Med. Rep. 2017, 16, 6928–6933. [Google Scholar] [CrossRef]
- Lin, X.; Kong, J.; Wu, Q.; Yang, Y.; Ji, P. Effect of TLR4/MyD88 signaling pathway on expression of IL-1beta and TNF-alpha in synovial fibroblasts from temporomandibular joint exposed to lipopolysaccharide. Mediat. Inflamm. 2015, 2015, 329405. [Google Scholar] [CrossRef]
- Grebe, A.; Hoss, F.; Latz, E. NLRP3 Inflammasome and the IL-1 Pathway in Atherosclerosis. Circ. Res. 2018, 122, 1722–1740. [Google Scholar] [CrossRef]
- He, Y.; Franchi, L.; Nunez, G. TLR agonists stimulate Nlrp3-dependent IL-1beta production independently of the purinergic P2X7 receptor in dendritic cells and in vivo. J. Immunol. 2013, 190, 334–339. [Google Scholar] [CrossRef] [PubMed]
- Rocha, D.M.; Caldas, A.P.; Oliveira, L.L.; Bressan, J.; Hermsdorff, H.H. Saturated fatty acids trigger TLR4-mediated inflammatory response. Atherosclerosis 2016, 244, 211–215. [Google Scholar] [CrossRef] [PubMed]
- Park, B.S.; Lee, J.O. Recognition of lipopolysaccharide pattern by TLR4 complexes. Exp. Mol. Med. 2013, 45, e66. [Google Scholar] [CrossRef] [PubMed]
- Harada, K.; Ohira, S.; Isse, K.; Ozaki, S.; Zen, Y.; Sato, Y.; Nakanuma, Y. Lipopolysaccharide activates nuclear factor-kappaB through toll-like receptors and related molecules in cultured biliary epithelial cells. Lab. Investig. 2003, 83, 1657–1667. [Google Scholar] [CrossRef]
- Rasheed, H.; McKinney, C.; Stamp, L.K.; Dalbeth, N.; Topless, R.K.; Day, R.; Kannangara, D.; Williams, K.; Smith, M.; Janssen, M.; et al. The Toll-Like Receptor 4 (TLR4) Variant rs2149356 and Risk of Gout in European and Polynesian Sample Sets. PLoS ONE 2016, 11, e0147939. [Google Scholar] [CrossRef]
- Zhang, J.; Diao, B.; Lin, X.; Xu, J.; Tang, F. TLR2 and TLR4 mediate an activation of adipose tissue renin-angiotensin system induced by uric acid. Biochimie 2019, 162, 125–133. [Google Scholar] [CrossRef]
- Arnold, I.C.; Mathisen, S.; Schulthess, J.; Danne, C.; Hegazy, A.N.; Powrie, F. CD11c(+) monocyte/macrophages promote chronic Helicobacter hepaticus-induced intestinal inflammation through the production of IL-23. Mucosal Immunol. 2016, 9, 352–363. [Google Scholar] [CrossRef]
- Torres-Castro, I.; Arroyo-Camarena, U.D.; Martinez-Reyes, C.P.; Gomez-Arauz, A.Y.; Duenas-Andrade, Y.; Hernandez-Ruiz, J.; Bejar, Y.L.; Zaga-Clavellina, V.; Morales-Montor, J.; Terrazas, L.I.; et al. Human monocytes and macrophages undergo M1-type inflammatory polarization in response to high levels of glucose. Immunol. Lett. 2016, 176, 81–89. [Google Scholar] [CrossRef]
- Nawaz, A.; Aminuddin, A.; Kado, T.; Takikawa, A.; Yamamoto, S.; Tsuneyama, K.; Igarashi, Y.; Ikutani, M.; Nishida, Y.; Nagai, Y.; et al. CD206(+) M2-like macrophages regulate systemic glucose metabolism by inhibiting proliferation of adipocyte progenitors. Nat. Commun. 2017, 8, 286. [Google Scholar] [CrossRef]
- Kool, M.; Soullie, T.; van Nimwegen, M.; Willart, M.A.; Muskens, F.; Jung, S.; Hoogsteden, H.C.; Hammad, H.; Lambrecht, B.N. Alum adjuvant boosts adaptive immunity by inducing uric acid and activating inflammatory dendritic cells. J. Exp. Med. 2008, 205, 869–882. [Google Scholar] [CrossRef]
- Jeong, J.H.; Jung, J.H.; Lee, J.S.; Oh, J.S.; Kim, Y.G.; Lee, C.K.; Yoo, B.; Hong, S. Prominent Inflammatory Features of Monocytes/Macrophages in Acute Calcium Pyrophosphate Crystal Arthritis: A Comparison with Acute Gouty Arthritis. Immune Netw. 2019, 19, e21. [Google Scholar] [CrossRef] [PubMed]
- Bjorkander, S.; Heidari-Hamedani, G.; Bremme, K.; Gunnarsson, I.; Holmlund, U. Peripheral monocyte expression of the chemokine receptors CCR2, CCR5 and CXCR3 is altered at parturition in healthy women and in women with systemic lupus erythematosus. Scand. J. Immunol. 2013, 77, 200–212. [Google Scholar] [CrossRef]
- Lee, M.; Lee, Y.; Song, J.; Lee, J.; Chang, S.Y. Tissue-specific Role of CX3CR1 Expressing Immune Cells and Their Relationships with Human Disease. Immune Netw. 2018, 18, e5. [Google Scholar] [CrossRef]
- Pachot, A.; Cazalis, M.A.; Venet, F.; Turrel, F.; Faudot, C.; Voirin, N.; Diasparra, J.; Bourgoin, N.; Poitevin, F.; Mougin, B.; et al. Decreased expression of the fractalkine receptor CX3CR1 on circulating monocytes as new feature of sepsis-induced immunosuppression. J. Immunol. 2008, 180, 6421–6429. [Google Scholar] [CrossRef] [PubMed]
- Zhou, Y.; Yang, Y.; Warr, G.; Bravo, R. LPS down-regulates the expression of chemokine receptor CCR2 in mice and abolishes macrophage infiltration in acute inflammation. J. Leukoc. Biol. 1999, 65, 265–269. [Google Scholar] [CrossRef] [PubMed]
- Heesen, M.; Renckens, R.; de Vos, A.F.; Kunz, D.; van der Poll, T. Human endotoxemia induces down-regulation of monocyte CC chemokine receptor 2. Clin. Vaccine. Immunol. 2006, 13, 156–159. [Google Scholar] [CrossRef]
- Salahudeen, M.S.; Nishtala, P.S. An overview of pharmacodynamic modelling, ligand-binding approach and its application in clinical practice. Saudi. Pharm. J. 2017, 25, 165–175. [Google Scholar] [CrossRef]
- Auerbach, A. Dose-Response Analysis When There Is a Correlation between Affinity and Efficacy. Mol. Pharmacol. 2016, 89, 297–302. [Google Scholar] [CrossRef]
- Jia, L.; Xing, J.; Ding, Y.; Shen, Y.; Shi, X.; Ren, W.; Wan, M.; Guo, J.; Zheng, S.; Liu, Y.; et al. Hyperuricemia causes pancreatic beta-cell death and dysfunction through NF-kappaB signaling pathway. PLoS ONE 2013, 8, e78284. [Google Scholar] [CrossRef]
- Tan, P.K.; Ostertag, T.M.; Miner, J.N. Mechanism of high affinity inhibition of the human urate transporter URAT1. Sci. Rep. 2016, 6, 34995. [Google Scholar] [CrossRef]
- Liu-Bryan, R.; Lioté, F. Monosodium urate and calcium pyrophosphate dihydrate (CPPD) crystals, inflammation, and cellular signaling. Jt. Bone Spine 2005, 72, 295–302. [Google Scholar] [CrossRef]


© 2020 by the authors. Licensee MDPI, Basel, Switzerland. This article is an open access article distributed under the terms and conditions of the Creative Commons Attribution (CC BY) license (http://creativecommons.org/licenses/by/4.0/).
Share and Cite
Martínez-Reyes, C.P.; Manjarrez-Reyna, A.N.; Méndez-García, L.A.; Aguayo-Guerrero, J.A.; Aguirre-Sierra, B.; Villalobos-Molina, R.; López-Vidal, Y.; Bobadilla, K.; Escobedo, G. Uric Acid Has Direct Proinflammatory Effects on Human Macrophages by Increasing Proinflammatory Mediators and Bacterial Phagocytosis Probably via URAT1. Biomolecules 2020, 10, 576. https://doi.org/10.3390/biom10040576
Martínez-Reyes CP, Manjarrez-Reyna AN, Méndez-García LA, Aguayo-Guerrero JA, Aguirre-Sierra B, Villalobos-Molina R, López-Vidal Y, Bobadilla K, Escobedo G. Uric Acid Has Direct Proinflammatory Effects on Human Macrophages by Increasing Proinflammatory Mediators and Bacterial Phagocytosis Probably via URAT1. Biomolecules. 2020; 10(4):576. https://doi.org/10.3390/biom10040576
Chicago/Turabian StyleMartínez-Reyes, Camilo P., Aarón N. Manjarrez-Reyna, Lucia A. Méndez-García, José A. Aguayo-Guerrero, Beatriz Aguirre-Sierra, Rafael Villalobos-Molina, Yolanda López-Vidal, Karen Bobadilla, and Galileo Escobedo. 2020. "Uric Acid Has Direct Proinflammatory Effects on Human Macrophages by Increasing Proinflammatory Mediators and Bacterial Phagocytosis Probably via URAT1" Biomolecules 10, no. 4: 576. https://doi.org/10.3390/biom10040576
APA StyleMartínez-Reyes, C. P., Manjarrez-Reyna, A. N., Méndez-García, L. A., Aguayo-Guerrero, J. A., Aguirre-Sierra, B., Villalobos-Molina, R., López-Vidal, Y., Bobadilla, K., & Escobedo, G. (2020). Uric Acid Has Direct Proinflammatory Effects on Human Macrophages by Increasing Proinflammatory Mediators and Bacterial Phagocytosis Probably via URAT1. Biomolecules, 10(4), 576. https://doi.org/10.3390/biom10040576