Figure 1.
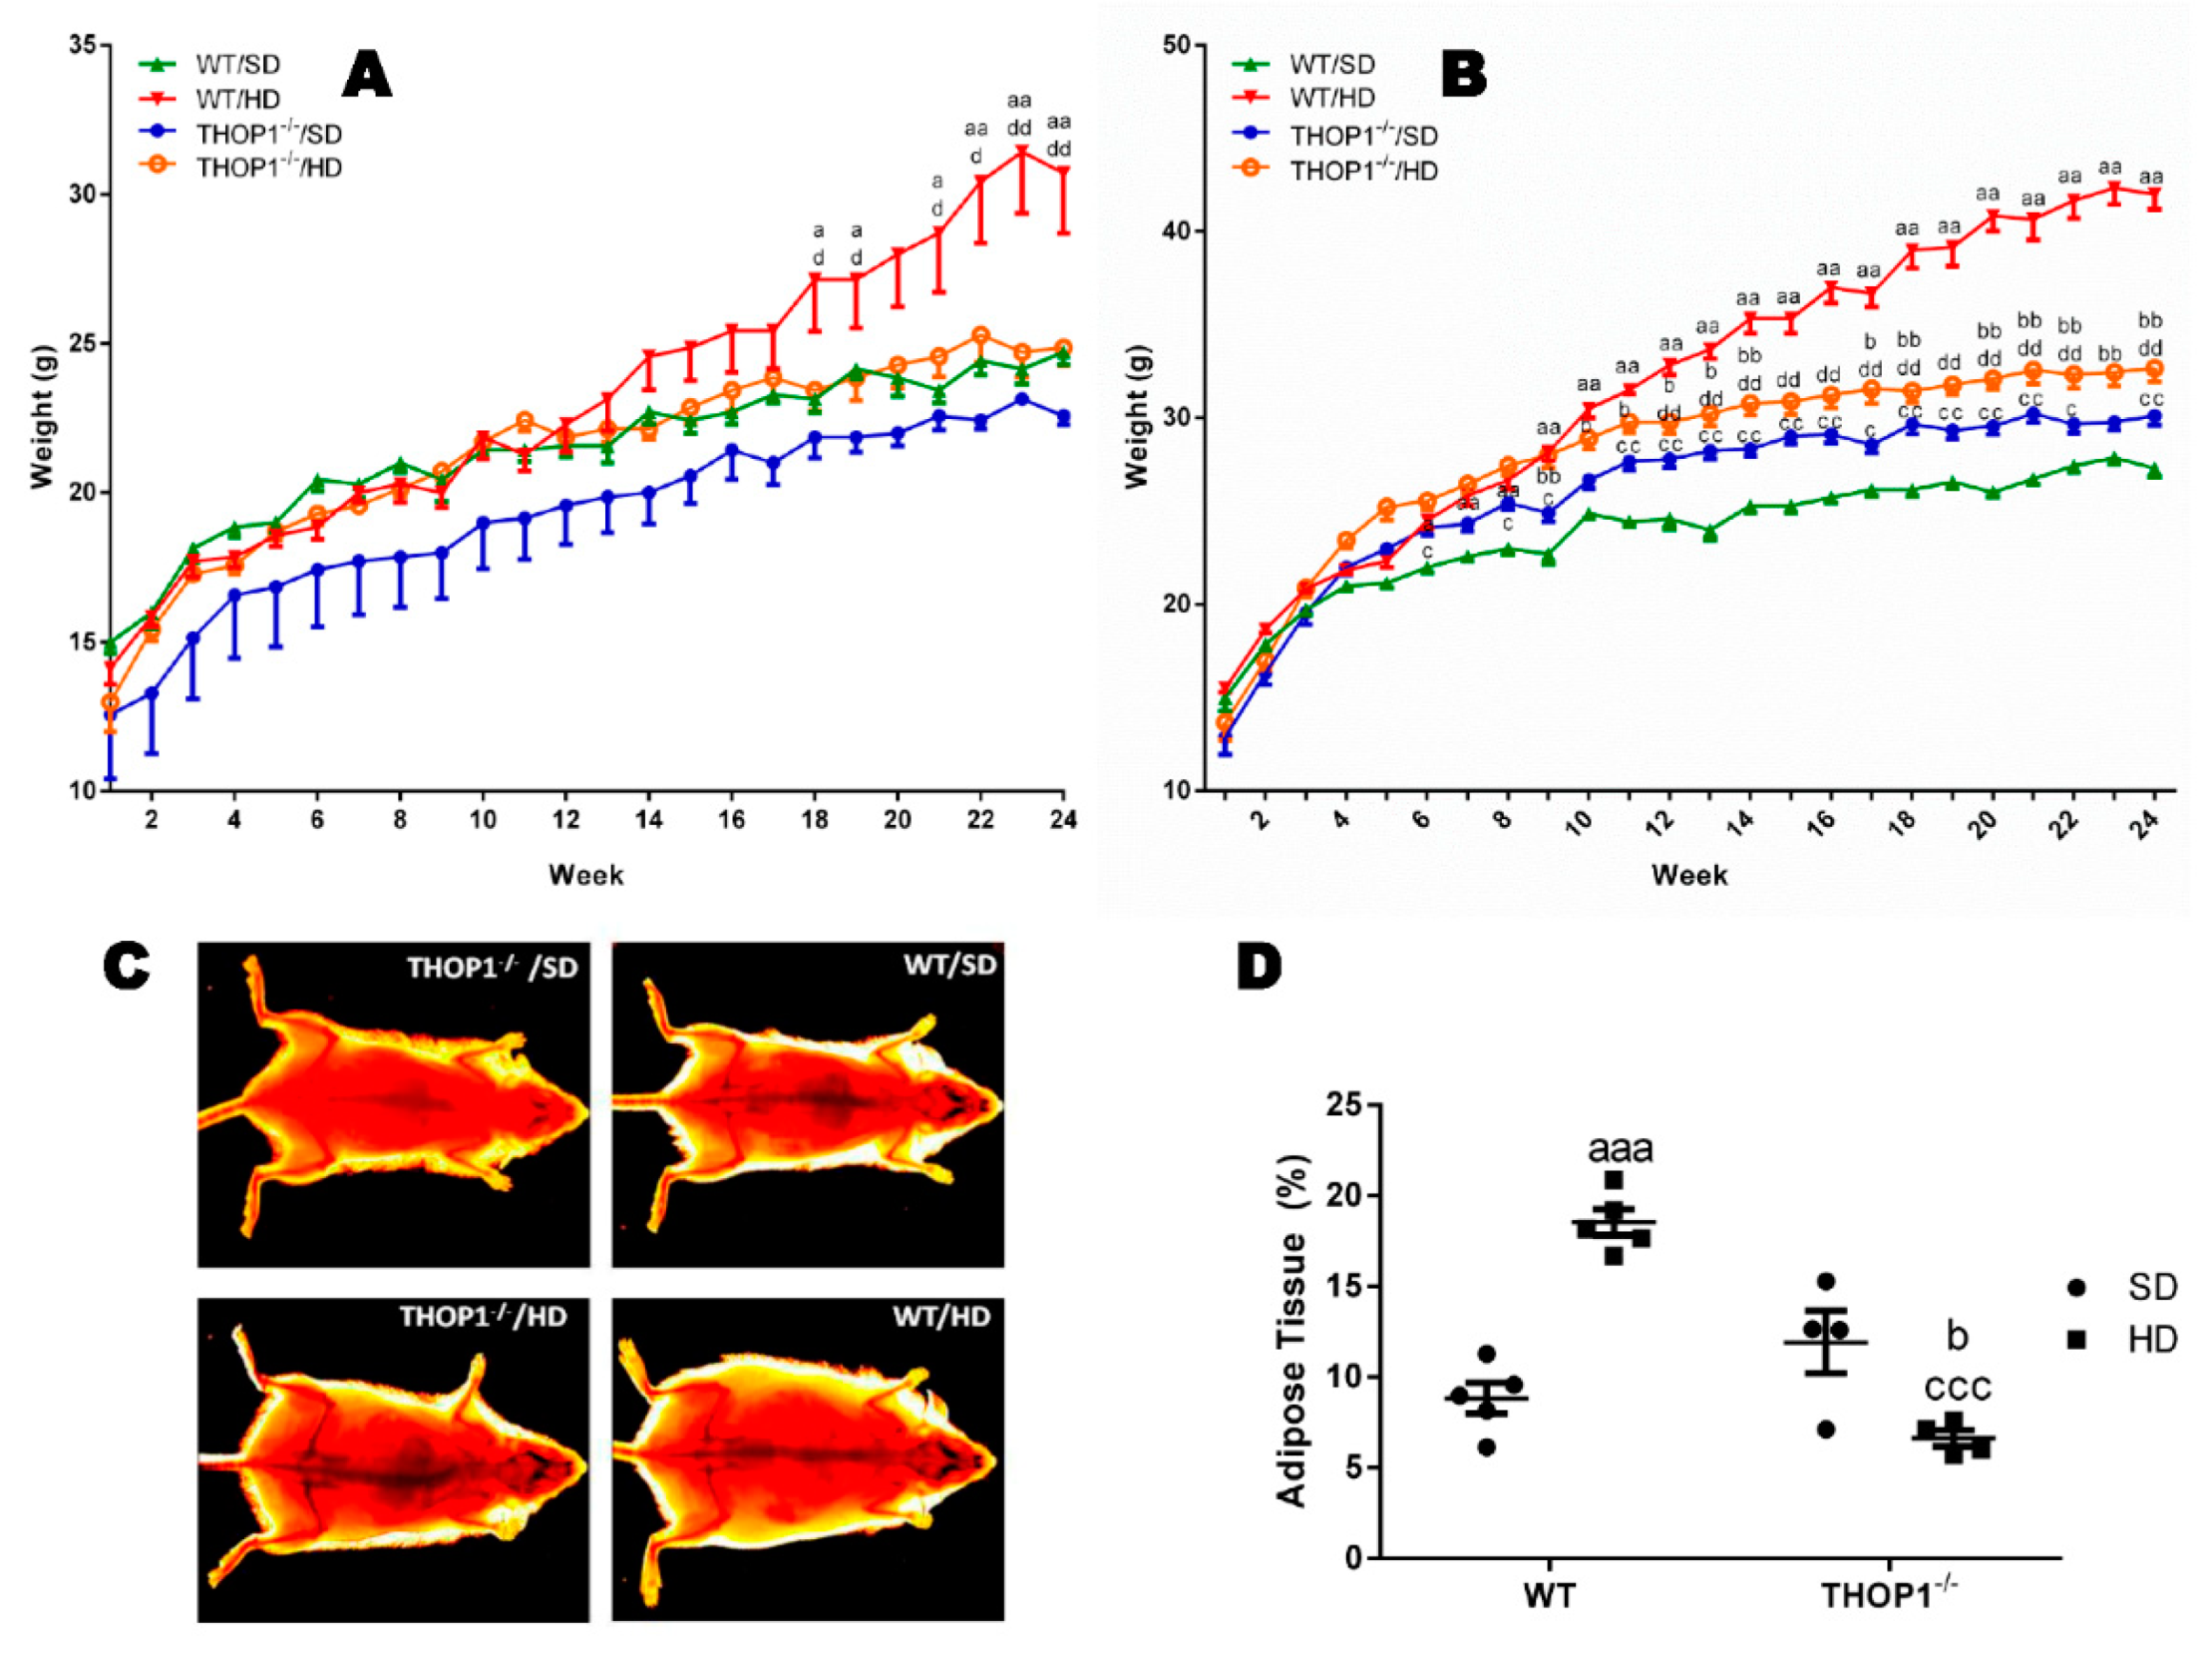
Weight and adipose tissue gain of animals during the 24 weeks of the diets. (A) females; (B–D) males. (A,B) show that wild-type (WT) animals fed a hyperlipidic diet (HD) began to weigh more than THOP1−/− mice after 18 (females) or 12 (males) weeks, depending on gender. After 24 weeks, the adipose tissue (fat) content was observed by X-ray density images (C,D). Results are expressed as mean ± standard error of the mean (SEM). Statistical analyses were conducted using two-way ANOVA followed by Tukey’s test (A,B) or Student’s unpaired t-test (D). One letter, p ≤ 0.05; two letters, p ≤ 0.01; three letters p ≤ 0.001. a, WT standard diet (SD) vs. WT/HD; b, THOP1−/−/SD vs. THOP1−/−/HD; c, WT/SD vs. THOP1−/−/SD; d, WT/HD vs. THOP1−/−/HD (n = 5–9).
Figure 1.
Weight and adipose tissue gain of animals during the 24 weeks of the diets. (A) females; (B–D) males. (A,B) show that wild-type (WT) animals fed a hyperlipidic diet (HD) began to weigh more than THOP1−/− mice after 18 (females) or 12 (males) weeks, depending on gender. After 24 weeks, the adipose tissue (fat) content was observed by X-ray density images (C,D). Results are expressed as mean ± standard error of the mean (SEM). Statistical analyses were conducted using two-way ANOVA followed by Tukey’s test (A,B) or Student’s unpaired t-test (D). One letter, p ≤ 0.05; two letters, p ≤ 0.01; three letters p ≤ 0.001. a, WT standard diet (SD) vs. WT/HD; b, THOP1−/−/SD vs. THOP1−/−/HD; c, WT/SD vs. THOP1−/−/SD; d, WT/HD vs. THOP1−/−/HD (n = 5–9).
Figure 2.
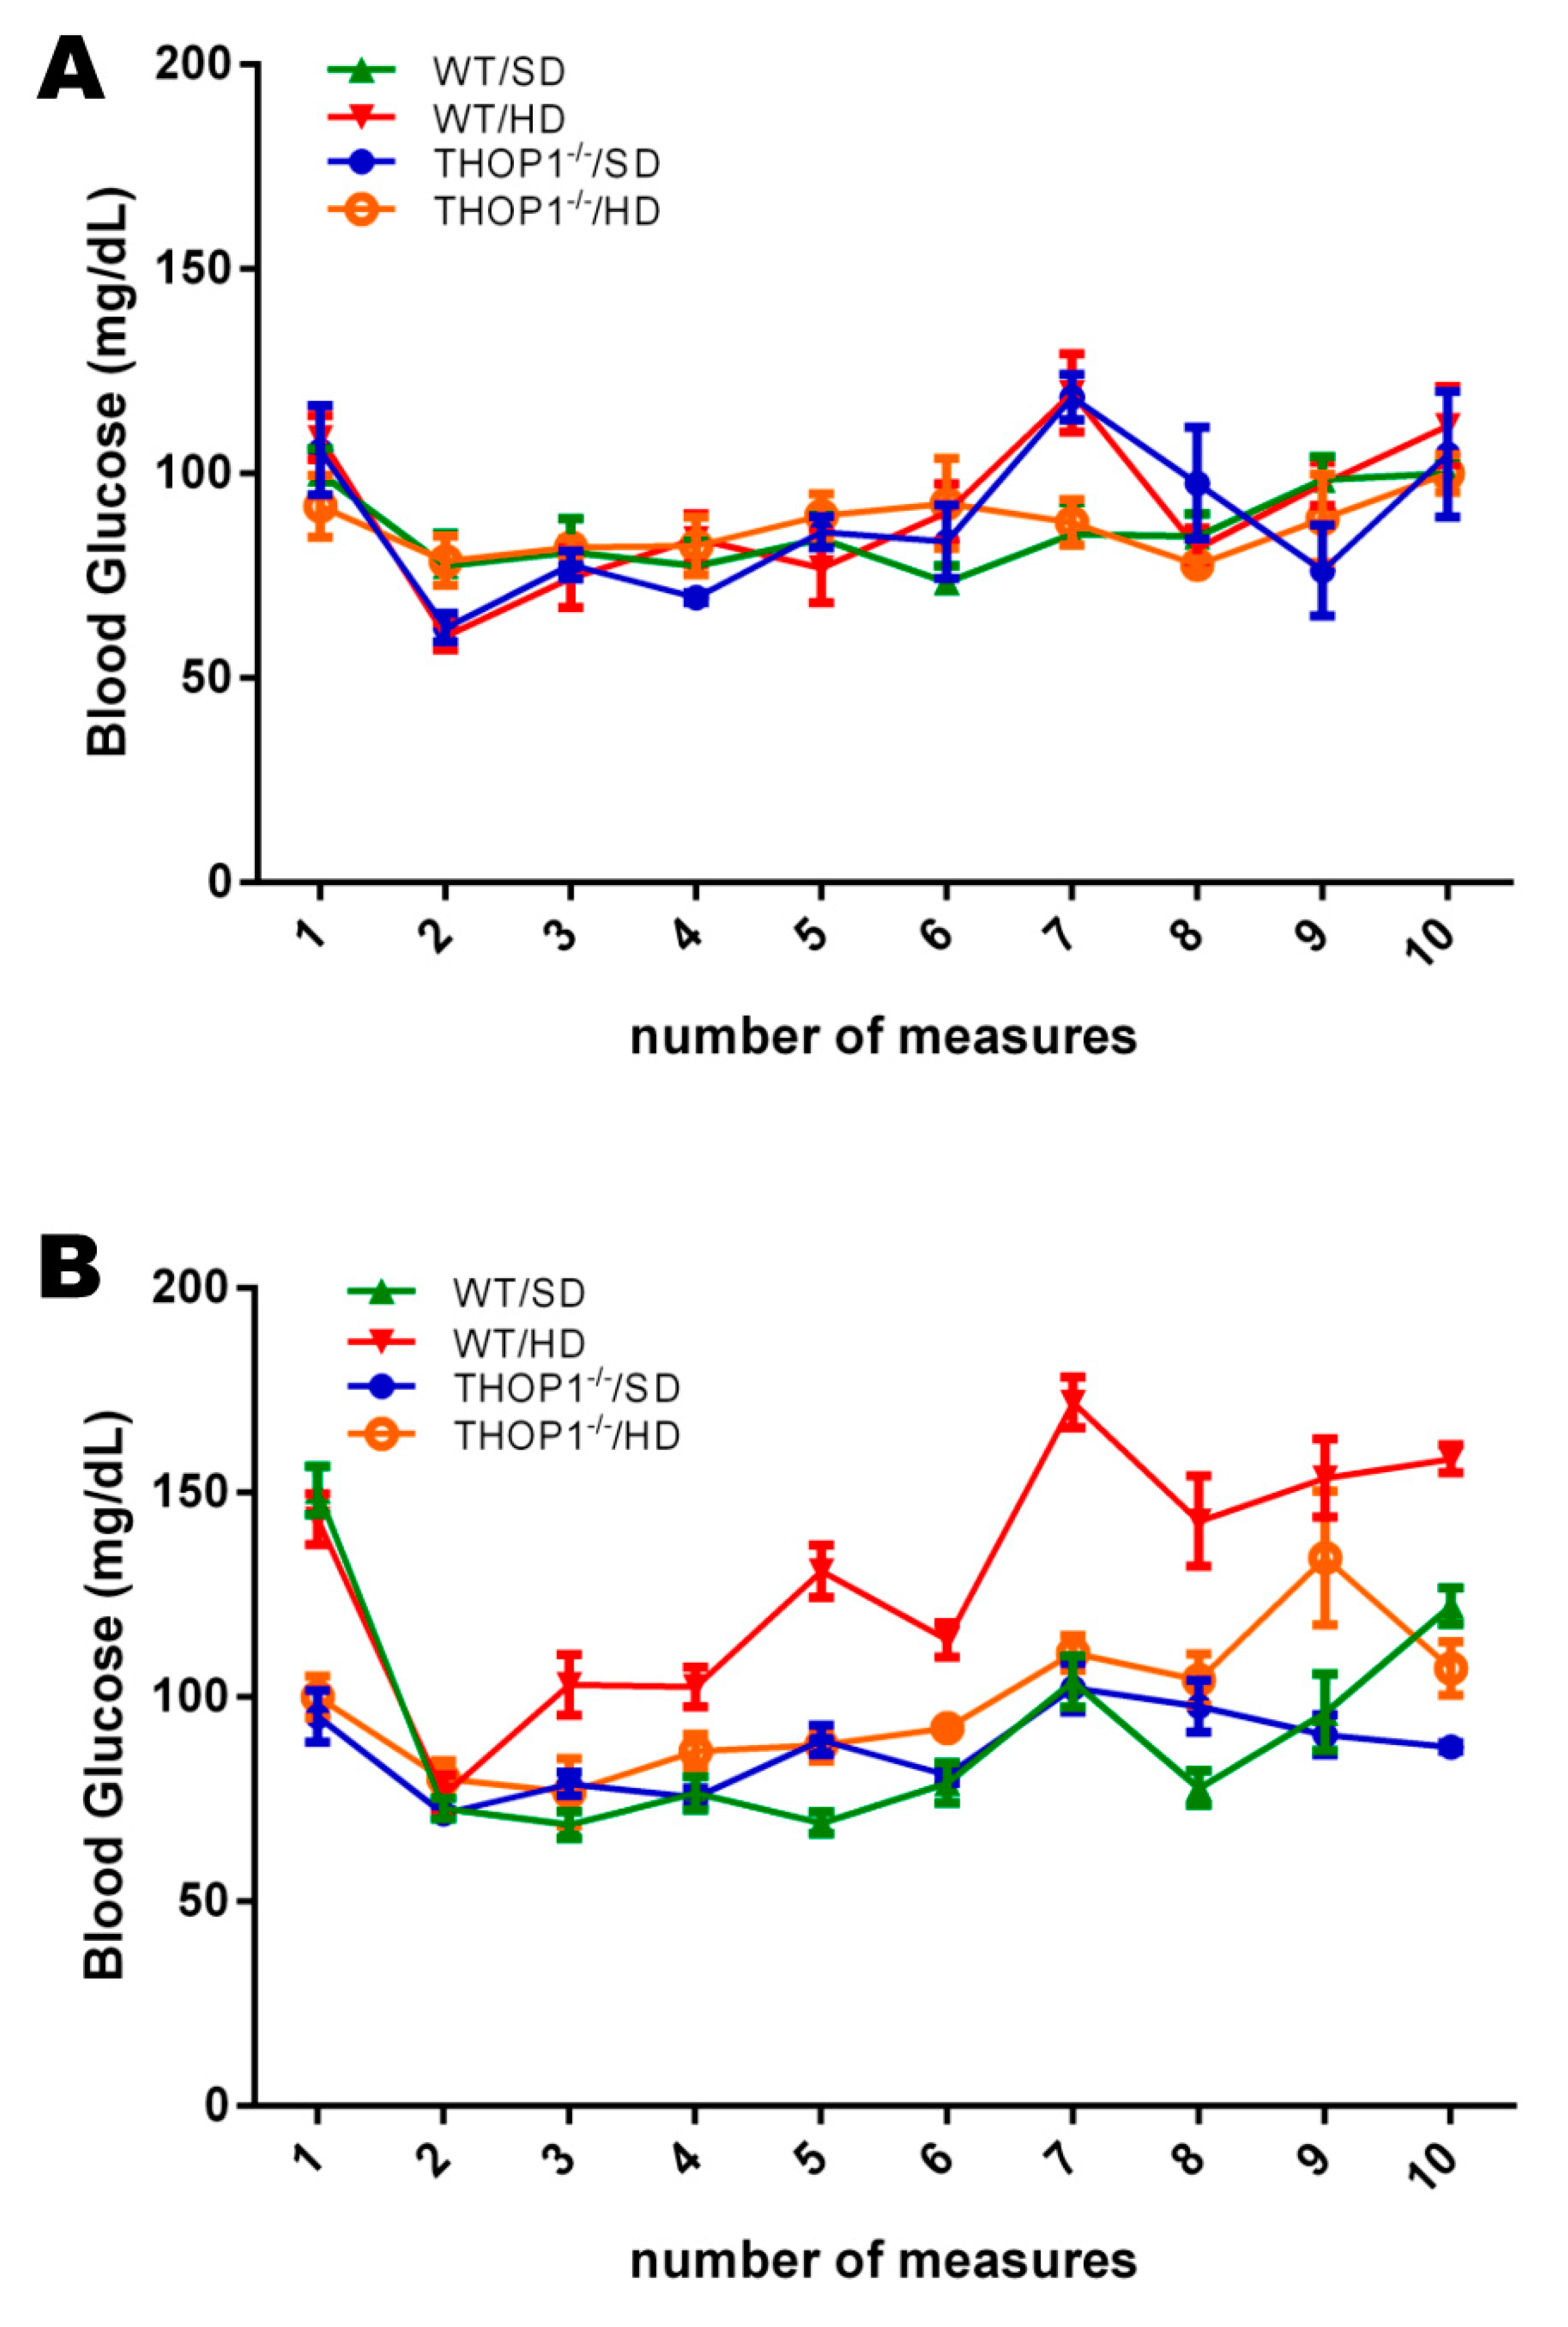
Blood glucose levels. Pre-prandial glucose levels of female (A) and male (B) mice, WT or THOP1−/−, fed either an SD or a HD, were evaluated every two weeks across the 24 weeks. Note that only WT male mice fed a HD showed an increase in the pre-prandial blood glucose levels across the 24 weeks. Results are expressed as mean ± SEM. Statistical analyses were conducted using Two-way ANOVA followed by Tukey’s test or Student’s unpaired t-test (n = 6–9).
Figure 2.
Blood glucose levels. Pre-prandial glucose levels of female (A) and male (B) mice, WT or THOP1−/−, fed either an SD or a HD, were evaluated every two weeks across the 24 weeks. Note that only WT male mice fed a HD showed an increase in the pre-prandial blood glucose levels across the 24 weeks. Results are expressed as mean ± SEM. Statistical analyses were conducted using Two-way ANOVA followed by Tukey’s test or Student’s unpaired t-test (n = 6–9).
Figure 3.
Glucose and insulin tolerance tests. (A,C,E) females and (B,D,F) males. (A–D) show the glucose tolerance test (GTT). (E,F) show the insulin tolerance test (ITT). (C,D) show the area under the curve (AUC) for groups A (C) or B (D). Note that only WT male animals fed a HD for 24 weeks were insulin-resistant (F). Data are presented as mean ± SEM. Statistical analyses were conducted using Two-way ANOVA followed by Tukey’s test (A,B,E,F) or Student’s unpaired t-test (C,D). One letter, p ≤ 0.05; two letters, p ≤ 0.01; three letters p ≤ 0.001. a, WT/SD vs. WT/HD; b, THOP1−/−/SD vs. THOP1−/−/HD; c, WT/SD vs. THOP1−/−/SD; d, WT/HD vs. THOP1−/−/HD (n = 6–9).
Figure 4.
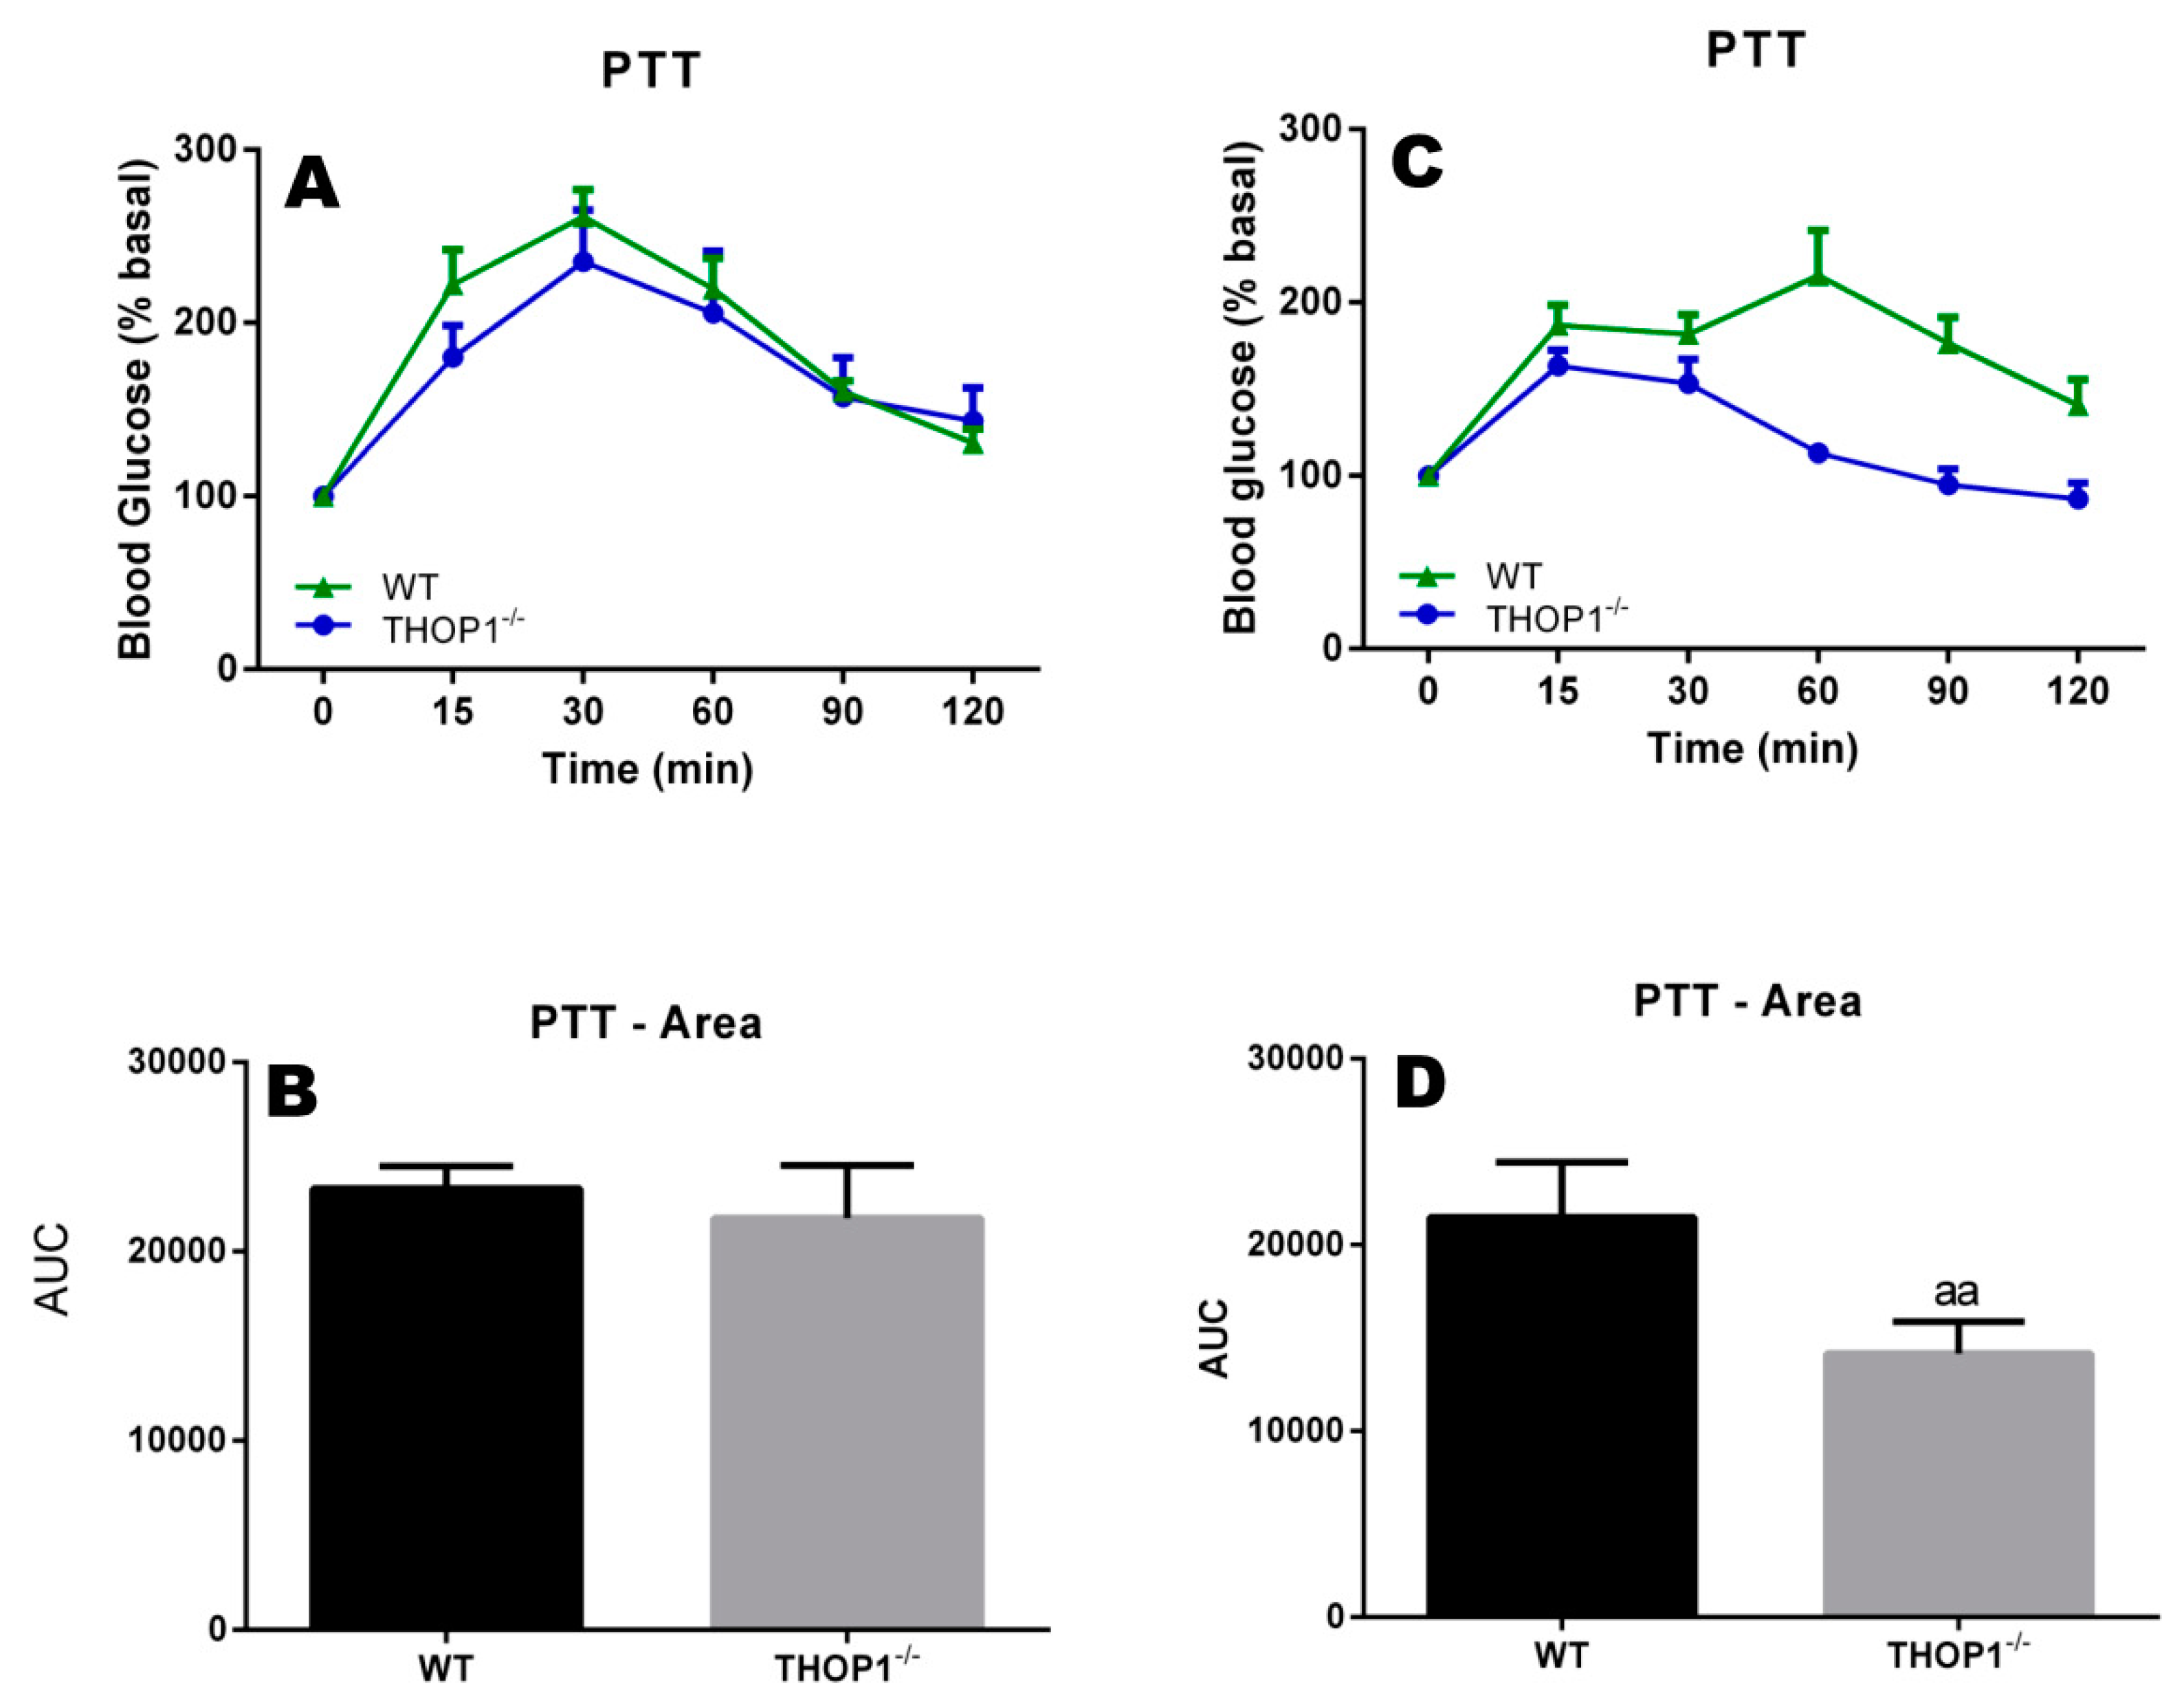
Pyruvate tolerance test of 24-week-old WT or THOP1−/− mice fed an SD to evaluate their liver gluconeogenesis. (A,B) females; (C,D) males; (B,D) respectively, A and C area under the curve (AUC) for blood glucose curves. Colored curves (A,C) show blood glucose levels after pyruvate injection (2 g/kg sodium pyruvate after 16 h of fasting) at the indicated time point (x-axis). Blood glucose was measured using a glucose meter as detailed in the Methods section. Statistical analyses were performed using Student’s unpaired t-test. aa, p ≤ 0.01 (n = 6).
Figure 4.
Pyruvate tolerance test of 24-week-old WT or THOP1−/− mice fed an SD to evaluate their liver gluconeogenesis. (A,B) females; (C,D) males; (B,D) respectively, A and C area under the curve (AUC) for blood glucose curves. Colored curves (A,C) show blood glucose levels after pyruvate injection (2 g/kg sodium pyruvate after 16 h of fasting) at the indicated time point (x-axis). Blood glucose was measured using a glucose meter as detailed in the Methods section. Statistical analyses were performed using Student’s unpaired t-test. aa, p ≤ 0.01 (n = 6).
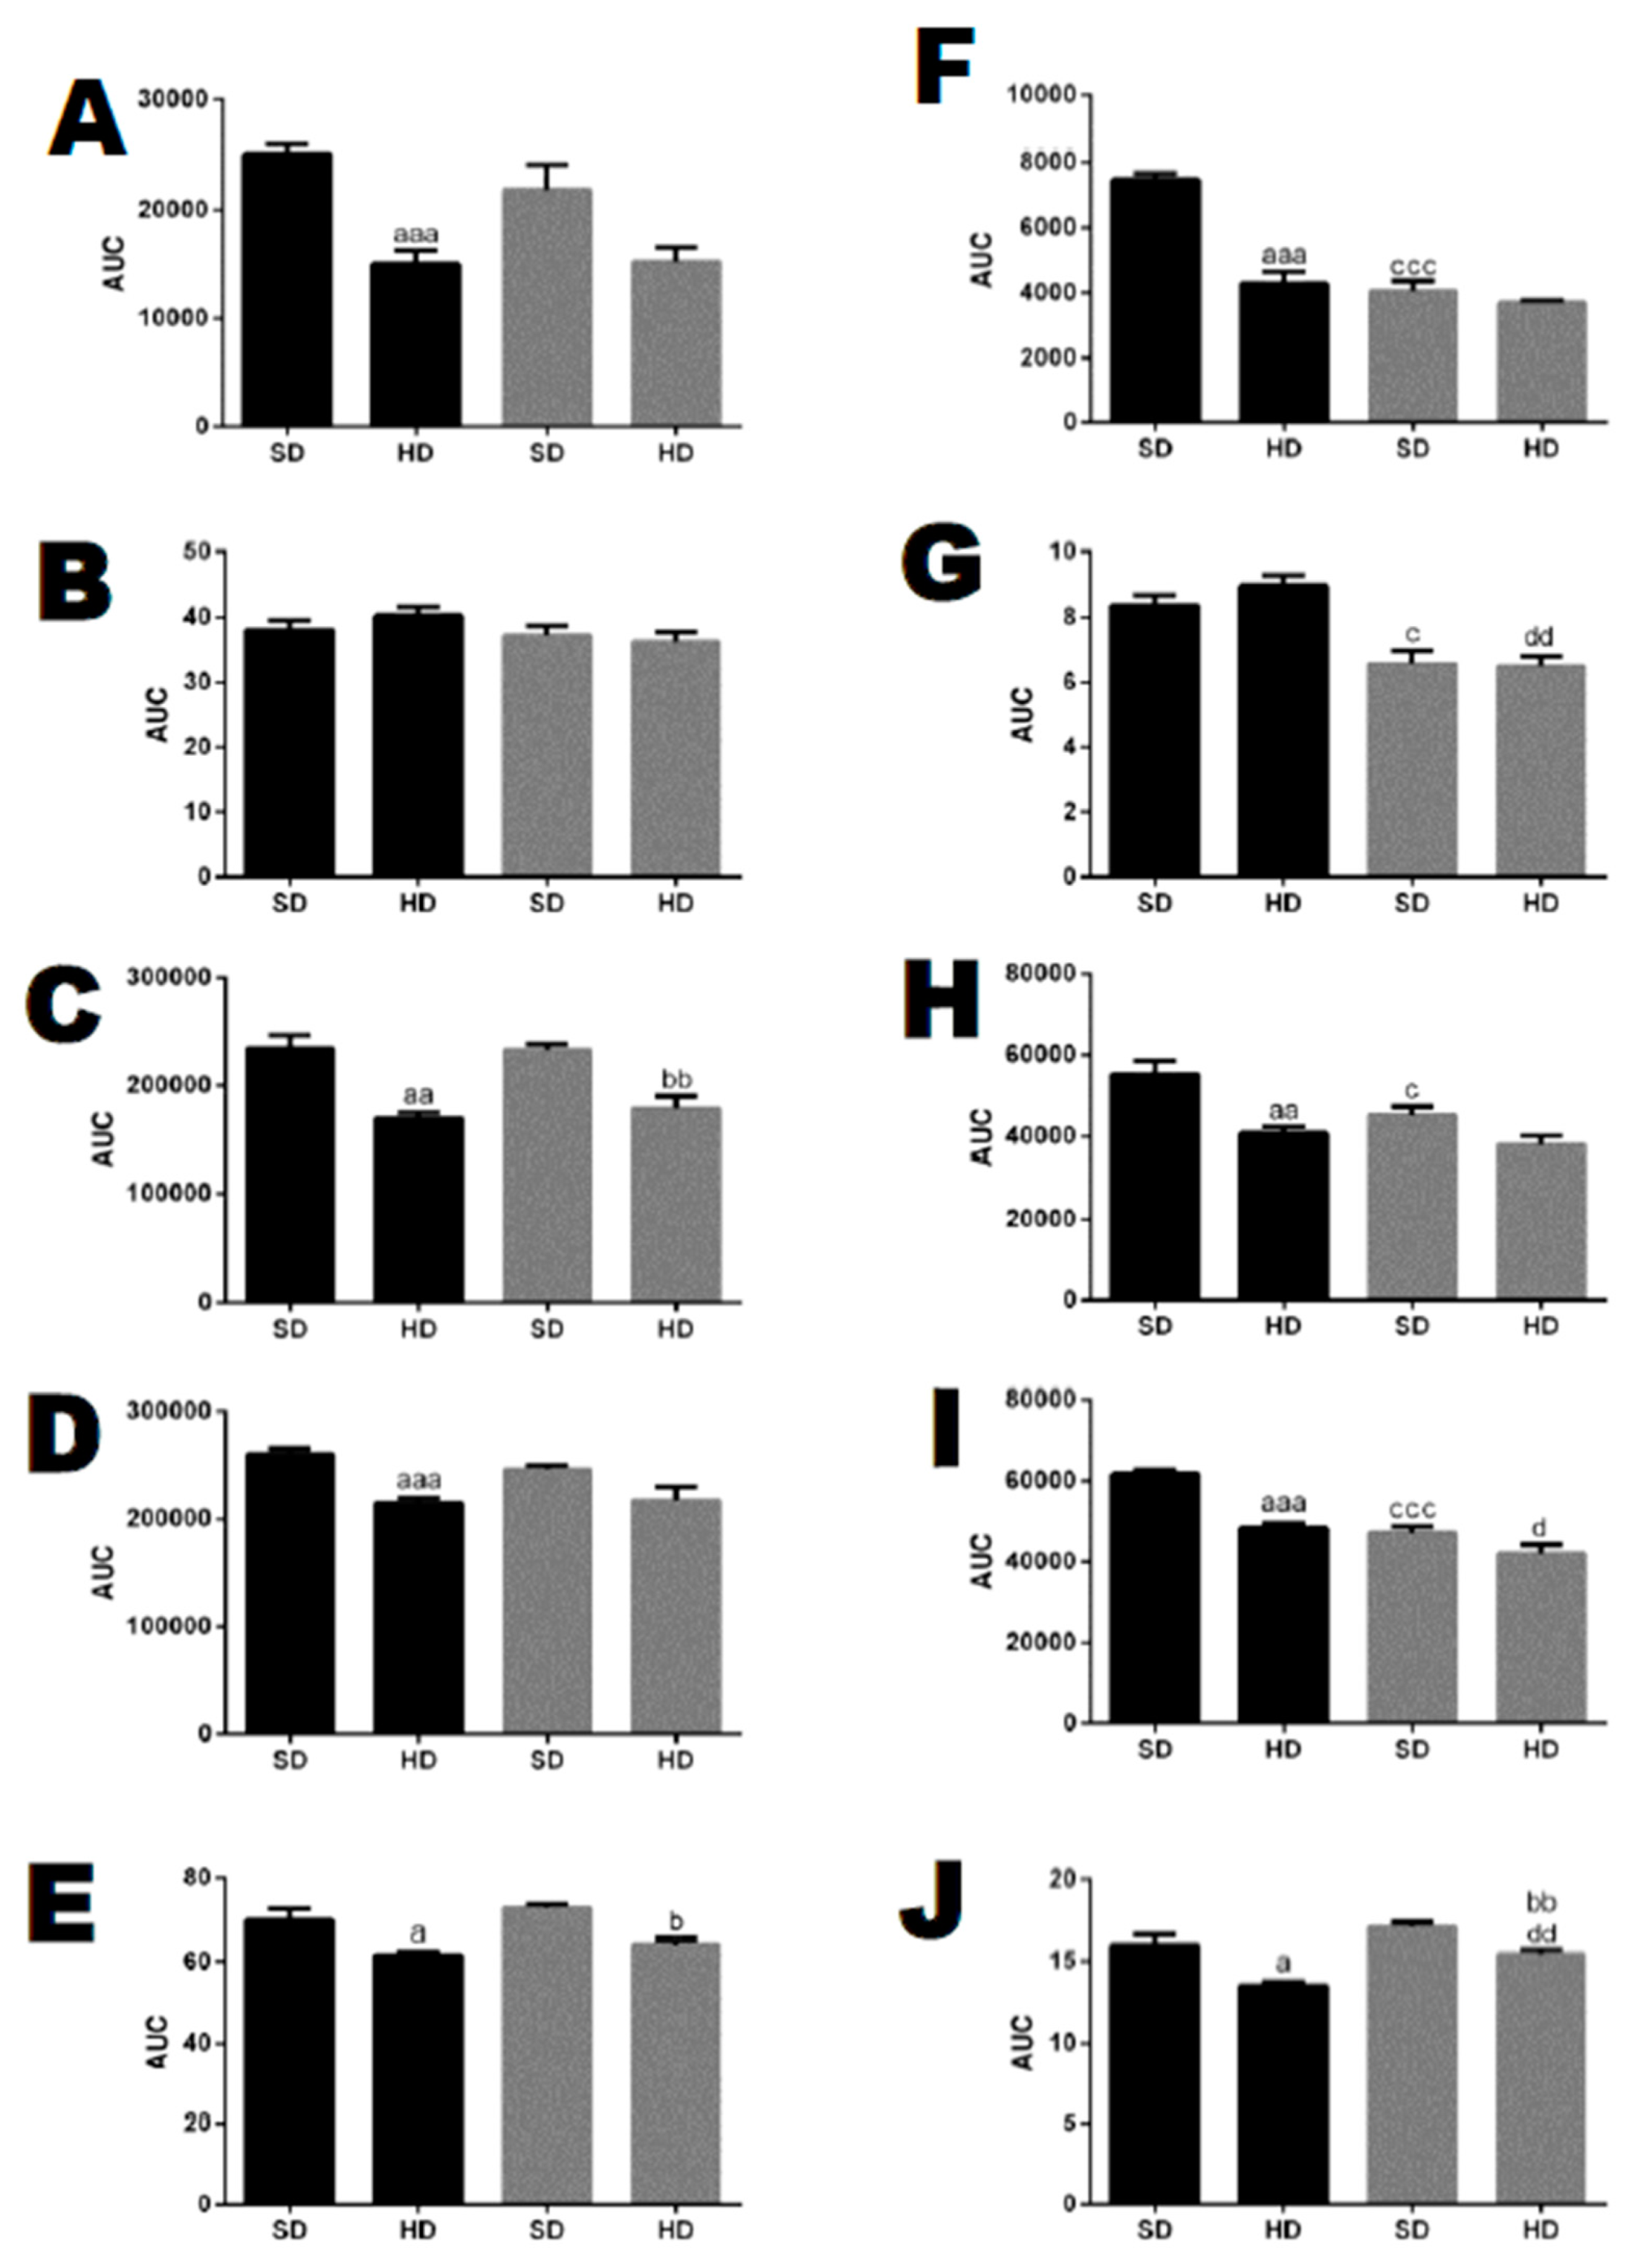
Figure 5.
Resting energy metabolism of WT (black bars) or THOP1−/− (green bars) male mice across 24 h. (A–E) 24 h period (6 a.m.–6 a.m.); (F–J) 5–10 p.m. period; (A,F) spontaneous locomotor activity; (B,G) heat production; (C,H) VCO2 (mL/kg/h) production; (D,I) VO2 (mL/kg/h) consumption; (E,J) respiratory exchange ratios (RERs). The results are shown for mice previously fed with either an SD or a HD for 24 weeks. Data are presented as mean ± SEM. Statistical analyses were performed using Student’s unpaired t-test. One letter, p ≤ 0.05; two letters, p ≤ 0.01; three letters p ≤ 0.001. a, WT/SD vs. WT/HD; b, THOP1−/−/SD vs. THOP1−/−/HD; c, WT/SD vs. THOP1−/−/SD; d, WT/HD vs. THOP1−/−/HD (n = 4). y-axis: bars represent the area under the curve (AUC).
Figure 6.
Plasma corticosterone levels of WT and THOP1−/− mice. (A) plasma corticosterone levels (µg/dL) at 7 a.m.; (B) plasma corticosterone levels (µg/dL) at 7 p.m. Results are expressed as mean ± SEM. Statistical analyses were performed using Student’s unpaired t-test. a, p ≤ 0.05 between WT and THOP1−/− mice (n = 4–5).
Figure 7.
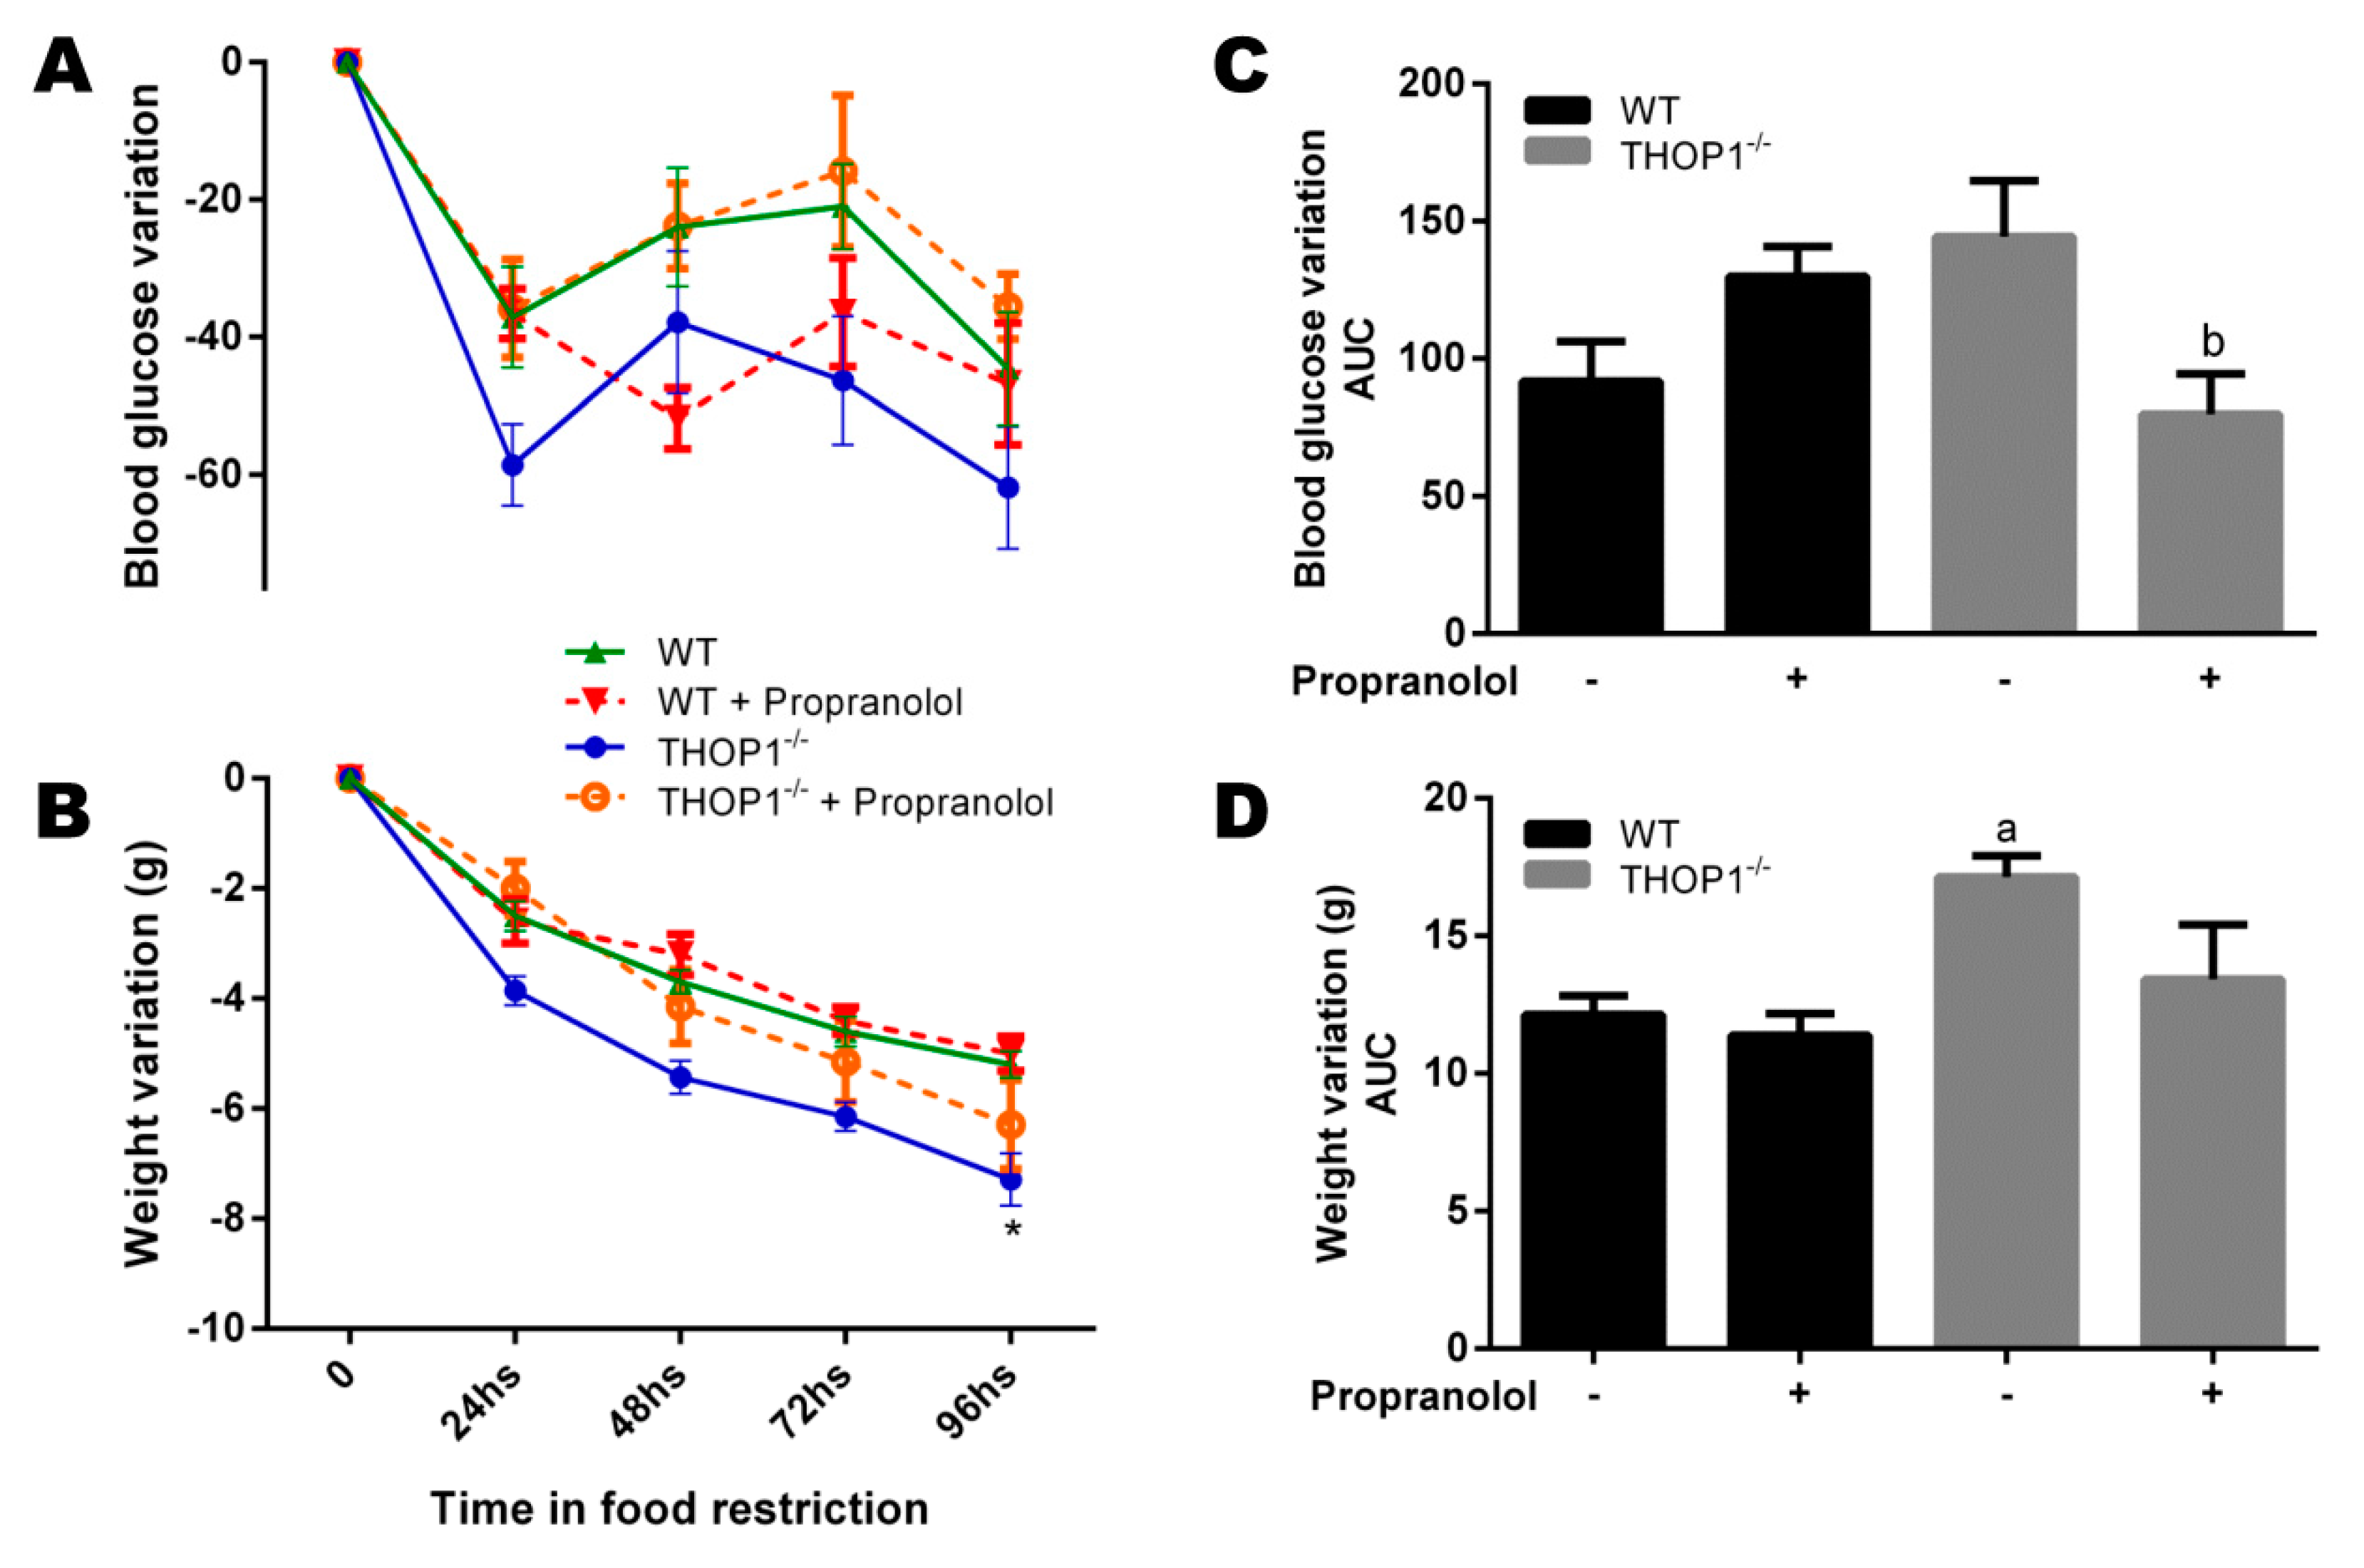
Food restriction experiments. Twelve-week-old WT and THOP1−/− animals were fed with 1.5 g/day of standard diet (SD; corresponding to 40% of the regular fed for these animals). During four days, once a day, these animals received by gavage either saline or propranolol (10 mg∙kg−1/day). (A) blood glucose variation; (B) area under curve (AUC) of blood glucose variation; (C) animal weight variation; and, (D) AUC of animal weight variation. Results are expressed as mean ± SEM. Statistical analyses were performed using Student’s unpaired t-test. One letter p ≤ 0.05; between: a, WT vs. THOP1−/− WT/HD; b, THOP1−/− vs. THOP1−/− + propranolol (n = 7–10).
Figure 7.
Food restriction experiments. Twelve-week-old WT and THOP1−/− animals were fed with 1.5 g/day of standard diet (SD; corresponding to 40% of the regular fed for these animals). During four days, once a day, these animals received by gavage either saline or propranolol (10 mg∙kg−1/day). (A) blood glucose variation; (B) area under curve (AUC) of blood glucose variation; (C) animal weight variation; and, (D) AUC of animal weight variation. Results are expressed as mean ± SEM. Statistical analyses were performed using Student’s unpaired t-test. One letter p ≤ 0.05; between: a, WT vs. THOP1−/− WT/HD; b, THOP1−/− vs. THOP1−/− + propranolol (n = 7–10).
Figure 8.
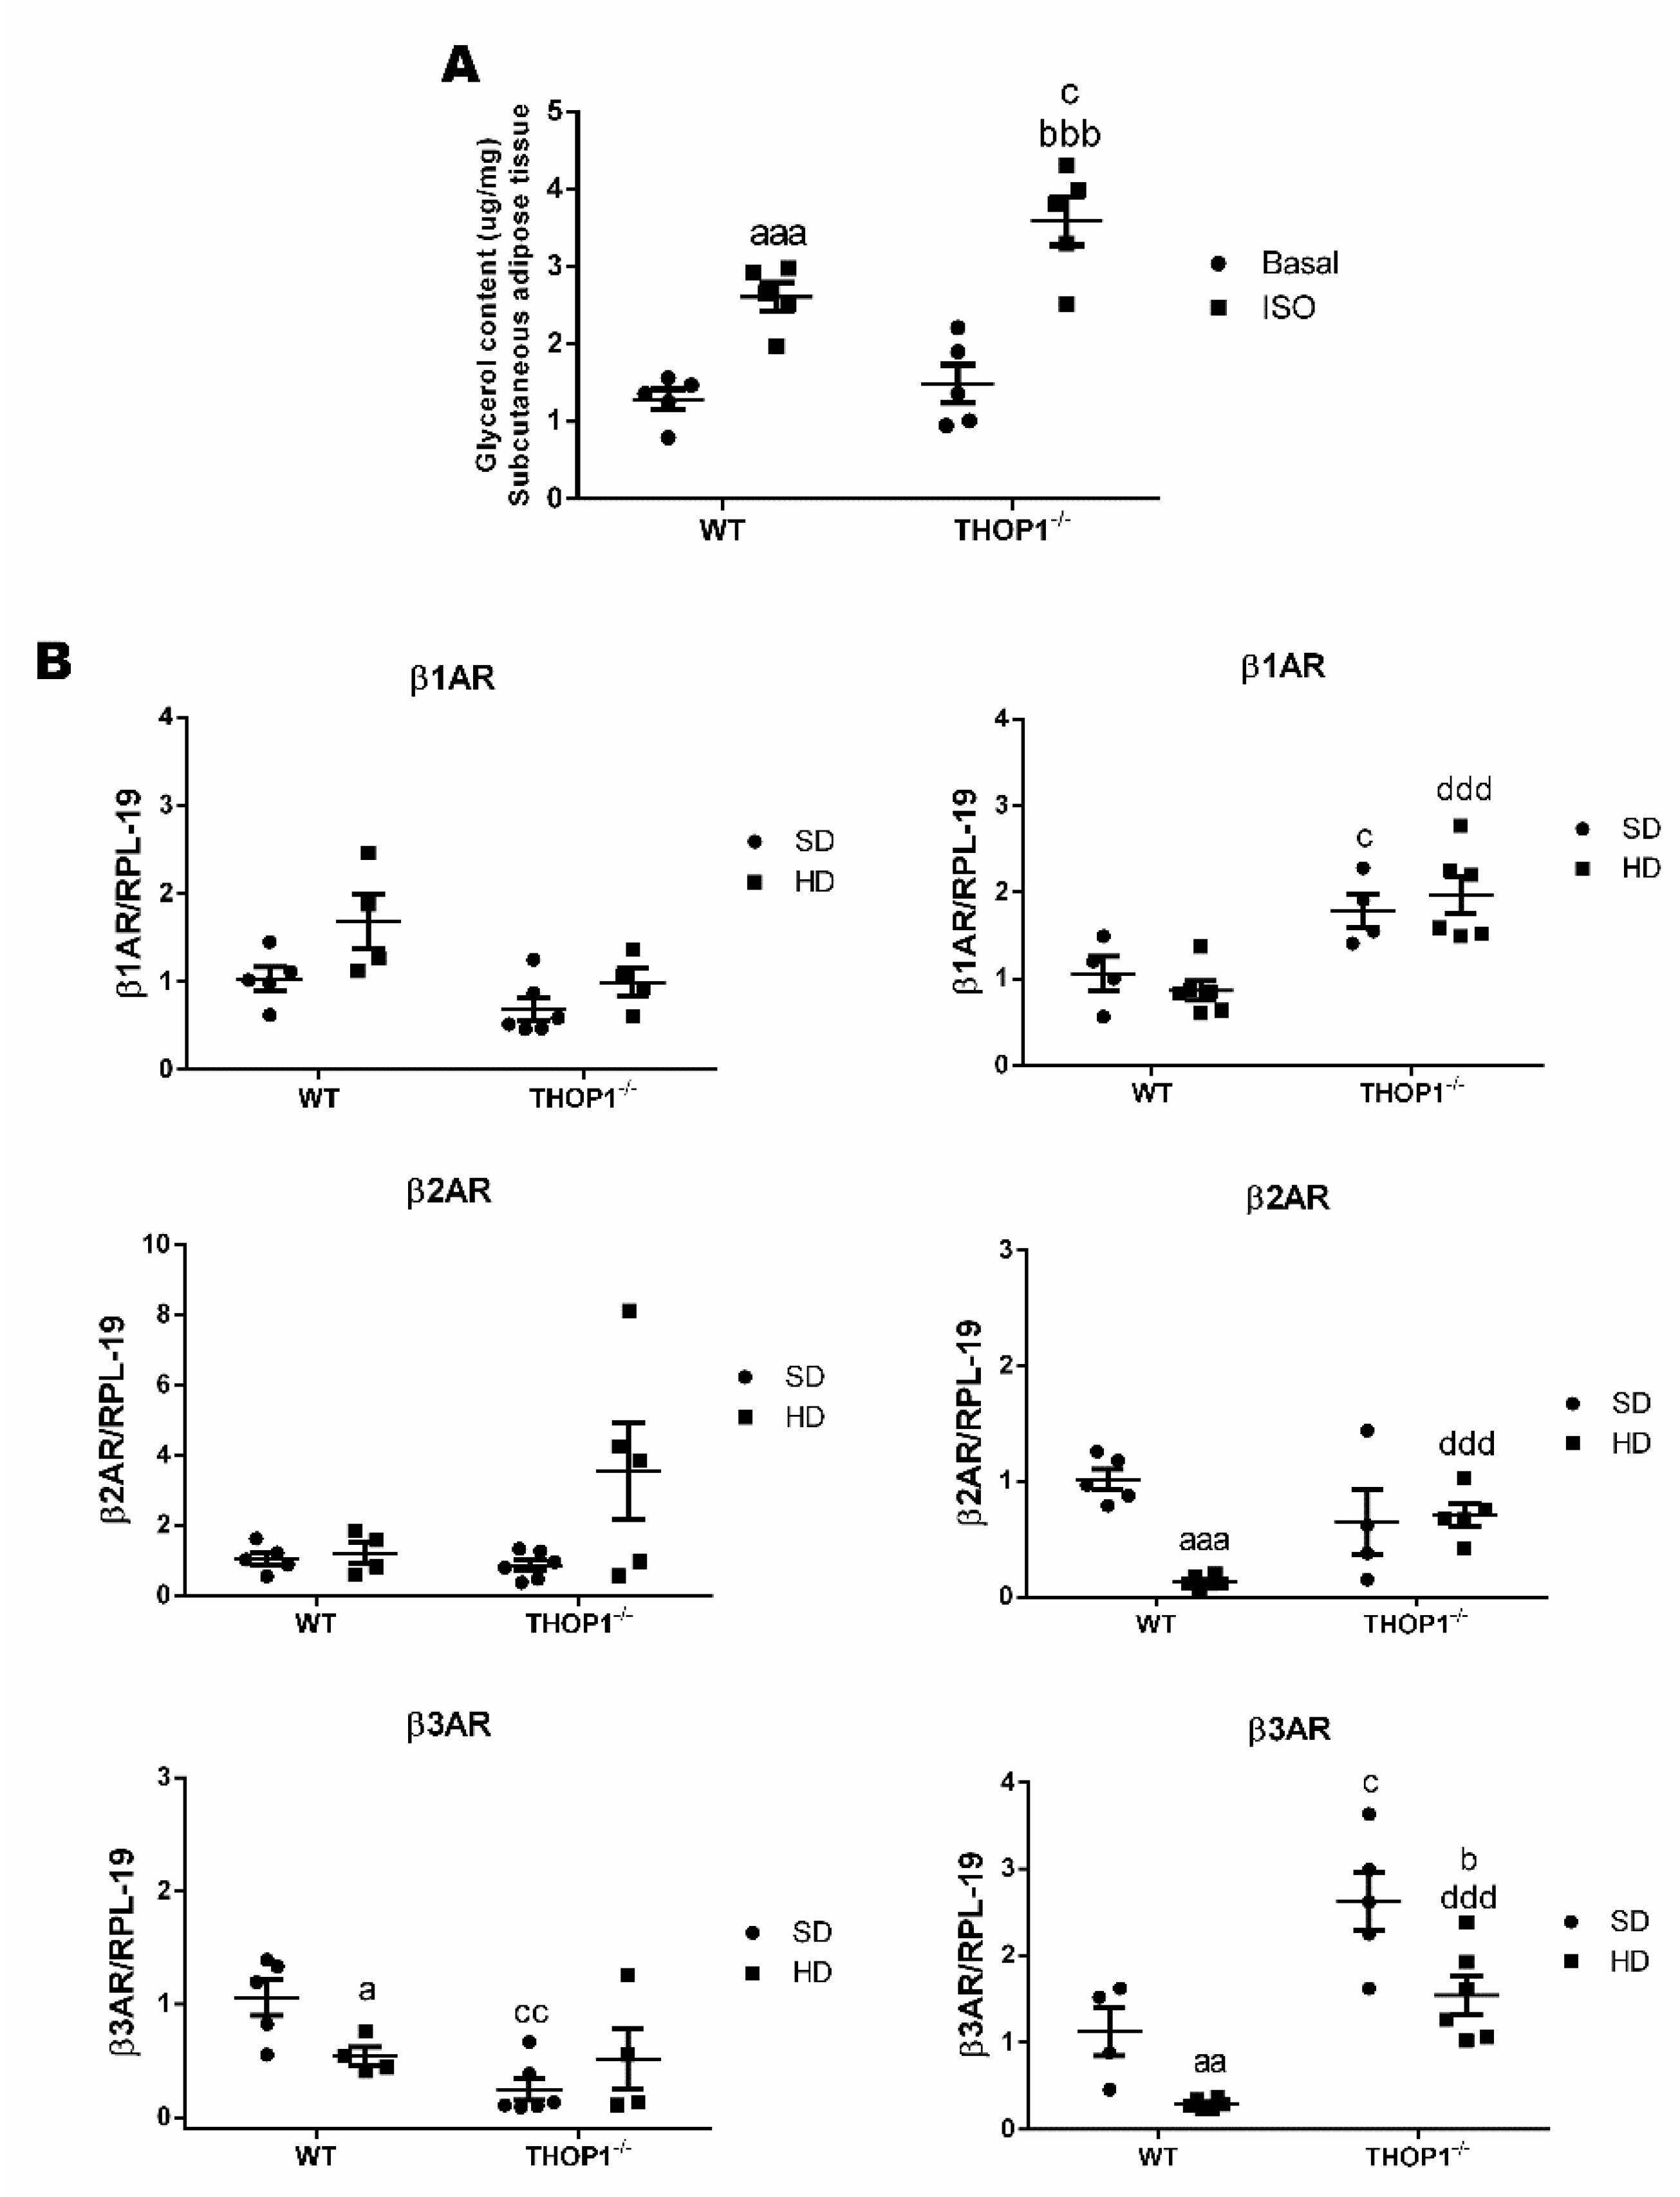
Isoproterenol-stimulated lipolytic activity and mRNA expression levels of β-adrenergic receptors 1, 2, or 3 (β1AR, β2AR, and β3AR, respectively). (A) Inguinal adipose tissue was removed, weighed, divided in two pieces, and placed in Krebs buffer, pH 7.2, at 37 °C for 10 min., in the absence (Basal) or presence of isoproterenol (0.10 ng/g; ISO). Lipolytic activity was measured as the amount of glycerol produced, using the “free glycerol reagent” kit (Sigma, MO, USA). Glycerol content (µg/mg) was normalized by tissue weight. Results are expressed as mean ± SEM. (B) mRNA expression levels of adrenergic receptors β1AR, β2AR, and β3AR. Analyses of gene expression were performed by Quantitative Real-Time PCR (qRT-PCR) in female or male retroperitoneal adipose tissue. Data are presented as mean ± standard deviation. Statistical analyses were performed using Student’s unpaired t-test. One letter, p ≤ 0.05; two letters, p ≤ 0.01; three letters p ≤ 0.001. a, WT/SD vs. WT/HD; b, THOP1−/−/SD vs. THOP1−/−/HD; c, WT/SD vs. THOP1−/−/SD; d, WT/HD vs. THOP1−/−/HD (n = 4–6).
Figure 8.
Isoproterenol-stimulated lipolytic activity and mRNA expression levels of β-adrenergic receptors 1, 2, or 3 (β1AR, β2AR, and β3AR, respectively). (A) Inguinal adipose tissue was removed, weighed, divided in two pieces, and placed in Krebs buffer, pH 7.2, at 37 °C for 10 min., in the absence (Basal) or presence of isoproterenol (0.10 ng/g; ISO). Lipolytic activity was measured as the amount of glycerol produced, using the “free glycerol reagent” kit (Sigma, MO, USA). Glycerol content (µg/mg) was normalized by tissue weight. Results are expressed as mean ± SEM. (B) mRNA expression levels of adrenergic receptors β1AR, β2AR, and β3AR. Analyses of gene expression were performed by Quantitative Real-Time PCR (qRT-PCR) in female or male retroperitoneal adipose tissue. Data are presented as mean ± standard deviation. Statistical analyses were performed using Student’s unpaired t-test. One letter, p ≤ 0.05; two letters, p ≤ 0.01; three letters p ≤ 0.001. a, WT/SD vs. WT/HD; b, THOP1−/−/SD vs. THOP1−/−/HD; c, WT/SD vs. THOP1−/−/SD; d, WT/HD vs. THOP1−/−/HD (n = 4–6).

Figure 9.
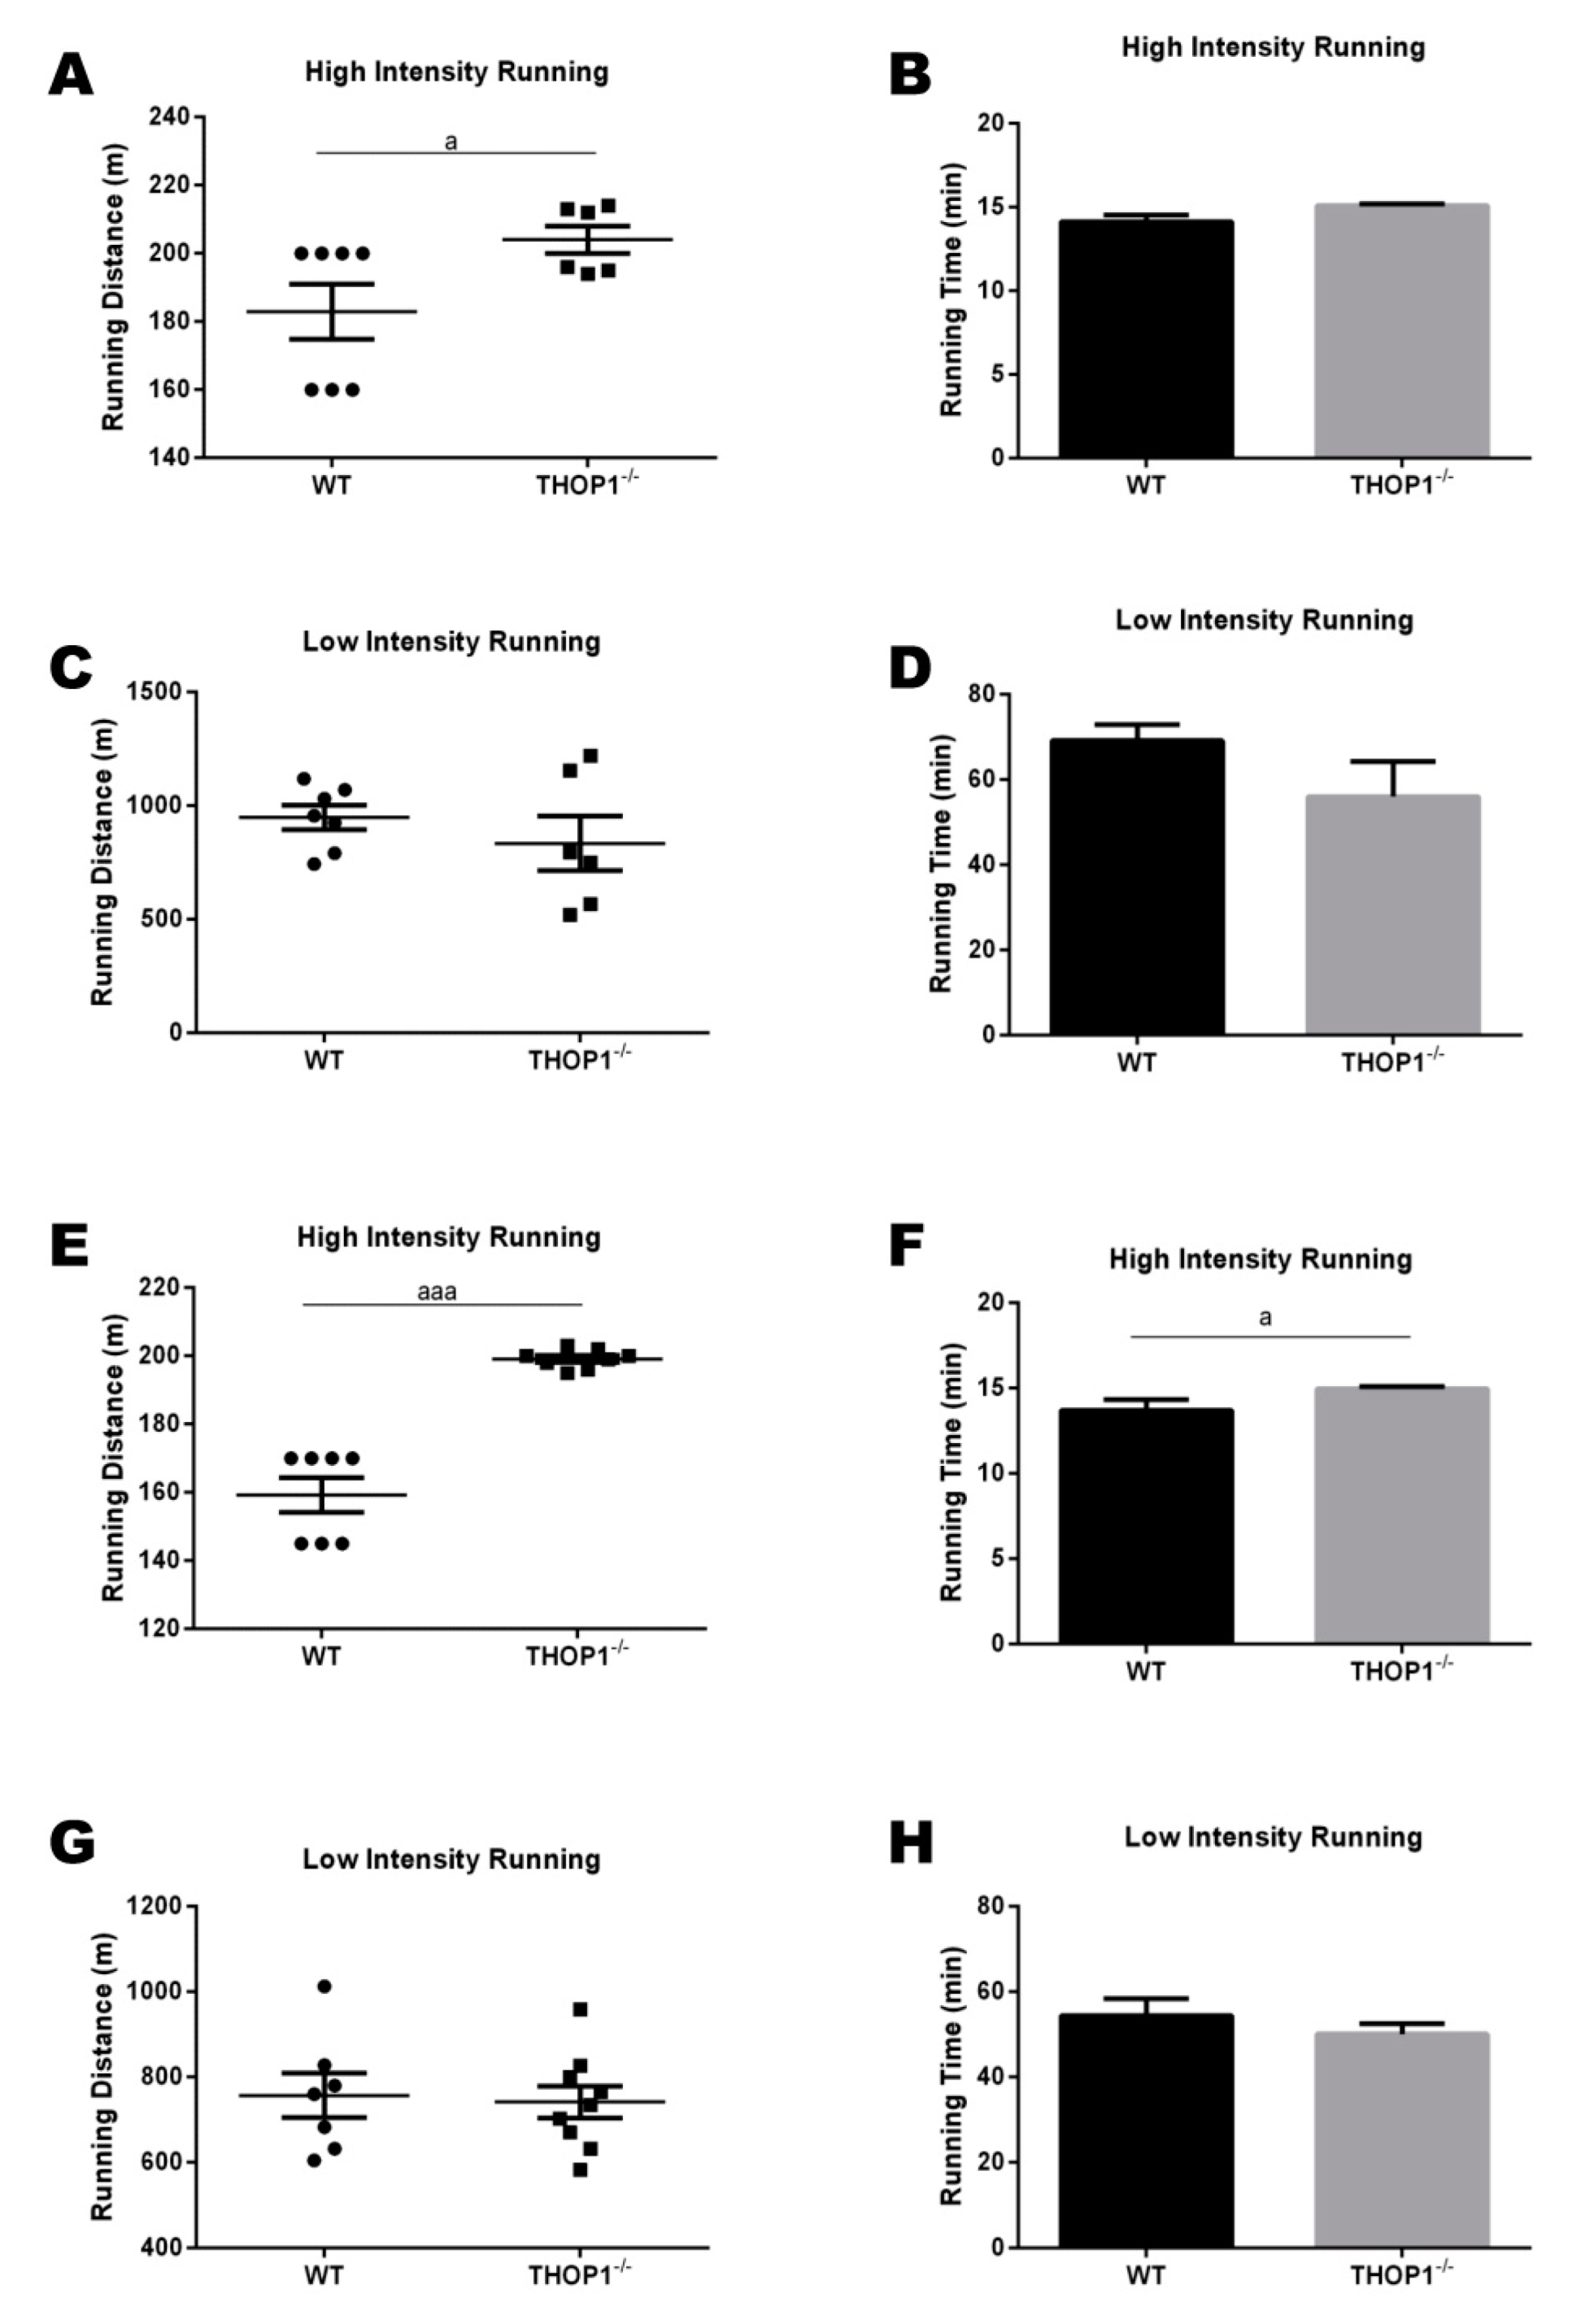
Progressive treadmill exercise test. The cardiorespiratory fitness of the animals fed with a standard diet (SD) was evaluated using a graded treadmill. (A,C,E,G) running distance (m); (B,D,F,H) running time (min.). Both running distance and time were evaluated in the high- and low-intensity tests. (A–D) females; (E–F) males. Data are presented as mean ± SEM. Statistical analyses were performed while using Student’s unpaired t-test. One letter, p ≤ 0.05; three letters p ≤ 0.001 (n = 7–9).
Figure 9.
Progressive treadmill exercise test. The cardiorespiratory fitness of the animals fed with a standard diet (SD) was evaluated using a graded treadmill. (A,C,E,G) running distance (m); (B,D,F,H) running time (min.). Both running distance and time were evaluated in the high- and low-intensity tests. (A–D) females; (E–F) males. Data are presented as mean ± SEM. Statistical analyses were performed while using Student’s unpaired t-test. One letter, p ≤ 0.05; three letters p ≤ 0.001 (n = 7–9).
Figure 10.
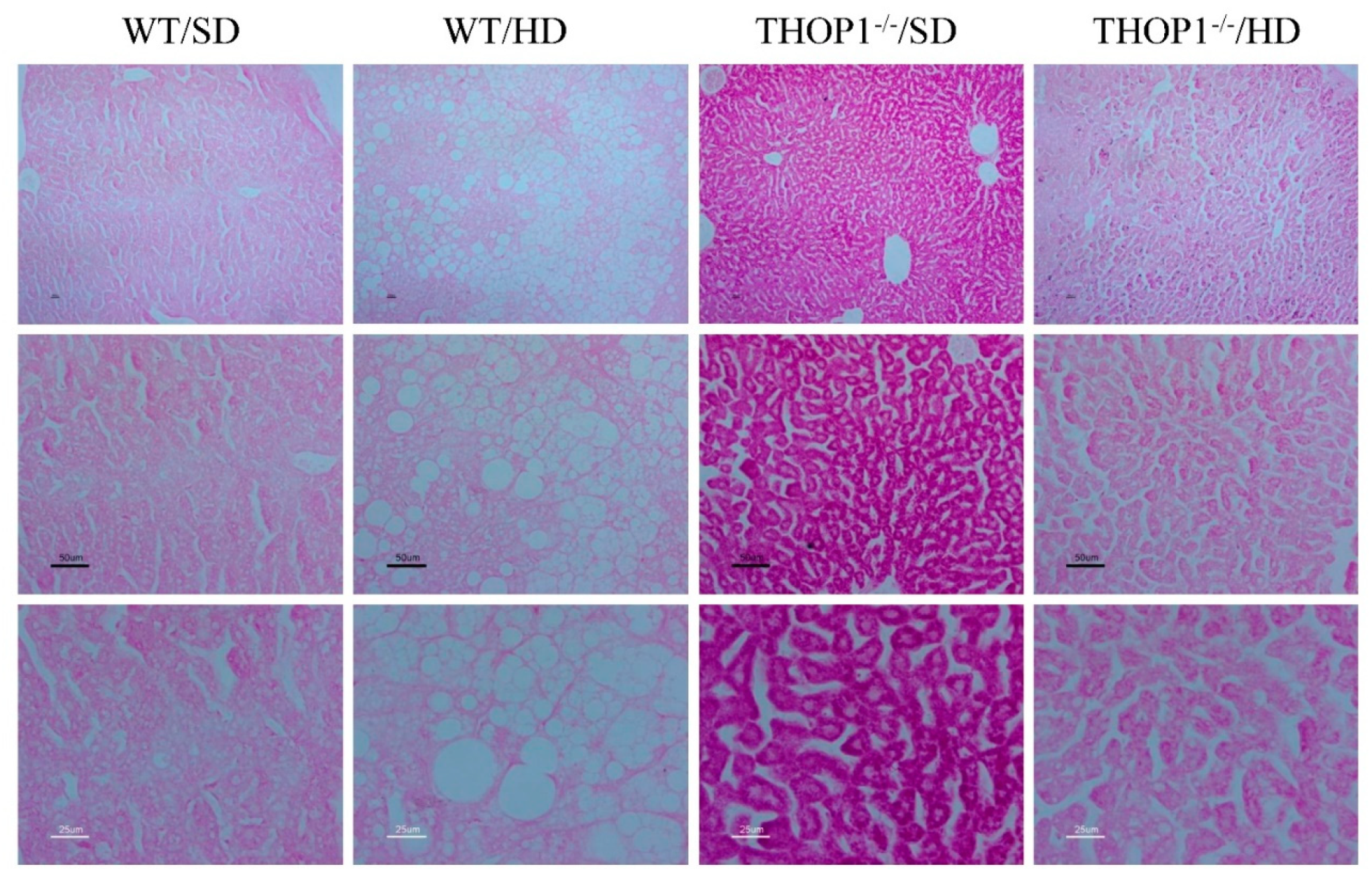
Liver slices from WT and THOP1−/− mice stained with periodic acid–Schiff (PAS). WT or THOP1−/− male mice were fed for 24 weeks with either an SD (WT/SD, THOP1−/−/SD) or a HD (WT/HD, THOP1−/−/HD). Note the higher intensity of PAS reaction in THOP1−/−/SD when compared to the other groups; this is an indicative of higher glycogen content in liver of THOP1−/− mice fed an SD. Panels from top to bottom present increased magnifications of 40- (top), 100- (middle), or 200-fold (bottom).
Figure 10.
Liver slices from WT and THOP1−/− mice stained with periodic acid–Schiff (PAS). WT or THOP1−/− male mice were fed for 24 weeks with either an SD (WT/SD, THOP1−/−/SD) or a HD (WT/HD, THOP1−/−/HD). Note the higher intensity of PAS reaction in THOP1−/−/SD when compared to the other groups; this is an indicative of higher glycogen content in liver of THOP1−/− mice fed an SD. Panels from top to bottom present increased magnifications of 40- (top), 100- (middle), or 200-fold (bottom).
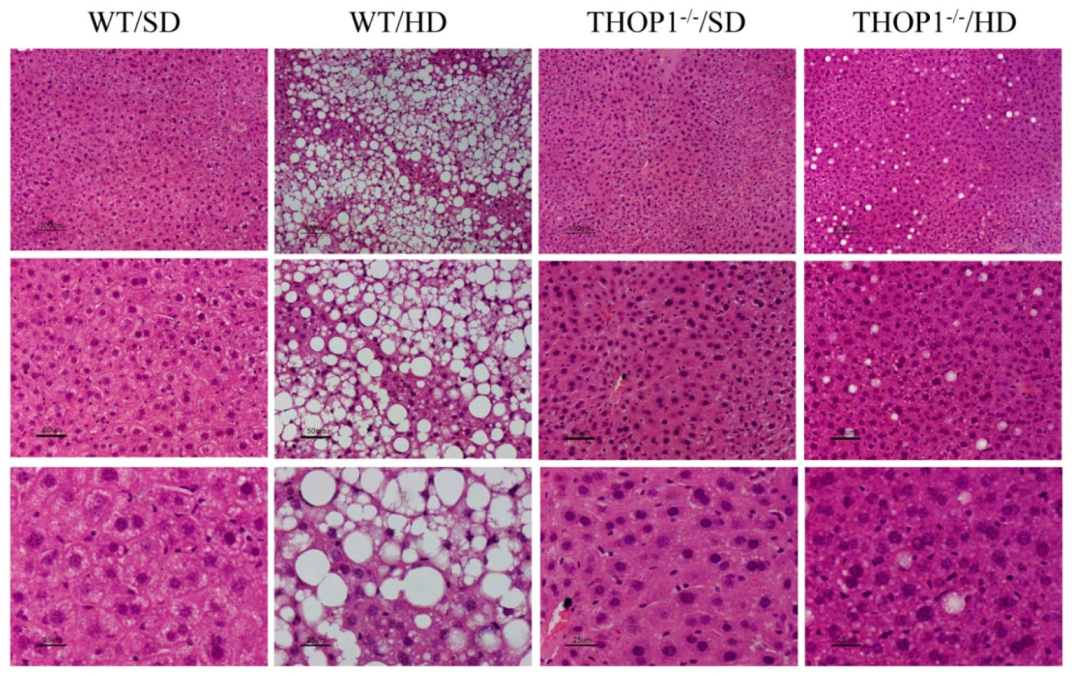
Figure 11.
Liver slices from WT and THOP1
−/− mice stained with hematoxylin and eosin (HE). WT or THOP1
−/− male mice were fed for 24 weeks with either an SD (WT/SD,
Table 1. or a HD (WT/HD, THOP1
−/−/HD). Note the large number of lipid droplets (white spots) in the liver slices from WT mice fed a HD (WT/HD panels), suggesting the presence of NAFLS. Panels present increased magnifications from 40- (top), 100- (middle) or 200-fold (bottom). Bars, 100 μm.
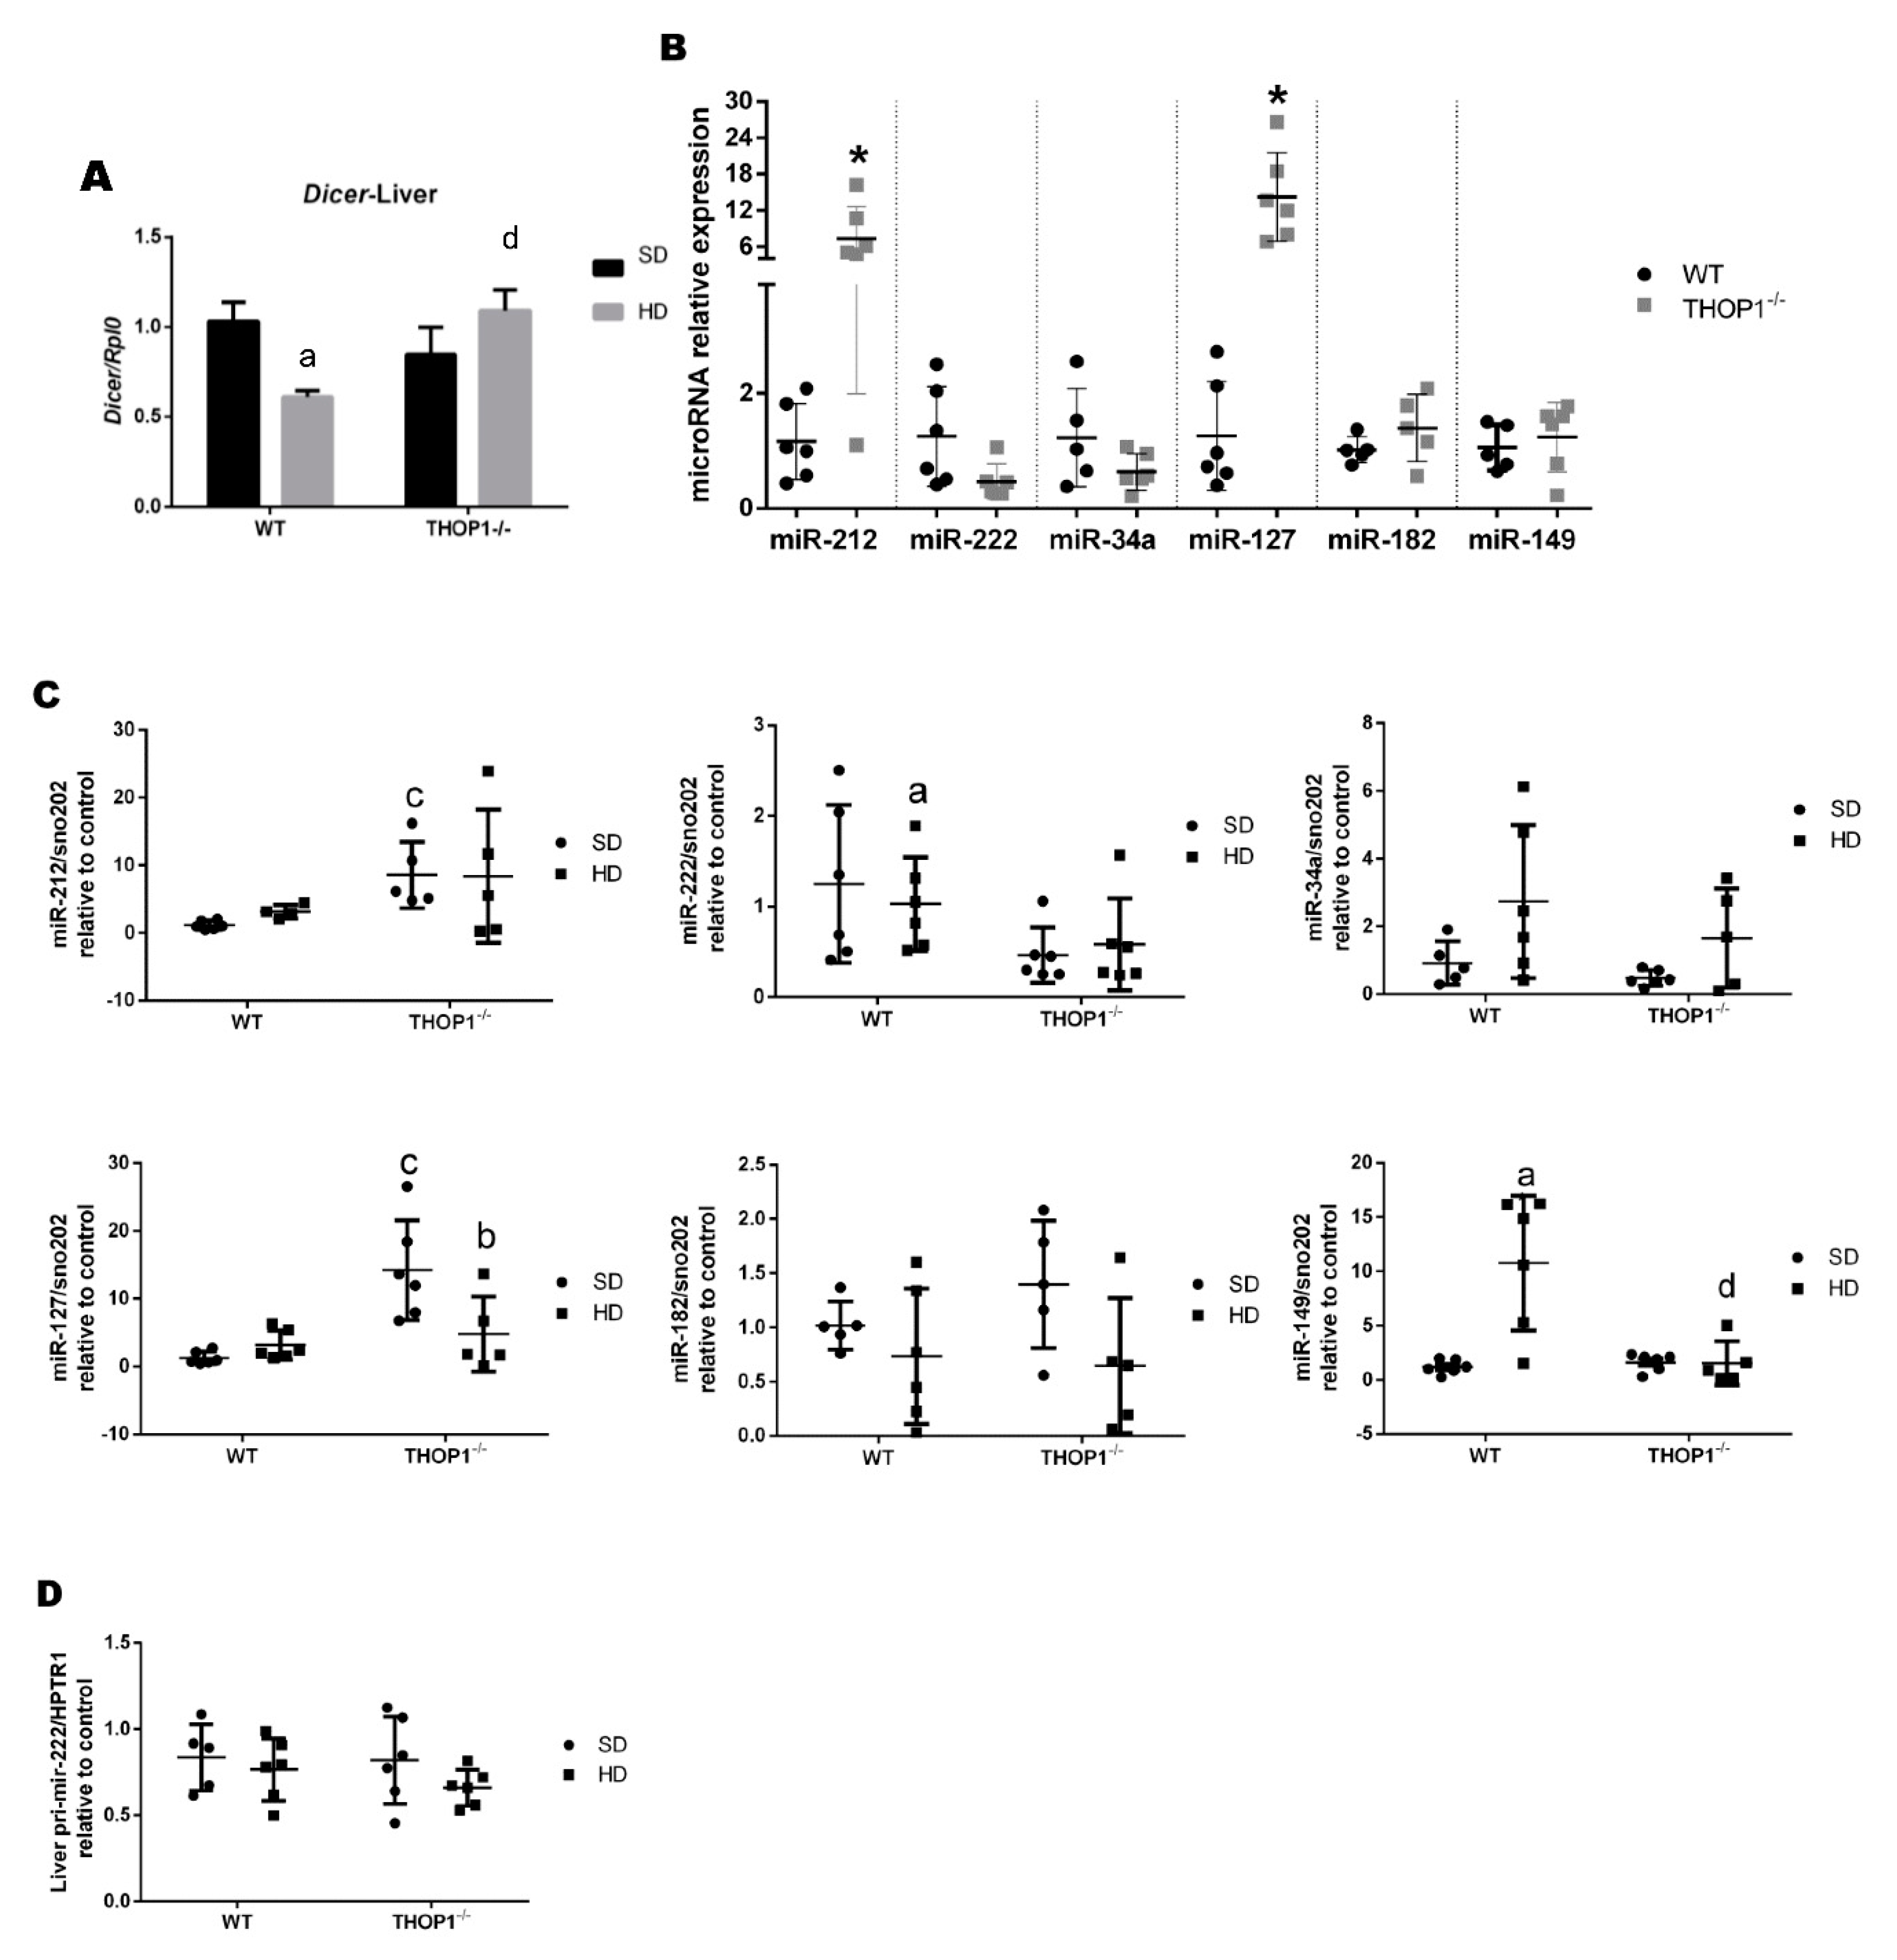
Figure 12.
Dicer mRNA and microRNA expression levels in male liver tissue. (A) dicer mRNA expression levels. (B) Effect of phenotype on the expression levels of the indicated mature microRNAs; * p ≤ 0.05 comparing WT and THOP1−/− mice. (C) Effect of diet and phenotype on the expression levels of the indicated mature microRNAs. (D) Effect of diet and phenotype on the expression level of pri-miR-222. Results are expressed as mean ± SEM. Statistical analyses were performed using Student’s unpaired t-test. One letter, p ≤ 0.05; a, WT/SD vs. WT/HD; b, THOP1−/−/SD vs. THOP1−/−/HD; c, WT/SD vs. THOP1−/−/SD; d, WT/HD vs. THOP1−/−/HD (n = 4–6).
Figure 13.
Dicer mRNA and microRNA expression levels in male retroperitoneal adipose tissue. (A) Dicer mRNA expression levels. (B) Effect of phenotype on the expression levels of the indicated microRNAs; * p ≤ 0.05 when comparing WT and THOP1−/− mice. (C) Effect of diet and phenotype on the expression levels of the indicated microRNAs. (D) The effect of diet and phenotype on the expression level of pri-miR-222. Results are expressed as mean ± SEM. Statistical analyses were performed using Student’s unpaired t-test. One letter, p ≤ 0.05; a, WT/SD vs. WT/HD; b, THOP1−/−/SD vs. THOP1−/−/HD; c, WT/SD vs. THOP1−/−/SD; d, WT/HD vs. THOP1−/−/HD (n = 4–6).
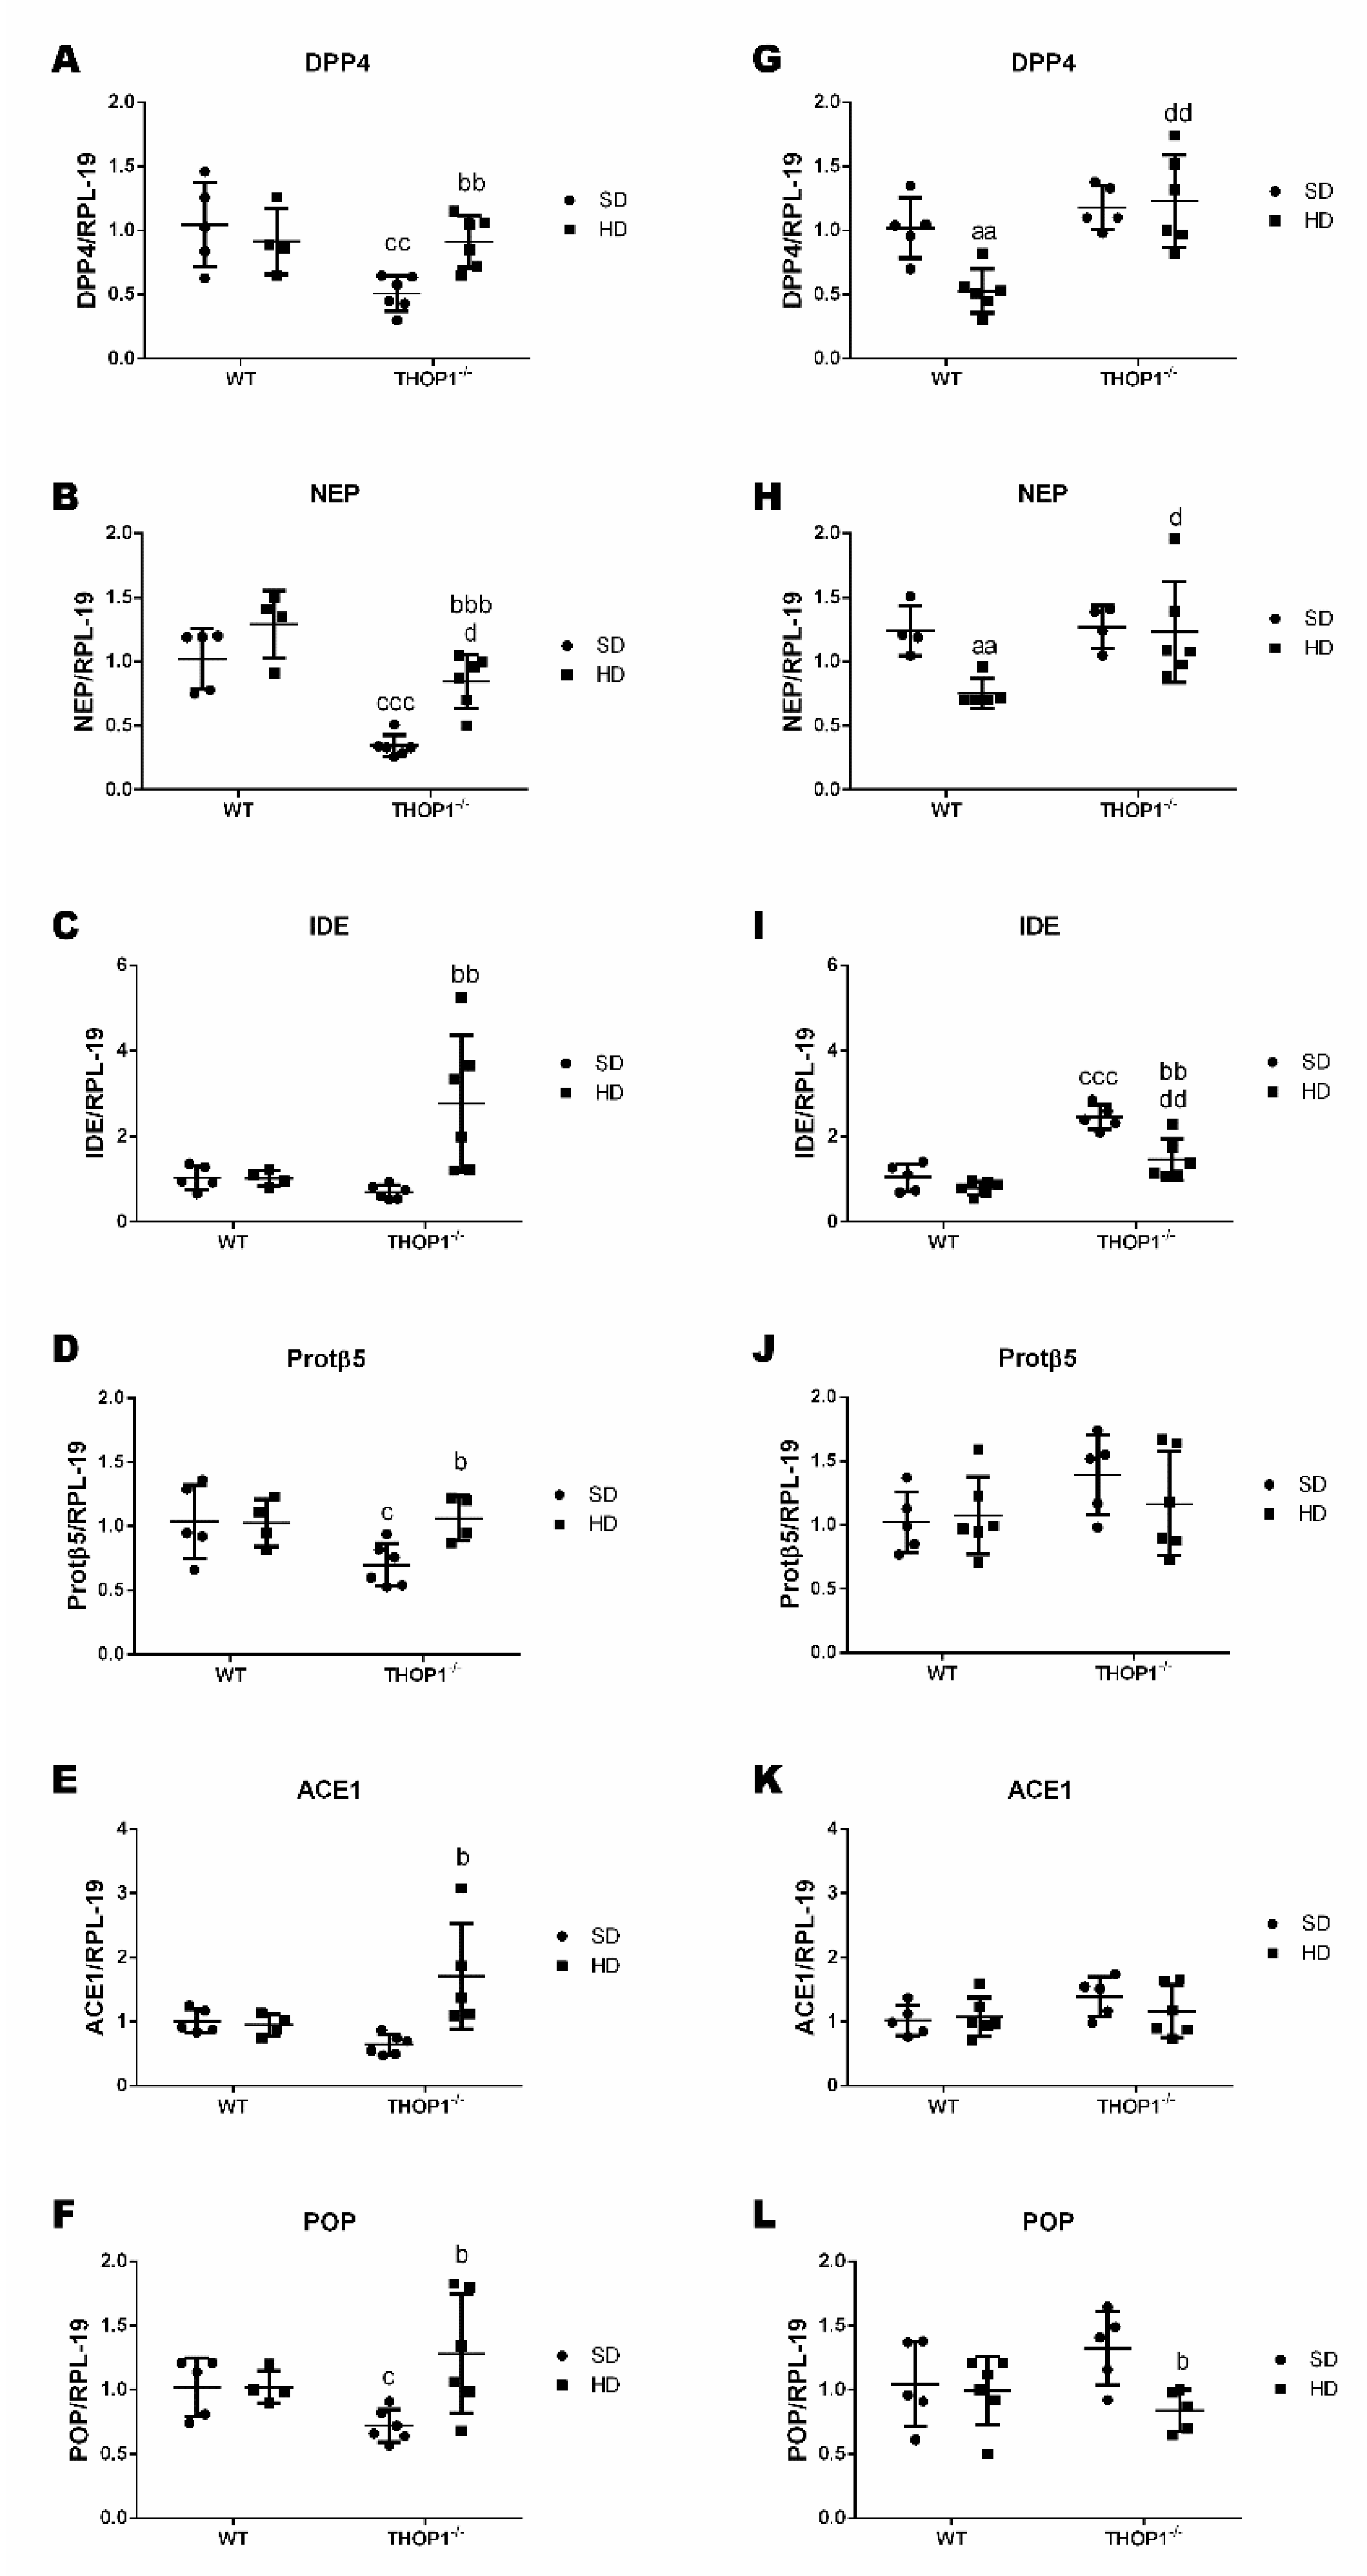
Figure 14.
Gene expression of peptidases and proteasome beta5-subunit (Protβ5) in adipose tissue from WT and THOP1−/− mice. A–F, female; G–L, male. Analyses of gene expression were conducted by qRT-PCR in female and male retroperitoneal adipose tissue for specific peptidases, dipeptidyl peptidase 4 (DPP4), neprilysin (NEP), insulin-degrading enzyme (IDE), angiotensin converting enzyme 1 (ACE1), prolyl-oligopeptidase (POP), and Protβ5. Data are presented as mean ± standard deviation. Statistical analyses were performed using Student’s unpaired t-test. One letter, p ≤ 0.05; two letters, p ≤ 0.01; three letters p ≤ 0.001. a, WT/SD vs. WT/HD; b, THOP1−/−/SD vs. THOP1−/−/HD; c, WT/SD vs. THOP1−/−/SD; d, WT/HD vs. THOP1−/−/HD (n = 4–6).
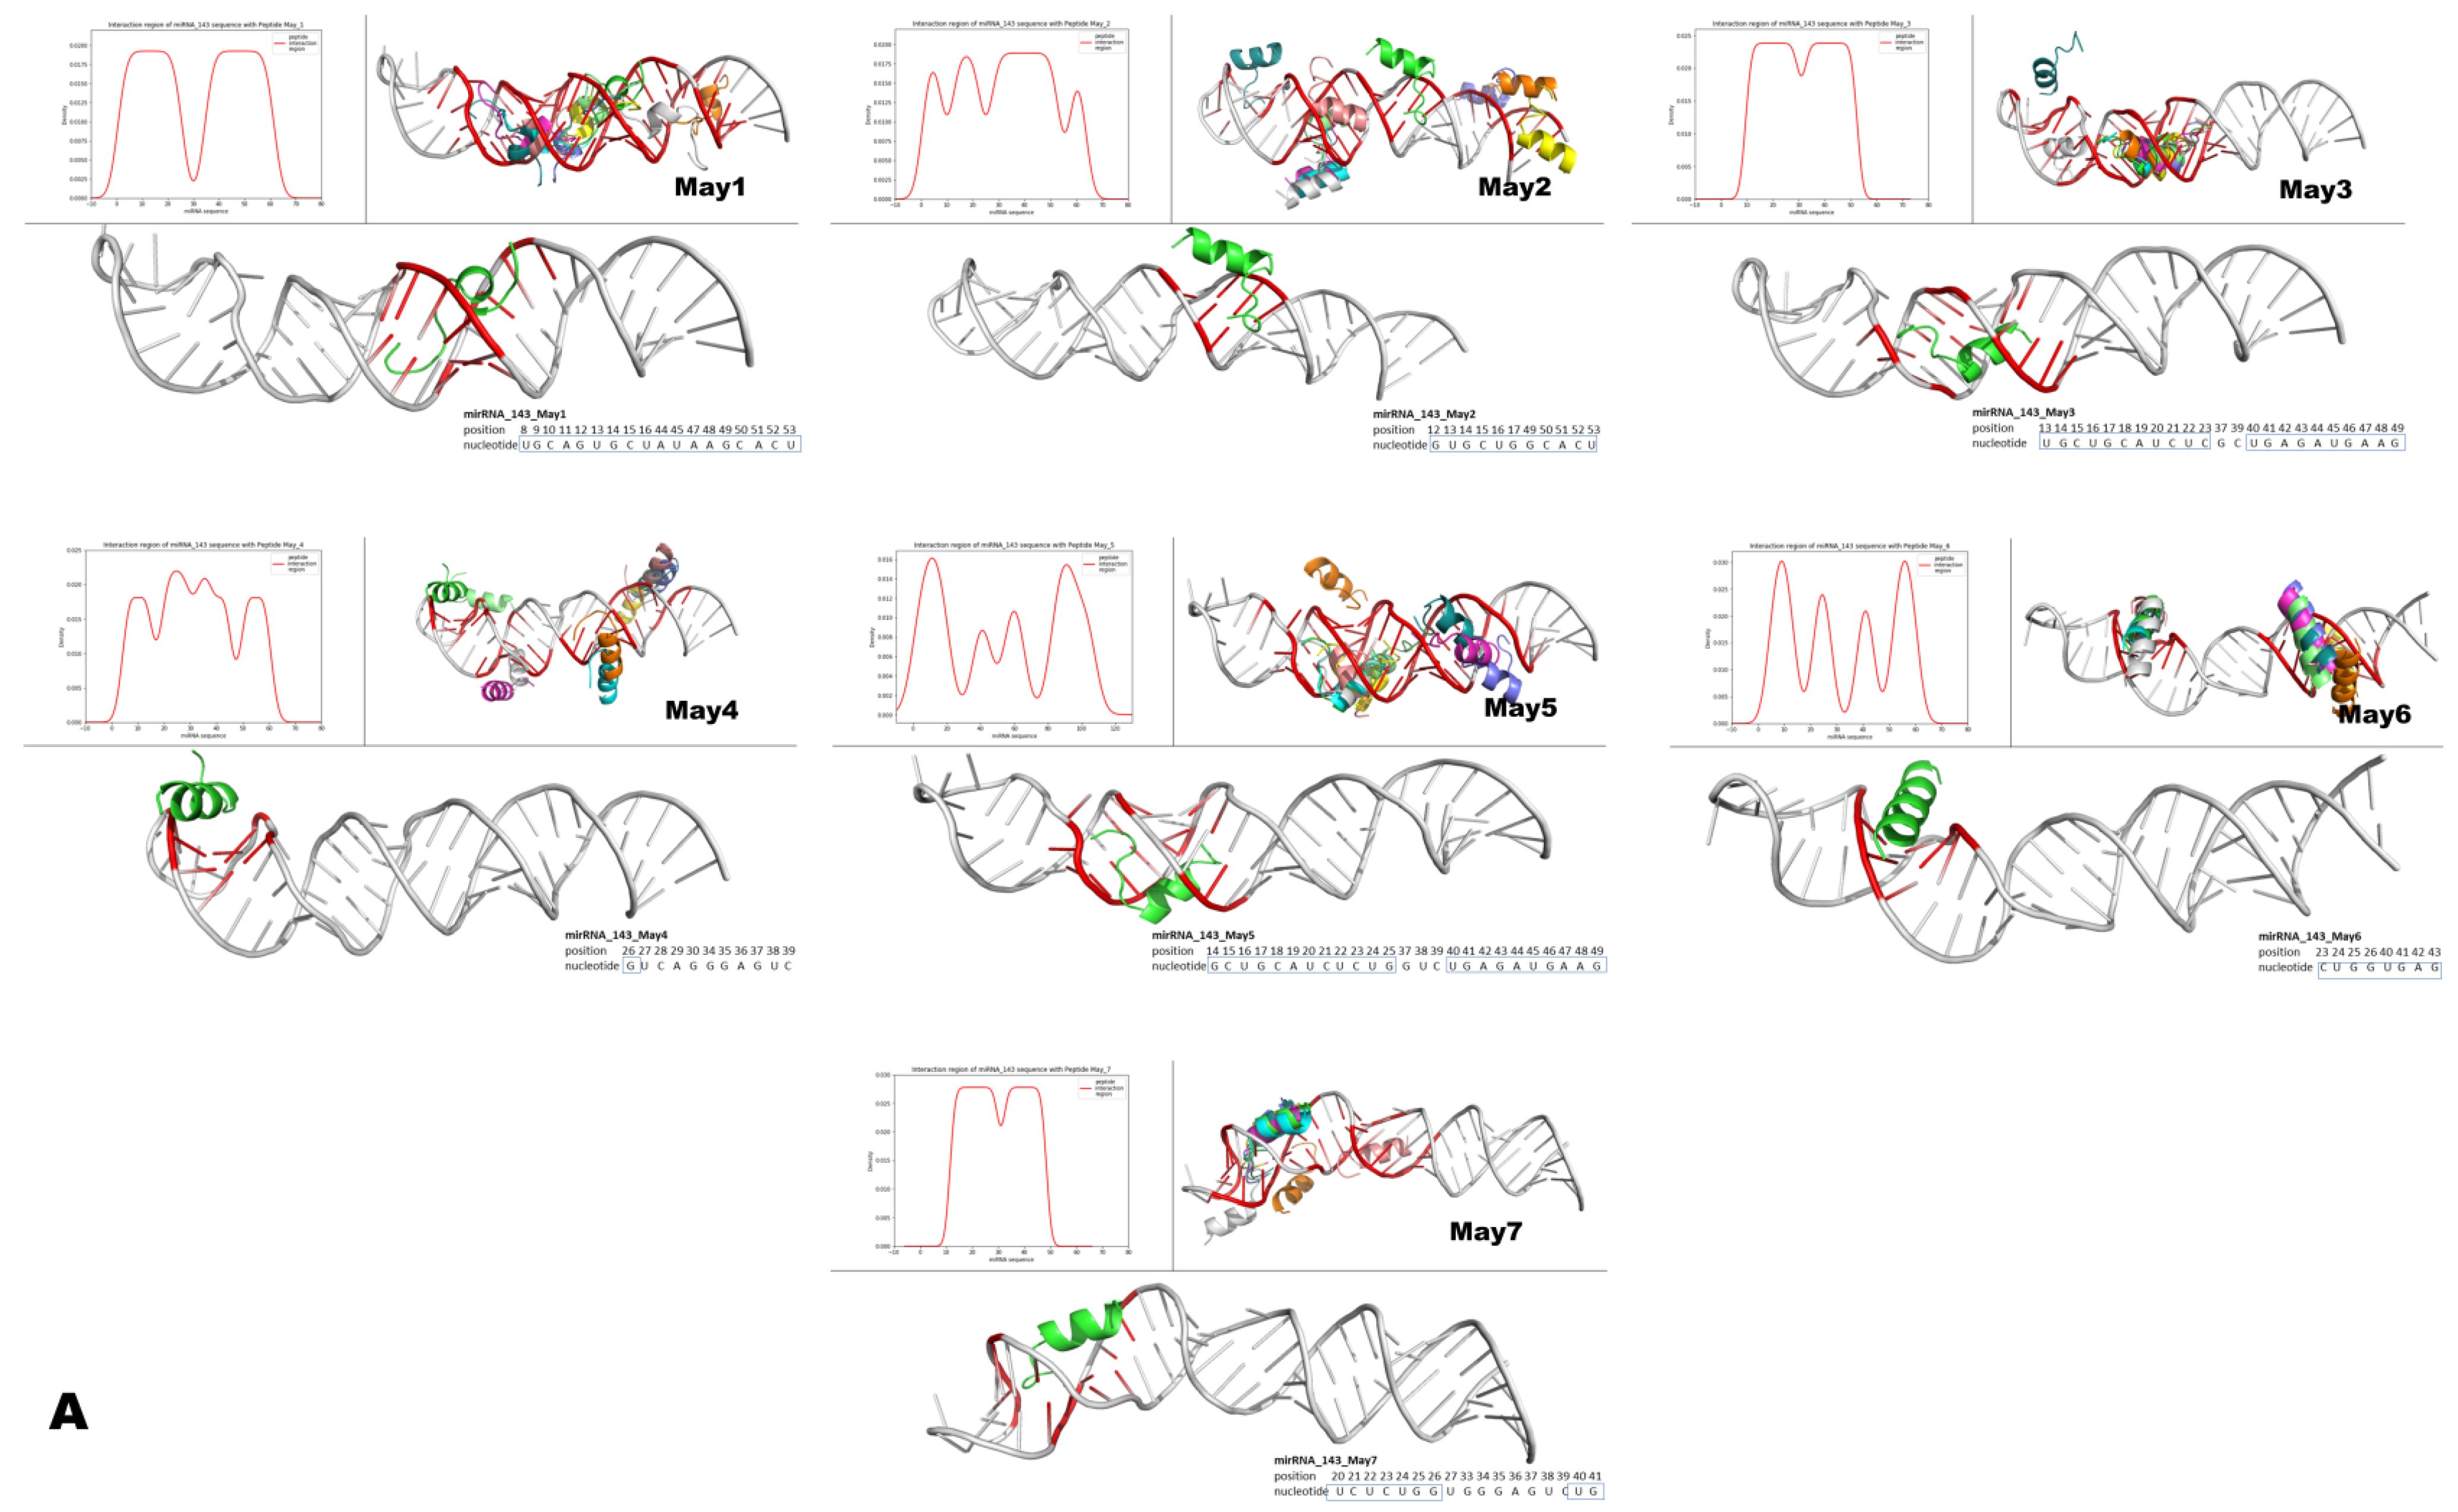
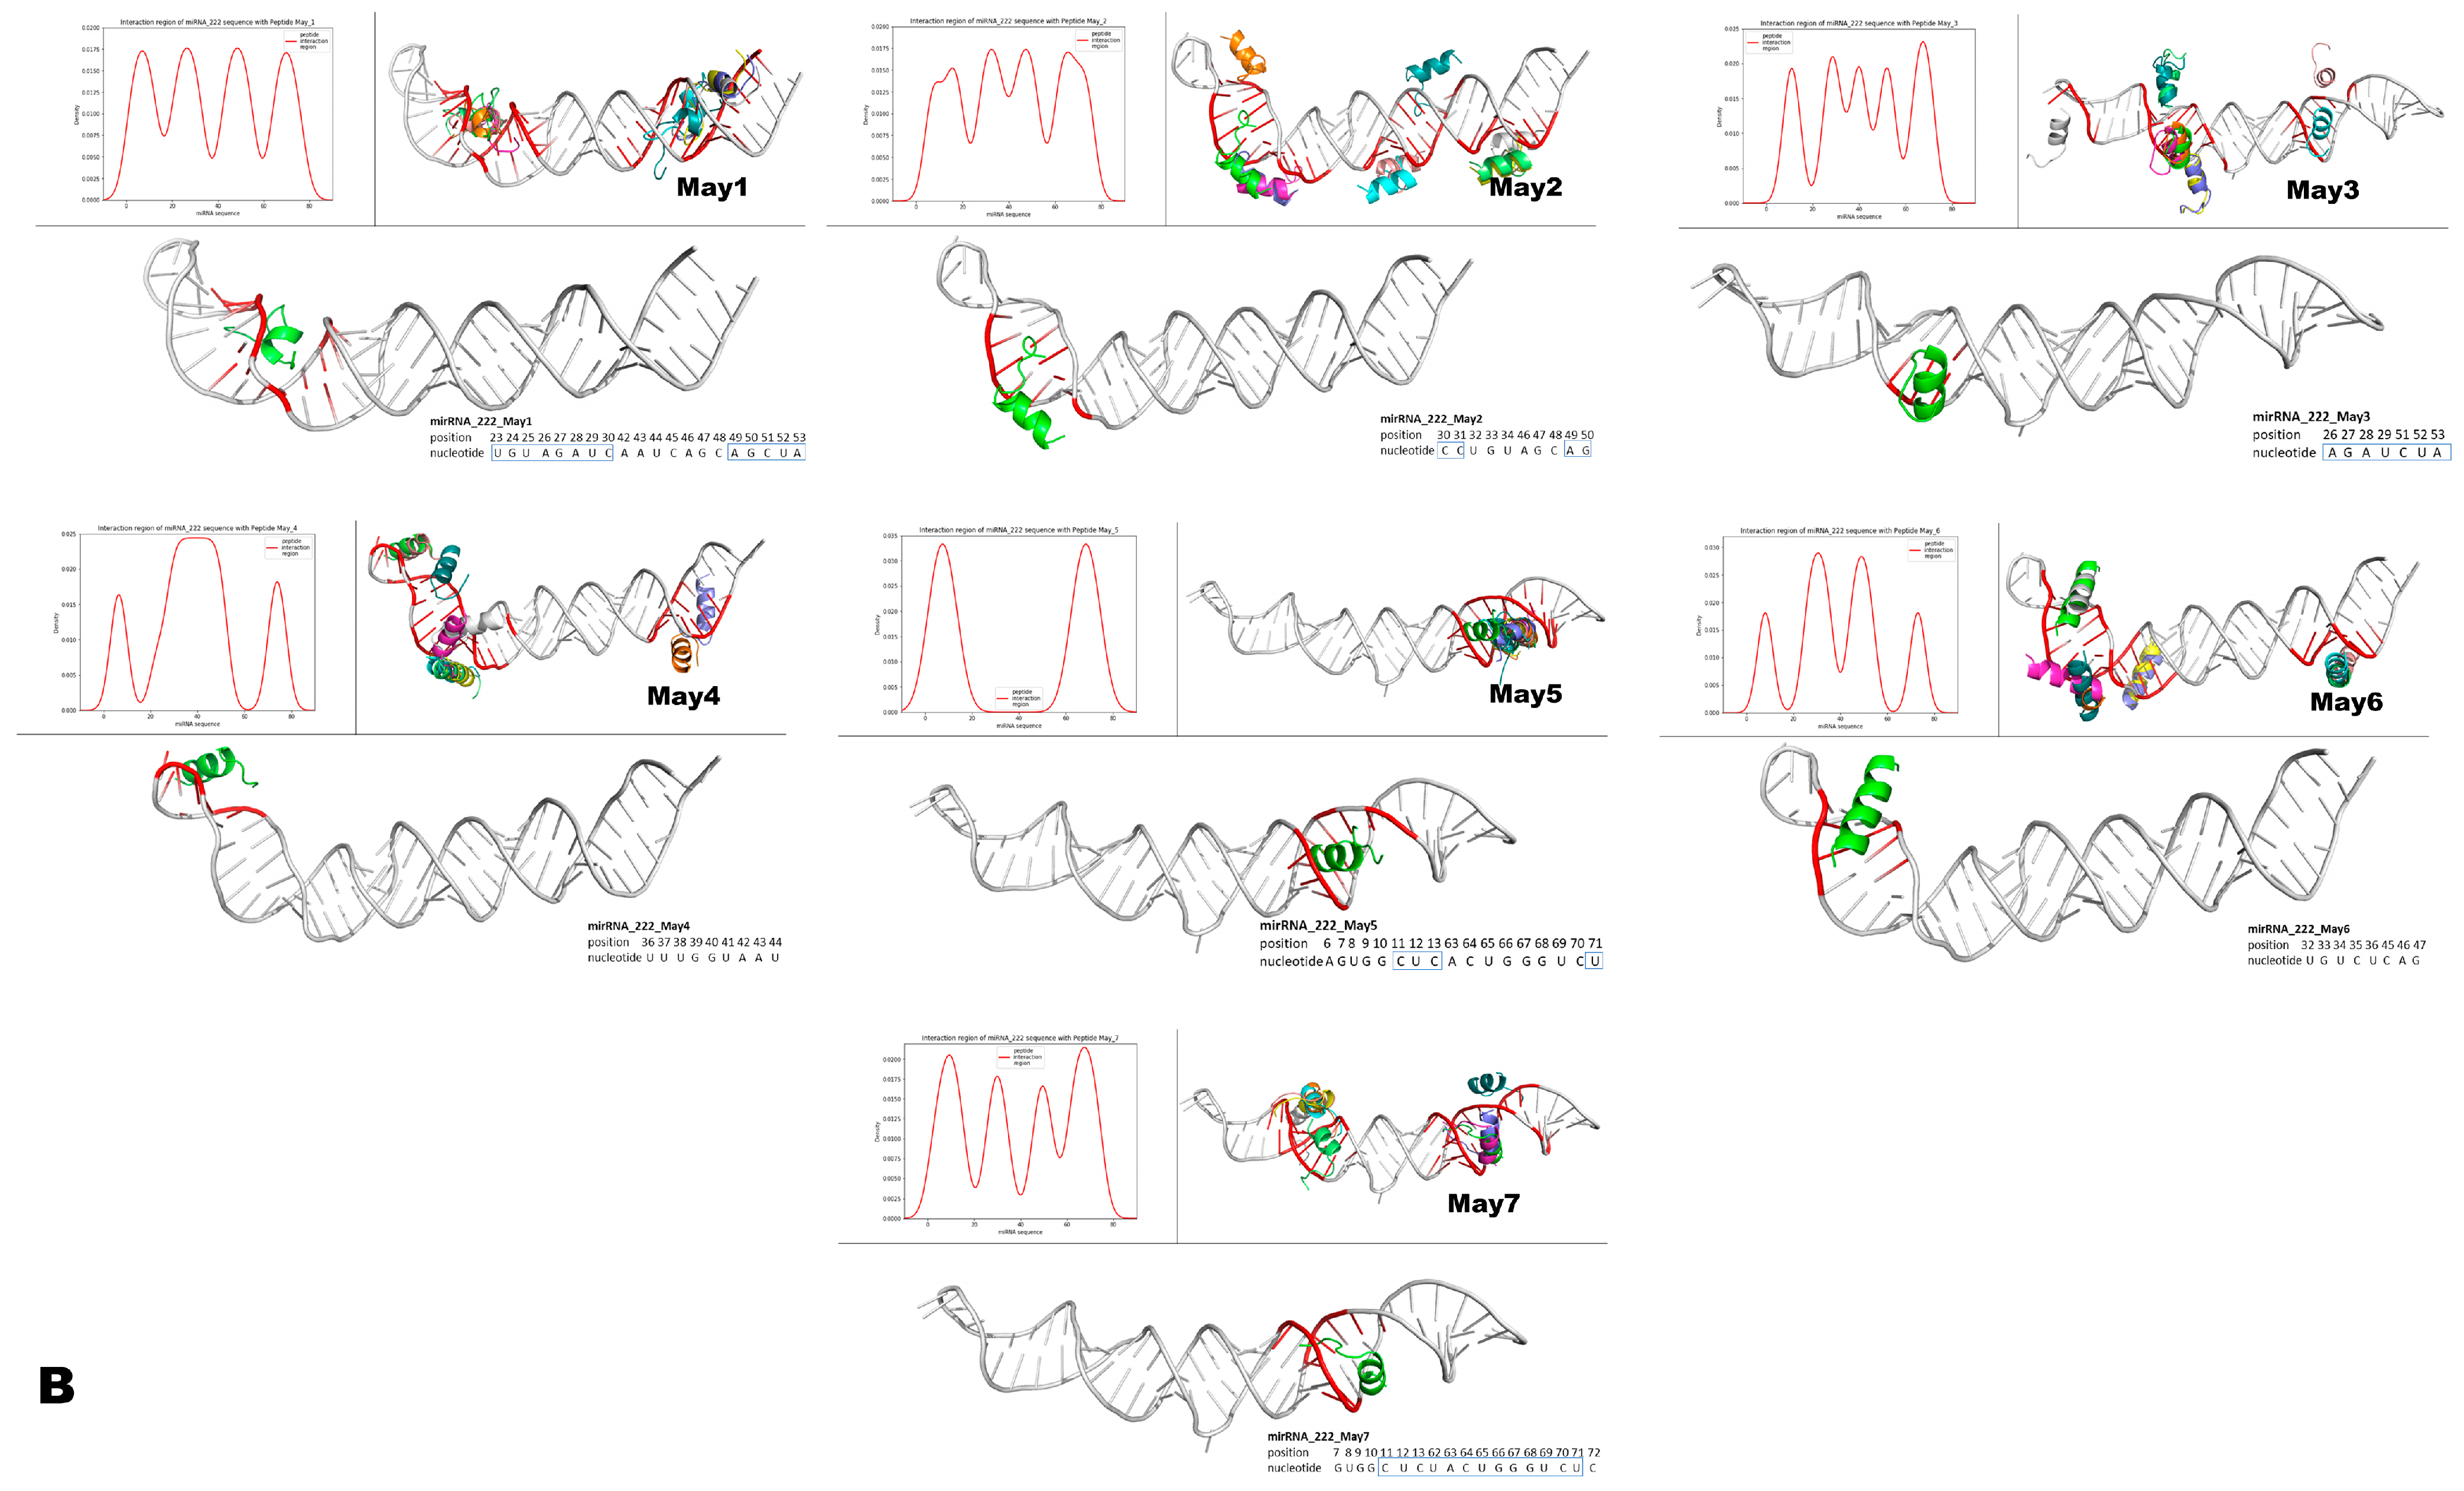
Figure 15.
Structural modeling of murine May peptides interacting with either miR-143 or miR-222. Each panel contains seven small Figures that represent, from left to right, pre-miR-143 (A) or pre-miR-222 (B) interacting with the indicated intracellular peptide (May1–May7). The top left histogram panel from each small Figure represents the different densities/theoretical affinities (shown on the y-axis) of the top 10 structures predicted for each indicated May peptide. Shown on the x-axis of the histograms are the nucleotide positions from each microRNA that interacted with the predicted structures of May peptides. Note that intracellular peptides were predicted to interact with different regions and with different affinities along the nucleotide sequences of the respective pre-microRNAs. The top right panel on each small Figure shows all of the top ten predicted peptide structures interacting with their respective pre-microRNAs. The lower larger panel shows only one predicted structure of the corresponding May peptide, which was predicted to interact with the highest affinity to the indicated region of the respective pre-microRNA. In these large panels, inside the small blue boxes, are the nucleotides from the mature microRNAs predicted to interact with the peptide of the highest affinity. Note that intracellular peptides May1–May7 frequently interacted with a large portion (both at 5p and 3p) of the mature region of these miRNAs.


Table 1.
Delta (Δ) of body weight gained from the 4th–24th week of mice fed a standard diet (SD) or a hyperlipidic diet (HD) diet.
Table 1.
Delta (Δ) of body weight gained from the 4th–24th week of mice fed a standard diet (SD) or a hyperlipidic diet (HD) diet.
| Gender/phenotype | Δ(g) SD | Δ(g) HD | Δ(g) HD − Δ(g) SD |
|---|
| WT females | 9.7 | 16.6 | 6.9 (100%) |
| THOP1−/− females | 8.0 | 11.9 | 3.9 (56%) |
| WT males | 12.3 | 26.5 | 14.2 (100%) |
| THOP1−/− males | 15.0 | 18.8 | 3.8 (27%) |
Table 2.
Biological parameters measured during the 24 weeks of the HD and standard diet (SD) diets.
Table 2.
Biological parameters measured during the 24 weeks of the HD and standard diet (SD) diets.
| | Female |
| Parameters | WT/SD | WT/HD | THOP1−/−/SD | THOP1−/−/HD |
| Body weight (g) | 24.7 ± 0.42 | 29.3 ± 1.72 a | 22.3 ± 0.2 ccc | 24.8 ± 0.59 bb;d |
| Food intake (g/day/animal) | 3.55 ± 0.15 | 2.25 ± 0.05 a | 3.2 ± 0.1 | 1.9 ± 0.1 bb |
| Water intake (mL/day/animal) | 4.05 ± 0.05 | 2.35 ± 0.3 a | 3.5 ± 0.1c | 2.55 ± 0.2 b |
| Caloric intake (kcal/day/animal) | 13.5 ± 0,6 | 12.05 ± 0.3 | 11.75 ± 0.05 | 10.35 ± 0.05 |
| Lee Index | 39.0 ± 0.43 | 43.3 ± 1.70 a | 37.1 ± 0.26 cc | 39.3 ± 0.52 bb;d |
| Liver (g) | 3.53 ± 0.11 | 2.56 ± 0.06 aaa | 3.46 ± 0.09 | 3.01 ± 0.07 bb;ddd |
| Retroperitoneal adipose tissue (g) | 0.73 ± 0.10 | 4.22 ± 0.25 aaa | 0.82 ± 0.05 | 2.00 ± 0.33 bb;ddd |
| Inguinal adipose tissue (g) | 1.12 ± 0.11 | 4.63 ± 0.28 aaa | 1.49 ± 0.09 | 2.42 ± 0.26 bb;ddd |
| Ovarian adipose tissue (g) | 1.87 ± 0.12 | 6.28 ± 0.35 aaa | 1.99 ± 0.20 | 3.59 ± 0.42 bb;ddd |
| Soleus (g) | 0.06 ± 0.003 | 0.05 ± 0.003 a | 0.07 ± 0.002 | 0.06 ± 0.001 bb;ddd |
| Gastrocnemius (g) | 1.09 ± 0.02 | 0.75 ± 0.02 aaa | 1.00 ± 0.03 | 0.83 ± 0.12 |
| | Male |
| Parameters | WT/SD | WT/HD | THOP1−/−/SD | THOP1−/−/HD |
| Body weight (g) | 27.7 ± 0.28 | 42.0 ± 0.8 aaa | 30.1 ± 0.5 cc | 32.6 ± 0.74 b;ddd |
| Food intake (g/day/animal) | 3.5 ± 0.2 | 2.5 ± 0.2 | 3.4 ± 0.1 | 2.5 ± 0.2 |
| Water intake (mL/day/animal) | 3.65 ± 0.05 | 2.55 ± 0.6 bb | 3.45 ± 0.05 | 2.65 ± 0.5 |
| Caloric intake (kcal/day/animal) | 13.25 ± 0.7 | 13.45 ± 1.0 | 12.8 ± 0.3 | 13.8 ± 0.1 |
| Lee index | 42.2 ± 0.24 | 55.8 ± 0.82 aaa | 44.2 ± 0.48 cc | 46.5 ± 0.70 b;ddd |
| Liver (g) | 3.77 ± 0.07 | 4.60 ± 0.25 aa | 3.87 ± 0.10 | 3.09 ± 0.08 bbb;ddd |
| Retroperitoneal adipose tissue (g) | 0.94 ± 0.13 | 3.11 ± 0.19 aaa | 0.44 ± 0.05 cc | 1.03 ± 0.18 bb;ddd |
| Inguinal adipose tissue (g) | 1.35 ± 0.06 | 4.83 ± 0.19 aaa | 0.92 ± 0.04 ccc | 1.40 ± 0.17 b;ddd |
| Epididymal adipose tissue (g) | 1.87 ± 0.11 | 3.07 ± 0.23 aaa | 1.41 ± 0.13 c | 2.58 ± 0.36 bb |
| Soleus (g) | 0.06 ± 0.001 | 0.05 ± 0.002 aaa | 0.07 ± 0.003 | 0.05 ± 0.001 bb;d |
| Gastrocnemius (g) | 1.07 ± 0.02 | 0.72 ± 0.01 aaa | 1.06 ± 0.01 | 0.99 ± 0.02 b;ddd |
Table 3.
Systolic blood pressure (mmHg) and heart rate (bpm).
Table 3.
Systolic blood pressure (mmHg) and heart rate (bpm).
| | Systolic Blood Pressure (mmHg) | Heart Rate (bpm) |
|---|
| | 20th Week | 24th Week | 20th Week | 24th Week |
|---|
| WT/SD | 101.1 ± 2.91 | 95.99 ± 0.86 | 748.1 ± 12.50 | 766.5 ± 8.88 |
| WT/HD | 105.1 ± 4.42 | 97.19 ± 2.32 | 751.3 ± 7.58 | 761.7 ± 9.85 |
| THOP1−/−/SD | 111.3 ± 1.82 | 107.5 ± 3.15 | 724.8 ± 6.67 | 708.5 ± 37.28 |
| THOP1−/−/HD | 99.87 ± 6.55 | 102.0 ± 7.79 | 723.9 ± 13.82 | 695.6 ± 64.86 |
Table 4.
Biochemical parameters of WT and THOP1−/− mice fed an SD or a HD.
Table 4.
Biochemical parameters of WT and THOP1−/− mice fed an SD or a HD.
| | Female |
| Parameters | WT/SD | WT/HD | THOP1−/−/SD | THOP1−/−/HD |
| Total cholesterol | 118.5 ± 6.9 | 151.4 ± 9.9 a | 115.9 ± 6.8 | 143.9 ± 16.4 |
| Triglycerides | 111.5 ±13.0 | 134.4 ± 17.4 | 132.1 ± 12.5 | 101.5 ± 8.6 |
| HDL | 58.5 ± 18.9 | 95.9 ± 18.0 | 30.6 ± 3.0 | 46.4 ± 11.0 d |
| | Male |
| Parameters | WT/SD | WT/HD | THOP1−/−/SD | THOP1−/−/HD |
| Total cholesterol | 109.0 ± 5.7 | 235.8 ± 8.7 aaa | 132.8 ± 11.85 | 139.4 ± 7.2 ddd |
| Triglycerides | 115.7 ± 11.7 | 100.4 ± 1.7 | 151.5 ± 8.2 c | 126.4 ± 5.8 b,d |
| HDL | 68.3 ± 3.8 | 61.3 ± 0.2 | 63.9 ± 3.8 | 68.9 ± 2.8 |
Table 5.
Multiplex immunoassay in serum samples from WT and THOP1−/− mice fed an SD or a HD.
Table 5.
Multiplex immunoassay in serum samples from WT and THOP1−/− mice fed an SD or a HD.
| | Female |
| Hormones | WT/SD | WT/HD | THOP1−/−/SD | THOP1−/−/HD |
| Insulin (pg/mL) | 120.8 ± 7.5 | 459.9 ± 75.8 aaa | 95.10 ± 16.5 | 106.5 ± 17.8 dd |
| Resistin (pg/mL) | 3756 ± 536.2 | 10458 ± 1648 aa | 3957 ± 300.4 | 4845 ± 624.4 dd |
| Ghrelin (pg/mL) | 905.6 ± 105.3 | 485.9 ± 55.0a | 710.8 ± 221.6 | 713.8 ± 211.8 |
| | Male |
| Hormones | WT/SD | WT/HD | THOP1−/−/SD | THOP1−/−/HD |
| Insulin (pg/mL) | 223.0 ± 39.0 | 1901 ± 255.0 aaa | 148.0 ± 40.7 | 235.9 ±103.2 ddd |
| Resistin (pg/mL) | 2437 ± 140.1 | 8588 ± 506.0 aaa | 2837 ± 223.3 | 3417 ± 223.3 ddd |
| Ghrelin (pg/mL) | 552.2 ± 36.24 | 197.8 ± 29.4 aaa | 604.4 ± 88.9 | 701.7 ± 54.4 ddd |
Table 6.
Analyses of gene expression by qRT-PCR in male mice livers.
Table 6.
Analyses of gene expression by qRT-PCR in male mice livers.
| | Male |
|---|
| Gene | WT/SD | WT/HD | THOP1−/−/SD | THOP1−/−/HD |
|---|
| PPAR-α | 1.13 ± 0.24 | 1.15 ± 0.27 | 1.11 ± 0.10 | 0.99 ± 0.18 |
| PPAR-γ | 1.11 ± 0.24 | 1.58 ± 0.18 | 0.85 ± 0.06 | 0.70 ± 0.04 dd |
| PGC-1α | 1.10 ± 0.23 | 0.70 ± 0.09 | 1.01 ± 0.10 | 1.53 ± 0.37 |
| FAS | 1.19 ± 0.33 | 1.55 ± 0.28 | 1.00 ± 0.05 | 0.74 ± 0.10 d |
| LPL | 1.08 ± 0.17 | 1.28 ± 0.15 | 1.31 ± 0.16 | 1.52 ± 0.20 |
| CD36 | 1.18 ± 0.31 | 1.87 ± 0.15 | 0.43 ± 0.05 c | 0.27 ± 0.01 b;ddd |
Table 7.
Analyses of gene expression by qRT-PCR in inguinal adipose tissue.
Table 7.
Analyses of gene expression by qRT-PCR in inguinal adipose tissue.
| | FEMALE |
| Gene | WT/SD | WT/HD | THOP1−/−/SD | THOP1−/−/HD |
| PPAR-α | 1.22 ± 0.46 | 4.02 ± 1.02a | 1.03 ± 0.14 | 4.45 ± 1.17b |
| PPAR-γ | 1.01 ± 0.06 | 0.68 ± 0.05aa | 0.37 ± 0.13cc | 0.57 ± 0.17 |
| FAS | 1.23 ± 0.47 | 0.78 ± 0.28 | 0.56 ± 0.12 | 1.01 ± 0.58 |
| LPL | 1.01 ± 0.08 | 0.68 ± 0.13 | 0.21 ± 0.07ccc | 0.59 ± 0.18 |
| CD36 | 1.01 ± 0.08 | 0.85 ± 0.10 | 0.23 ± 0.07ccc | 0.67 ± 0.13b |
| CD206 | 1.03 ± 0.12 | 1.26 ± 0.17 | 0.40 ± 0.08cc | 0.82 ± 0.21 |
| CD11C | 1.01 ± 0.08 | 8.36 ± 2.10aa | 2.48 ± 0.53c | 1.45 ± 0.45d |
| F4/80 | 1.02 ± 0.10 | 2.86 ± 0.54a | 0.59 ± 0.09c | 1.35 ± 0.43 |
| | MALE |
| Gene | WT/SD | WT/HD | THOP1−/−/SD | THOP1−/−/HD |
| PPAR-α | 1.00 ± 0.04 | 1.51 ± 0.24 | 0.99 ± 0.27 | 1.67 ± 0.65 |
| PPAR-γ | 1.03 ± 0.10 | 0.51 ± 0.02aa | 0.96 ± 0.08 | 1.10 ± 0.07ddd |
| FAS | 1.05 ± 0.14 | 0.27 ± 0.03aaa | 0.78 ± 0.15 | 1.06 ± 0.16ddd |
| LPL | 1.08 ± 0.16 | 0.58 ± 0.09a | 0.47 ± 0.07cc | 0.90 ± 0.10bb; d |
| CD36 | 1.05 ± 0.12 | 0.77 ± 0.06 | 0.59 ± 0.04cc | 0.96 ± 0.04bbb; d |
| CD206 | 1.01 ± 0.07 | 1.28 ± 0.06a | 0.36 ± 0.06cc | 0.85 ± 0.08bb; d |
| CD11C | 1.02 ± 0.08 | 6.48 ± 0.47aaa | 0.34 ± 0.08ccc | 0.27 ± 0.03ddd |
| F4/80 | 1.14 ± 0.31 | 2.16 ± 0.14a | 0.30 ± 0.04c | 0.47 ± 0.03b; ddd |
Table 8.
Intracellular peptides semi-quantitatively identified in inguinal adipose tissue of WT or THOP1−/− mice.
Table 8.
Intracellular peptides semi-quantitatively identified in inguinal adipose tissue of WT or THOP1−/− mice.
| Precursor Protein Name | Peptide Sequence | Subcellular Localization | Ratio THOP1−/−/SD to WT/SD ± SEM (n) | Ratio THOP1−/−/HD to WT/HD ± SEM (n) |
|---|
| Macrophage migration inhibitory factor | LSELTQQLAQATGKPAQ | C | 13.35 ± 3.5 (3) | 12.16 ± 3.9 (3) |
| Histone H2A type 1-B | AQGGVLPNIQAVLLPK (May1) IP pH 10 | N | 9.75 ± 4.7 (5) | 19.58 ± 8.14 (5) |
| Histone H2B type 2-B | KQVHPDTGISSKAMGIMNS | N | 20.59 ± 4.3 (4) | 16.65 ± 2.6 (4) |
| Elongation factor 2 | ASVLTAQPRLMEPI | C | 4.35 ± 0.8 (3) | 7.74 ± 0.8 (3) |
| Creatine kinase M-type | DISNADRLGSSEVEQ | C | 8.17 ± 2.1 (3) | 15.66 ± 7.9 (3) |
| Creatine kinase M-type | DISNADRLGSSEVEQV | C | 11.21 ± 3.8 (3) | 12.32 ± 3.5 (3) |
| Creatine kinase M-type | IDDHFLFDKPVSPLL | C | 14.31 ± 5.0 (4) | 6.60 ± 1.7 (4) |
| Apolipoprotein A-I | LETLKTQVQSVIDKA (May6) IP pH 6.9 | SP | 4.25 ± 1.1 (4) | 0.42 ± 0.07 (4) |
| Apolipoprotein A-II | FSSLMNLEEKPAPAA (May3) IP pH 4.2 | SP | 10.59 ± 6.3 (5) | 0.27 ± 0.04 (5) |
| Apolipoprotein A-II | HEQLTPLVRSAGTSLVN (May5) IP pH 7.6 | SP | 5.07 ± 1.3 (4) | 0.20 ± 0.03 (4) |
| Serum albumin | SQTFPNADFAEITKL (May7) IP pH 3.9 | SP | 12.01 ± 1.6 (4) | 0.38 ± 0.04 (4) |
| Non-specific lipid-transfer protein | ADSDLLALMTGKMNPQSA (May2) IP pH 3.7 | P | 6.7 ± 1.8 (3) | 0.49 ± 0.08 (3) |
| Hemoglobin subunit alpha | GAEALERMFASFPTTK (May4) IP pH 7.0 | C | 6.33 ± 4.4 (3) | 0.18 ± 0.05 (3) |
| Hemoglobin subunit alpha | FDVSHGSAQVK | C | 0.43 ± 0.06 (3) | 0.29 ± 0.06 (3) |
| Hemoglobin subunit alpha | IGGHGAEYGAEALER | C | 0.58 ± 0.1 (4) | 0.23 ± 0.05 (4) |
| Hemoglobin subunit alpha | SVSTVLTSK | C | 0.66 ± 0.1 (3) | 0.25 ± 0.03 (3) |
| Acyl-CoA-binding protein | QATVGDVNTDRPGLLDLKGK | C | 0.71 ± 0.1 (3) | 0.19 ± 0.04 (3) |

 ,
, 


