Article

Dual Effects of Beta-Hydroxy-Beta-Methylbutyrate (HMB) on Amino Acid, Energy, and Protein Metabolism in the Liver and Muscles of Rats with Streptozotocin-Induced Type 1 Diabetes

by
Milan Holeček
*,
Melita Vodeničarovová
and
Radana Fingrová
Department of Physiology, Faculty of Medicine, Charles University, 500 38 Hradec Králové, Czech Republic
*
Author to whom correspondence should be addressed.
Biomolecules 2020, 10(11), 1475; https://doi.org/10.3390/biom10111475
Submission received: 30 September 2020 / Revised: 20 October 2020 / Accepted: 21 October 2020 / Published: 23 October 2020
(This article belongs to the Section Cellular Biochemistry)

Abstract

:
Beta-hydroxy-beta-methyl butyrate (HMB) is a unique product of leucine catabolism with positive effects on protein balance. We have examined the effects of HMB (200 mg/kg/day via osmotic pump for 7 days) on rats with diabetes induced by streptozotocin (STZ, 100 mg/kg intraperitoneally). STZ induced severe diabetes associated with muscle wasting, decreased ATP in the liver, and increased α-ketoglutarate in muscles. In plasma, liver, and muscles increased branched-chain amino acids (BCAAs; valine, isoleucine, and leucine) and decreased serine. The decreases in mass and protein content of muscles and increases in BCAA concentration were more pronounced in extensor digitorum longus (fast-twitch muscle) than in soleus muscle (slow-twitch muscle). HMB infusion to STZ-treated animals increased glycemia and serine in the liver, decreased BCAAs in plasma and muscles, and decreased ATP in the liver and muscles. The effects of HMB on the weight and protein content of tissues were nonsignificant. We concluded that fast-twitch muscles are more sensitive to STZ than slow-twitch muscles and that HMB administration to STZ-treated rats has dual effects. Adjustments of BCAA concentrations in plasma and muscles and serine in the liver can be considered beneficial, whereas the increased glycemia and decreased ATP concentrations in the liver and muscles are detrimental.

1. Introduction

Characteristic features of untreated type 1 diabetes mellitus (T1DM) are hyperglycemia, glycosuria, preferential use of fatty acids as a source of energy, and the loss of body weight associated with reduced muscle mass, muscle weakness, altered function of mitochondria, and overall reduced physical capacity [1,2,3]. Unfortunately, there is accumulating evidence of the limitations of exogenous insulin therapy of T1DM that result in bouts of dysglycemia, dyslipidemia, and insulin resistance, which contribute to the development of long-term diabetic complications, including cardiovascular disease, neuropathy, nephropathy, impaired protein synthesis, and loss of muscle tissue [4,5]. Therefore, there is a strong need for therapeutic approaches to improve diabetes therapies and reduce the incidence of diabetic complications.
Among the substances that can affect skeletal muscles and BCAA metabolism is β-hydroxy-β-methyl butyrate (HMB), a unique metabolite of leucine catabolism. HMB has been shown to decrease proteasome and caspase enzyme activities and reduce the apoptosis of myonuclei [6,7,8]. In humans, positive effects were observed in AIDS- and cancer-related cachexia, pulmonary disease, hip fracture, and other catabolic conditions [9,10,11,12]. Unfortunately, there is little data on the effect of HMB on diabetes. Duan et al. [13] have demonstrated that HMB is more potent than its precursors leucine and ketoisocaproate (KIC) in inhibiting muscle protein degradation, regardless of the presence of insulin. Oral supplementation with a combination of HMB, arginine, and glutamine had beneficial effects on wound healing in diabetic hemodialysis patients [14].
An aspect that has received particular attention in relation to diabetes is the marked increase in plasma concentration of branched-chain amino acids (BCAAs; valine, isoleucine, and leucine), well documented in both T1DM and type 2 diabetes (T2DM) [15,16,17,18]. Recent studies of obesity and subjects with T2DM have suggested that increased BCAA levels play a role in the development of insulin resistance and complications associated with diabetes [18,19,20,21]. However, surprisingly, the pathogenesis of increased BCAA levels has not been clarified in either T1DM or in T2DM.
The aim of our study was to examine how the alterations induced by diabetes might be affected by HMB therapy. We focused on changes in protein and energy balance and amino acid concentrations in plasma, liver, and muscles. We used an animal model of T1DM induced by a single dose of streptozotocin (STZ), which is frequently used for induction of T1DM in rats and mice [22]. Because slow- and fast-twitch fibers exert different sensitivity to various disorders, including diabetes [23,24,25,26,27], musculus soleus (SOL, slow-twitch, red muscle) and musculus extensor digitorum longus (EDL, fast-twitch muscle) were examined.

2. Materials and Methods

2.1. Animals and Materials

Male Wistar rats (Charles River, Sulzfeld, Germany) weighing approximately 200 g were housed in standardized cages in quarters with controlled temperature and a 12 h light–dark cycle. Rats were maintained on an ST-1 (Velas, Lysa nad Labem, Czech Republic) standard laboratory diet containing (w/w) 24% nitrogenous compounds, 4% fat, 70% carbohydrates, and 2% minerals and vitamins, and were provided drinking water ad libitum. The Animal Care and Use Committee of Charles University, Faculty of Medicine in Hradec Kralove (license no. 144879/2011-MZE-17214) approved this study on November 1, 2016 (identification code MSMT-33747/2016-4).
Streptozotocin (STZ) was purchased from Sigma-Aldrich (St. Louis, MO, USA), HMB (calcium salt) from Santa Cruz Biotechnology (Dallas, TX, USA), and osmotic pumps from Alzet Osmotic Pumps (Cupertion, CA, USA). Other chemicals were obtained from Sigma-Aldrich (St. Louis, MO, USA), Lachema (Brno, Czech Republic), Waters (Milford, MA, USA), Biomol (Hamburg, Germany), and Merck (Darmstadt, Germany).

2.2. Study Design

After 7 days of acclimatization, the rats were randomly assigned to 3 groups. Two groups received a single intraperitoneal injection of STZ (100 mg/kg b.w.) diluted in freshly prepared sterile citrate buffer (0.1 M, pH 4.5), while vehicle was injected into control animals. From day 3 onwards, half of the STZ-treated animals received HMB (200 mg/kg/day) using osmotic pumps placed subcutaneously between the shoulders for 7 days, while vehicle was administered to the remaining animals. Thus, three groups of animals were established: a control group (n = 8), an STZ-treated group (STZ, n = 9), and a group treated with both STZ and HMB (STZ + HMB, n = 8). The dose of STZ was selected based on data from the literature [15,28], and the dose of HMB was selected based on our previous studies [29,30].
At the end of the study, under inhalation anesthesia with 3% isoflurane, the overnight-fasted animals were euthanized by exsanguination from abdominal aorta. The liver, soleus (SOL, slow-twitch, red muscle), and extensor digitorum longus (EDL, fast-twitch, white muscle) muscles were quickly removed and weighed. Small pieces (~0.1 g) of the tissues were immediately frozen in liquid nitrogen. Blood was collected in heparinized tubes and immediately centrifuged for 15 min at 2200× g using a refrigerated centrifuge, and the blood plasma was transferred into clean polypropylene tubes. Urine samples were collected from urine excreted during the last 2 h before euthanasia.

2.3. Biochemical Markers in Blood Plasma and Urine

Plasma insulin concentration was measured using a rat insulin ELISA kit (Thermo Fisher Scientific, Waltham, MA, USA). Commercial tests purchased from Lachema (Brno, CR) and Sigma-Aldrich (St. Louis, MO, USA) were used for measurement of glucose, urea, creatinine, total protein, and albumin concentrations in blood plasma and/or urine.

2.4. Protein Content in Tissues

Protein content in tissues was measured according to Lowry et al. [31]. The results were expressed per gram of wet tissue and per kilogram of body weight.

2.5. Amino Acids, Pyruvate, and Branched-Chain Keto Acids (BCKAs) in Blood Plasma and Tissues

Concentrations of amino acids, pyruvate, and BCKAs were determined in supernatants of deproteinized samples of blood plasma and tissues by high-performance liquid chromatography (HPLC) (Aliance 2695, Waters, Milford, MA, USA). Amino acid concentrations were measured after derivatization with 6-aminoquinolyl-N-hydroxysuccinimidyl carbamate using norleucine as an internal standard. o-Phenylenediamine derivatization was used for determination of pyruvate and BCKA (BCKA concentrations in the liver were undetectable). The quinoxalinol derivatives of BCKA were detected using fluorescence with emission and excitation at 410 nm and 350 nm, respectively. The results were expressed per liter of blood plasma or gram of wet tissue.

2.6. Adenine Nucleotides

ATP, ADP, and AMP concentrations in the liver and muscles were measured using HPLC. Reversed phase HPLC (Alliance 2695, Waters, Milford, MA, USA) combined with ultraviolet detection was used for the determination of nucleotide concentrations, as described previously [32]. The results were expressed in µmol/g of wet tissue. Energy charge (EC) was calculated according the formula by Atkinson [33]: EC = (ATP + ½ ADP)/(ATP + ADP + AMP).

2.7. Tricarboxylic Acid (TCA) Cycle Intermediates in Blood Plasma and Tissues

TCA cycle components, including α-KG, malate, fumarate, oxaloacetate, and cis-aconitate, were quantified by HPLC (Aliance 2695, Waters, Milford, MA, USA) with a YMC-Triart C18 analytical column operated in isocratic mode with 20 mM potassium phosphate buffer (pH 2.9). The wavelength for detection was set at 210 nm. The results were expressed as µmol/g of wet tissue.

2.8. Statistical Analysis

The results are expressed as the means ± standard error (SE). Analysis of variance (ANOVA) followed by a Bonferroni multiple comparisons procedure was used to detect differences with a significance level of p ˂ 0.05. The statistical software NCSS 2001 (Kaysville, UT, USA) was used for the analyses.

3. Results

3.1. Biochemical Markers in Blood Plasma and Urine

All STZ-treated rats became hyperglycemic, with insulin concentrations 10% those of controls (Table 1). STZ treatment led to increased concentrations of urea and ammonia and decreased concentrations of creatinine, total proteins, and albumins in blood plasma. In addition, STZ treatment led to markedly increased excretion of urea and glucose via urine.
In diabetic animals treated with HMB, we found higher plasma concentration of glucose, lower plasma concentrations of albumins, and lower glucose excretion via urine than those observed in diabetic animals without HMB treatment.

3.2. Body Weight, Food Intake, and Weights and Protein Contents of Tissues

There were no differences in animal weight among the experimental groups at the beginning of the study (Table 2). On the last day of the experiment, the body weights of animals with diabetes were lower than those of controls, although food intake was markedly increased in the STZ-treated animals. In STZ-treated animals, the masses and protein contents of the liver and muscles were lower than those of controls. However, the relative values (per kilogram of body weight) of the liver and SOL, but not EDL, were higher in STZ-treated animals than controls.
The effects of HMB on gain of body weight, food intake, and weights and protein contents of tissues of STZ-treated animals were nonsignificant.

3.3. Amino Acid Concentrations in Blood Plasma

Higher concentrations of BCAAs, phenylalanine, ornithine, citrulline, and taurine, and lower concentrations of aspartate, glutamate, glutamine, glycine, and serine were found in blood plasma in both of the STZ-treated groups than in the with controls. In the STZ + HMB group, BCAA and taurine concentrations were significantly lower and glutamine concentration was significantly higher than in the STZ group (Table 3).

3.4. Amino Acid Concentrations in Liver

Increased valine concentrations and decreased concentrations of histidine, asparagine, aspartate, glutamine, glycine, tyrosine, and serine in liver were found in the STZ-treated animals compared with those in the controls. In the STZ + HMB group, higher serine concentration was found when compared with the STZ group without HMB (Table 4).

3.5. Amino Acid Concentrations in Muscles

Marked increases in the concentrations of all three BCAA and phenylalanine were found in both muscles in STZ-treated rats compared with those in control rats (Table 5 and Table 6). The increase in BCAA was more pronounced in EDL (~80%) than in SOL (~50%). In both muscles in STZ-treated rats, decreased concentrations of glutamine, glycine, and serine were found compared with those in control rats. In SOL, alanine, aspartate, and glutamate concentrations were also decreased, whereas in EDL, the proline concentration was increased. HMB therapy attenuated the increase in BCAA concentration induced by STZ treatment in both muscles and decreased aspartate in EDL.

3.6. BCKA Concentrations in Blood Plasma and Muscles

Decreased concentrations of BCKAs in blood plasma were found in STZ-treated animals compared with controls. In EDL, the concentrations of all three BCKAs were increased; in SOL, only α-ketoisocaproate(KIC) was increased, whereas α-ketoisovalerate (KIV) was decreased. The effects of HMB infusion were nonsignificant, with the exception of a decreased KIC concentration in SOL (Table 7).

3.7. Pyruvate and Intermediates of TCA Cycle

Pyruvate concentration decreased in blood plasma of STZ-treated animals when compared with controls and in EDL of diabetic animals treated by HMB when compared with the STZ group (Table 8). Inconsistent alterations in the concentrations of intermediates of the TCA cycle were observed in STZ-treated animals. Whereas α-KG concentration increased in both muscles, concentrations of other intermediates tended to decrease. The effects of HMB were nonsignificant, with the exception of decreased fumarate concentration in EDL.

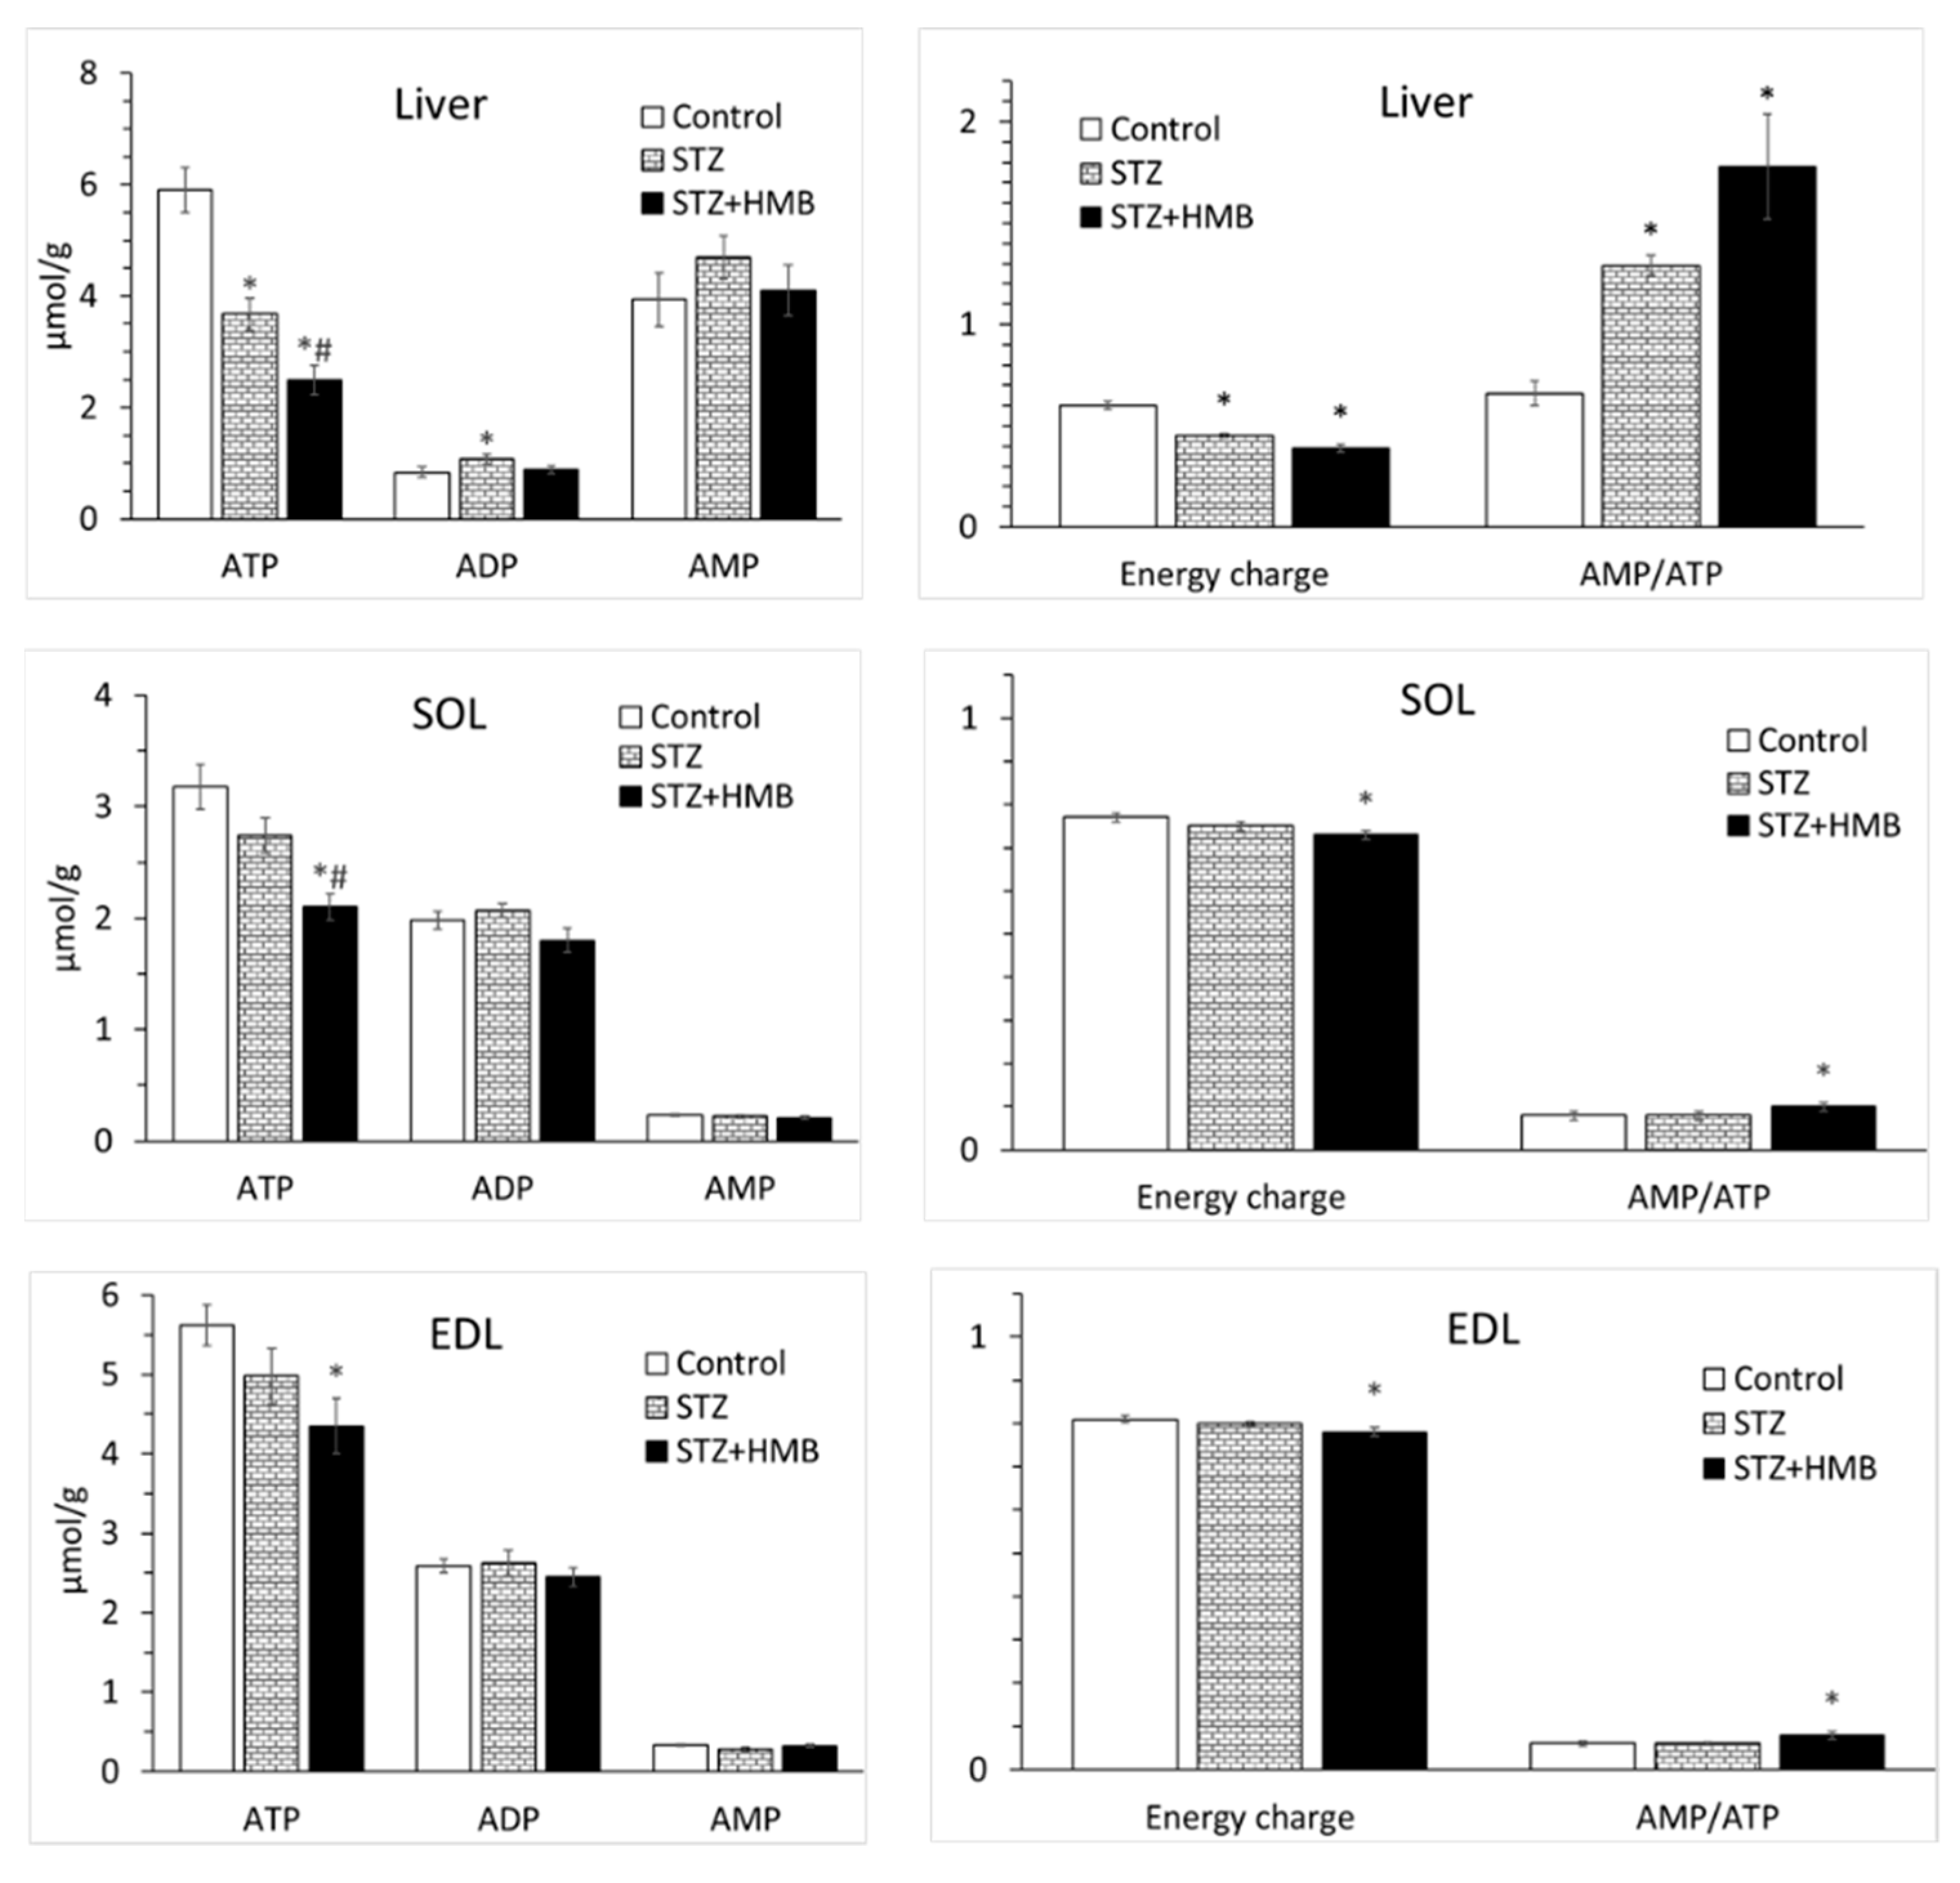
3.8. Adenine Nucleotide Concentrations in the Liver and Muscles

In liver, marked decreases in ATP concentration (~50%) resulting in decreased energy charge and increased AMP/ATP were found in STZ-treated animals compared with control animals (Figure 1). The effect of STZ on ATP concentration in muscles was nonsignificant. In diabetic animals treated with HMB, we found lower ATP concentration, lower energy charge, and higher AMP/ATP in all tissues when compared with controls. In SOL of the HMB + STZ group, the ATP concentration was significantly lower than those in control and STZ groups.

4. Discussion

To the best of our knowledge, this is the first study to clearly demonstrate alterations in BCAA concentration in different types of skeletal muscle and effects of HMB administration on protein balance, BCAA levels, and energy metabolism in T1DM.

4.1. Metabolic Alterations Induced by STZ

Hyperglycemia, insulin concentrations below 10% those of the controls, and glycosuria in all of the STZ-treated rats demonstrated that a single intraperitoneal injection of STZ can be used to create a suitable T1DM model. In addition, STZ induced a severe loss of body weight associated with the loss of skeletal muscle tissue despite hyperphagia. The main cause of impaired muscle protein balance is probably a decrease in protein synthesis, as reported in STZ-treated rats in several studies [34,35]. The marked increases in BCAA concentrations and decreases in serine concentrations in all examined tissues under STZ vs. control treatment (Table 3, Table 4, Table 5 and Table 6 and Figure 2) are consistent with other studies examining aminoacidemia in patients with T1DM and animal models of diabetes [15,16,17,18]. A marked decrease in ATP concentration in the liver and subsequent increase in AMP/ATP may inhibit ATP-consuming processes and stimulate ATP-producing processes via AMP-activated protein kinase (AMPK) activation. These alterations explain the decreased levels of plasma proteins and protein contents in muscles observed in the STZ-treated rats.

4.2. Why Are BCAAs Increased in STZ-Treated Animals?

Unlike other amino acids, which are catabolized in the liver, the first site of catabolism of the BCAA is skeletal muscles because of the high activity of BCAA aminotransferase and the skeletal muscle mass. Therefore, the marked increases in BCAA concentrations in the muscles of STZ-treated rats indicated insufficient transamination of the BCAA originating from food and protein breakdown. However, the cause of this insufficient BCAA transamination is not clear.
Because the flux through BCAA aminotransferase is reversible and sensitive to the availability of reactants [36], BCAA transamination is affected by the concentrations of α-KG, BCKAs, and glutamate (Figure 3). Several studies have reported impaired flux through the TCA cycle, increased fatty acid oxidation, and altered function of mitochondria in subjects with T1DM [1,2,3]. These alterations might decrease the availability of α-KG and/or inhibit the flux of BCKA through BCKA dehydrogenase reaction due to increased acyl-CoA availability and an increased NADH to NAD+ ratio [37]. Since the muscle concentrations of α-KG increased in STZ-treated rats in our study, the latter possibility, i.e., insufficient utilization of the BCKAs, seems more likely. This speculation is supported by the increased concentrations of all three BCKAs in EDL and of KIC in SOL in the STZ-treated rats. The decrease in BCKA concentration in blood plasma was probably due to an increased activity of hepatic BCKA dehydrogenase, as observed in the liver of subjects with T1DM [38,39].
An increased BCAA concentration in muscles is expected to increase BCAA concentrations in plasma due to decreased BCAA disappearance from the blood and/or increased BCAA release from muscles. A role in pathogenesis of increased plasma BCAA levels might also be played in protein catabolism in the liver. Since the BCAA aminotransferase is absent in the liver, increased catabolism and/or decreased synthesis of hepatic proteins can be expected to result in increased release of the BCAA to the blood [40].

4.3. Decreases in Serine Concentration

In our study, the serine concentration was markedly decreased in not only blood plasma (by 51%), but also the liver (67%) and muscles (36% in EDL, 56% in SOL) of STZ-treated rats compared to those in control rats. Decreased plasma serine concentrations have been reported in both T1DM [17,41] and T2DM [42]. It has been suggested that serine depletion plays a role in the development of diabetes mellitus and its related complications, and that L-serine should be considered as an emerging therapeutic option in diabetes [43].
The pathogenesis of serine depletion is unclear. There are two pathways for serine biosynthesis, and both start with 3-phosphoglycerate, an intermediate of glycolysis. Hence, impaired glycolysis due to insulin depletion might play a role in decreased serine concentrations. Glycine can be produced from serine. Hence, decreased synthesis of serine may explain the decreased concentrations of glycine observed in plasma and the examined tissues.

4.4. Effects of HMB

In diabetic animals treated with HMB, we found higher glucose and insulin concentrations in the blood, lower glucose excretion via the urine, lower ATP concentrations in the liver and muscles, and lower BCAA concentration in blood plasma and muscles than what we observed in STZ-treated rats without HMB treatment. The effects of HMB on the weight and protein content of tissues were nonsignificant (Figure 4).
We do not have a clear explanation for our findings. HMB affects several signaling pathways, including the PI3/Akt and MAPK/ERK pathways, which may interact with and/or replace the effects of insulin and play a role in the pathogenesis of the observed alterations. Some studies have demonstrated that HMB supplementation improves insulin sensitivity [44], whereas others have shown that it impairs insulin sensitivity [45]. Higher glycemia in animals with diabetes treated by HMB when compared with STZ-treated animals without HMB therapy is in favor of studies reporting that HMB decreases sensitivity to the effect of insulin. The suggestion is also supported by significantly higher insulin concentration in HMB-treated rats with diabetes, unless the results were not corrected for multiple testing.
The decrease in BCAA concentrations in plasma and muscles after HMB therapy can be theoretically due to decreased food intake, increased use of the BCAA for protein synthesis, or increased BCAA catabolism. The first two options are unlikely, because we did not observe the effect of HMB on food intake or on the protein balance in examined tissues. However, HMB is likely to activate BCAA oxidation in diabetic rats. It has been suggested that in diabetes, the BCAA increases due to consequences of decreased glycolysis and increased fatty acid oxidation, characteristic features of diabetes, which impair BCAA transamination by decreased supply of amino group acceptors (α-ketoglutarate, oxaloacetate, and pyruvate) and inhibitory influence of NADH and acyl-CoAs on citric cycle and BCKA dehydrogenase [37]. Since it has been proven that HMB promotes the activity of glycolysis-related enzymes [46], it may be supposed that HMB administration improves BCAA transamination in animals with diabetes via improved glycolysis and supply of amino group acceptors. The suggestion that HMB ameliorates increased BCAA levels in diabetes via improved glycolysis is supported by increased hepatic concentration of serine, which is synthesized from 3-phosphoglycerate, an intermediate of glycolysis.
In the light of current opinions about the negative effects of high BCAA concentrations on disease progression and the development of diabetes-associated complications [18,19,20,21], the decreases in BCAA concentration induced by HMB may be considered beneficial. However, it should be noted that there is no consensus in views on the effects of increased BCAA levels on diabetes development [37,47,48]. Attention should be paid to the effects of increased BCAA concentration on protein balance and insulin secretion, and ratio of the BCAA to other amino acids, notably tryptophan and threonine, which may affect serotonin level in the brain and food intake [47].
The decreases in ATP concentrations in the liver and muscles in HMB-treated animals with diabetes should be considered detrimental with potentially adverse influence on the course of diabetes. Decreased ATP concentration and subsequent increase in AMP/ATP might inhibit ATP-consuming processes via AMPK activation, such as protein synthesis. These alterations may explain lower concentrations of albumins in plasma of animals with diabetes treated by HMB when compared with diabetic animals without HMB therapy. Pathogenesis of ATP depletion in liver and muscles of diabetic rats treated by HMB is not clear. One role might be the already mentioned increased drain (cataplerosis) of α-ketoglutarate from TCA cycle due to increased flux of BCAA through BCAA aminotransferase and unknown effects of HMB on mitochondrial function.

4.5. Differences Between SOL and EDL

Our results showed that STZ administration induced greater losses of mass and protein content in EDL than in SOL. This observation is in line with histochemical and morphometric evidence of more severe atrophy of fast-twitch fibers than of slow-twitch ones in rat and murine models of T1DM [23,24]. Another significant difference between SOL and EDL in the response to STZ application was in amino acid concentrations. Under STZ application, BCAA concentration was increased to a greater extent in EDL (by 80%) than in SOL (by 50%). In SOL, but not EDL, the increase in BCAA was associated with marked decreases in alanine, aspartate, and glutamate, amino acids that are closely related to BCAA catabolism (Figure 3).
We assume that the differences between EDL and SOL in response to STZ were due to greater dependence of EDL on glucose as a source of energy, the supply of which to the muscles is impaired under insulin depletion. One role might also be a lower supply of α-KG, an acceptor of amino nitrogen in BCAA transamination reaction produced by TCA cycle, due to a lower content of mitochondria in fast-twitch fibers than in slow-twitch fibers [49]. The finding of decreased alanine, aspartate, and glutamate concentrations in SOL, but not in EDL, under STZ administration might have been due to higher ALT and AST activities in red (slow-twitch) muscles than in white (fast-twitch) muscles [50].

5. Conclusions

We conclude that a single dose of STZ induces severe diabetes associated with muscle wasting despite hyperphagia, decreased ATP concentrations in the liver and muscles, and marked increases in BCAA concentrations and decreases in serine concentrations in blood plasma, liver, and muscles. In EDL (white, fast-twitch muscle), the decreases in mass and protein content and the increase in BCAA concentration under STZ treatment were more pronounced than those in SOL (red, slow-twitch muscle). The results suggest that the cause of increased BCAA concentrations following STZ administration is insufficient transamination in muscles. HMB administration to STZ-treated rats had dual roles. The decreases in BCAAs in blood plasma and both muscles and the increase in serine concentration in the liver can be considered beneficial effects of HMB treatment, whereas the higher glycemia and decreased muscle ATP levels should be considered detrimental effects of HMB. Therefore, we cannot conclude whether the effect of HMB on diabetes was beneficial or detrimental.

Author Contributions

M.H. outlined the experiments, performed the statistical analysis, interpreted the experimental results, and prepared the manuscript. M.V. and R.F. were involved in the data acquisition and the data interpretation. All authors have read and agreed to the published version of the manuscript.

Funding

This work was supported by the PROGRES Q40/02 program.

Conflicts of Interest

The authors declare no conflict of interest.

References

  1. Krause, M.P.; Riddell, M.C.; Hawke, T.J. Effects of type 1 diabetes mellitus on skeletal muscle: clinical observations and physiological mechanisms. Pediatr. Diabetes 2011, 12, 345–364. [Google Scholar] [CrossRef] [PubMed]
  2. Chandramohan, G.; Al-Numair, K.S.; Veeramani, C.; Alsaif, M.A.; Almajwal, A.M. Protective effect of kaempferol, a flavonoid compound, on oxidative mitochondrial damage in streptozotocin-induced diabetic rats. Prog. Nutr. 2015, 17, 238–244. [Google Scholar]
  3. Karakelides, H.; Asmann, Y.W.; Bigelow, M.L.; Short, K.R.; Dhatariya, K.; Coenen-Schimke, J.; Kahl, J.; Mukhopadhyay, D.; Nair, K.S. Effect of insulin deprivation on muscle mitochondrial ATP production and gene transcript levels in type 1 diabetic subjects. Diabetes 2007, 56, 2683–2689. [Google Scholar] [CrossRef] [PubMed] [Green Version]
  4. Monaco, C.M.F.; Hughes, M.C.; Ramos, S.V.; Varah, N.E.; Lamberz, C.; Rahman, F.A.; McGlory, C.; Tarnopolsky, M.A.; Krause, M.P.; Laham, R.; et al. Altered mitochondrial bioenergetics and ultrastructure in the skeletal muscle of young adults with type 1 diabetes. Diabetologia 2018, 61, 1411–1423. [Google Scholar] [CrossRef] [PubMed] [Green Version]
  5. Vinik, A.I.; Nevoret, M.L.; Casellini, C.; Parson, H. Diabetic neuropathy. Endocrinol. Metab. Clin. North Am. 2013, 42, 747–787. [Google Scholar] [CrossRef] [PubMed]
  6. Smith, H.J.; Mukerji, P.; Tisdale, M.J. Attenuation of proteasome-induced proteolysis in skeletal muscle by {beta}-hydroxy-{beta}-methylbutyrate in cancer-induced muscle loss. Cancer Res. 2005, 65, 277–283. [Google Scholar] [PubMed]
  7. Kovarik, M.; Muthny, T.; Sispera, L.; Holecek, M. Effects of β-hydroxy-β-methylbutyrate treatment in different types of skeletal muscle of intact and septic rats. J. Physiol. Biochem. 2010, 66, 311–319. [Google Scholar] [CrossRef]
  8. Hao, Y.; Jackson, J.R.; Wang, Y.; Edens, N.; Pereira, S.L.; Always, S.E. β-Hydroxy-β-methylbutyrate reduces myonuclear apoptosis during recovery from hind limb suspension-induced muscle fiber atrophy in aged rats. Am. J. Physiol. 2011, 301, R701–R715. [Google Scholar] [CrossRef] [Green Version]
  9. Clark, R.H.; Feleke, G.; Din, M.; Yasmin, T.; Singh, G.; Khan, F.A.; Rathmacher, J.A. Nutritional treatment for acquired immunodeficiency virus-associated wasting using beta-hydroxy beta-methylbutyrate, glutamine, and arginine: a randomized, double-blind, placebo-controlled study. JPEN J. Parenter. Enteral Nutr. 2000, 24, 133–139. [Google Scholar] [CrossRef]
  10. Olveira, G.; Olveira, C.; Doña, E.; Palenque, F.J.; Porras, N.; Dorado, A.; Godoy, A.M.; Rubio-Martínez, E.; Rojo-Martínez, G.; Martín-Valero, R. Oral supplement enriched in HMB combined with pulmonary rehabilitation improves body composition and health related quality of life in patients with bronchiectasis (Prospective, Randomised Study). Clin. Nutr. 2016, 35, 1015–1022. [Google Scholar] [CrossRef]
  11. Ekinci, O.; Yanık, S.; Terzioğlu Bebitoğlu, B.; Yılmaz Akyüz, E.; Dokuyucu, A.; Erdem, S. Effect of calcium β-hydroxy-β-methylbutyrate (CaHMB), vitamin D, and protein supplementation on postoperative immobilization in malnourished older adult patients with hip fracture: A randomized controlled study. Nutr. Clin. Pract. 2016, 31, 829–835. [Google Scholar] [CrossRef] [PubMed]
  12. Holeček, M. Beta-hydroxy-beta-methylbutyrate supplementation and skeletal muscle in healthy and muscle-wasting conditions. J. Cachexia Sarcopenia Muscle 2017, 8, 529–541. [Google Scholar] [CrossRef] [PubMed]
  13. Duan, Y.; Li, F.; Guo, Q.; Wang, W.; Zhang, L.; Wen, C.; Chen, X.; Yin, Y. β-Hydroxy-β-methyl butyrate is more potent than leucine in inhibiting starvation-induced protein degradation in C2C12 myotubes. J. Agric. Food Chem. 2018, 66, 170–176. [Google Scholar] [CrossRef] [PubMed]
  14. Sipahi, S.; Gungor, O.; Gunduz, M.; Cilci, M.; Demirci, M.C.; Tamer, A. The effect of oral supplementation with a combination of beta-hydroxy-beta-methylbutyrate, arginine and glutamine on wound healing: a retrospective analysis of diabetic haemodialysis patients. BMC Nephrol. 2013, 14, 8. [Google Scholar] [CrossRef] [PubMed] [Green Version]
  15. Aftring, R.P.; Miller, W.J.; Buse, M.G. Effects of diabetes and starvation on skeletal muscle branched-chain alpha-keto acid dehydrogenase activity. Am. J. Physiol. 1988, 254, E292–E300. [Google Scholar] [CrossRef] [PubMed]
  16. Borghi, L.; Lugari, R.; Montanari, A.; Dall’Argine, P.; Elia, G.F.; Nicolotti, V.; Simoni, I.; Parmeggiani, A.; Novarini, A.; Gnudi, A. Plasma and skeletal muscle free amino acids in type I, insulin-treated diabetic subjects. Diabetes 1985, 34, 812–815. [Google Scholar] [CrossRef]
  17. Jensen-Waern, M.; Andersson, M.; Kruse, R.; Nilsson, B.; Larsson, R.; Korsgren, O.; Essén-Gustavsson, B. Effects of streptozotocin-induced diabetes in domestic pigs with focus on the amino acid metabolism. Lab. Anim. 2009, 43, 249–254. [Google Scholar] [CrossRef]
  18. Van den Berg, E.H.; Flores-Guerrero, J.L.; Gruppen, E.G.; de Borst, M.H.; Wolak-Dinsmore, J.; Connelly, M.A.; Bakker, S.J.L.; Dullaart, R.P.F. Non-alcoholic fatty liver disease and risk of incident type 2 diabetes: Role of circulating branched-chain amino acids. Nutrients 2019, 11, 705. [Google Scholar] [CrossRef] [Green Version]
  19. Iwasa, M.; Ishihara, T.; Mifuji-Moroka, R.; Fujita, N.; Kobayashi, Y.; Hasegawa, H.; Iwata, K.; Kaito, M.; Takei, Y. Elevation of branched-chain amino acid levels in diabetes and NAFL and changes with antidiabetic drug treatment. Obes. Res. Clin. Pract. 2015, 9, 293–297. [Google Scholar] [CrossRef]
  20. Newgard, C.B. Interplay between lipids and branched-chain amino acids in development of insulin resistance. Cell Metab. 2012, 15, 606–614. [Google Scholar] [CrossRef] [Green Version]
  21. Laferrère, B.; Reilly, D.; Arias, S.; Swerdlow, N.; Gorroochurn, P.; Bawa, B.; Bose, M.; Teixeira, J.; Stevens, R.D.; Wenner, B.R.; et al. Differential metabolic impact of gastric bypass surgery versus dietary intervention in obese diabetic subjects despite identical weight loss. Sci. Ttransl. Med. 2011, 3, 80re2. [Google Scholar] [CrossRef] [Green Version]
  22. Koksal, B. Effect of streptozotocin on plasma insulin levels of rats and mice: A meta-analysis study. Open Access Maced, J. Med. Sci. 2015, 3, 380–383. [Google Scholar] [CrossRef] [PubMed] [Green Version]
  23. Armstrong, R.B.; Gollnick, P.D.; Ianuzzo, C.D. Histochemical properties of skeletal muscle fibers in streptozotocin-diabetic rats. Cell Tissue Res. 1975, 162, 387–394. [Google Scholar] [CrossRef]
  24. Medina-Sanchez, M.; Rodriguez-Sanchez, C.; Vega-Alvarez, J.A.; Menedez-Pelaez, A.; Perez-Casas, A. Proximal skeletal muscle alterations in streptozotocin-diabetic rats: a histochemical and morphometric analysis. Am. J. Anat. 1991, 191, 48–56. [Google Scholar] [CrossRef]
  25. Holeček, M.; Mičuda, S. Amino acid concentrations and protein metabolism of two types of rat skeletal muscle in postprandial state and after brief starvation. Physiol. Res. 2017, 66, 959–967. [Google Scholar] [CrossRef]
  26. Holecek, M.; Sispera, L. Glutamine deficiency in extracellular fluid exerts adverse effects on protein and amino acid metabolism in skeletal muscle of healthy, laparotomized, and septic rats. Amino Acids 2014, 46, 1377–1384. [Google Scholar] [CrossRef]
  27. Muthny, T.; Kovarik, M.; Sispera, L.; Tilser, I.; Holecek, M. Protein metabolism in slow- and fast-twitch skeletal muscle during turpentine-induced inflammation. Int. J. Exp. Pathol. 2008, 89, 64–71. [Google Scholar] [CrossRef]
  28. Rodríguez, T.; Alvarez, B.; Busquets, S.; Carbó, N.; López-Soriano, F.J.; Argilés, J.M. The increased skeletal muscle protein turnover of the streptozotocin diabetic rat is associated with high concentrations of branched-chain amino acids. Biochem. Mol. Med. 1997, 61, 87–94. [Google Scholar] [CrossRef] [PubMed]
  29. Holecek, M.; Muthny, T.; Kovarik, M.; Sispera, L. Effect of beta-hydroxy-beta-methylbutyrate (HMB) on protein metabolism in whole body and in selected tissues. Food Chem. Toxicol. 2009, 47, 255–259. [Google Scholar] [CrossRef] [PubMed]
  30. Holeček, M.; Vodeničarovová, M. Effects of beta-hydroxy-beta-methylbutyrate in partially hepatectomized rats. Physiol. Res. 2018, 67, 741–751. [Google Scholar] [CrossRef]
  31. Lowry, O.H.; Rosebrough, N.J.; Farr, A.L.; Randall, R.J. Protein measurement with the Folin phenol reagent. J. Biol. Chem. 1951, 193, 265–275. [Google Scholar] [PubMed]
  32. Holeček, M.; Vodeničarovová, M. Muscle wasting and branched-chain amino acid, alpha-ketoglutarate, and ATP depletion in a rat model of liver cirrhosis. Int. J. Exp. Pathol. 2018, 99, 274–281. [Google Scholar] [CrossRef] [PubMed]
  33. Atkinson, D.E. The energy charge of the adenylate pool as a regulatory parameter. Interaction with feedback modifiers. Biochemistry 1968, 7, 4030–4034. [Google Scholar] [CrossRef]
  34. Odedra, B.R.; Dalal, S.S.; Millward, D.J. Muscle protein synthesis in the streptozotocin-diabetic rat. A possible role for corticosterone in the insensitivity to insulin infusion in vivo. Biochem. J. 1982, 202, 363–368. [Google Scholar] [CrossRef] [PubMed] [Green Version]
  35. Millward, D.J.; Garlick, P.J.; Nnanyelugo, D.O.; Waterlow, J.C. The relative importance of muscle protein synthesis and breakdown in the regulation of muscle mass. Biochem. J. 1976, 156, 185–188. [Google Scholar] [CrossRef]
  36. Harper, A.E.; Miller, R.H.; Block, K.P. Branched-chain amino acid metabolism. Ann. Rev. Nutr. 1984, 4, 409–454. [Google Scholar] [CrossRef]
  37. Holeček, M. Why are branched-chain amino acids increased in starvation and diabetes? Nutrients 2020, 12, 3087. [Google Scholar] [CrossRef]
  38. May, M.E.; Mancusi, V.J.; Aftring, R.P.; Buse, M.G. Effects of diabetes on oxidative decarboxylation of branched-chain keto acids. Am. J. Physiol. 1980, 239, E215–E222. [Google Scholar] [CrossRef]
  39. Lombardo, Y.B.; Thamotharan, M.; Bawani, S.Z.; Paul, H.S.; Adibi, S.A. Posttranscriptional alterations in protein masses of hepatic branched-chain keto acid dehydrogenase and its associated kinase in diabetes. Proc. Assoc. Am. Physicians 1998, 110, 40–49. [Google Scholar]
  40. Holeček, M. Branched-chain amino acids in health and disease: metabolism, alterations in blood plasma, and as supplements. Nutr. Metab. 2018, 15, 33. [Google Scholar] [CrossRef] [Green Version]
  41. Bervoets, L.; Massa, G.; Guedens, W.; Louis, E.; Noben, J.P.; Adriaensens, P. Metabolic profiling of type 1 diabetes mellitus in children and adolescents: a case-control study. Diabetol. Metab. Syndr. 2017, 9, 48. [Google Scholar] [CrossRef] [PubMed]
  42. Drábková, P.; Šanderová, J.; Kovařík, J.; Kanďár, R. An assay of selected serum amino acids in patients with type 2 diabetes mellitus. Adv. Clin. Exp. Med. 2015, 24, 447–451. [Google Scholar] [CrossRef] [PubMed] [Green Version]
  43. Holm, L.J.; Buschard, K. L-serine: a neglected amino acid with a potential therapeutic role in diabetes. APMIS 2019, 127, 655–659. [Google Scholar] [CrossRef] [PubMed] [Green Version]
  44. Sharawy, M.H.; El-Awady, M.S.; Megahed, N.; Gameil, N.M. The ergogenic supplement β-hydroxy-β-methylbutyrate (HMB) attenuates insulin resistance through suppressing GLUT-2 in rat liver. Can. J. Physiol. Pharmacol. 2016, 94, 488–497. [Google Scholar] [CrossRef] [PubMed] [Green Version]
  45. Yonamine, C.Y.; Teixeira, S.S.; Campello, R.S.; Gerlinger-Romero, F.; Rodrigues, C.F.; Guimarães-Ferreira, L.; Machado, U.F.; Nunes, M.T. Beta hydroxy beta methylbutyrate supplementation impairs peripheral insulin sensitivity in healthy sedentary Wistar rats. Acta Physiol. 2014, 212, 62–74. [Google Scholar] [CrossRef]
  46. Zhang, Y.; Yang, M.; Zhou, P.; Yan, H.; Zhang, Z.; Zhang, H.; Qi, R.; Liu, J. β-Hydroxy-β-methylbutyrate-induced upregulation of miR-199a-3p contributes to slow-to-fast muscle fiber type conversion in mice and C2C12 cells. J. Agric. Food Chem. 2020, 68, 530–540. [Google Scholar] [CrossRef]
  47. Solon-Biet, S.M.; Cogger, V.C.; Pulpitel, T.; Wahl, D.; Clark, X.; Bagley, E.; Gregoriou, G.C.; Senior, A.M.; Wang, Q.P.; Brandon, A.E.; et al. Branched chain amino acids impact health and lifespan indirectly via amino acid balance and appetite control. Nat. Metab. 2019, 1, 532–545. [Google Scholar] [CrossRef]
  48. Desikan, V.; Mileva, I.; Garlick, J.; Lane, A.H.; Wilson, T.A.; McNurlan, M.A. The effect of oral leucine on protein metabolism in adolescents with type 1 diabetes mellitus. Int. J. Pediatr. Endocrinol. 2010, 2010, 493258. [Google Scholar] [CrossRef]
  49. Hoppeler, H.; Hudlicka, O.; Uhlmann, E. Relationship between mitochondria and oxygen consumption in isolated cat muscles. J. Physiol. 1987, 385, 661–675. [Google Scholar] [CrossRef]
  50. Hamm, R. Transaminases of skeletal muscle. 2. Transaminase activities in white and red muscles of pigs and cows. J. Food Sci. 1969, 34, 449–452. [Google Scholar] [CrossRef]
Figure 1. Effect of STZ and HMB on adenine nucleotide concentrations, cellular energy charge, and the AMP-to-ATP ratio in the liver and muscles. Means ± SE, p ˂ 0.05. ANOVA and Bonferroni multiple comparisons. * Comparison vs. Control. # Comparison of STZ + HMB vs. STZ. The equation for cell energy charge was: [ATP + (0.5 × ADP)]/[ATP + ADP + AMP].STZ, streptozotocin; HMB, β-hydroxy-β-methyl butyrate. SOL, soleus muscle; EDL, extensor digitorum longus muscle.
Biomolecules 10 01475 g001
Figure 2. Effects of STZ and HMB on BCAA and serine concentrations in blood plasma, liver, and muscles. Means ± SE, p ˂ 0.05. ANOVA and Bonferroni multiple comparisons. * Comparison vs. Control. # Comparison of STZ + HMB vs. STZ.
Biomolecules 10 01475 g002
Figure 3. Transamination of the BCAA to BCKA can be affected by supply of the BCAA, activity of TCA cycle, decarboxylation of BCKA, and glutamate conversion to glutamine or α-KG. 1, Branched-chain amino acid aminotransferase; 2, branched-chain α-keto acid dehydrogenase; 3, glutamine synthetase; 4, alanine aminotransferase and aspartate aminotransferase. ECF, extracellular fluid; R-CoA, acyl-CoA.
Biomolecules 10 01475 g003
Figure 4. Effects of HMB in rats with STZ-induced type 1 diabetes mellitus.
Biomolecules 10 01475 g004
Table 1. Biochemical markers in blood plasma and urine.
Control
(n = 8)
STZ
(n = 9)
STZ + HMB
(n = 8)
Blood plasma
Glucose (mmol/L)4.73 ± 0.229.37 ± 1.17 *17.00 ± 2.84 *#
Insulin (µU/mL)77.53 ± 22.013.12 ± 0.46 *6.25 ± 0.84 *
Urea (mmol/L)5.37 ± 0.1718.68 ± 1.00 *19.63 ± 0.94 *
Ammonia (µmol/L)35 ± 560 ± 6 *66 ± 6 *
Creatinine (µmol/L)18.58 ± 0.5014.67 ± 0.78 *14.86 ± 0.49 *
Proteins (g/L)57.65 ± 0.6551.94 ± 0.85 *53.56 ± 1.25 *
Albumins (g/L)38.32 ± 0.7034.97 ± 0.74 *29.79 ± 0.61 *#
Urine
Glucose
(mmol/mmol creatinine)
0.35 ± 0.02590.54 ± 55.80 *386.23 ± 59.66 *#
Urea
(mmol/mmol creatinine)
93 ± 5319 ± 25 *389 ± 28 *
Means ± SE, p ˂ 0.05. Analysis of variance (ANOVA) and Bonferroni multiple comparisons. * Comparison vs. Control. # Comparison of STZ + HMB vs. STZ. STZ, streptozotocin; HMB, β-hydroxy-β-methyl butyrate.
Table 2. Body weight, food intake, and weight and protein content of tissues.
Control
(n = 8)
STZ
(n = 9)
STZ + HMB
(n = 8)
Body weight
Initial (g)205 ± 1 208 ± 1 206 ± 1
Final (g)268 ± 5189 ± 5 *175 ± 6 *
Gain (g)63 ± 5–23 ± 2 *–36 ± 4 *
Food intake
Average (g/day)24.7 ± 0.434.7 ± 0.6 *32.7 ± 0.9 *
Cumulative (g)148 ± 3208 ± 4 *196 ± 6 *
Liver
Weight (g)8.22 ± 0.177.11 ± 0.28 *6.59 ± 0.32 *
(g/kg b.w.)30.73 ± 0.3637.49 ± 0.70 *37.63 ± 0.83 *
Protein (g)1.33 ± 0.061.20 ± 0.051.11 ± 0.06 *
(g/kg b.w.)4.97 ± 0.186.34 ± 0.12 *6.08 ± 0.16 *
SOL
Weight (mg)109 ± 387 ± 2 *83 ± 4 *
(mg/kg b.w.)407 ± 8461 ± 10 *475 ± 3 *
Protein (mg)16.14 ± 0.6414.22 ± 0.5414.60 ± 0.78
(mg/kg b.w.)60.45 ± 2.6475.42 ± 3.39 *80.46 ± 2.99 *
EDL
Weight (mg)125 ± 480 ± 3 *71 ± 3 *
(mg/kg b.w.)465 ± 9420 ± 6 *408 ± 5 *
Protein (mg)19.4 ± 0.713.2 ± 0.4 *12.8 ± 1.0 *
(mg/kg b.w.)72.5 ± 1.669.6 ± 1.070.0 ± 2.4
Means ± SE, p ˂ 0.05. NOVA and Bonferroni multiple comparisons. * Comparison vs. Control. STZ, streptozotocin; HMB, β-hydroxy-β-methyl butyrate.
Table 3. Amino acid concentrations in plasma.
PlasmaControl
(n = 8)
STZ
(n = 9)
STZ + HMB
(n = 8)
EAA
Histidine55 ± 257 ± 156 ± 2
Isoleucine105 ± 4171 ± 7 *141 ± 7 *#
Leucine151 ± 5269 ± 11 *228 ± 15 *#
Lysine376 ± 14333 ± 9338 ± 26
Methionine42 ± 142 ± 4 38 ± 4
Phenylalanine68 ± 289 ± 1 *87 ± 4 *
Threonine228 ± 7209 ± 10188 ± 14
Valine191 ± 6360 ± 15 *316 ± 19 *
BCAA447 ± 14800 ± 33 *685 ± 39 *#
Σ EAA1216 ± 281529 ± 421394 ± 40 *#
NEAA
Alanine368 ± 23288 ± 21335 ± 39
Arginine110 ± 3124 ± 4 122 ± 6
Asparagine55 ± 351 ± 352 ± 3
Aspartate13 ± 11 ± 1* 2 ± 2*
Citrulline70 ± 3156 ± 8 *133 ± 9 *
Glutamate125 ± 962 ± 4 *56 ± 4 *
Glutamine688 ± 18335 ± 13 *425 ± 24 *#
Glycine394 ± 12240 ± 17 *233 ± 22 *
Ornithine39 ± 148 ± 3 *60 ± 3 *
Proline129 ± 6114 ± 9143 ± 23
Serine259 ± 6129 ± 8 *149 ± 18 *
Taurine212 ± 12429 ± 24 * 310 ± 44 *#
Tyrosine83 ± 570 ± 375 ± 9
Σ NEAA2655 ± 732142 ± 86 *2172 ± 104 *
Σ Amino acids3882 ± 973671 ± 1083566 ± 125
The values are in µmol/L of plasma. Means ± SE, p ˂ 0.05. ANOVA and Bonferroni multiple comparisons. * Comparison vs. Control; # Comparison of STZ + HMB vs. STZ. STZ, streptozotocin; HMB, β-hydroxy-β-methyl butyrate; EAA, essential amino acids; NEAA, non-essential amino acids.
Table 4. Amino acid concentrations in the liver.
LiverControl
(n = 8)
STZ
(n = 9)
STZ + HMB
(n = 8)
EAA
Histidine637 ± 17505 ± 55 *570 ± 29
Isoleucine180 ± 8231 ± 21214 ± 25
Leucine288 ± 11389 ± 33387 ± 47
Lysine786 ± 561051 ± 212994 ± 114
Methionine58 ± 254 ± 2 67 ± 5 #
Phenylalanine105 ± 4108 ± 499 ± 5
Threonine756 ± 68613 ± 1551,481 ± 508
Valine291 ± 12477 ± 45 *512 ± 86 *
BCAA760 ± 311098 ± 98 *1113 ± 157 *
Σ EAA3025 ± 1833293 ± 2564323 ± 722
NEAA
Alanine1199 ± 112827 ± 411199 ± 218
Asparagine249 ± 12141 ± 27 *160 ± 20*
Aspartate1300 ± 56 685 ± 50 * 1014 ± 186
Glutamate1436 ± 571783 ± 4341763 ± 104
Glutamine7334 ± 2513220 ± 428 *3818 ± 541 *
Glycine2887 ± 1222274 ± 241 *2486 ± 147
Ornithine338 ± 18608 ± 89975 ± 223 *
Proline256 ± 23217 ± 15321 ± 51
Serine1104 ± 63365 ± 15 *581 ± 83 *#
Taurine3065 ± 2732808 ± 339 4800 ± 1075
Tyrosine103 ± 584 ± 3 *92 ± 7
Σ NEAA19,927 ± 48313,180 ± 405*18,398 ± 1243 #
Σ Amino acids22,953 ± 65016,474 ± 603*22,721 ± 1828 #
The values are in nmol/g of tissue. Means ± SE, p ˂ 0.05. ANOVA and Bonferroni multiple comparisons. * Comparison vs. Control; # Comparison of STZ + HMB vs. STZ. STZ, streptozotocin; HMB, β-hydroxy-β-methyl butyrate; EAA, essential amino acids; NEAA, non-essential amino acids.
Table 5. Amino acid concentrations in soleus (SOL) muscle.
SOLControl
(n = 8)
STZ
(n = 9)
STZ + HMB
(n = 8)
EAA
Histidine426 ± 24504 ± 46458 ± 31
Isoleucine96 ± 4127 ± 12 *101 ± 6
Leucine138 ± 5209 ± 15 *172 ± 6 *#
Lysine941 ± 991236 ± 1041167 ± 158
Methionine47 ± 258 ± 6 48 ± 4
Phenylalanine71 ± 2110 ± 4 *102 ± 6 *
Threonine708 ± 73515 ± 86405 ± 84 *
Valine175 ± 7290 ± 22 *249 ± 11 *#
BCAA409 ± 15626 ± 48 *522 ± 20 *
Σ EAA2602 ± 1613048 ± 1272703 ± 197
NEAA
Alanine2698 ± 781596 ± 166 *1454 ± 233 *
Asparagine515 ± 27526 ± 38484 ± 28
Aspartate2526 ± 114466 ± 81 * 728 ± 252 *
Glutamate3686 ± 1832101 ± 170 *2075 ± 274 *
Glutamine8832 ± 4057019 ± 726 *7523 ± 442
Glycine2479 ± 1352107 ± 1221685 ± 203 *
Ornithine67 ± 366 ± 584 ± 7 *#
Proline288 ± 9314 ± 31273 ± 27
Serine2699 ± 1511179 ± 92 *1353 ± 122 *
Taurine22,948 ± 71227,506 ± 1356 * 27,586 ± 1262 *
Tyrosine102 ± 5100 ± 598 ± 13
Σ NEAA48,969 ± 157745,492 ± 180645,501 ± 1328
Σ Amino acids51,571 ± 169248,540 ± 183348,204 ± 1409
The values are in nmol/g of tissue. Means ± SE, p ˂ 0.05. ANOVA and Bonferroni multiple comparisons. * Comparison vs. Control; # Comparison of STZ + HMB vs. STZ. STZ, streptozotocin; HMB, β-hydroxy-β-methyl butyrate; EAA, essential amino acids; NEAA, non-essential amino acids.
Table 6. Amino acid concentrations in extensor digitorum longus (EDL) muscle.
EDLControl
(n = 8)
STZ
(n = 9)
STZ + HMB
(n = 8)
EAA
Histidine168 ± 4213 ± 24163 ± 11
Isoleucine113 ± 3184 ± 13 *147 ± 6
Leucine151 ± 4274 ± 17 *215 ± 14 *#
Lysine514 ± 43593 ± 28462 ± 51
Methionine52 ± 281 ± 5 * 69 ± 5 *
Phenylalanine80 ± 2132 ± 5 *121 ± 8 *
Threonine415 ± 31327 ± 19 *297 ± 19 *
Valine203 ± 6378 ± 25 *300 ± 13 *#
BCAA467 ± 13836 ± 54 *647 ± 27 *#
Σ EAA1695 ± 742181 ± 66 *1760 ± 82
NEAA
Alanine2192 ± 762451 ± 1012186 ± 140
Asparagine213 ± 10292 ± 28 *238 ± 17
Aspartate490 ± 22527 ± 42 383 ± 26 #
Glutamate989 ± 65886 ± 157749 ± 90
Glutamine3744 ± 2052443 ± 344 *2632 ± 200 *
Glycine3693 ± 2212193 ± 113 *2022 ± 150 *
Ornithine37 ± 245 ± 342 ± 4
Proline233 ± 10412 ± 24 *375 ± 28 *
Serine956 ± 49612 ± 85 *540 ± 44 *
Taurine16,188 ± 41620,297 ± 552 * 19,947 ± 793 *
Tyrosine117 ± 5126 ± 5124 ± 6
Σ NEAA33,491 ± 68534,842 ± 74634,352 ± 980
Σ Amino acids35,186 ± 73737,024 ± 76636,111 ± 1047
The values are in nmol/g of tissue. Means ± SE, p ˂ 0.05. ANOVA and Bonferroni multiple comparisons. * Comparison vs. Control; # Comparison of STZ + HMB vs. STZ. STZ, streptozotocin; HMB, β-hydroxy-β-methyl butyrate; EAA, essential amino acids; NEAA, non-essential amino acids.
Table 7. Concentrations of branched-chain keto acids (BCKA.
Control
(n = 8)
STZ
(n = 9)
STZ + HMB
(n = 8)
Blood plasma
KIV14.4 ± 0.910.2 ± 0.8 *9.5 ± 0.8 *
KIC42.1 ± 3.030.3 ± 2.1 *27.4 ± 2.9 *
KMV34.2 ± 2.426.1 ± 1.8 *28.9 ± 2.6
∑ BCKA90.7 ± 6.166.6 ± 4.4 *65.7 ± 5.0 *
SOL
KIV10.5 ± 0.87.5 ± 0.6 *7.7 ± 0.8 *
KIC1.1 ± 0.23.5 ± 0.4 *2.2 ± 0.3 #
KMV33.4 ± 3.633.6 ± 2.226.9 ± 3.2
∑ BCKA44.7 ± 4.144.2± 2.636.8 ± 3.4
EDL
KIV24.1 ± 0.829.6 ± 0.9 *32.5 ± 2.3 *
KIC2.2 ± 0.36.1 ± 1.2 *3.8 ± 0.5
KMV29.0 ± 6.950.1 ± 3.7 *50.0 ± 2.1 *
∑ BCKA55.3 ± 7.285.7 ± 5.2 *86.3 ± 3.9 *
The values are in µmol/L of plasma or nmol/g of tissue. Means ± SE, p ˂ 0.05. ANOVA and Bonferroni multiple comparisons. * Comparison vs. Control; # Comparison of STZ + HMB vs. STZ. STZ, streptozotocin; HMB, β-hydroxy-β-methyl butyrate; KIV, α-ketoisovalerate; KIC, α-ketoisocaproate; KMV, α-keto-β-methylvalerate.
Table 8. Concentrations of pyruvate and intermediates of tricarboxylic acid (TCA) cycle.
Control
(n = 8)
STZ
(n = 9)
STZ + HMB
(n = 8)
Blood plasma
pyruvate539 ± 59379 ± 26 *464 ± 24
malate821 ± 1121179 ± 2241297 ± 200
α-ketoglutarate72 ± 10104 ± 20115 ± 18
fumarate10 ± 19 ± 110 ± 1
cis-aconitate 44 ± 427 ± 1 *33 ± 2 *
Liver
pyruvate18.7 ± 1.619.8 ± 1.322.1 ± 1.8
malate16.96 ± 1.4912.13 ± 1.17 *11.27 ± 1.46 *
α-ketoglutarate1.81 ± 0.192.08 ± 0.132.06 ± 0.18
fumarate0.17 ± 0.010.20 ± 0.020.22 ± 0.02 *
oxaloacetate3.90 ± 0.393.64 ± 0.752.94 ± 0.22
cis-aconitate0.25 ± 0.010.17 ± 0.01 *0.19 ± 0.01 *
SOL
pyruvate56.1 ± 3.942.7 ± 5.143.6 ± 7.4
malate3.49 ± 0.173.28 ± 0.302.95 ± 0.11
α-ketoglutarate2.42 ± 0.163.00 ± 0.15 *2.48 ± 0.10
fumarate0.26 ± 0.010.11 ± 0.01 *0.12 ± 0.01 *
oxaloacetate139 ± 9110 ± 4 *109 ± 3 *
cis-aconitate0.07 ± 0.030.02 ± 0.000.02 ± 0.00
EDL
pyruvate207 ± 16263 ± 14156 ± 23#
malate5.99 ± 1.083.41 ± 0.952.06 ± 0.46 *
α-ketoglutarate1.64 ± 0.322.85 ± 0.11 *3.15 ± 0.49 *
fumarate0.14 ± 0.000.13 ± 0.010.09 ± 0.01 *#
oxaloacetate226 ± 7217 ± 20219 ± 10
cis-aconitate0.012 ± 0.0020.012 ± 0.0010.007 ± 0.001 *
The values are in µmol/L of blood plasma or µmol/g of tissue. Means ± SE, p ˂ 0.05. ANOVA and Bonferroni multiple comparisons. * Comparison vs. Control; # Comparison of STZ + HMB vs. STZ. STZ, streptozotocin; HMB, β-hydroxy-β-methyl butyrate;
Publisher’s Note: MDPI stays neutral with regard to jurisdictional claims in published maps and institutional affiliations.

