Targeting Mitochondria in Melanoma

 , and
, and 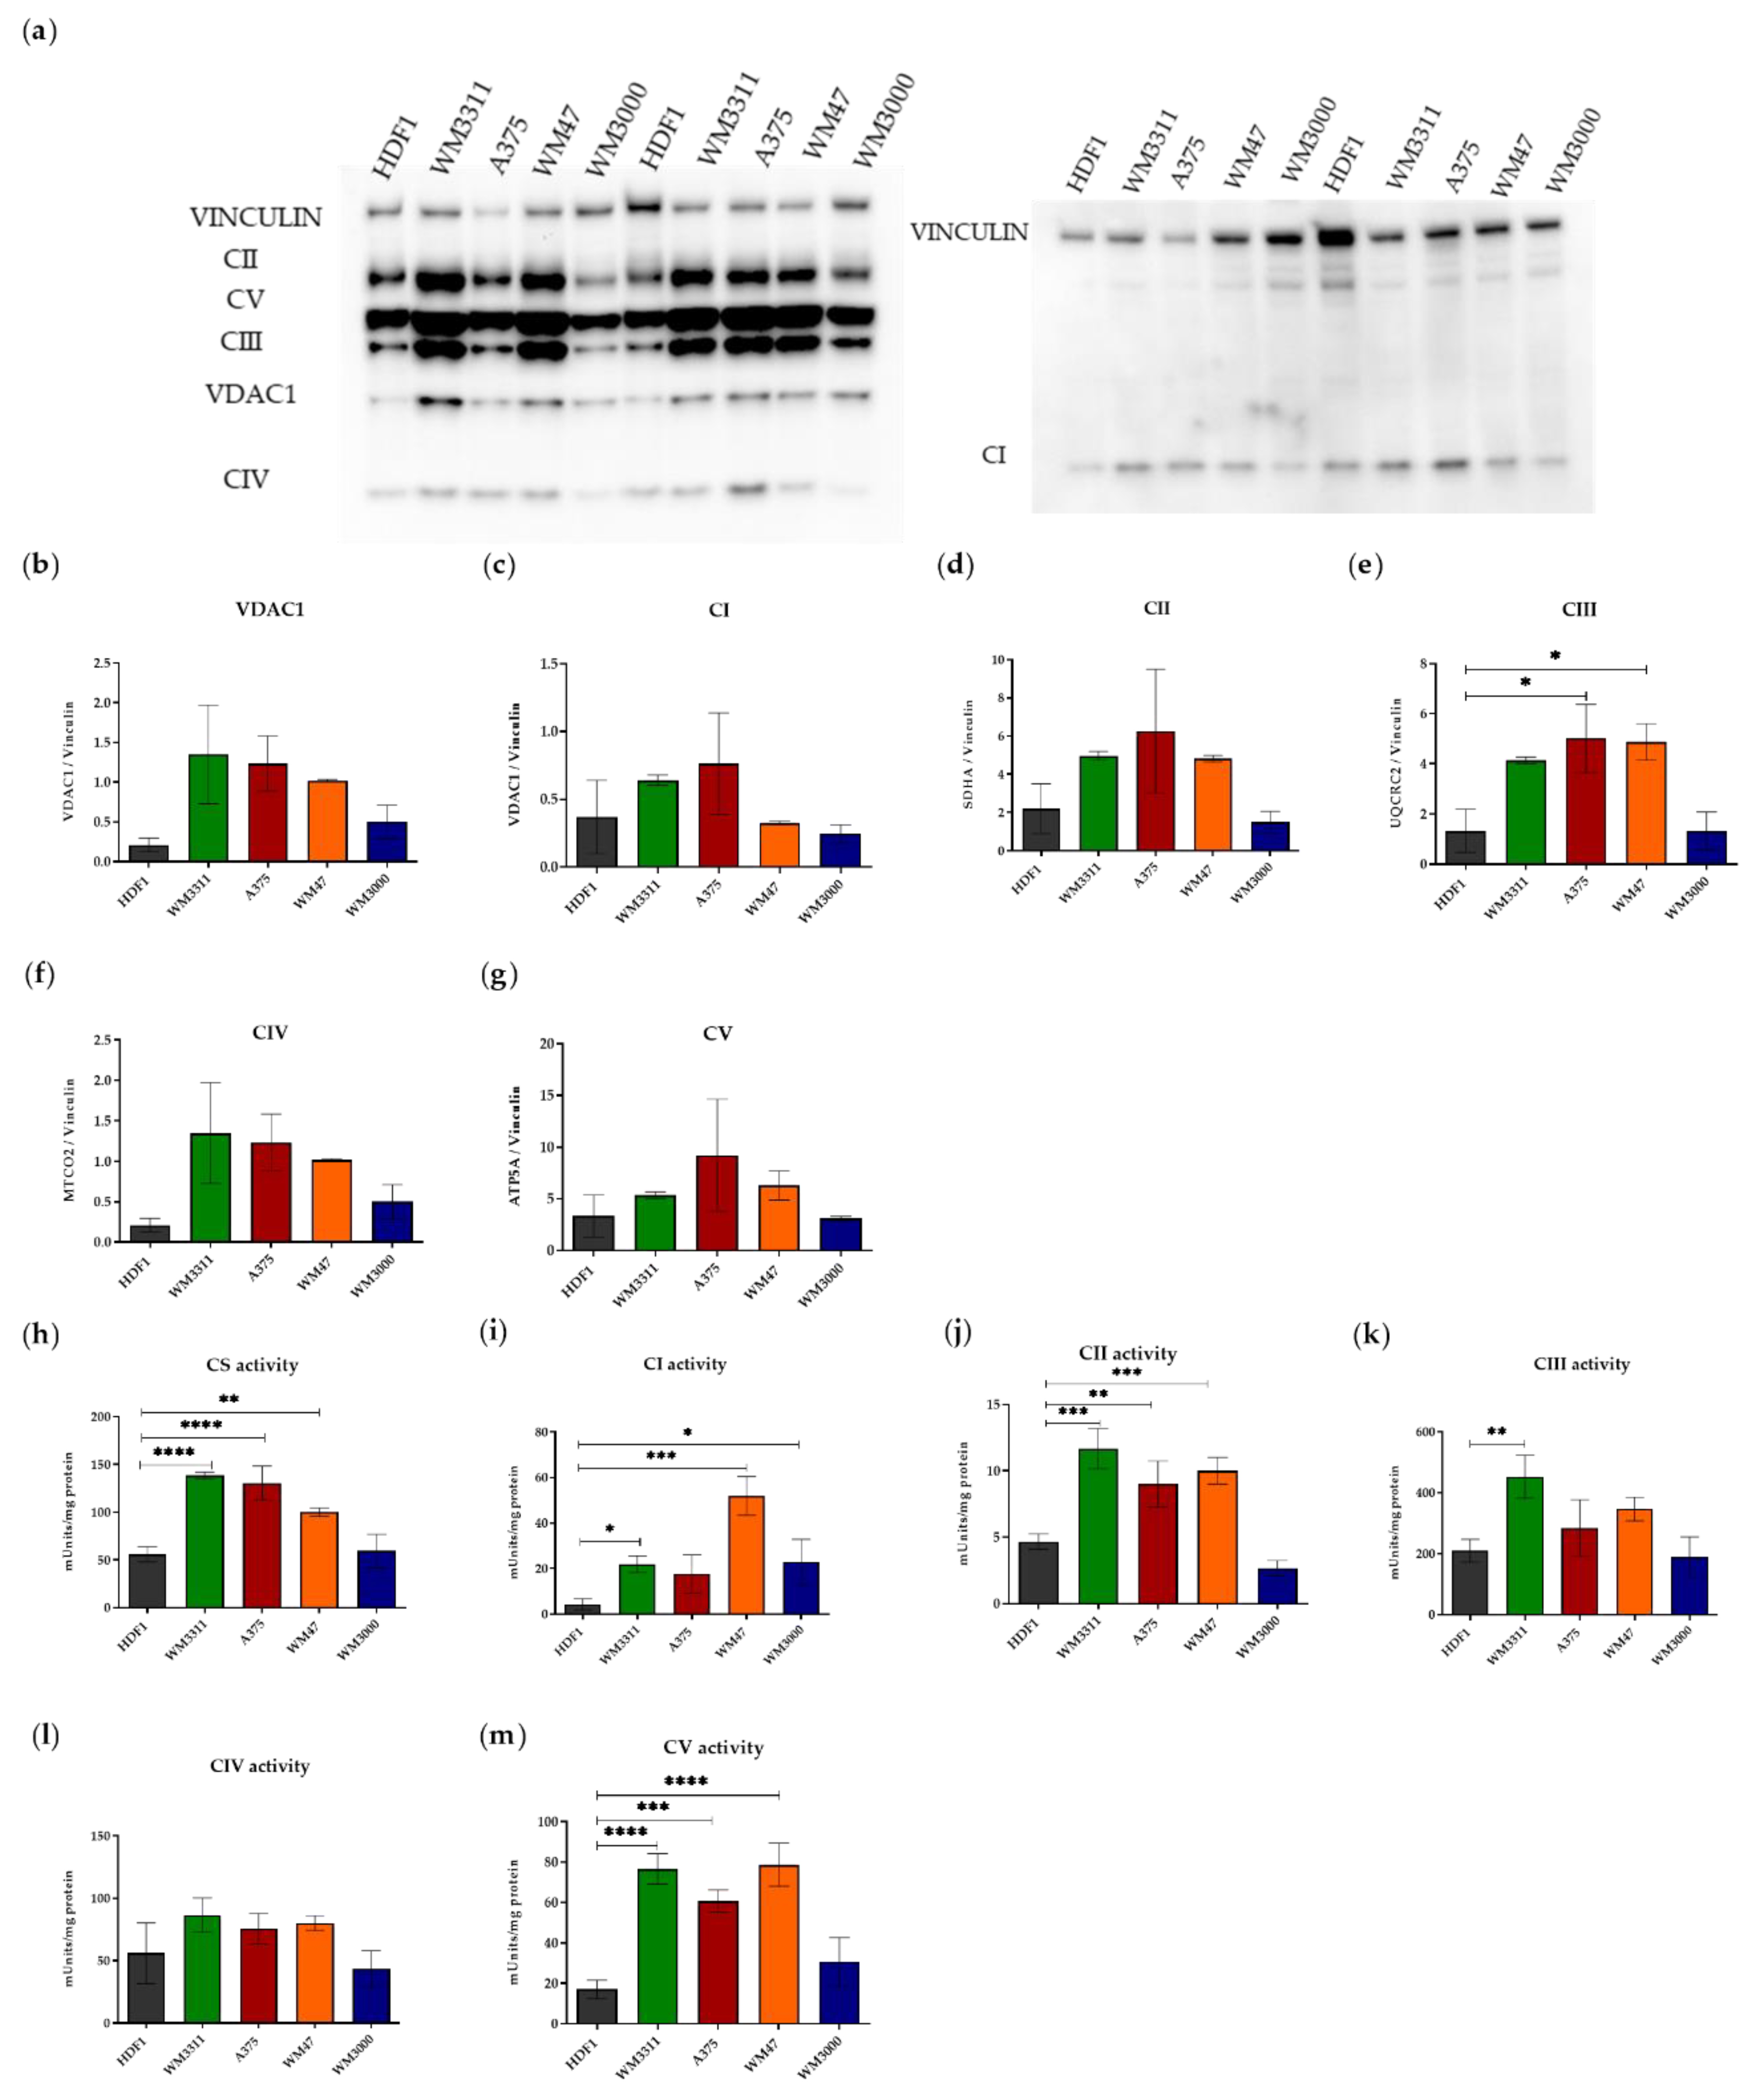
Abstract
1. Introduction
2. Materials and Methods
2.1. Cell Lines, Primary Cells and Agents
2.2. Proliferation Assays
2.3. Spheroids
2.4. Western Blot
2.5. Enzymatic Activities
2.6. Bioenergetic Measurements
2.7. Statistical Analyses
3. Results
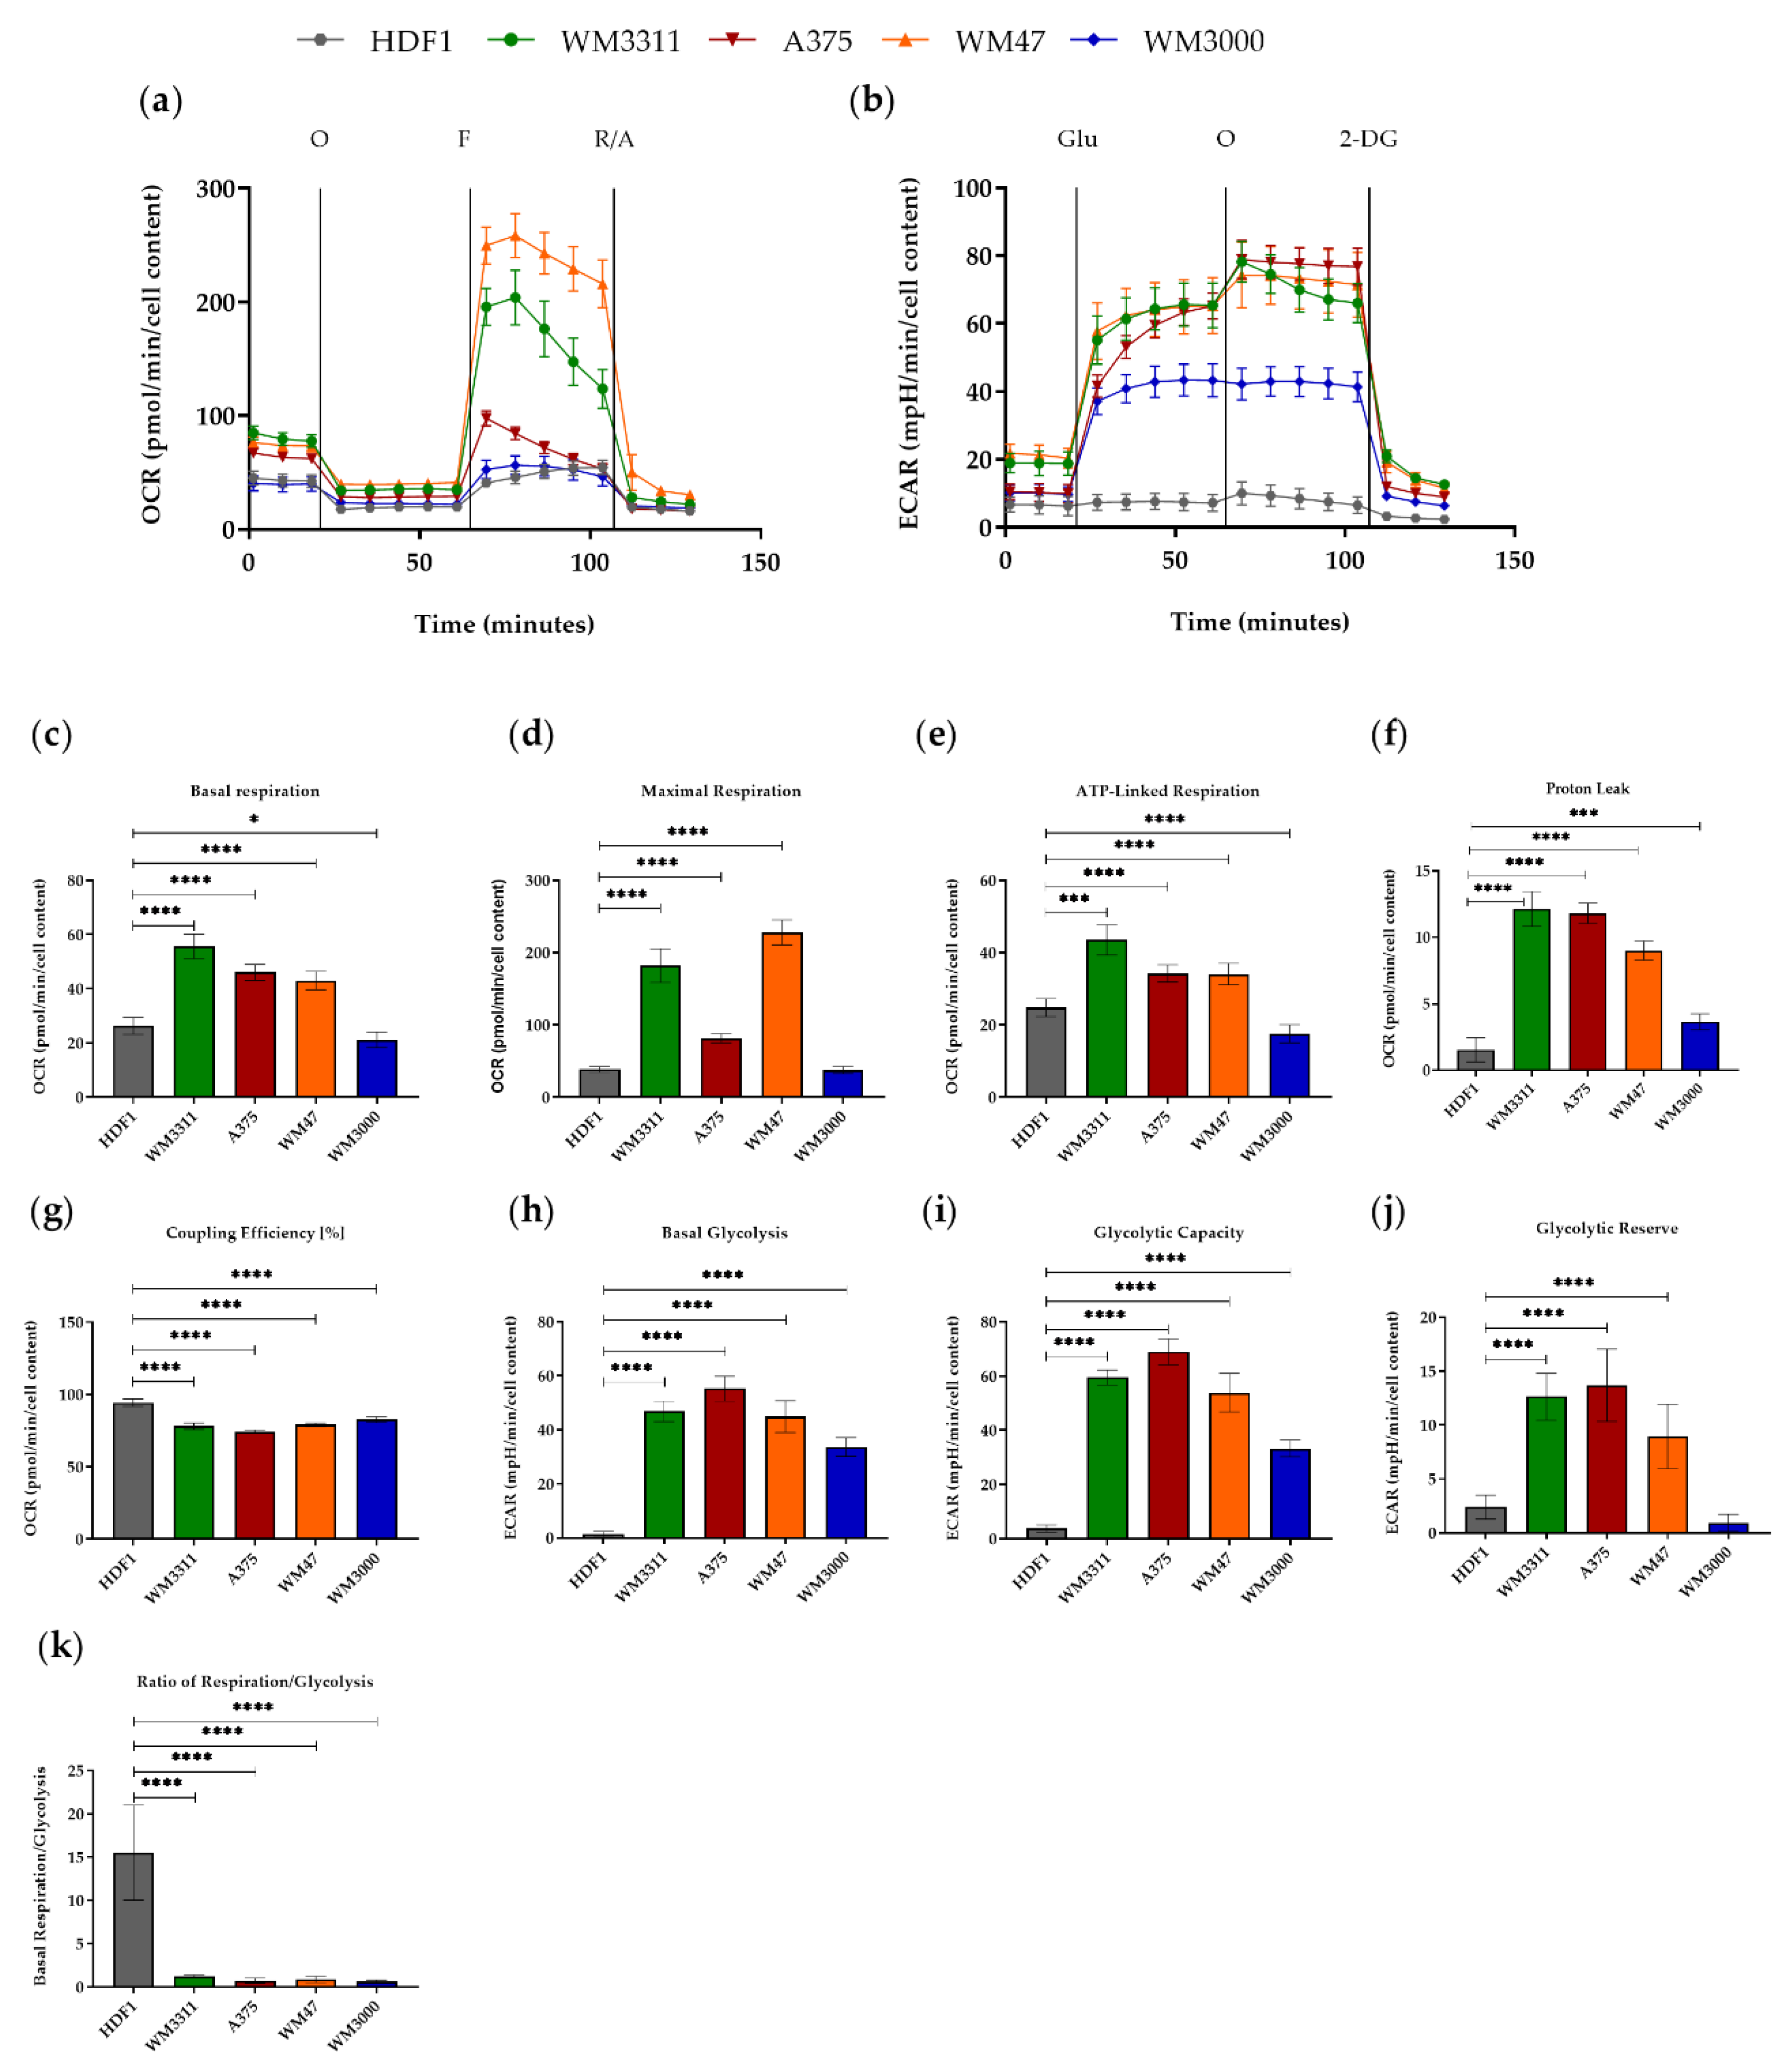
3.1. Melanoma Cells Exhibit Elevated Levels of Glycolysis and OXPHOS, but Contain Dysfunctional Mitochondria
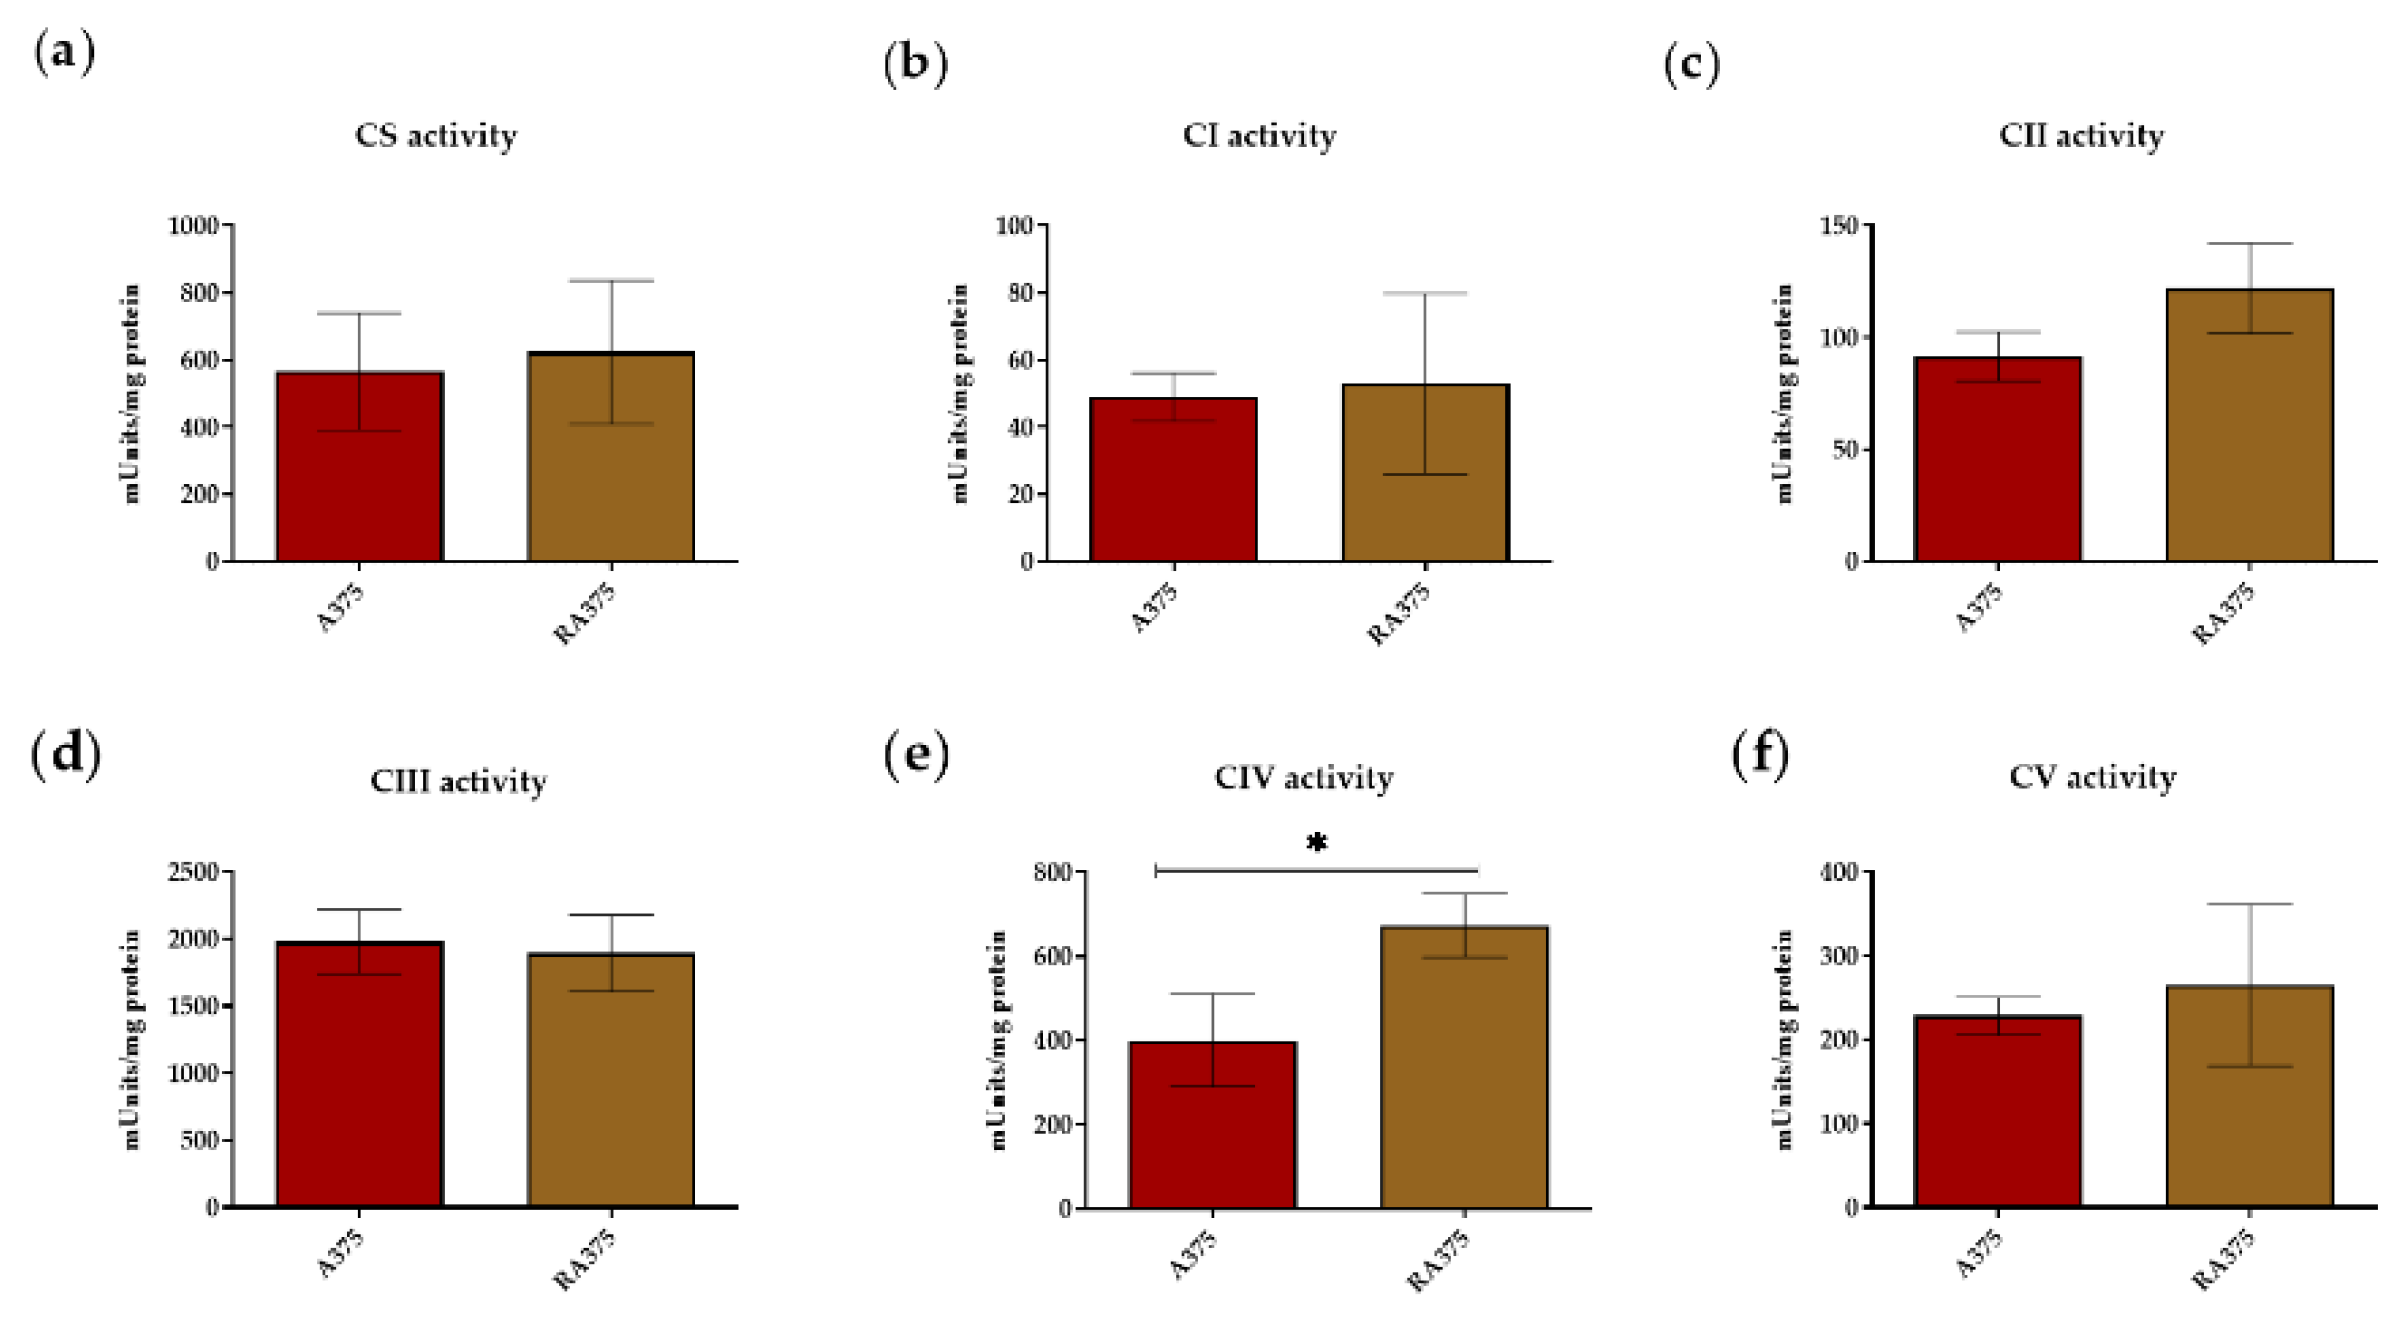
3.2. OXPHOS Activity in BRAF Inhibitor-Resistant A375 Cells
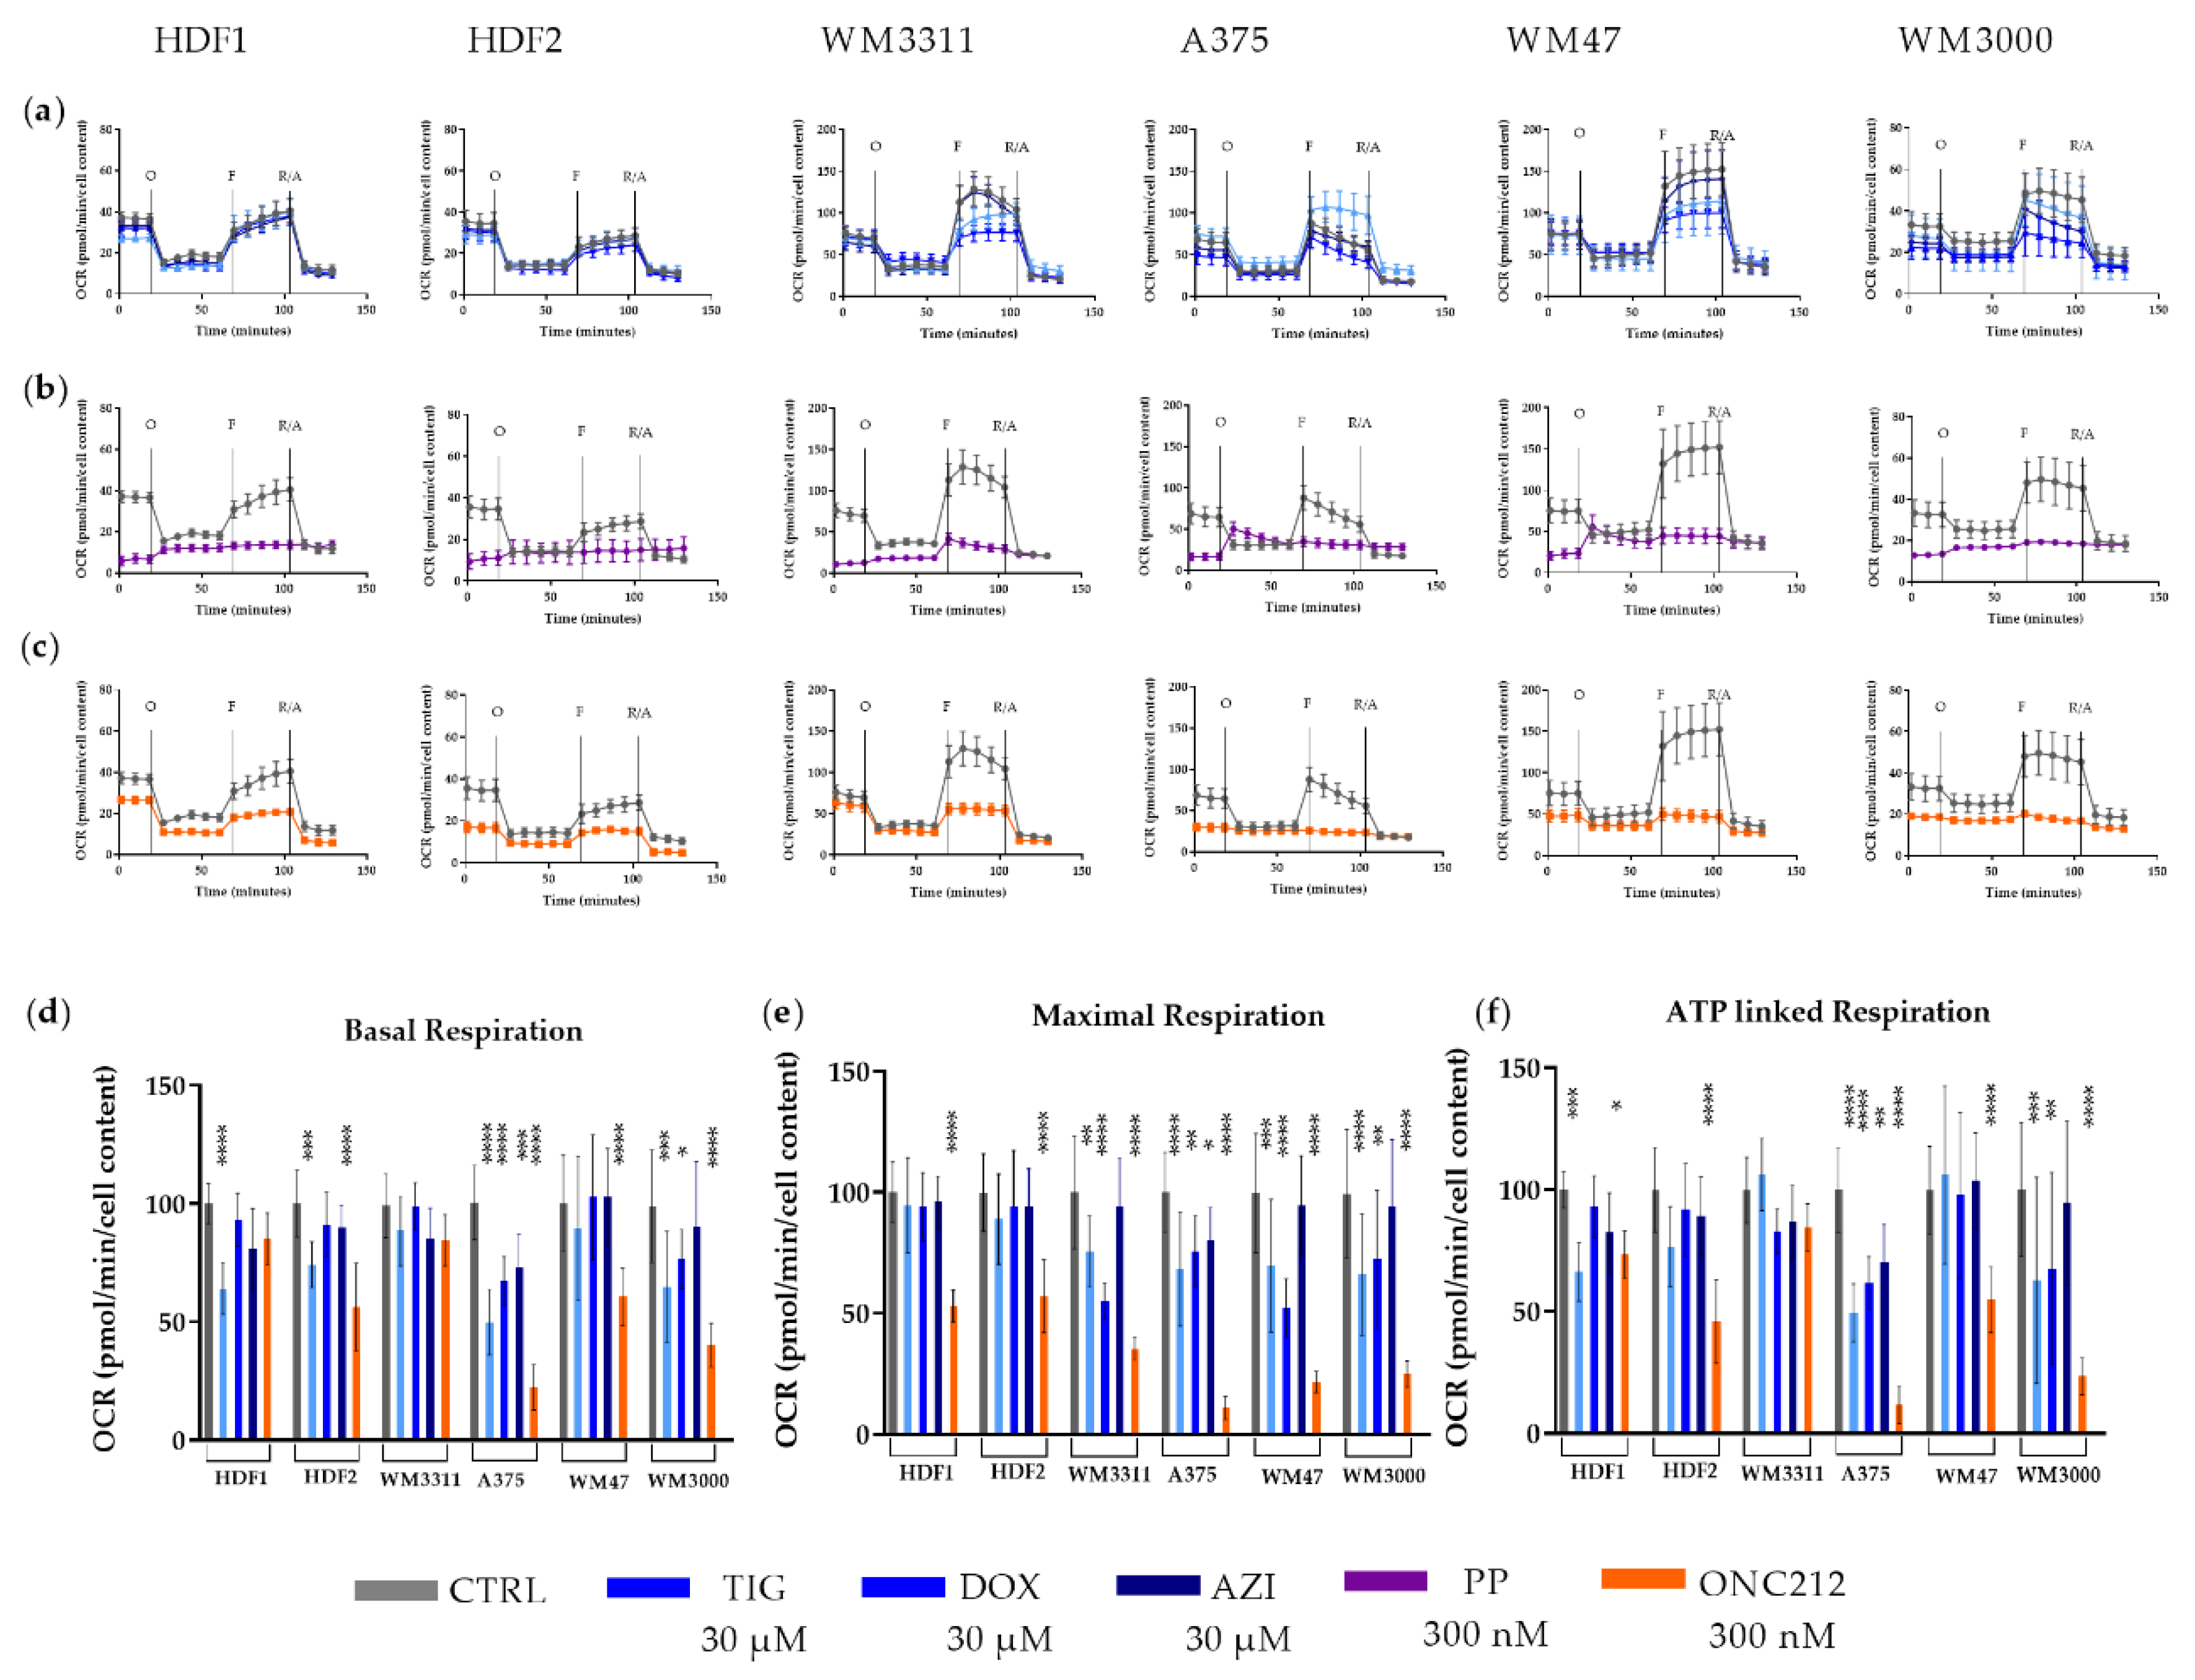
3.3. Effects of Mitochondrial Inhibitors on Respiratory Parameters of Melanoma Cells
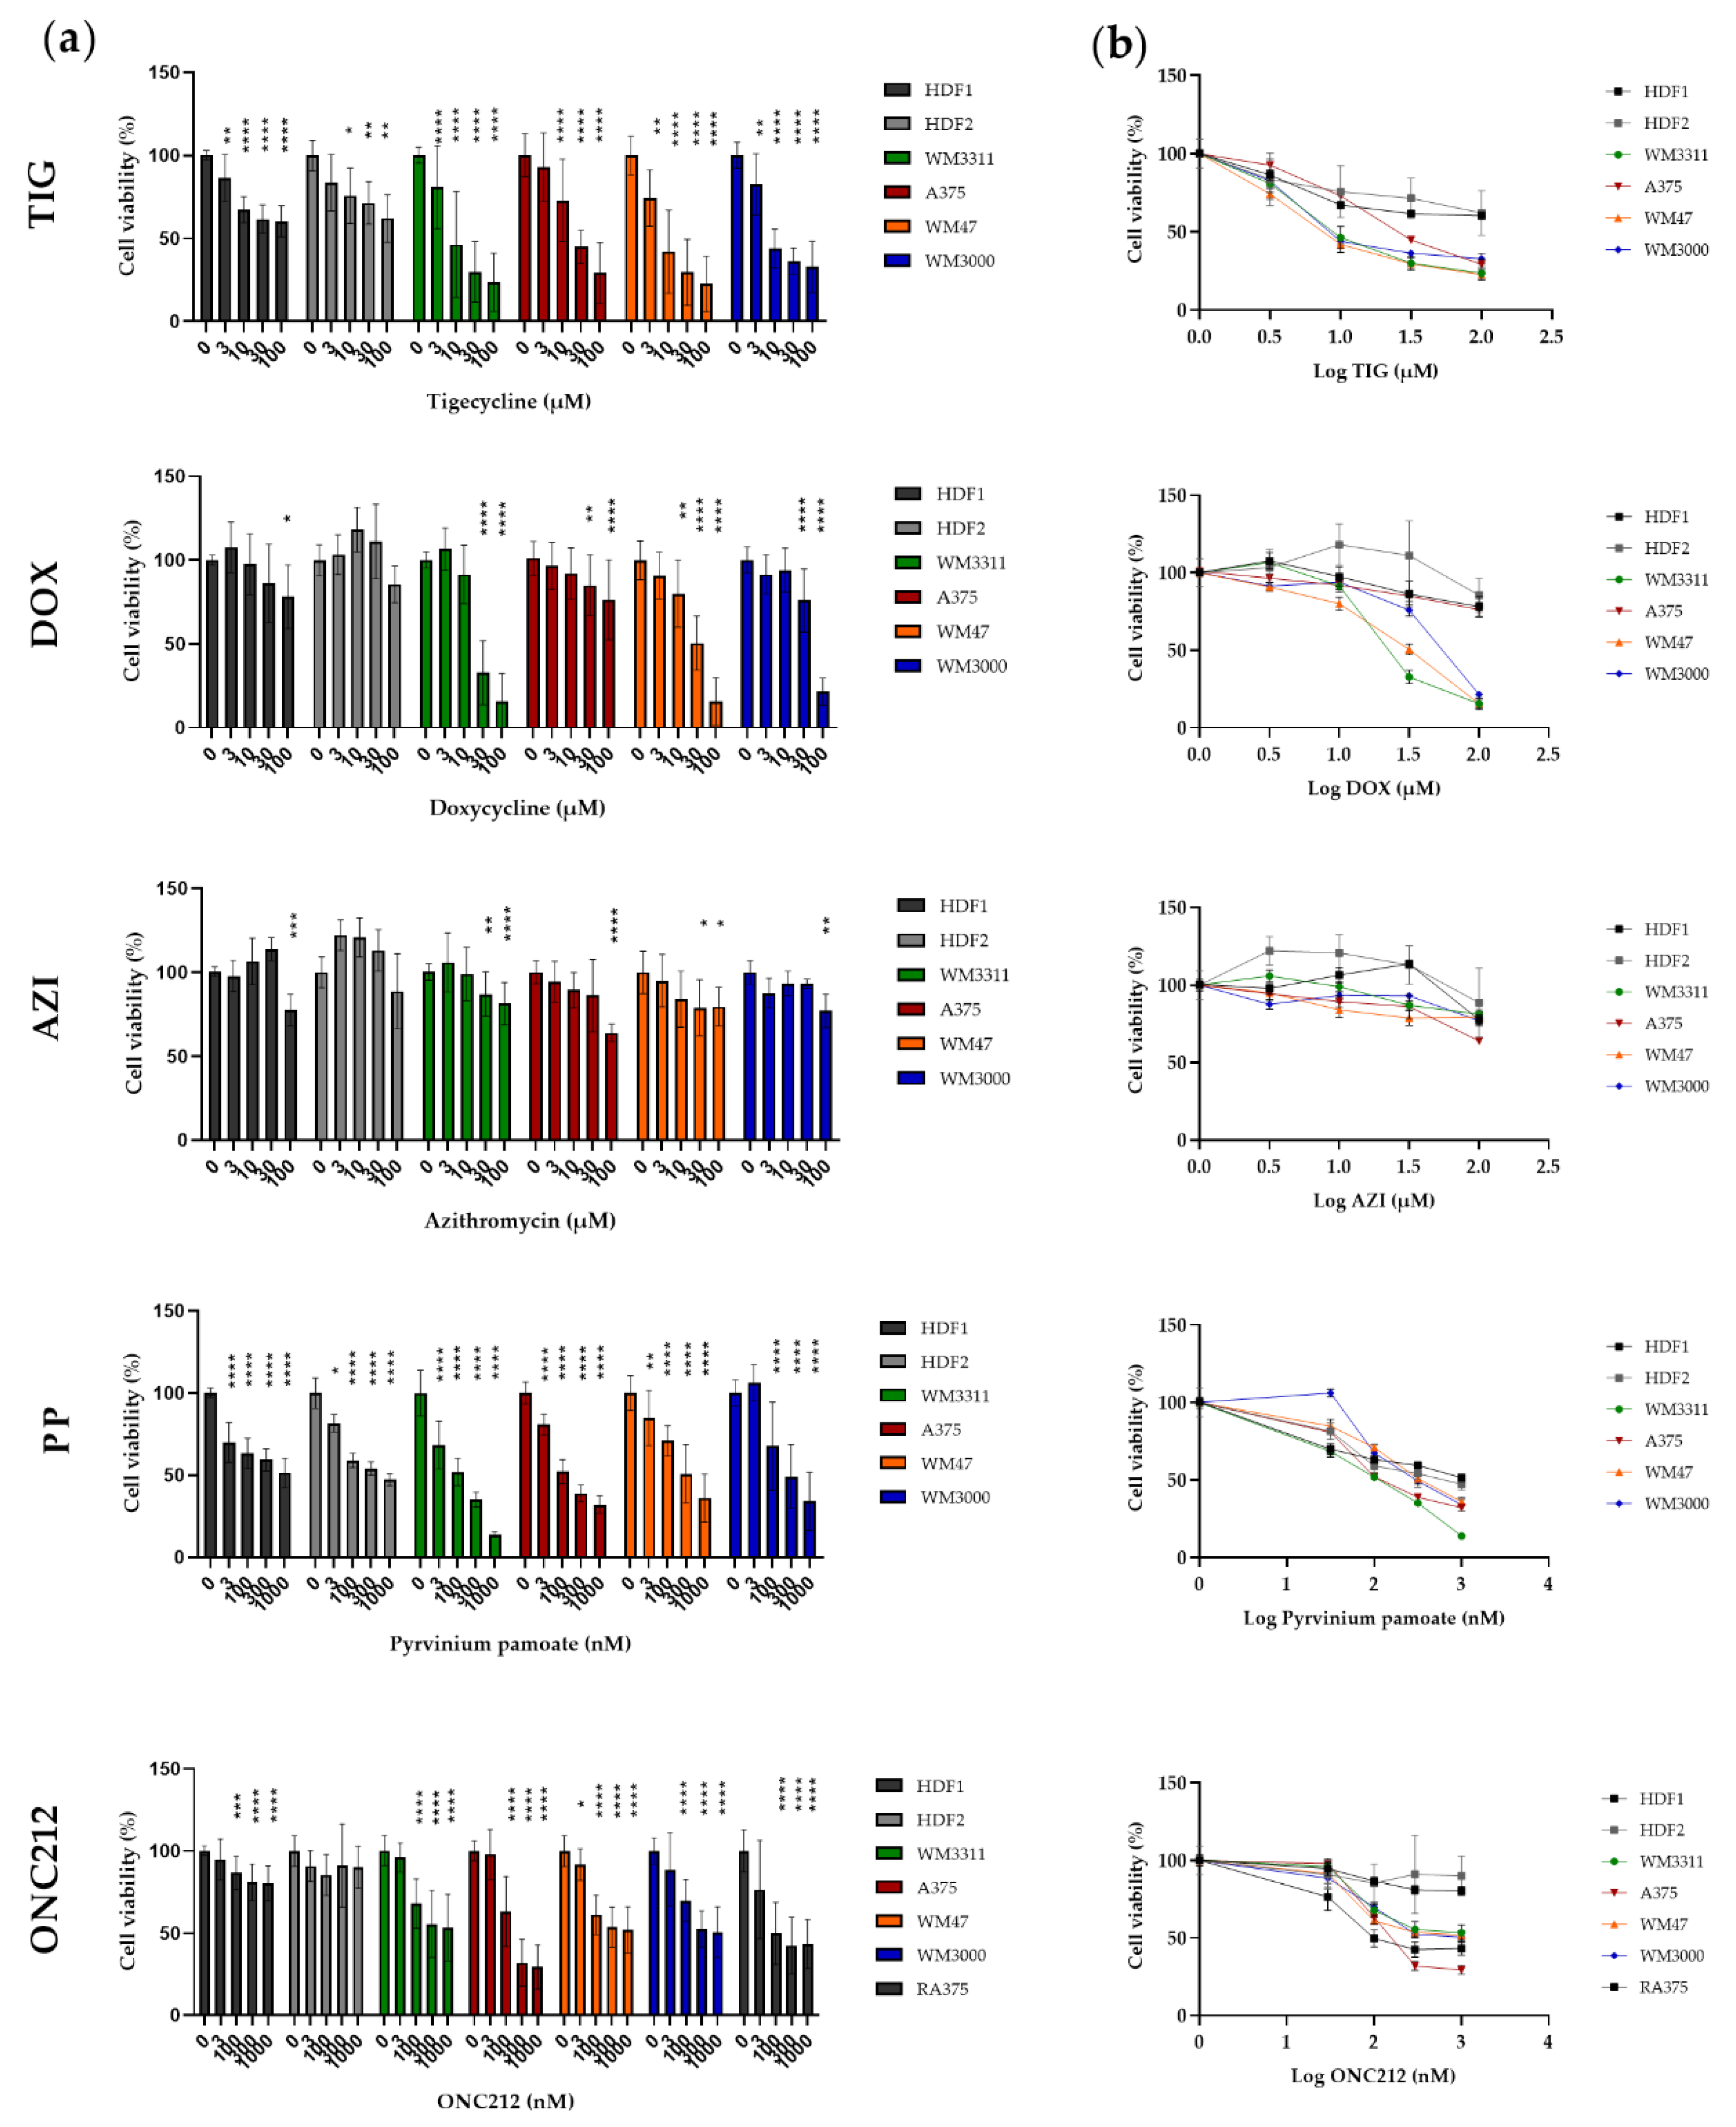
3.4. Effects of Mitochondrial Inhibitors on Melanoma Cell Proliferation
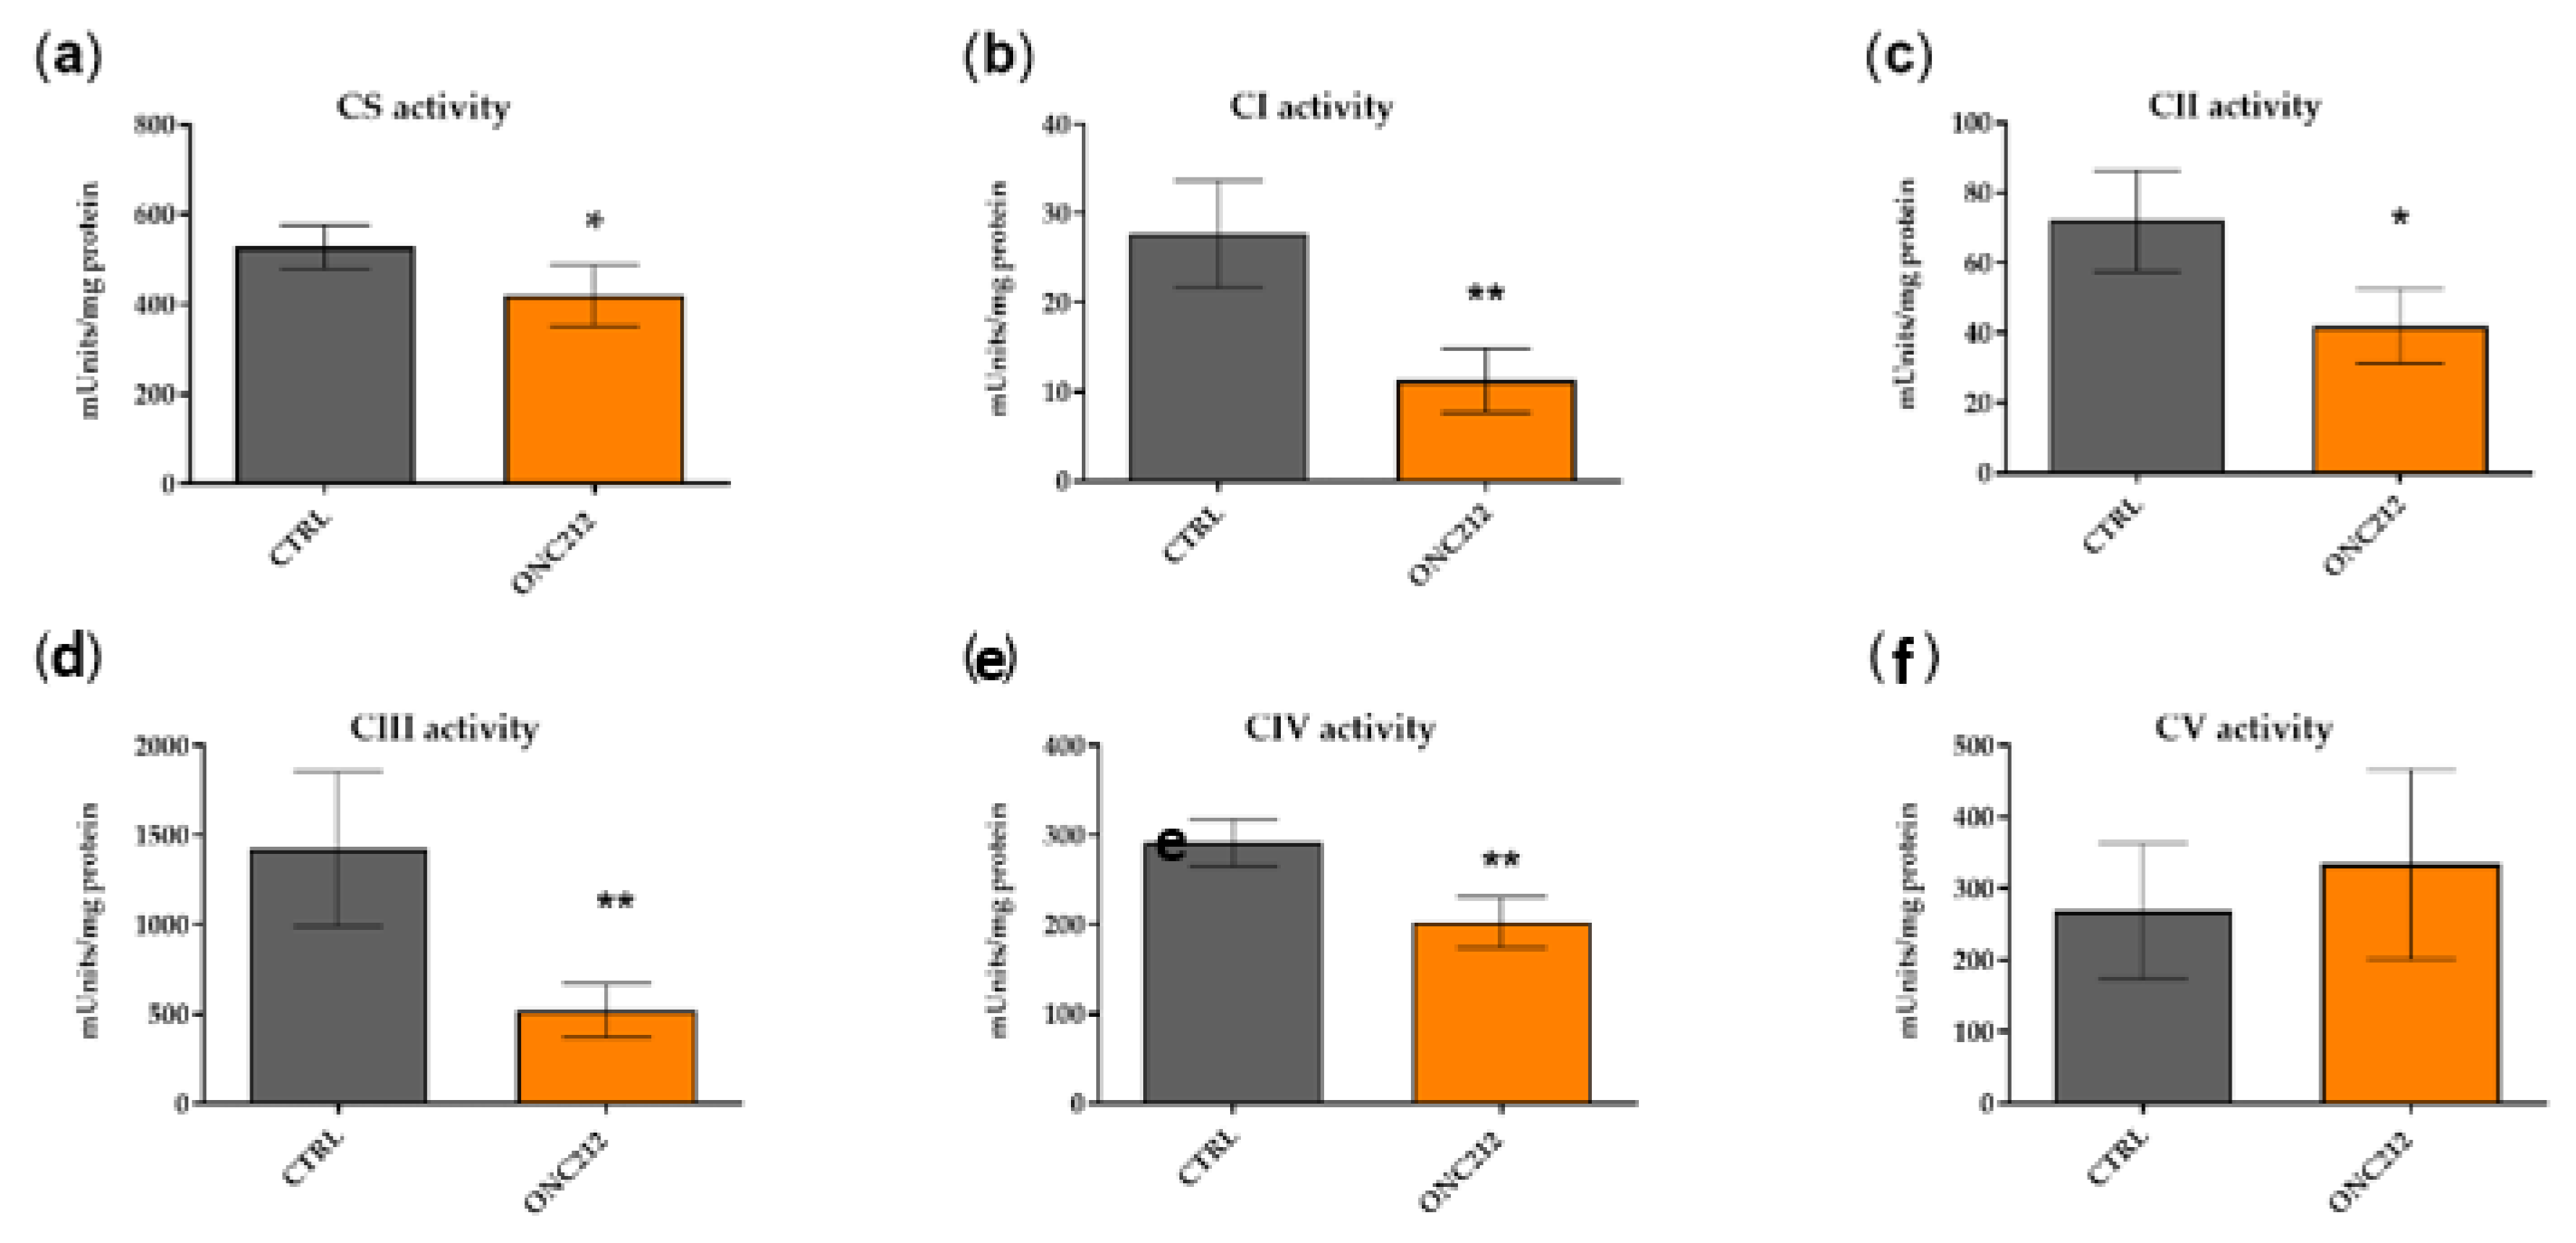
3.5. ONC212 Reduces the Activity of OXPHOS Complexes
4. Discussion
5. Conclusions
Supplementary Materials
Author Contributions
Funding
Acknowledgments
Conflicts of Interest
References
- Siegel, R.L.; Miller, K.D.; Jemal, A. Cancer statistics, 2019. CA Cancer J. Clin. 2019, 69, 7–34. [Google Scholar] [CrossRef] [PubMed]
- Zou, W.; Wolchok, J.D.; Chen, L. PD-L1 (B7-H1) and PD-1 pathway blockade for cancer therapy: Mechanisms, response biomarkers, and combinations. Sci. Transl. Med. 2016, 8, 328rv324. [Google Scholar] [CrossRef] [PubMed]
- Weiss, S.A.; Wolchok, J.D.; Sznol, M. Immunotherapy of Melanoma: Facts and Hopes. Clin. Cancer Res. 2019, 25, 5191–5201. [Google Scholar] [CrossRef] [PubMed]
- Lasche, M.; Emons, G.; Grundker, C. Shedding New Light on Cancer Metabolism: A Metabolic Tightrope Between Life and Death. Front. Oncol. 2020, 10, 409. [Google Scholar] [CrossRef]
- Vasan, K.; Werner, M.; Chandel, N.S. Mitochondrial Metabolism as a Target for Cancer Therapy. Cell Metab. 2020. [Google Scholar] [CrossRef]
- Grasso, D.; Zampieri, L.X.; Capeloa, T.; Van de Velde, J.A.; Sonveaux, P. Mitochondria in cancer. Cell Stress 2020, 4, 114–146. [Google Scholar] [CrossRef]
- Barbi de Moura, M.; Vincent, G.; Fayewicz, S.L.; Bateman, N.W.; Hood, B.L.; Sun, M.; Suhan, J.; Duensing, S.; Yin, Y.; Sander, C.; et al. Mitochondrial respiration--an important therapeutic target in melanoma. PLoS ONE 2012, 7, e40690. [Google Scholar] [CrossRef]
- Feichtinger, R.G.; Lang, R.; Geilberger, R.; Rathje, F.; Mayr, J.A.; Sperl, W.; Bauer, J.W.; Hauser-Kronberger, C.; Kofler, B.; Emberger, M. Melanoma tumors exhibit a variable but distinct metabolic signature. Exp. Dermatol. 2018, 27, 204–207. [Google Scholar] [CrossRef]
- Fischer, G.M.; Vashisht Gopal, Y.N.; McQuade, J.L.; Peng, W.; DeBerardinis, R.J.; Davies, M.A. Metabolic strategies of melanoma cells: Mechanisms, interactions with the tumor microenvironment, and therapeutic implications. Pigment. Cell Melanoma Res. 2018, 31, 11–30. [Google Scholar] [CrossRef]
- Ho, J.; de Moura, M.B.; Lin, Y.; Vincent, G.; Thorne, S.; Duncan, L.M.; Hui-Min, L.; Kirkwood, J.M.; Becker, D.; Van Houten, B.; et al. Importance of glycolysis and oxidative phosphorylation in advanced melanoma. Mol. Cancer 2012, 11, 76. [Google Scholar] [CrossRef]
- Khamari, R.; Trinh, A.; Gabert, P.E.; Corazao-Rozas, P.; Riveros-Cruz, S.; Balayssac, S.; Malet-Martino, M.; Dekiouk, S.; Joncquel Chevalier Curt, M.; Maboudou, P.; et al. Glucose metabolism and NRF2 coordinate the antioxidant response in melanoma resistant to MAPK inhibitors. Cell Death Dis. 2018, 9, 325. [Google Scholar] [CrossRef] [PubMed]
- Haq, R.; Shoag, J.; Andreu-Perez, P.; Yokoyama, S.; Edelman, H.; Rowe, G.C.; Frederick, D.T.; Hurley, A.D.; Nellore, A.; Kung, A.L.; et al. Oncogenic BRAF regulates oxidative metabolism via PGC1alpha and MITF. Cancer Cell 2013, 23, 302–315. [Google Scholar] [CrossRef] [PubMed]
- Vashisht Gopal, Y.N.; Gammon, S.; Prasad, R.; Knighton, B.; Pisaneschi, F.; Roszik, J.; Feng, N.; Johnson, S.; Pramanik, S.; Sudderth, J.; et al. A Novel Mitochondrial Inhibitor Blocks MAPK Pathway and Overcomes MAPK Inhibitor Resistance in Melanoma. Clin. Cancer Res. 2019, 25, 6429–6442. [Google Scholar] [CrossRef] [PubMed]
- Roesch, A.; Vultur, A.; Bogeski, I.; Wang, H.; Zimmermann, K.M.; Speicher, D.; Korbel, C.; Laschke, M.W.; Gimotty, P.A.; Philipp, S.E.; et al. Overcoming intrinsic multidrug resistance in melanoma by blocking the mitochondrial respiratory chain of slow-cycling JARID1B(high) cells. Cancer Cell 2013, 23, 811–825. [Google Scholar] [CrossRef]
- Zhang, G.; Frederick, D.T.; Wu, L.; Wei, Z.; Krepler, C.; Srinivasan, S.; Chae, Y.C.; Xu, X.; Choi, H.; Dimwamwa, E.; et al. Targeting mitochondrial biogenesis to overcome drug resistance to MAPK inhibitors. J. Clin. Investig. 2016, 126, 1834–1856. [Google Scholar] [CrossRef]
- Gopal, Y.N.; Rizos, H.; Chen, G.; Deng, W.; Frederick, D.T.; Cooper, Z.A.; Scolyer, R.A.; Pupo, G.; Komurov, K.; Sehgal, V.; et al. Inhibition of mTORC1/2 overcomes resistance to MAPK pathway inhibitors mediated by PGC1alpha and oxidative phosphorylation in melanoma. Cancer Res. 2014, 74, 7037–7047. [Google Scholar] [CrossRef]
- Munoz-Couselo, E.; Adelantado, E.Z.; Ortiz, C.; Garcia, J.S.; Perez-Garcia, J. NRAS-mutant melanoma: Current challenges and future prospect. Oncol. Targets Ther. 2017, 10, 3941–3947. [Google Scholar] [CrossRef]
- Ascierto, P.A.; Kirkwood, J.M.; Grob, J.J.; Simeone, E.; Grimaldi, A.M.; Maio, M.; Palmieri, G.; Testori, A.; Marincola, F.M.; Mozzillo, N. The role of BRAF V600 mutation in melanoma. J. Transl. Med. 2012, 10, 85. [Google Scholar] [CrossRef]
- Lee, S.; Rauch, J.; Kolch, W. Targeting MAPK Signaling in Cancer: Mechanisms of Drug Resistance and Sensitivity. Int. J. Mol. Sci. 2020, 21, 1102. [Google Scholar] [CrossRef]
- Papa, S.; Choy, P.M.; Bubici, C. The ERK and JNK pathways in the regulation of metabolic reprogramming. Oncogene 2019, 38, 2223–2240. [Google Scholar] [CrossRef]
- Haq, R.; Fisher, D.E.; Widlund, H.R. Molecular pathways: BRAF induces bioenergetic adaptation by attenuating oxidative phosphorylation. Clin. Cancer Res. 2014, 20, 2257–2263. [Google Scholar] [CrossRef] [PubMed]
- Acciardo, S.; Mignion, L.; Lacomblez, E.; Schoonjans, C.; Joudiou, N.; Gourgue, F.; Bouzin, C.; Baurain, J.F.; Gallez, B.; Jordan, B.F. Metabolic imaging using hyperpolarized (13) C-pyruvate to assess sensitivity to the B-Raf inhibitor vemurafenib in melanoma cells and xenografts. J. Cell Mol. Med. 2020, 24, 1934–1944. [Google Scholar] [CrossRef] [PubMed]
- Delgado-Goni, T.; Miniotis, M.F.; Wantuch, S.; Parkes, H.G.; Marais, R.; Workman, P.; Leach, M.O.; Beloueche-Babari, M. The BRAF Inhibitor Vemurafenib Activates Mitochondrial Metabolism and Inhibits Hyperpolarized Pyruvate-Lactate Exchange in BRAF-Mutant Human Melanoma Cells. Mol. Cancer Ther. 2016, 15, 2987–2999. [Google Scholar] [CrossRef] [PubMed]
- Parmenter, T.J.; Kleinschmidt, M.; Kinross, K.M.; Bond, S.T.; Li, J.; Kaadige, M.R.; Rao, A.; Sheppard, K.E.; Hugo, W.; Pupo, G.M.; et al. Response of BRAF-mutant melanoma to BRAF inhibition is mediated by a network of transcriptional regulators of glycolysis. Cancer Discov. 2014, 4, 423–433. [Google Scholar] [CrossRef] [PubMed]
- Theodosakis, N.; Held, M.A.; Marzuka-Alcala, A.; Meeth, K.M.; Micevic, G.; Long, G.V.; Scolyer, R.A.; Stern, D.F.; Bosenberg, M.W. BRAF Inhibition Decreases Cellular Glucose Uptake in Melanoma in Association with Reduction in Cell Volume. Mol. Cancer Ther. 2015, 14, 1680–1692. [Google Scholar] [CrossRef] [PubMed]
- Hardeman, K.N.; Peng, C.; Paudel, B.B.; Meyer, C.T.; Luong, T.; Tyson, D.R.; Young, J.D.; Quaranta, V.; Fessel, J.P. Dependence On Glycolysis Sensitizes BRAF-mutated Melanomas For Increased Response To Targeted BRAF Inhibition. Sci. Rep. 2017, 7, 42604. [Google Scholar] [CrossRef]
- Slominski, R.M.; Zmijewski, M.A.; Slominski, A.T. The role of melanin pigment in melanoma. Exp. Dermatol. 2015, 24, 258–259. [Google Scholar] [CrossRef]
- Slominski, A.; Zmijewski, M.A.; Pawelek, J. L-tyrosine and L-dihydroxyphenylalanine as hormone-like regulators of melanocyte functions. Pigment. Cell Melanoma Res. 2012, 25, 14–27. [Google Scholar] [CrossRef]
- Picardo, M.; Slominski, A.T. Melanin pigmentation and melanoma. Exp. Dermatol. 2017, 26, 555–556. [Google Scholar] [CrossRef]
- Slominski, A.; Kim, T.K.; Brozyna, A.A.; Janjetovic, Z.; Brooks, D.L.; Schwab, L.P.; Skobowiat, C.; Jozwicki, W.; Seagroves, T.N. The role of melanogenesis in regulation of melanoma behavior: Melanogenesis leads to stimulation of HIF-1alpha expression and HIF-dependent attendant pathways. Arch. Biochem. Biophys. 2014, 563, 79–93. [Google Scholar] [CrossRef]
- Aminzadeh-Gohari, S.; Weber, D.D.; Vidali, S.; Catalano, L.; Kofler, B.; Feichtinger, R.G. From old to new—Repurposing drugs to target mitochondrial energy metabolism in cancer. Semin. Cell Dev. Biol. 2020, 98, 211–223. [Google Scholar] [CrossRef] [PubMed]
- Xiong, Y.; Liu, W.; Huang, Q.; Wang, J.; Wang, Y.; Li, H.; Fu, X. Tigecycline as a dual inhibitor of retinoblastoma and angiogenesis via inducing mitochondrial dysfunctions and oxidative damage. Sci. Rep. 2018, 8, 11747. [Google Scholar] [CrossRef] [PubMed]
- Wang, B.; Ao, J.; Yu, D.; Rao, T.; Ruan, Y.; Yao, X. Inhibition of mitochondrial translation effectively sensitizes renal cell carcinoma to chemotherapy. Biochem. Biophys. Res. Commun. 2017, 490, 767–773. [Google Scholar] [CrossRef] [PubMed]
- Hu, B.; Guo, Y. Inhibition of mitochondrial translation as a therapeutic strategy for human ovarian cancer to overcome chemoresistance. Biochem. Biophys. Res. Commun. 2018. [Google Scholar] [CrossRef]
- Xiang, W.; Cheong, J.K.; Ang, S.H.; Teo, B.; Xu, P.; Asari, K.; Sun, W.T.; Than, H.; Bunte, R.M.; Virshup, D.M.; et al. Pyrvinium selectively targets blast phase-chronic myeloid leukemia through inhibition of mitochondrial respiration. Oncotarget 2015, 6, 33769–33780. [Google Scholar] [CrossRef]
- Xiao, M.; Zhang, L.; Zhou, Y.; Rajoria, P.; Wang, C. Pyrvinium selectively induces apoptosis of lymphoma cells through impairing mitochondrial functions and JAK2/STAT5. Biochem. Biophys. Res. Commun. 2016, 469, 716–722. [Google Scholar] [CrossRef]
- Fu, X.; Liu, W.; Huang, Q.; Wang, Y.; Li, H.; Xiong, Y. Targeting mitochondrial respiration selectively sensitizes pediatric acute lymphoblastic leukemia cell lines and patient samples to standard chemotherapy. Am. J. Cancer Res. 2017, 7, 2395–2405. [Google Scholar]
- Dijk, S.N.; Protasoni, M.; Elpidorou, M.; Kroon, A.M.; Taanman, J.W. Mitochondria as target to inhibit proliferation and induce apoptosis of cancer cells: The effects of doxycycline and gemcitabine. Sci. Rep. 2020, 10, 4363. [Google Scholar] [CrossRef]
- Allen, J.E.; Kline, C.L.; Prabhu, V.V.; Wagner, J.; Ishizawa, J.; Madhukar, N.; Lev, A.; Baumeister, M.; Zhou, L.; Lulla, A.; et al. Discovery and clinical introduction of first-in-class imipridone ONC201. Oncotarget 2016, 7, 74380–74392. [Google Scholar] [CrossRef]
- Nii, T.; Prabhu, V.V.; Ruvolo, V.; Madhukar, N.; Zhao, R.; Mu, H.; Heese, L.; Nishida, Y.; Kojima, K.; Garnett, M.J.; et al. Imipridone ONC212 activates orphan G protein-coupled receptor GPR132 and integrated stress response in acute myeloid leukemia. Leukemia 2019, 33, 2805–2816. [Google Scholar] [CrossRef]
- Wagner, J.; Kline, C.L.; Ralff, M.D.; Lev, A.; Lulla, A.; Zhou, L.; Olson, G.L.; Nallaganchu, B.R.; Benes, C.H.; Allen, J.E.; et al. Preclinical evaluation of the imipridone family, analogs of clinical stage anti-cancer small molecule ONC201, reveals potent anti-cancer effects of ONC212. Cell Cycle 2017, 16, 1790–1799. [Google Scholar] [CrossRef] [PubMed]
- Greer, Y.E.; Porat-Shliom, N.; Nagashima, K.; Stuelten, C.; Crooks, D.; Koparde, V.N.; Gilbert, S.F.; Islam, C.; Ubaldini, A.; Ji, Y.; et al. ONC201 kills breast cancer cells in vitro by targeting mitochondria. Oncotarget 2018, 9, 18454–18479. [Google Scholar] [CrossRef] [PubMed]
- Ishida, C.T.; Zhang, Y.; Bianchetti, E.; Shu, C.; Nguyen, T.T.T.; Kleiner, G.; Sanchez-Quintero, M.J.; Quinzii, C.M.; Westhoff, M.A.; Karpel-Massler, G.; et al. Metabolic Reprogramming by Dual AKT/ERK Inhibition through Imipridones Elicits Unique Vulnerabilities in Glioblastoma. Clin. Cancer Res. 2018, 24, 5392–5406. [Google Scholar] [CrossRef] [PubMed]
- Ishizawa, J.; Zarabi, S.F.; Davis, R.E.; Halgas, O.; Nii, T.; Jitkova, Y.; Zhao, R.; St-Germain, J.; Heese, L.E.; Egan, G.; et al. Mitochondrial ClpP-Mediated Proteolysis Induces Selective Cancer Cell Lethality. Cancer Cell 2019, 35, 721–737. [Google Scholar] [CrossRef]
- Morscher, R.J.; Aminzadeh-Gohari, S.; Feichtinger, R.G.; Mayr, J.A.; Lang, R.; Neureiter, D.; Sperl, W.; Kofler, B. Inhibition of Neuroblastoma Tumor Growth by Ketogenic Diet and/or Calorie Restriction in a CD1-Nu Mouse Model. PLoS ONE 2015, 10, e0129802. [Google Scholar] [CrossRef]
- Bentlage, H.A.; Wendel, U.; Schagger, H.; ter Laak, H.J.; Janssen, A.J.; Trijbels, J.M. Lethal infantile mitochondrial disease with isolated complex I deficiency in fibroblasts but with combined complex I and IV deficiencies in muscle. Neurology 1996, 47, 243–248. [Google Scholar] [CrossRef]
- Srere, P.A. Citrate synthase. Methods Enzymol. 1969, 13, 3–5. [Google Scholar] [CrossRef]
- Rustin, P.; Chretien, D.; Bourgeron, T.; Gerard, B.; Rotig, A.; Saudubray, J.M.; Munnich, A. Biochemical and molecular investigations in respiratory chain deficiencies. Clin. Chim. Acta 1994, 228, 35–51. [Google Scholar] [CrossRef]
- Vidali, S.; Aminzadeh-Gohari, S.; Vatrinet, R.; Iommarini, L.; Porcelli, A.M.; Kofler, B.; Feichtinger, R.G. Lithium and Not Acetoacetate Influences the Growth of Cells Treated with Lithium Acetoacetate. Int. J. Mol. Sci. 2019, 20, 3104. [Google Scholar] [CrossRef]
- McQuade, J.L.; Vashisht Gopal, Y. Counteracting oxidative phosphorylation-mediated resistance of melanomas to MAPK pathway inhibition. Mol. Cell. Oncol. 2015, 2, e991610. [Google Scholar] [CrossRef]
- Brummer, C.; Faerber, S.; Bruss, C.; Blank, C.; Lacroix, R.; Haferkamp, S.; Herr, W.; Kreutz, M.; Renner, K. Metabolic targeting synergizes with MAPK inhibition and delays drug resistance in melanoma. Cancer Lett. 2019, 442, 453–463. [Google Scholar] [CrossRef] [PubMed]
- Ishii, I.; Harada, Y.; Kasahara, T. Reprofiling a classical anthelmintic, pyrvinium pamoate, as an anti-cancer drug targeting mitochondrial respiration. Front. Oncol. 2012, 2, 137. [Google Scholar] [CrossRef] [PubMed]
- Hall, A.; Meyle, K.D.; Lange, M.K.; Klima, M.; Sanderhoff, M.; Dahl, C.; Abildgaard, C.; Thorup, K.; Moghimi, S.M.; Jensen, P.B.; et al. Dysfunctional oxidative phosphorylation makes malignant melanoma cells addicted to glycolysis driven by the (V600E)BRAF oncogene. Oncotarget 2013, 4, 584–599. [Google Scholar] [CrossRef] [PubMed]
- Vazquez, F.; Lim, J.H.; Chim, H.; Bhalla, K.; Girnun, G.; Pierce, K.; Clish, C.B.; Granter, S.R.; Widlund, H.R.; Spiegelman, B.M.; et al. PGC1alpha expression defines a subset of human melanoma tumors with increased mitochondrial capacity and resistance to oxidative stress. Cancer Cell 2013, 23, 287–301. [Google Scholar] [CrossRef] [PubMed]
- Connolly, N.M.C.; Theurey, P.; Adam-Vizi, V.; Bazan, N.G.; Bernardi, P.; Bolanos, J.P.; Culmsee, C.; Dawson, V.L.; Deshmukh, M.; Duchen, M.R.; et al. Guidelines on experimental methods to assess mitochondrial dysfunction in cellular models of neurodegenerative diseases. Cell Death Differ. 2018, 25, 542–572. [Google Scholar] [CrossRef]
- Hill, B.G.; Benavides, G.A.; Lancaster, J.R., Jr.; Ballinger, S.; Dell’Italia, L.; Jianhua, Z.; Darley-Usmar, V.M. Integration of cellular bioenergetics with mitochondrial quality control and autophagy. Biol. Chem. 2012, 393, 1485–1512. [Google Scholar] [CrossRef]
- Ferretta, A.; Maida, I.; Guida, S.; Azzariti, A.; Porcelli, L.; Tommasi, S.; Zanna, P.; Cocco, T.; Guida, M.; Guida, G. New insight into the role of metabolic reprogramming in melanoma cells harboring BRAF mutations. Biochim. Biophys. Acta 2016, 1863, 2710–2718. [Google Scholar] [CrossRef]
- Slominski, A.; Tobin, D.J.; Shibahara, S.; Wortsman, J. Melanin pigmentation in mammalian skin and its hormonal regulation. Physiol. Rev. 2004, 84, 1155–1228. [Google Scholar] [CrossRef]
- Meira, W.V.; Heinrich, T.A.; Cadena, S.; Martinez, G.R. Melanogenesis inhibits respiration in B16-F10 melanoma cells whereas enhances mitochondrial cell content. Exp. Cell Res. 2017, 350, 62–72. [Google Scholar] [CrossRef]
- Cao, J.; Dai, X.; Wan, L.; Wang, H.; Zhang, J.; Goff, P.S.; Sviderskaya, E.V.; Xuan, Z.; Xu, Z.; Xu, X.; et al. The E3 ligase APC/C(Cdh1) promotes ubiquitylation-mediated proteolysis of PAX3 to suppress melanocyte proliferation and melanoma growth. Sci. Signal. 2015, 8, ra87. [Google Scholar] [CrossRef]
- Kumar, D.; Rahman, H.; Tyagi, E.; Liu, T.; Li, C.; Lu, R.; Lum, D.; Holmen, S.L.; Maschek, J.A.; Cox, J.E.; et al. Aspirin Suppresses PGE2 and Activates AMP Kinase to Inhibit Melanoma Cell Motility, Pigmentation, and Selective Tumor Growth In Vivo. Cancer Prev. Res. (Phila) 2018, 11, 629–642. [Google Scholar] [CrossRef] [PubMed]
- Viale, A.; Corti, D.; Draetta, G.F. Tumors and mitochondrial respiration: A neglected connection. Cancer Res. 2015, 75, 3685–3686. [Google Scholar] [CrossRef]
- Martin, W.F.; Garg, S.; Zimorski, V. Endosymbiotic theories for eukaryote origin. Philos. Trans. R. Soc. Lond. B Biol. Sci. 2015, 370, 20140330. [Google Scholar] [CrossRef] [PubMed]
- Rose, W.E.; Rybak, M.J. Tigecycline: First of a new class of antimicrobial agents. Pharmacotherapy 2006, 26, 1099–1110. [Google Scholar] [CrossRef] [PubMed]
- Lamb, R.; Ozsvari, B.; Lisanti, C.L.; Tanowitz, H.B.; Howell, A.; Martinez-Outschoorn, U.E.; Sotgia, F.; Lisanti, M.P. Antibiotics that target mitochondria effectively eradicate cancer stem cells, across multiple tumor types: Treating cancer like an infectious disease. Oncotarget 2015, 6, 4569–4584. [Google Scholar] [CrossRef] [PubMed]
- Hu, H.; Dong, Z.; Tan, P.; Zhang, Y.; Liu, L.; Yang, L.; Liu, Y.; Cui, H. Antibiotic drug tigecycline inhibits melanoma progression and metastasis in a p21CIP1/Waf1-dependent manner. Oncotarget 2016, 7, 3171–3185. [Google Scholar] [CrossRef]
- Sun, T.; Zhao, N.; Ni, C.S.; Zhao, X.L.; Zhang, W.Z.; Su, X.; Zhang, D.F.; Gu, Q.; Sun, B.C. Doxycycline inhibits the adhesion and migration of melanoma cells by inhibiting the expression and phosphorylation of focal adhesion kinase (FAK). Cancer Lett. 2009, 285, 141–150. [Google Scholar] [CrossRef]
- Elkrief, A.; El Raichani, L.; Richard, C.; Messaoudene, M.; Belkaid, W.; Malo, J.; Belanger, K.; Miller, W.; Jamal, R.; Letarte, N.; et al. Antibiotics are associated with decreased progression-free survival of advanced melanoma patients treated with immune checkpoint inhibitors. Oncoimmunology 2019, 8, e1568812. [Google Scholar] [CrossRef]
- Boursi, B.; Mamtani, R.; Haynes, K.; Yang, Y.X. Recurrent antibiotic exposure may promote cancer formation--Another step in understanding the role of the human microbiota? Eur. J. Cancer 2015, 51, 2655–2664. [Google Scholar] [CrossRef]
- Dik, V.K.; van Oijen, M.G.; Smeets, H.M.; Siersema, P.D. Frequent Use of Antibiotics Is Associated with Colorectal Cancer Risk: Results of a Nested Case-Control Study. Dig. Dis. Sci. 2016, 61, 255–264. [Google Scholar] [CrossRef]
- Cao, Y.; Wu, K.; Mehta, R.; Drew, D.A.; Song, M.; Lochhead, P.; Nguyen, L.H.; Izard, J.; Fuchs, C.S.; Garrett, W.S.; et al. Long-term use of antibiotics and risk of colorectal adenoma. Gut 2018, 67, 672–678. [Google Scholar] [CrossRef]
- Turner, J.A.; Johnson, P.E., Jr. Pyrvinium pamoate in the treatment of pinworm infection (enterobiasis) in the home. J. Pediatr. 1962, 60, 243–251. [Google Scholar] [CrossRef]
- Deng, L.; Lei, Y.; Liu, R.; Li, J.; Yuan, K.; Li, Y.; Chen, Y.; Liu, Y.; Lu, Y.; Edwards, C.K., 3rd; et al. Pyrvinium targets autophagy addiction to promote cancer cell death. Cell Death Dis. 2013, 4, e614. [Google Scholar] [CrossRef] [PubMed]
- Wiegering, A.; Uthe, F.W.; Huttenrauch, M.; Muhling, B.; Linnebacher, M.; Krummenast, F.; Germer, C.T.; Thalheimer, A.; Otto, C. The impact of pyrvinium pamoate on colon cancer cell viability. Int. J. Colorectal Dis. 2014, 29, 1189–1198. [Google Scholar] [CrossRef] [PubMed]
- Nair, R.R.; Piktel, D.; Hathaway, Q.A.; Rellick, S.L.; Thomas, P.; Saralkar, P.; Martin, K.H.; Geldenhuys, W.J.; Hollander, J.M.; Gibson, L.F. Pyrvinium Pamoate Use in a B cell Acute Lymphoblastic Leukemia Model of the Bone Tumor Microenvironment. Pharm. Res. 2020, 37, 43. [Google Scholar] [CrossRef] [PubMed]
- Harada, Y.; Ishii, I.; Hatake, K.; Kasahara, T. Pyrvinium pamoate inhibits proliferation of myeloma/erythroleukemia cells by suppressing mitochondrial respiratory complex I and STAT3. Cancer Lett. 2012, 319, 83–88. [Google Scholar] [CrossRef]
- Tomitsuka, E.; Kita, K.; Esumi, H. An anticancer agent, pyrvinium pamoate inhibits the NADH-fumarate reductase system--a unique mitochondrial energy metabolism in tumour microenvironments. J. Biochem. 2012, 152, 171–183. [Google Scholar] [CrossRef]
- Zorova, L.D.; Popkov, V.A.; Plotnikov, E.Y.; Silachev, D.N.; Pevzner, I.B.; Jankauskas, S.S.; Babenko, V.A.; Zorov, S.D.; Balakireva, A.V.; Juhaszova, M.; et al. Mitochondrial membrane potential. Anal. Biochem. 2018, 552, 50–59. [Google Scholar] [CrossRef]
- Smith, T.C.; Kinkel, A.W.; Gryczko, C.M.; Goulet, J.R. Absorption of pyrvinium pamoate. Clin. Pharmacol. Ther. 1976, 19, 802–806. [Google Scholar] [CrossRef]
- Yu, D.H.; Macdonald, J.; Liu, G.; Lee, A.S.; Ly, M.; Davis, T.; Ke, N.; Zhou, D.; Wong-Staal, F.; Li, Q.X. Pyrvinium targets the unfolded protein response to hypoglycemia and its anti-tumor activity is enhanced by combination therapy. PLoS ONE 2008, 3, e3951. [Google Scholar] [CrossRef]
- Li, B.; Flaveny, C.A.; Giambelli, C.; Fei, D.L.; Han, L.; Hang, B.I.; Bai, F.; Pei, X.H.; Nose, V.; Burlingame, O.; et al. Repurposing the FDA-approved pinworm drug pyrvinium as a novel chemotherapeutic agent for intestinal polyposis. PLoS ONE 2014, 9, e101969. [Google Scholar] [CrossRef] [PubMed]
- Esumi, H.; Lu, J.; Kurashima, Y.; Hanaoka, T. Antitumor activity of pyrvinium pamoate, 6-(dimethylamino)-2-[2-(2,5-dimethyl-1-phenyl-1H-pyrrol-3-yl)ethenyl]-1-methyl-qu inolinium pamoate salt, showing preferential cytotoxicity during glucose starvation. Cancer Sci. 2004, 95, 685–690. [Google Scholar] [CrossRef] [PubMed]
- Xu, W.; Lacerda, L.; Debeb, B.G.; Atkinson, R.L.; Solley, T.N.; Li, L.; Orton, D.; McMurray, J.S.; Hang, B.I.; Lee, E.; et al. The antihelmintic drug pyrvinium pamoate targets aggressive breast cancer. PLoS ONE 2013, 8, e71508. [Google Scholar] [CrossRef] [PubMed]
- Will, Y.; Shields, J.E.; Wallace, K.B. Drug-Induced Mitochondrial Toxicity in the Geriatric Population: Challenges and Future Directions. Biology 2019, 8, 32. [Google Scholar] [CrossRef]
- Stein, M.N.; Bertino, J.R.; Kaufman, H.L.; Mayer, T.; Moss, R.; Silk, A.; Chan, N.; Malhotra, J.; Rodriguez, L.; Aisner, J.; et al. First-in-Human Clinical Trial of Oral ONC201 in Patients with Refractory Solid Tumors. Clin. Cancer Res. 2017, 23, 4163–4169. [Google Scholar] [CrossRef]
- Available online: https://www.cancer.gov/about-cancer/treatment/clinical-trials/intervention/akterk-inhibitor-onc201 (accessed on 28 August 2020).
- Arrillaga-Romany, I.; Chi, A.S.; Allen, J.E.; Oster, W.; Wen, P.Y.; Batchelor, T.T. A phase 2 study of the first imipridone ONC201, a selective DRD2 antagonist for oncology, administered every three weeks in recurrent glioblastoma. Oncotarget 2017, 8, 79298–79304. [Google Scholar] [CrossRef]
- Lev, A.; Lulla, A.R.; Wagner, J.; Ralff, M.D.; Kiehl, J.B.; Zhou, Y.; Benes, C.H.; Prabhu, V.V.; Oster, W.; Astsaturov, I.; et al. Anti-pancreatic cancer activity of ONC212 involves the unfolded protein response (UPR) and is reduced by IGF1-R and GRP78/BIP. Oncotarget 2017, 8, 81776–81793. [Google Scholar] [CrossRef]


© 2020 by the authors. Licensee MDPI, Basel, Switzerland. This article is an open access article distributed under the terms and conditions of the Creative Commons Attribution (CC BY) license (http://creativecommons.org/licenses/by/4.0/).
Share and Cite
Aminzadeh-Gohari, S.; Weber, D.D.; Catalano, L.; Feichtinger, R.G.; Kofler, B.; Lang, R. Targeting Mitochondria in Melanoma. Biomolecules 2020, 10, 1395. https://doi.org/10.3390/biom10101395
Aminzadeh-Gohari S, Weber DD, Catalano L, Feichtinger RG, Kofler B, Lang R. Targeting Mitochondria in Melanoma. Biomolecules. 2020; 10(10):1395. https://doi.org/10.3390/biom10101395
Chicago/Turabian StyleAminzadeh-Gohari, Sepideh, Daniela D. Weber, Luca Catalano, René G. Feichtinger, Barbara Kofler, and Roland Lang. 2020. "Targeting Mitochondria in Melanoma" Biomolecules 10, no. 10: 1395. https://doi.org/10.3390/biom10101395
APA StyleAminzadeh-Gohari, S., Weber, D. D., Catalano, L., Feichtinger, R. G., Kofler, B., & Lang, R. (2020). Targeting Mitochondria in Melanoma. Biomolecules, 10(10), 1395. https://doi.org/10.3390/biom10101395