Abstract
Thin Co films were deposited on quartz and Corning glass by radio frequency magnetron sputtering. The films were postannealed at 500 °C in a furnace in air atmosphere. The resulting samples were examined with X-ray diffraction experiments, which revealed that they consist of single-phase, polycrystalline . The morphology of selected samples was recorded by atomic force microscopy. Ultraviolet-visible light absorption spectroscopy experiments probed the absorbance of the films in the wavelength range 200–1100 nm. Two types of transitions (energy gaps) were clearly identified. Both of them were found to be “blue shifted” with decreasing film thickness; this is interpreted as evidence of quantum confinement effects. For the case of the first gap value, this was corroborated by calculations based on a combination of the Potential Morphing Method and the effective mass approximation.
1. Introduction
The rapid development of modern science and technology endowed us with a series of rather demanding problems that need to be addressed. Among others, environmental pollution and the energy shortage seem to stand out. For this reason, a need arose for new materials suitable for use in the industry of energy sources and storage equipment. In this context, cobalt oxide is a very interesting material with a wide range of possible applications and a set of special properties which offer a great potential in the world of materials science. Cobalt oxide can be found in various forms and is one of the most studied materials. It was already used for the fabrication of several types of nanostructures, such as nanofilms, nanosheets [1], microspheres [2], nanorods [3], nanoparticles [4], nanowires [5], and nanoplates [6]. These efforts were mainly driven by the appetite for applications mainly related to the fields of gas sensors [7], electrochemical supercapacitors, energy storage devices, catalysts, and many other thin film-based devices [8]. The production of cobalt oxide thin film can be achieved by numerous techniques, such as chemical vapor deposition (CVD) [9], spray pyrolysis, electrodeposition techniques, the sol-gel [10], or sputtering [11]. is deposited on silver, platinum, or gold-plated stainless-steel oxides for use as a solar energy absorber, and it is widely used as an effective catalyst in environmental protection and chemical engineering.
has a normal spinel structure with a lattice parameter of 8.08 Å [12]. The unit cell has a face-centered cubic (fcc)-lattice of ions, 1/2 of the octahedral sites are filled by ions and 1/8 of the tetrahedral sites are occupied with -ions [13]. The different coordination of the cations results in a crystal field, which in turn leads to a partial degeneracy lift of the d-orbitals. The five 3D-states of the -ions are separated into three degenerate fully occupied -states and two degenerate empty -states. The 3D-electrons of the are divided into two groups: the lower e-states are fully occupied, while the higher -states are only partially occupied [14]. Moreover, the exchange interaction due to the unpaired electrons in the -states enhances the degeneracy lift even more [15,16].
belongs to p-type semiconductor category. It is an abundant nontoxic material that appears to have two distinct transitions of direct nature in the visible range of the spectrum. The corresponding optical band gaps appear at 1.5 eV and 2.2 eV, respectively. Cobalt oxide emerged as a good candidate for the absorption of high solar temperature, and it is used as a catalyst in the water cracking method as a dye for glasses and ceramics, as well as electrochromic material [17]. In last year’s research, cobalt tetraoxide was identified as a future supercapacitor [18] and cathode material for rechargeable lithium-ion batteries. Notably, has a high theoretical capacity of 890 mAh/g [19]. It is one of the most promising anode materials for this type of battery.
Several researchers worked on developing thin films. For example, Bin Huang et al. [20] developed cobalt oxide ultra-thin films by atomic layer deposition (ALD). Their goal was to study the structure, crystallinity, and morphology of ultrathin cobalt oxide films on both planar and 3D substrates. The initial growth patterns were found to be closely related to the speed of crystallization as well as the number of nucleation sites. C. A. F. Vaz et al. [21] used molecular-beam epitaxy deposition system in ultrahigh vacuum conditions to prepare epitaxial (111) films grown on a- (0001) single crystals. With the help of RHEED and LEED methods, they concluded that the growth of the films proceeds via the Stranski–Krastanov mode. These results demonstrated significantly modified electronic and structural properties of metal oxides which were affected by the variations in the crystal.
In the first stage of the present work, we grow cobalt thin films on transparent substrates. Next, the developed films were oxidized at 500 °C under an air atmosphere, resulting in the formation of . Ultraviolet-visible (UV-vis.) spectroscopy absorption spectra provide evidence about the existence of the two direct optical gaps of . As the film thickness decreases approaching 1 nm, a “blue shift” in the position of the optical gaps can be observed. We demonstrate this effect by studying the maximum rate of the increase of absorbance (derivative plots [22]). Another third, strong optical transition occurs at just above 4 eV; however, in this work, we will deal only with the first two optical transitions.
Besides the experimental measurements, modeling the dependence of the optical gap as a function of the film’s thickness using a well-tested methodology that employs a combination of Hartree–Fock (HF) theory and the effective mass approximation (EMA) was also attempted. In particular, the two particles (electron and hole) are described by the equations
The term V includes the potential of the well and the Coulomb and exchange interactions between the electron and the hole. These equations are consistently solved for each particle with the help of the potential morphing method (PMM) [23,24], which was specially devised for the solution of Schrodinger’s equation for an arbitrary potential. In this context, the solution is pursued by starting from a known potential with well-known solutions and gradually transforming it so that after a huge number of small steps, it matches the desired form. This is achieved by solving the time dependent equation
where is the gradually changing potential. The technical details and the theoretical background of this combined methodology along with implementation examples can be found the existing literature [23,24,25].
2. Experimental Details
Thin Co films in the thickness range 0.5–218 nm were deposited by the radio frequency magnetron sputtering method under high vacuum (base pressure in the 10–7 mbar range). The Co films were deposited on quartz and Corning glass. The Co sputtering target was an Alfa Aesar (2-inch, 0.05 mm thick, 99.95% purity) placed on the Torus 2 HV circular sputtering source of Kurt J. Lesker Company. The power of the microwave frequencies was 30 W, and it was kept constant by means of a feedback circuit. For better homogeneity of the films, we used a relatively long target-substrate distance 6–7 cm. During deposition, we let argon flow into the chamber through a precision valve. Ionized argon was the 99.999% pure sputtering gas. The working pressure during deposition was about mbar. The substrate temperature was approximately room temperature. Afterwards, films thinner (thicker) than 30 nm were annealed in a muffle furnace, model Linn elektronik VMK 22, for 30 (60) min at 500 °C in air.
Film thickness was monitored via a precalibrated quartz balance system (Inficon XTM/2). The calibration was carried out by measuring the depth of a scratch on the film by atomic force microscope (AFM) [26]. After oxidation, the film thickness increases by 1.99-times; see similar considerations in Ref. [27]. This was also verified by our AFM experiments.
The characterization of our samples’ structural properties was carried out via X-ray Diffraction (XRD) using a diffractometer (Bruker, D8-Advance) with Ni-filtered CuKa1 radiation ( nm), operated at 40 kV and 40 mA. For each sample the scanning speed was set to 0.7 s/step while each step was 0.02°.
Finally, the measurements for the the UV-vis. spectra were performed in the transmission geometry (in room temperature) with the help of a Shimadzu UV 1800, UV-Vis Spectrophotometer. (Shimadzu, Kyoto, Japan) at wavelengths ranging from 200–1100 nm.
3. Results and Discussion
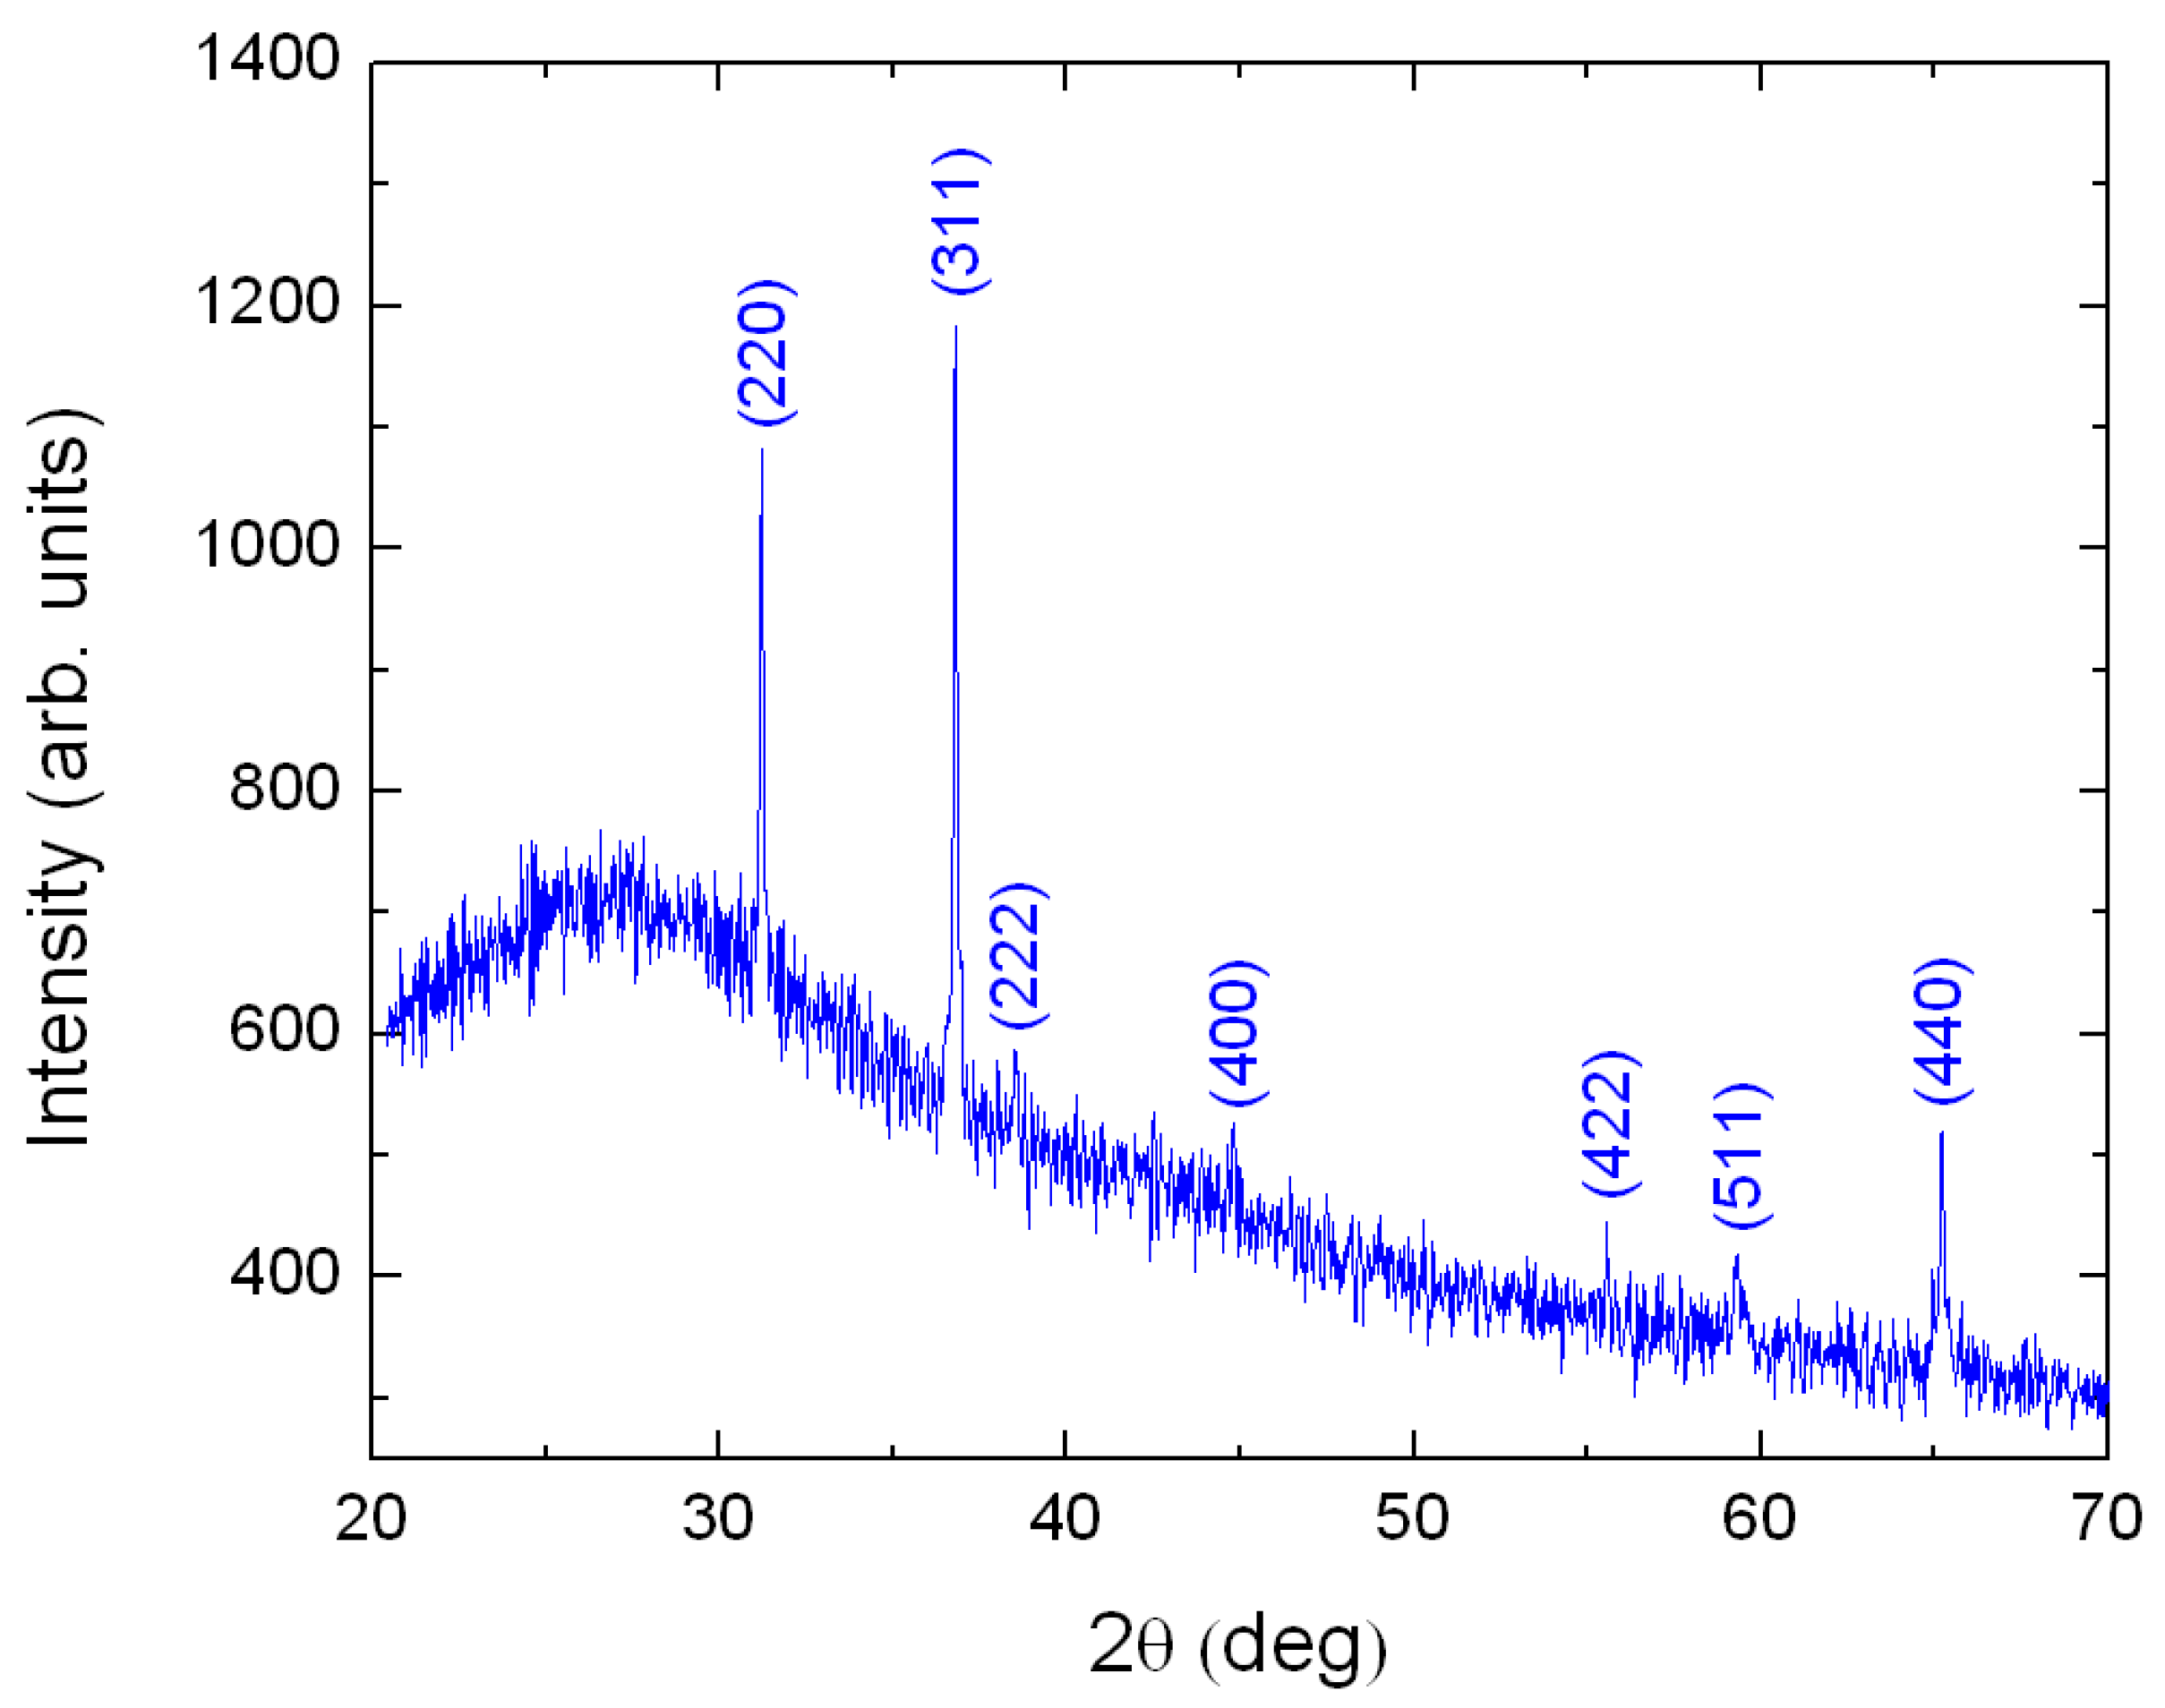
The XRD experiment was performed only on the thickest sample because for thinner films, about 100 nm and below, the XRD signal was too weak to be measured. Figure 1 presents the XRD pattern of a 218 nm-thick Cobalt film grown on Corning glass after annealing for 60 minutes at 500 °C in a furnace under air atmosphere. The film thickness of the formed was 434 nm. The observed diffraction peaks correspond with the Joint Committee on Powder Diffraction Standards (JCPDS) card No 43-1003, corresponding to cubic phase of [28].
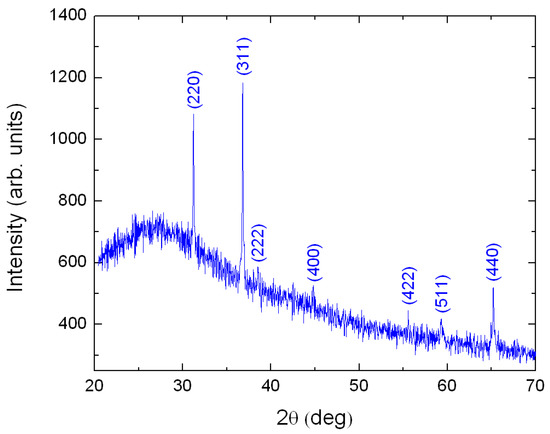
Figure 1.
XRD pattern for a thick film. The sample is polycrystalline. All XRD peaks are identified with help of Ref. [28].
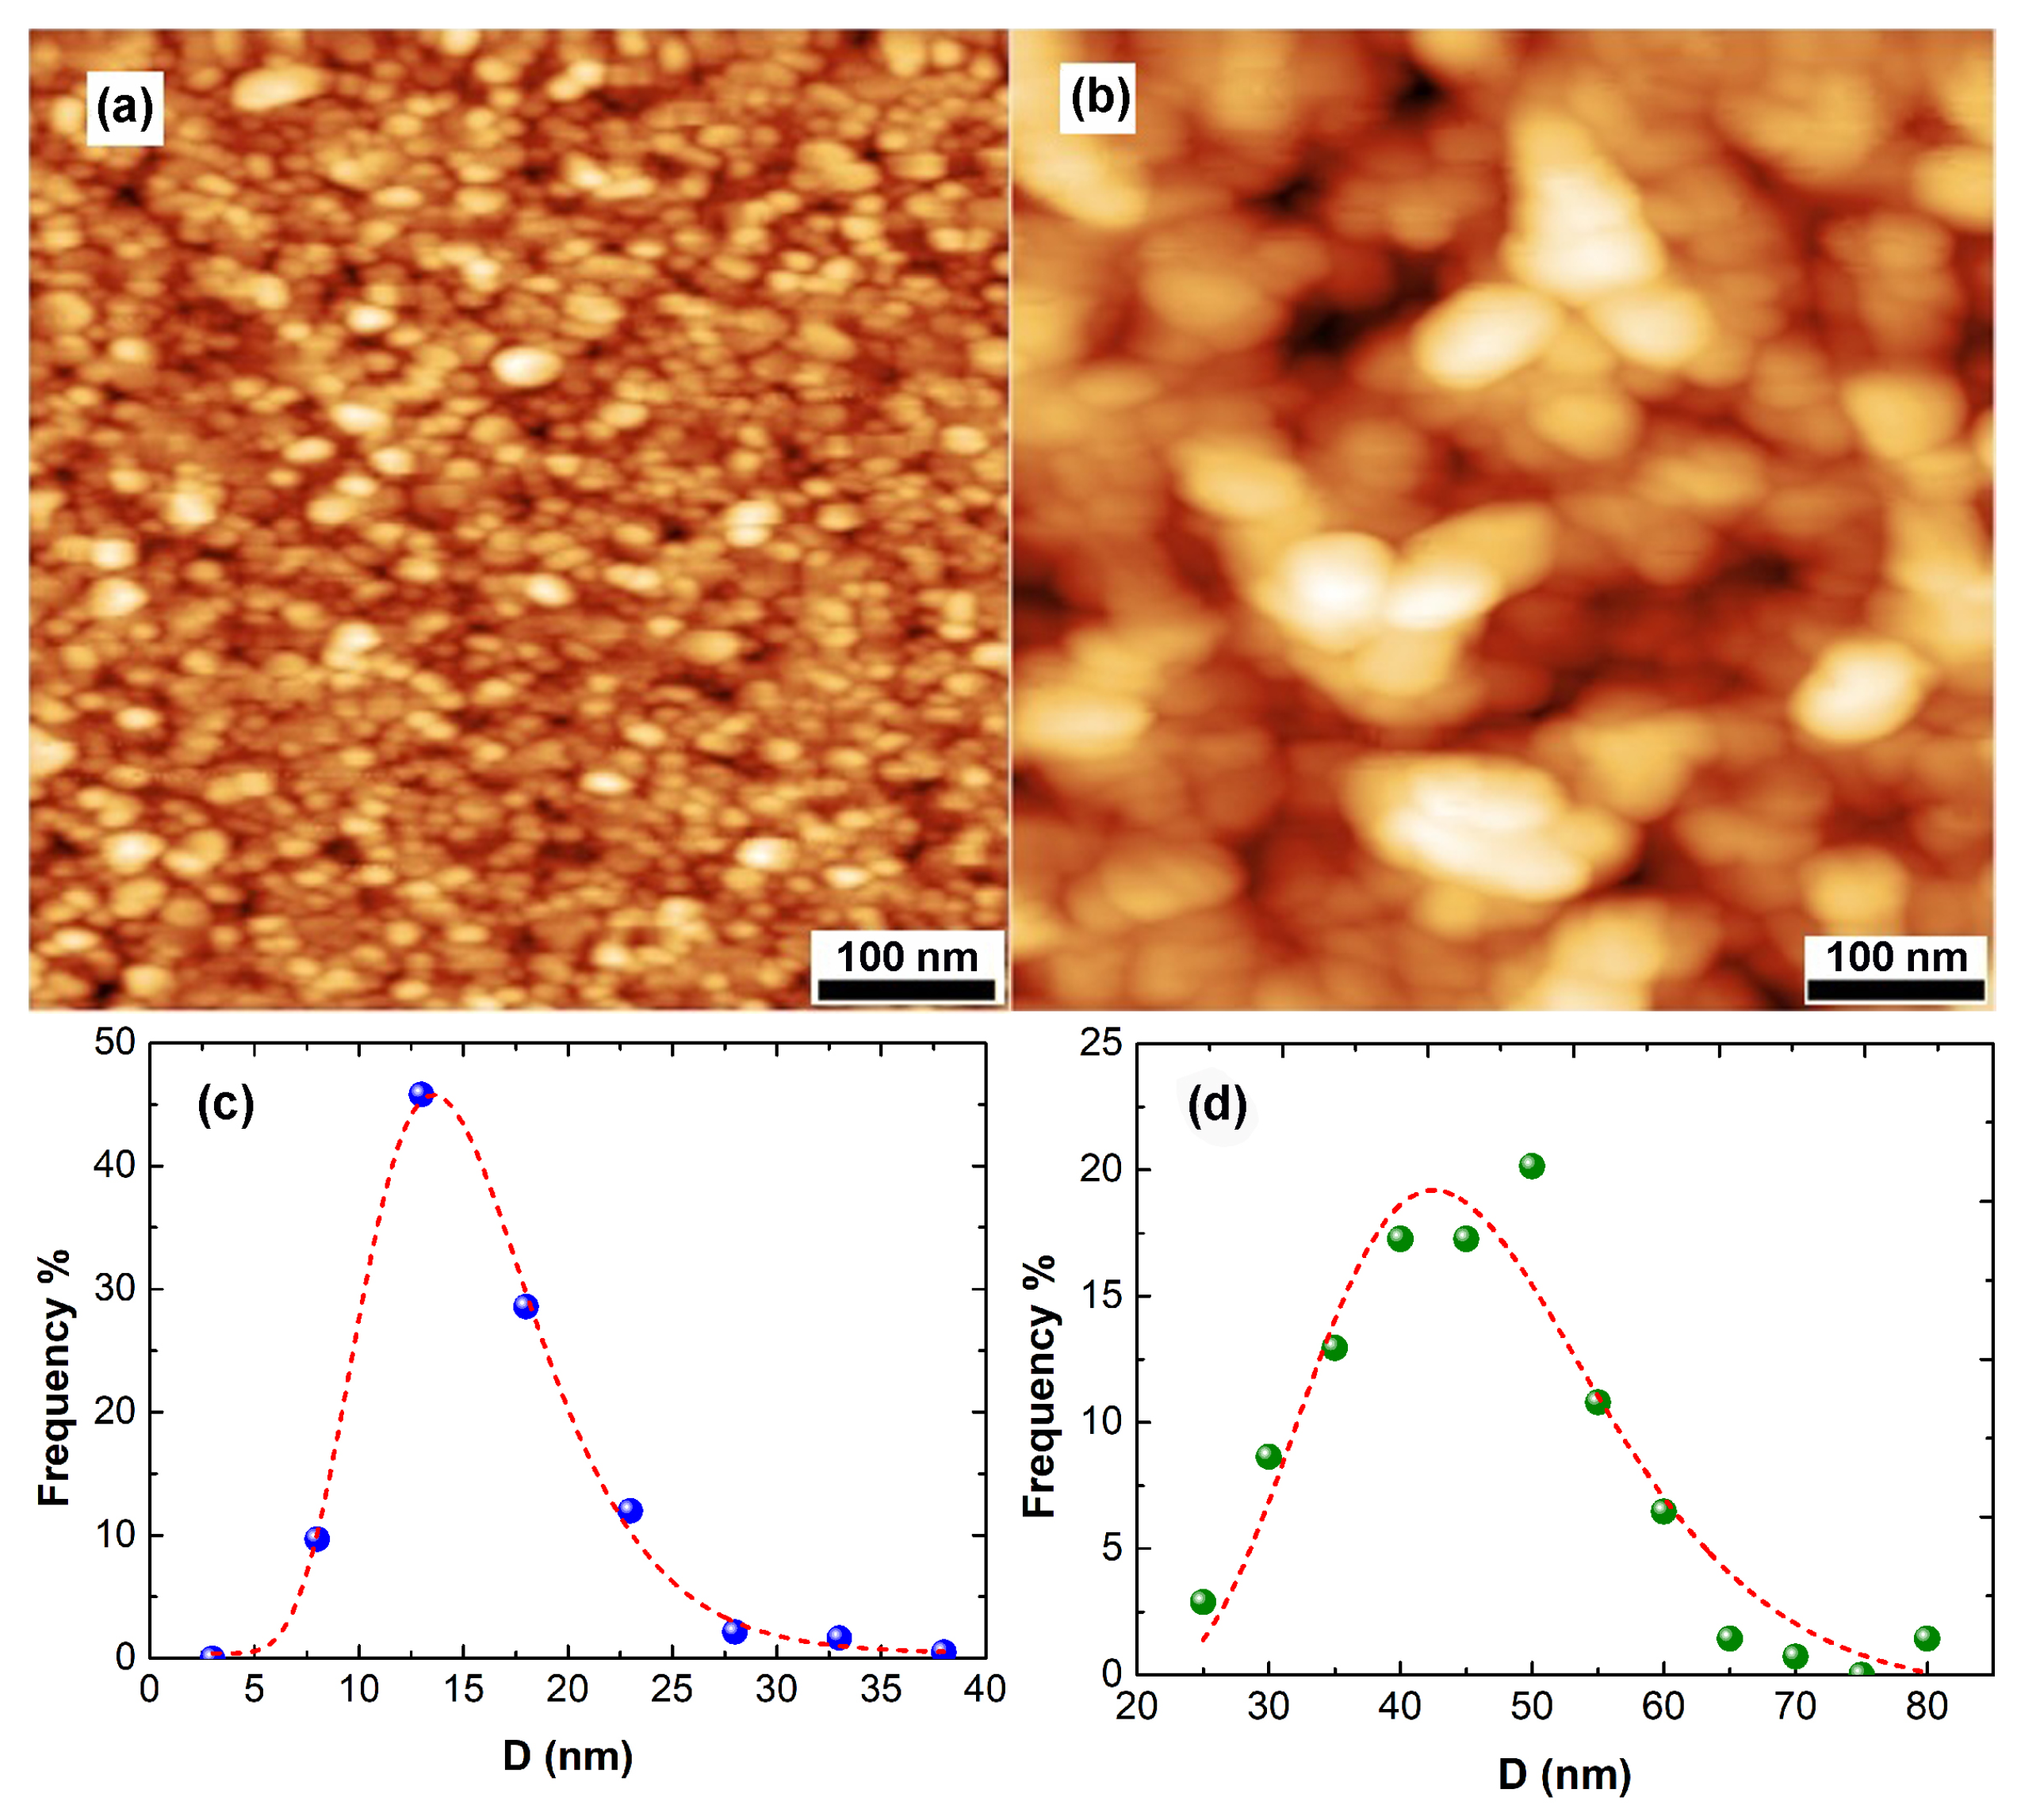
Figure 2 depicts images of the surface morphology of two films with thickness t = 14.5 nm (a) and 100 nm (b). A polycrystalline structure is revealed. The two films are relatively smooth and continuous. The nanocrystallites (grains) are homogeneous with respect to their size. This is better understood by Figure 2c,d. In Figure 2c,d, the size distribution of the grain-diameter D of the two specimens of Figure 2a,b are plotted. These distributions are suitably fitted by the log-normal function [29]. The average values of D are equal to 15 and 45 nm for the 14.5- and 100 nm-thick films, respectively. Both distributions are relatively narrow, revealing a monomodal growth mode.

Figure 2.
AFM images of a 14.5 nm-thick specimen (a) and a 100 nm-thick specimen (b) of films. Corresponding distribution of grain size along with the log-norm fittings lines are presented in (c,d).
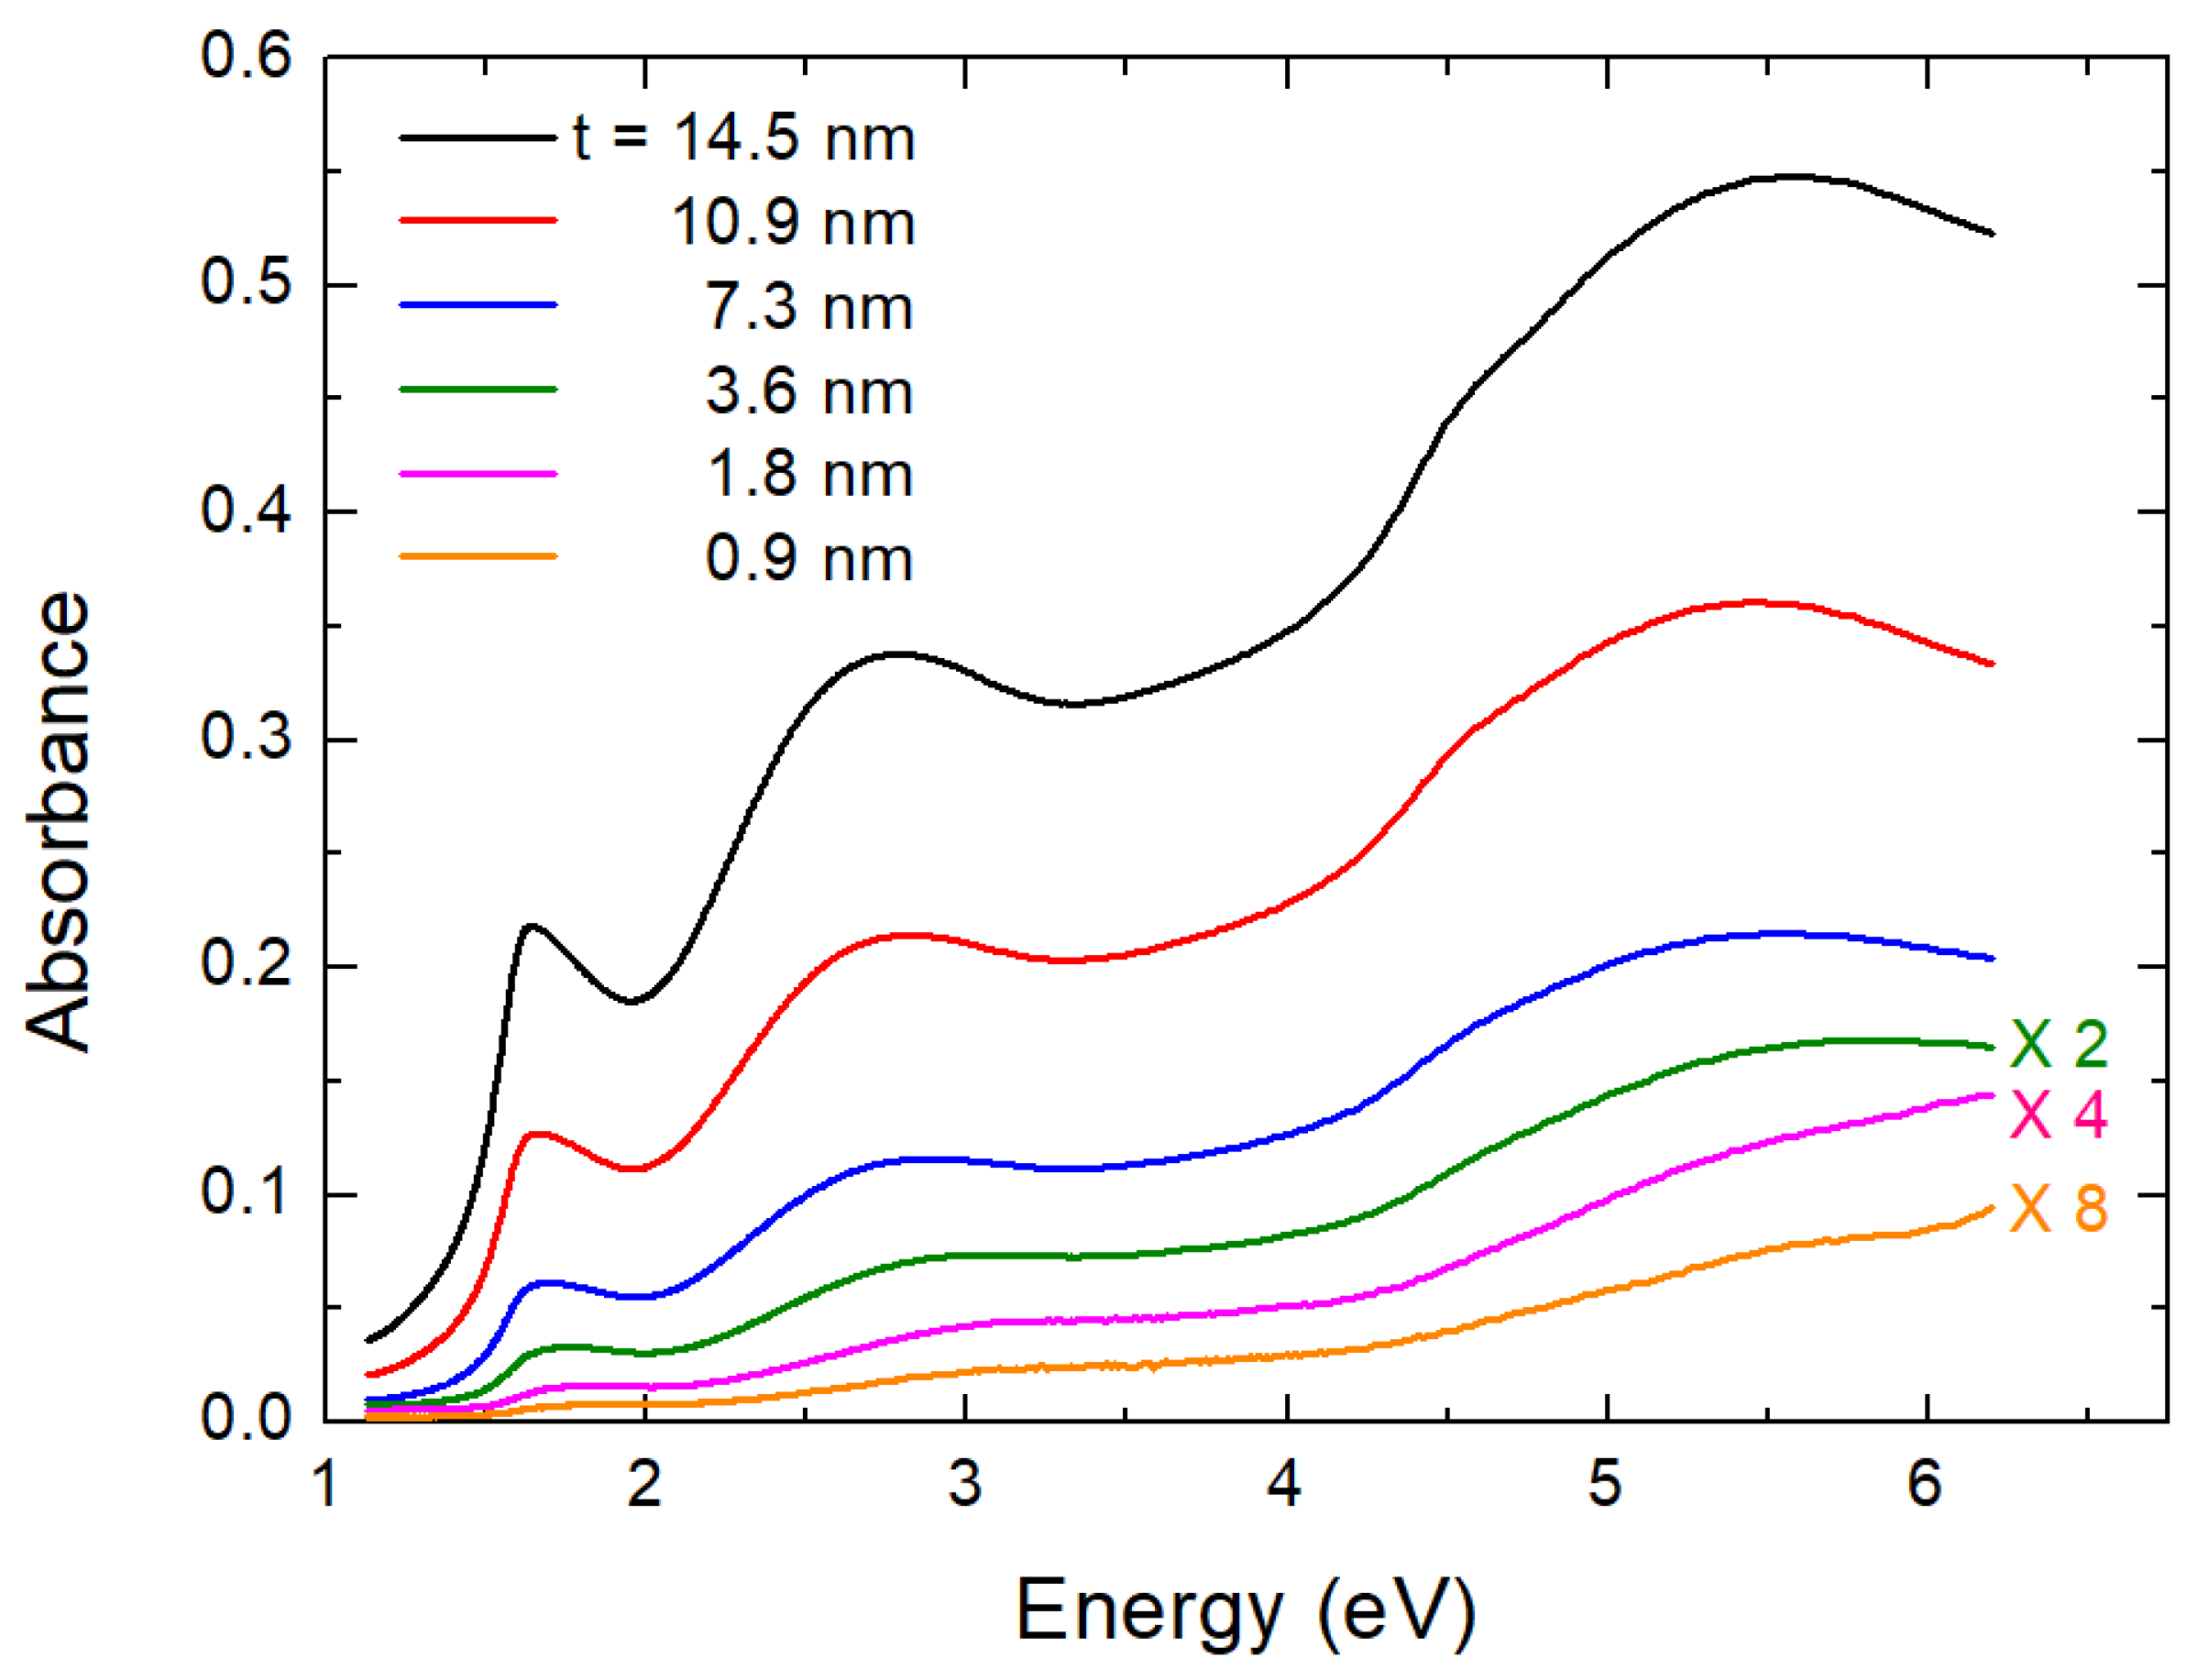
In Figure 3, we present the optical density (absorbance), A, and spectra for six films whose thickness, t, varies from 0.9–14.5 nm. Corning glass has a cutoff limit at about 300 nm (4.1 eV). Therefore, in Figure 3 we present the A spectra for films deposited on quartz substrate (it is practically transparent) to view clearly all features down to 200 nm (6.2 eV). The error bar is as in previous works ± 0.02 eV (maximum error bar) [11]. The spectra were corrected by dividing them by the quartz absorbance spectrum measured under the same experimental conditions. Absorbance is small but not zero, even at 1.1 eV, where the down limit of our instrument is located. This happens because there is some absorption-like edge at about 0.6 eV adding background to the measurements. In early references, e.g., Refs. [30,31], this was attributed to the first optical band gap of . However, recently, it was shown by time-resolved optical spectroscopy measurements [32,33,34] and by rigorous calculations [35], which illustrated that this was due to localized polaron states in the material. Therefore, the first and second direct optical band gaps of are placed at about 1.5 eV and just above 2 eV, where one may see strong increases of the absorbance.

Figure 3.
Absorbance of six thin films. Thickness t of films is shown in legend. In the interest of figure’s clarity, lines corresponding to thinner films were scaled by suitable factors, as indicated in figure.
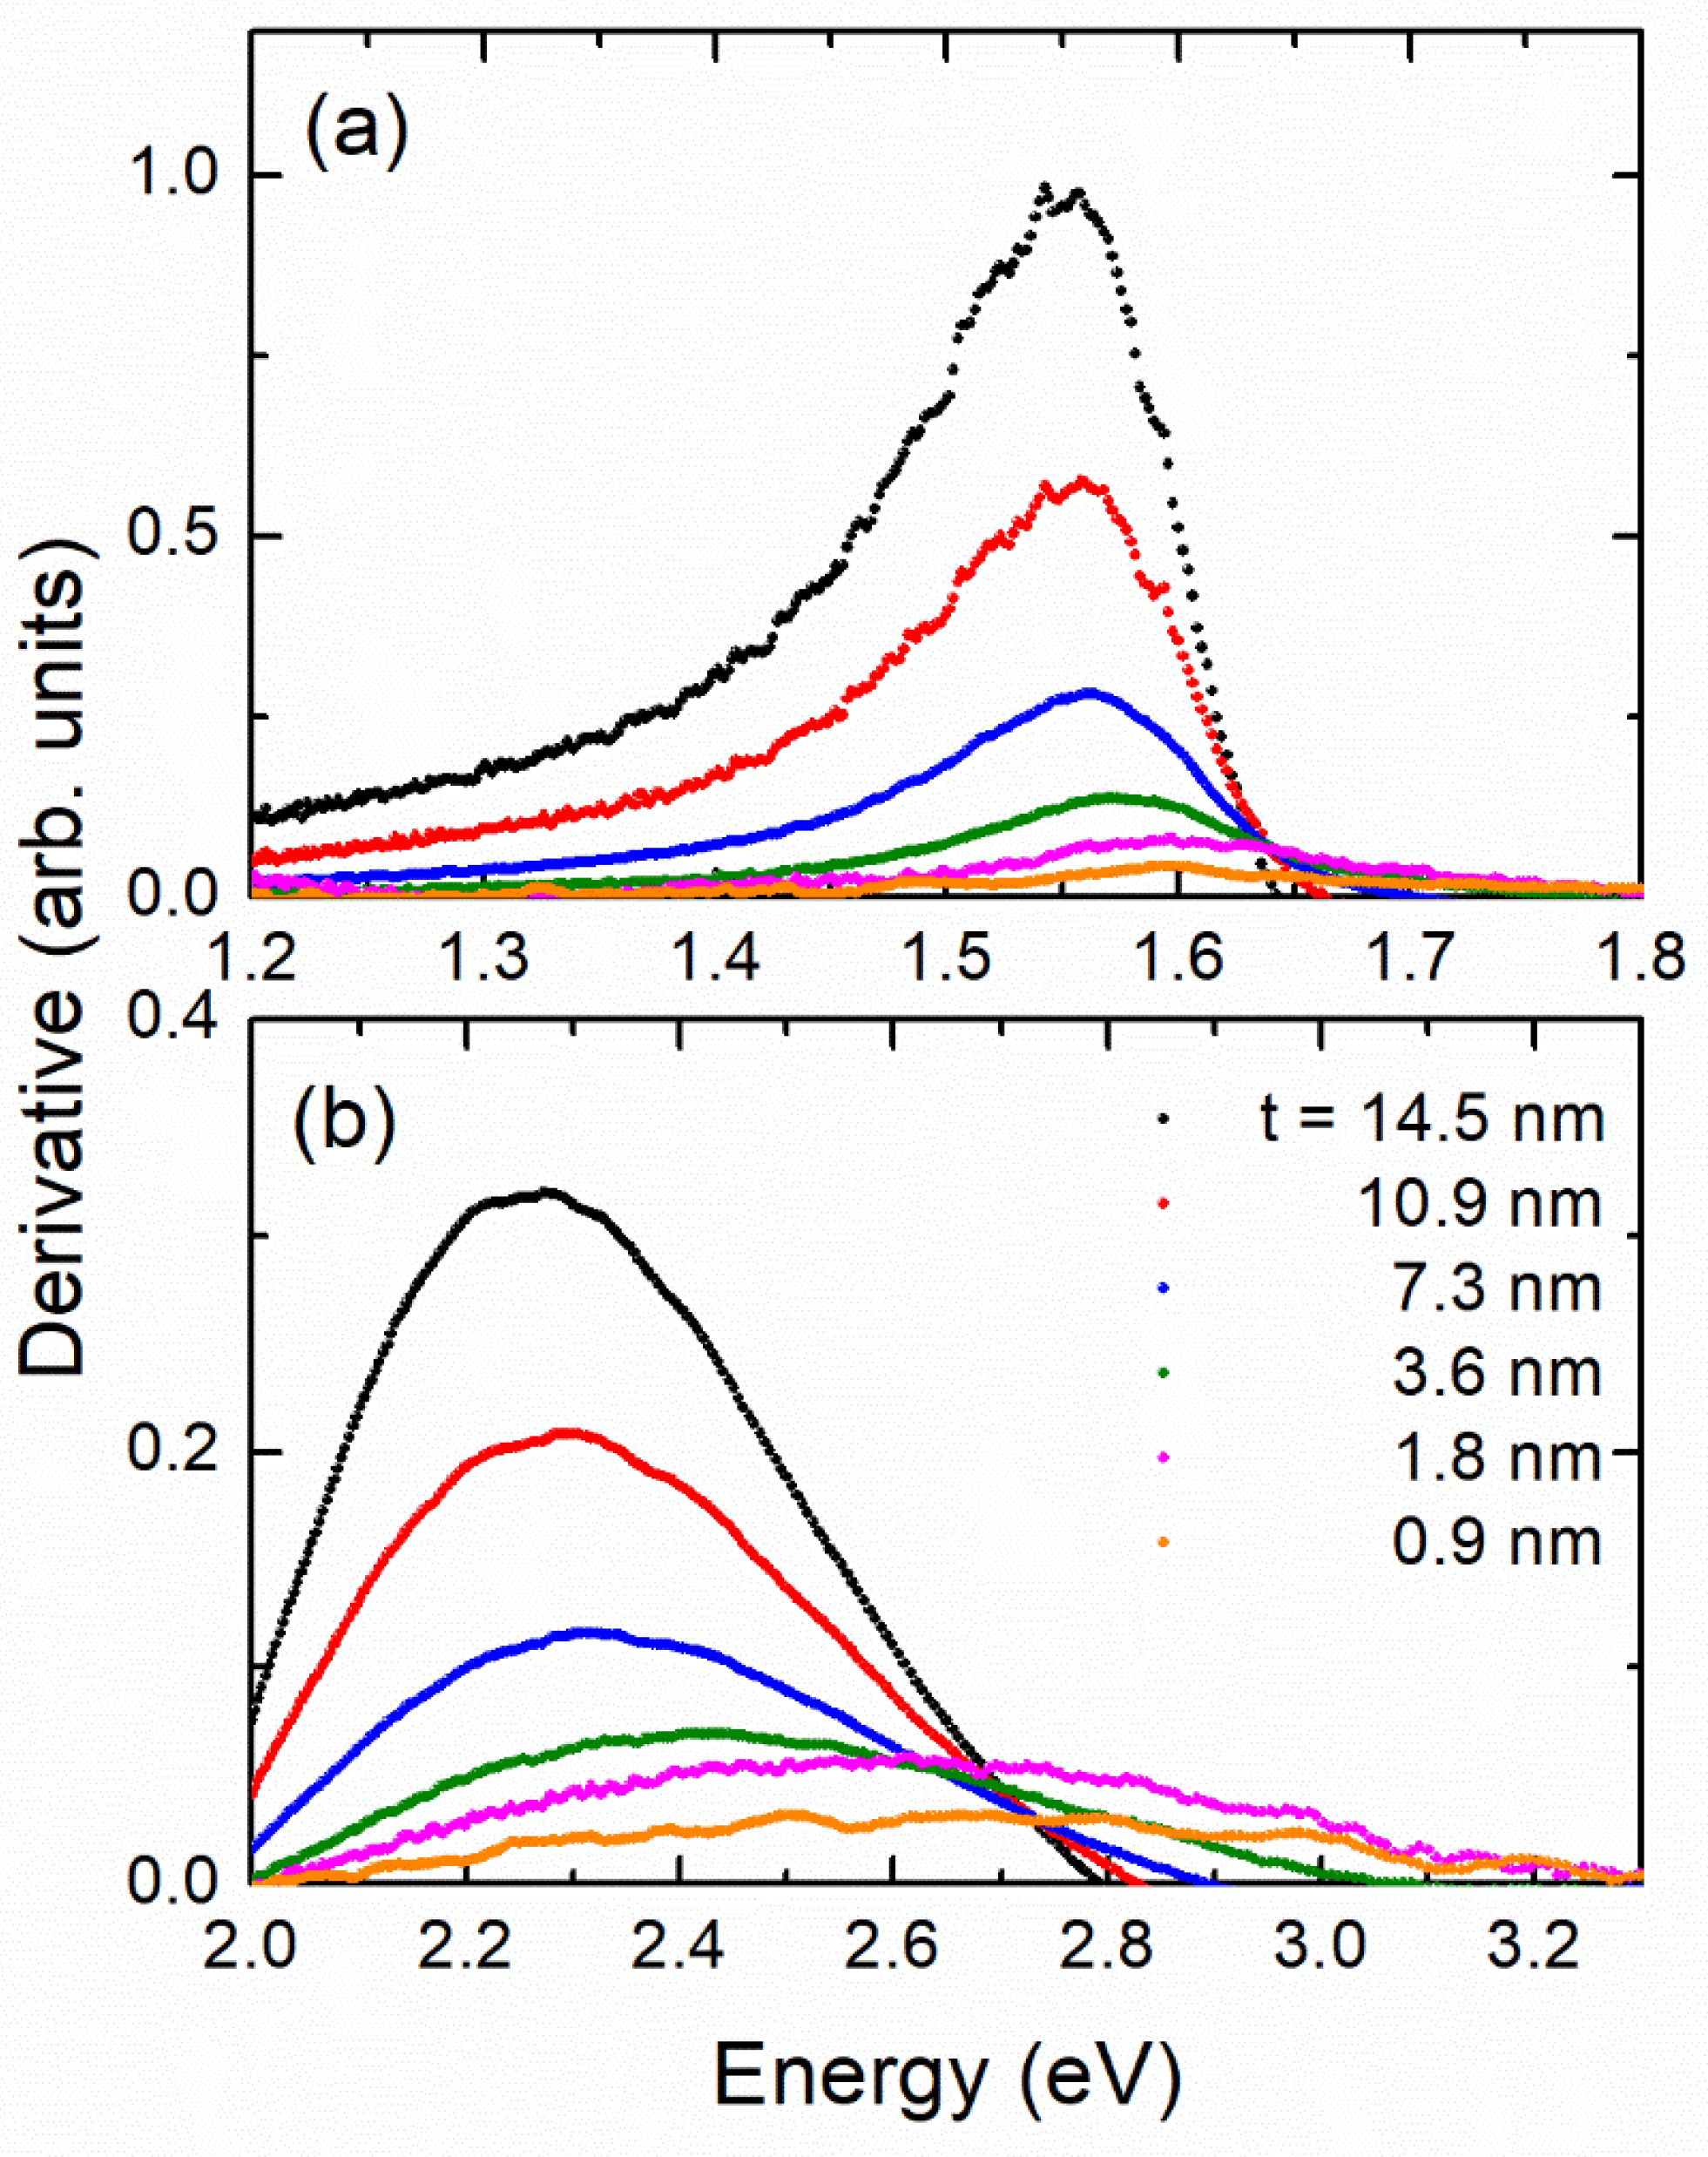
In Figure 4 we plot the first derivative of absorbance near the position of the two first energy gaps. The derivative is calculated from the equation . The maximum of the derivative just after the onset (optical gap) indicates the energy at which the rate of absorbance increase assumes it highest value. The position of the first derivative is clearly “blue shifted” as t decreases. The optical band gap (onset of optical transitions) may also be determined by the so called Tauc plots [36]. This process is not always straightforward. In many cases in Tauc plots, instead of a long straight line near the onset, a strong curvature appears because the samples are not ideal (e.g., they have many defects and impurities) or there is strong Rayleigh scattering due to grain boundaries; this may introduce a parabolic background to the spectra. We showed in Ref. [37] for ideal-like NiO films a meaningful comparison between the results of the Tauc plots and that of the first derivative of the spectra in the study of quantum confinement effects. The first derivative has a maximum slightly after the onset, but the relative blue-shift determined by the Tauc plots or the derivative method is identical [37]. Another problem with the Tauc plots, as in the present case, could be the fact that the spectra consist of several transitions, some of them overlapping, and in that case, it is not easy to separate the transitions. For example, in Ref. [38] the absorbance spectrum of was analyzed by means of nine Gaussians. In such a case, before applying a Tauc plot analysis, one should deconvolute the contributions. This is not always trivial. Similarly, in X-ray magnetic circular dichroism, the proper analysis includes a rather complicated two-step background correction of the spectra, including transitions to the continuum, see e.g., Ref. [39]. For all these reasons, for samples where the Tauc plots may present some ambiguity, it would be better to follow the simpler derivative method, as we did in the present work.
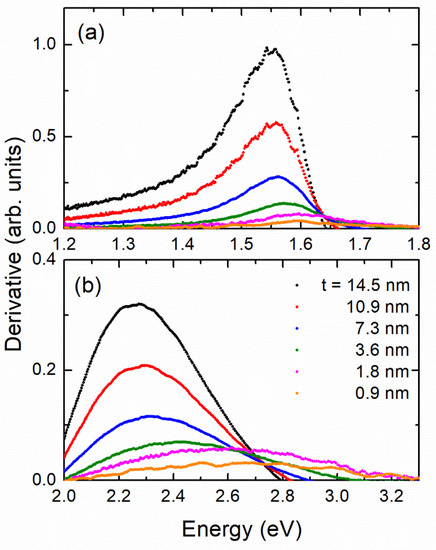
Figure 4.
First derivative of absorbance of six films at area of (a) first value and (b) second value.
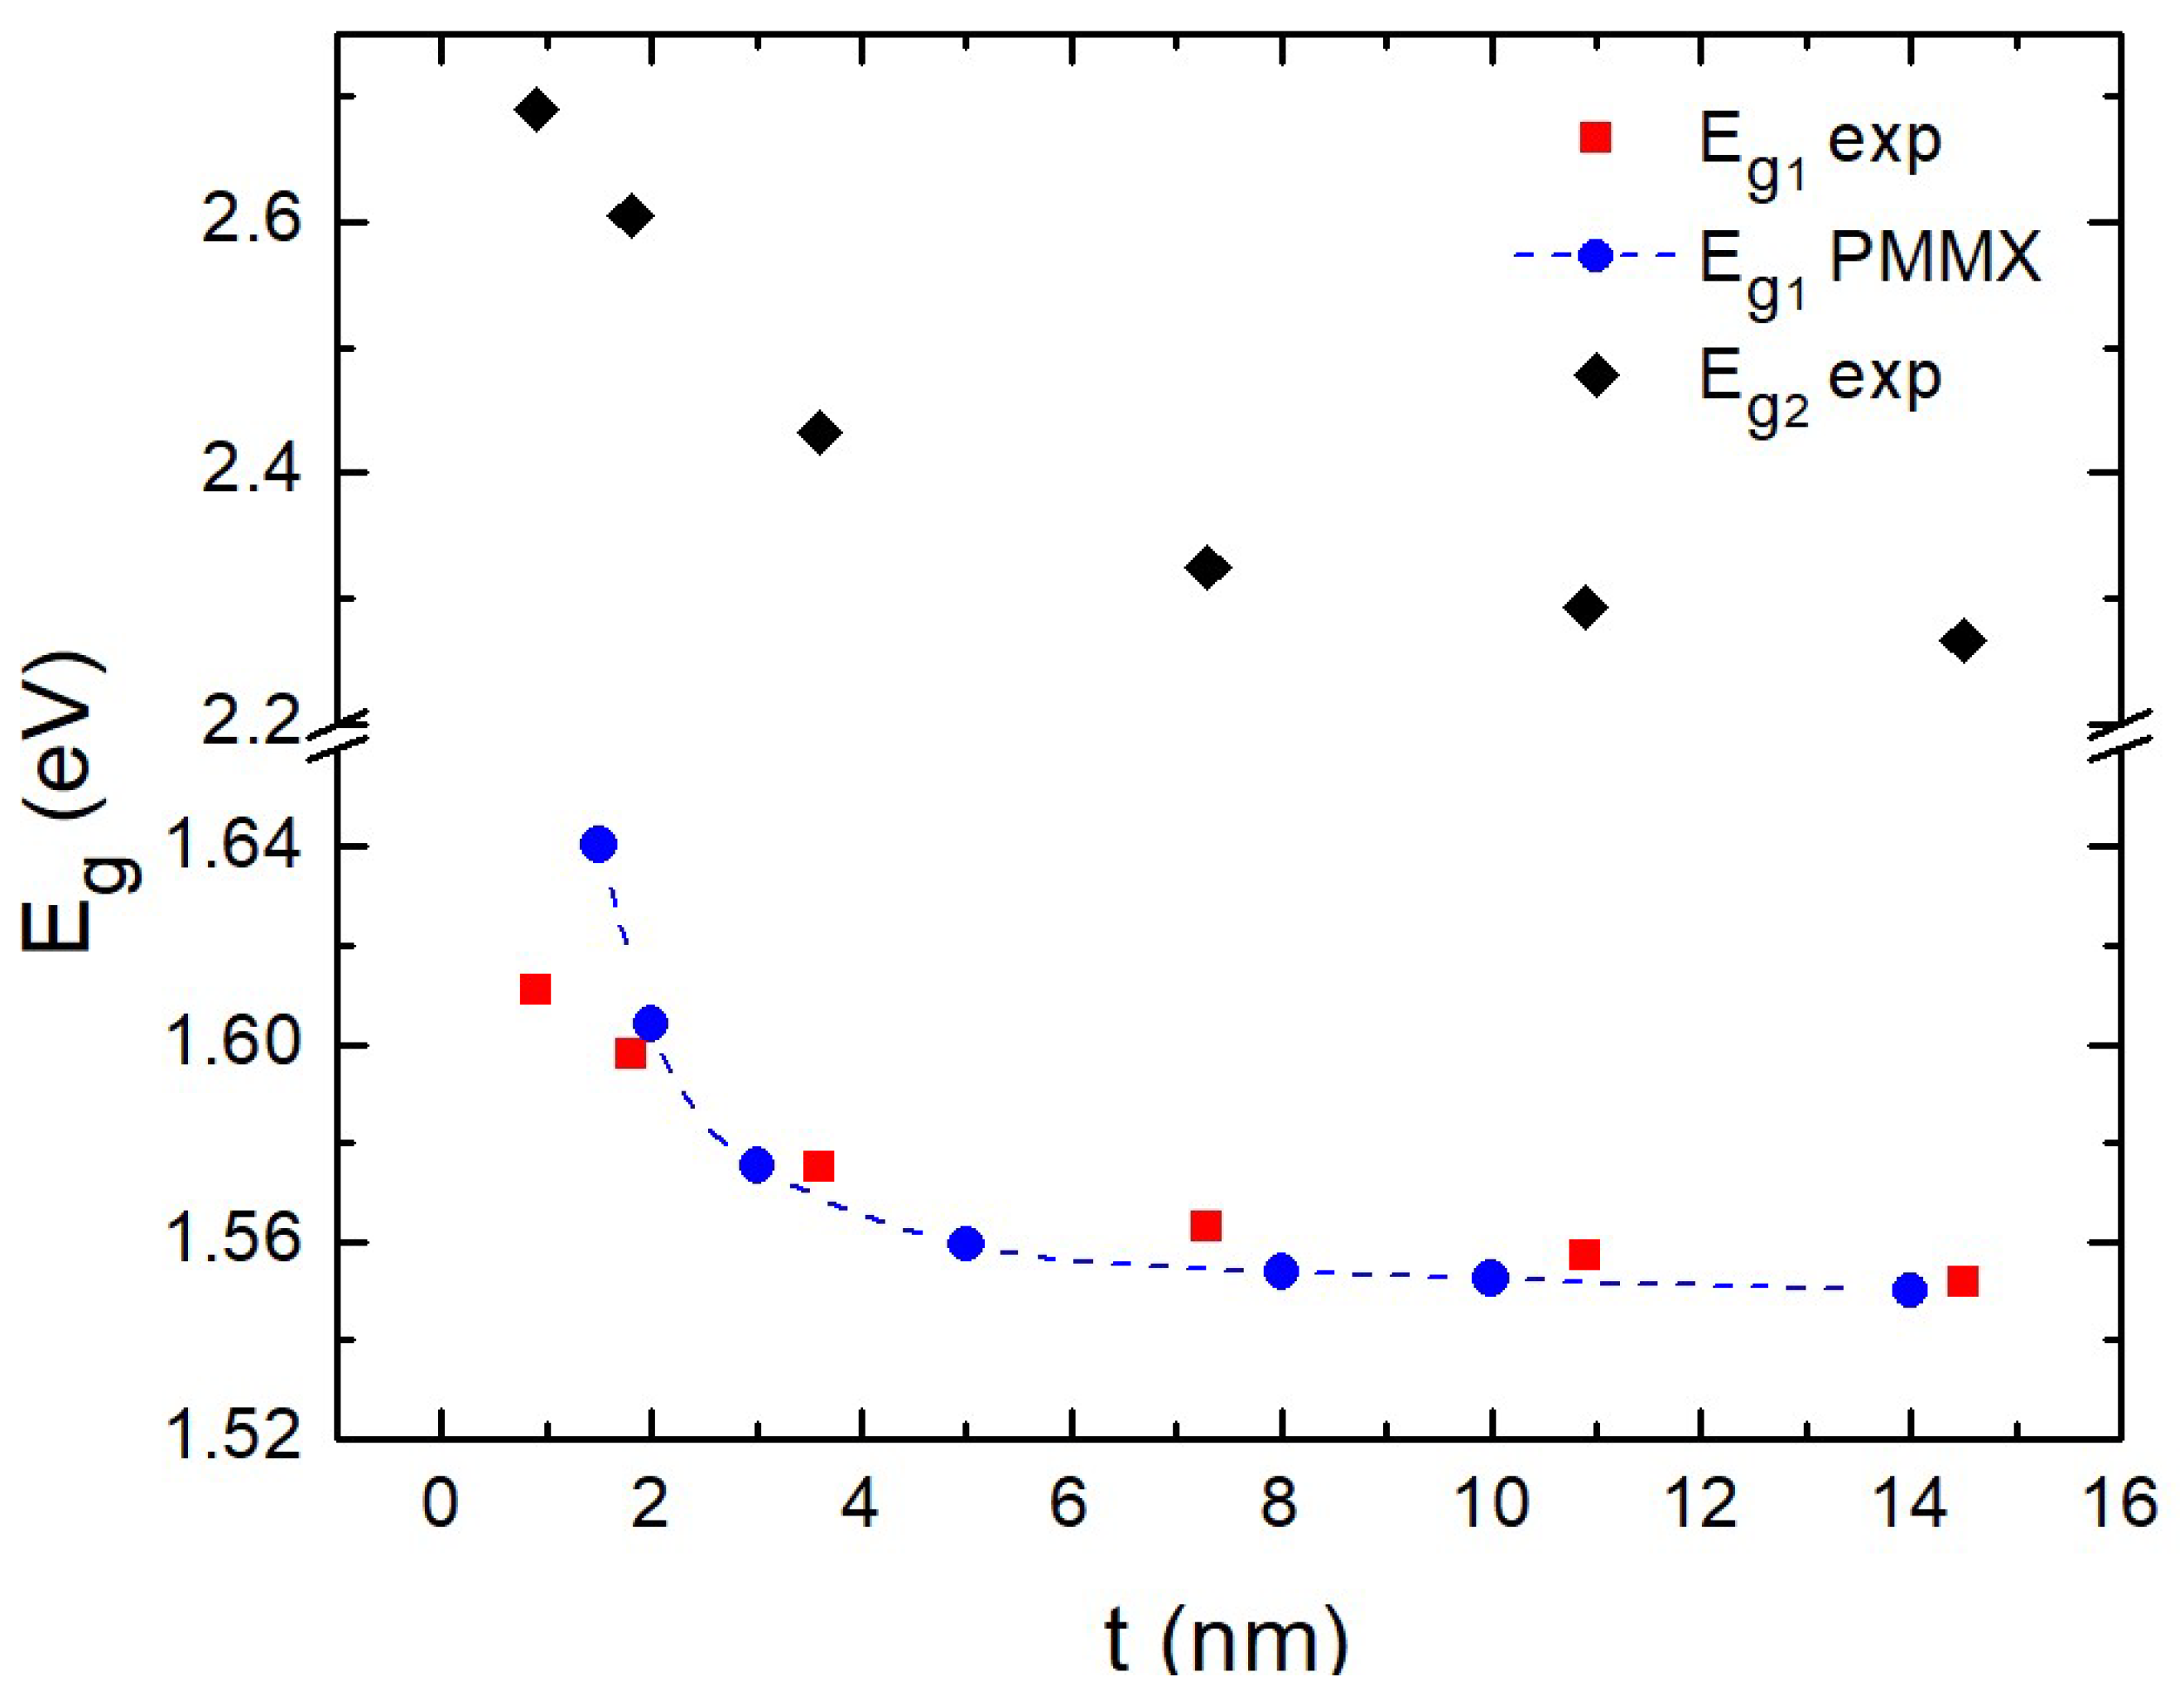
In Figure 5 we show the “blue-shift” at the two energy gaps determined by the derivative method. The energy gap has the same maximum error ± 0.02 eV as the absorbance. We attribute this to quantum confinement effects. The corresponding numerical values are presented in Table 1. Similar quantum confinement effects were also reported for nanoparticles depending on the particle size [40]. This behavior was also investigated by means of theoretical calculations based on the combined EMA-HF scheme [23,24,25] described above. The parameters adopted in the calculations were: [41], [41], while the dependence of the dielectric function on the size was modeled using the Hanken model [42] with the parameters [43], [44] and meV [44].
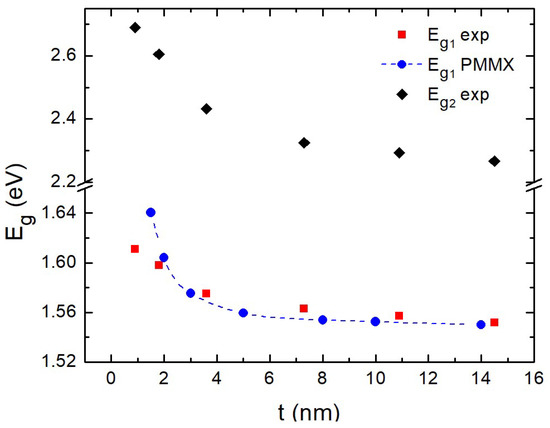
Figure 5.
Variation of direct gap with regard to thickness t of films. Blue symbols correspond to present theoretical calculations.

Table 1.
Variation of gap with respect to film thickness. All values were rounded to second decimal place.
The calculated values of the optical gap as a function of the film thickness are presented in Figure 5 (and Table 1) along with the experimental ones. The weak dependence of the gap with respect to the film thickness (as revealed by the experiments) is also captured by the theoretical calculations. The two curves exhibit a fair agreement, indicating that the experimentally observed gap variations are fully consistent with the quantum confinement interpretation.
The small deviation between experiment and theory in the determination of for the thinnest films nm) in Figure 5 could be due to a gradual transition from layer growth to island growth. However, we could not record AFM images as we reached the resolution limit of the instrument.
4. Conclusions
In this work, we fabricated single-phase thin films by oxidizing Co films under air. We recorded absorbance spectra of the films on quartz. We determined by the derivative method a systematic increase of the position of the first two direct band gaps of the films as their thickness decreased, reaching a value of 1 nm. The experimental results were adequately reproduced by theoretical calculations based on a two-particle Hartree–Fock approximation. The calculations were carried out in the framework of the effective mass approximation, with the relevant equations being solved with the Potential Morphing Method. The experimental results were found to be in fair agreement with the theory. Our study clarifies for first time the confinement effects on thin films and paves the way for the fabrication of ultrathin thin films with tailored properties suitable for optoelectronic applications.
Author Contributions
A.B. performed the film growth and optical characterization and wrote parts of the article, C.S.G. performed the calculations and wrote parts of the article, D.I.A. supervised the film growth, N.B. performed the XRD experiment, P.P. supervised parts of the experimental work and wrote parts of the article, D.B.H. conducted discussions and S.B. supervised the theoretical work and conducted discussions. All authors have read and agreed to the published version of the manuscript.
Funding
This work was financially supported by the Horizon—2020 research and innovation program of the European Union (Grant No. 952335, NanoQIQO project).
Institutional Review Board Statement
Not applicable.
Informed Consent Statement
Not applicable.
Acknowledgments
We thank V. Karoutsos for the AFM images. This work was partially financed by the European Union and Greek national funds through the Operational Program Competitiveness, Entrepreneurship and Innovation, under the call RESEARCH—CREATE—INNOVATE (project code:T1EDK-04659).
Conflicts of Interest
The authors declare no conflict of interest.
References
- Gou, W.; Zhou, X.; Li, J.; Ma, Y. Nanoporous Co3O4 plates as highly electroactive materials for electrochemical energy storage. Mater. Lett. 2016, 180, 207–211. [Google Scholar] [CrossRef]
- Feng, C.; Zhang, J.; Deng, Y.; Zhong, C.; Liu, L.; Hu, W. A review of electrolyte materials and compositions for electrochemical supercapacitors. Mater. Sci. Eng. B 2015, 199, 15–21. [Google Scholar] [CrossRef]
- Meng, T.; Xu, Q.; Wang, Z.; Li, Y.; Gao, Z.; Xing, X.; Ren, T. Co3O4 Nanorods with Self-assembled Nanoparticles in Queue for Supercapacitor. Electrochim. Acta 2015, 180, 104–111. [Google Scholar] [CrossRef]
- Li, Z.; Bui, P.; Kwak, D.; Akhtar, M.; Yang, O. Enhanced electrochemical activity of low temperature solution process synthesized Co3O4 nanoparticles for pseudo-supercapacitors applications. Ceram. Int. 2016, 42, 1879–1885. [Google Scholar] [CrossRef]
- Wang, Y.; Zhou, T.; Jiang, K.; Da, P.; Peng, Z.; Tang, J.; Kong, B.; Cai, W.; Yang, Z.; Zheng, G. Reduced Mesoporous Co3O4 Nanowires as Efficient Water Oxidation Electrocatalysts and Supercapacitor Electrodes. Adv. Energy Mater. 2014, 4, 1400692–1400696. [Google Scholar] [CrossRef]
- Geng, T.; Zhang, L.; Wang, H.; Zhang, K.; Zhou, X. Facile synthesis of porous Co3O4 nanoplates for supercapacitor applications. Bull. Mater. Sci. 2015, 38, 1171–1175. [Google Scholar] [CrossRef] [Green Version]
- Kandalkar, S.; Gunjakar, J.; Lokhande, C. Preparation of cobalt oxide thin films and its use in supercapacitor application. Appl. Surf. Sci. 2008, 254, 5540–5544. [Google Scholar] [CrossRef]
- Lokhande, C.D.; Dubal, D.P.; Joo, O.-S. Metal oxide thin film based supercapacitors. Curr. Appl. Phys. 2011, 11, 255–270. [Google Scholar] [CrossRef]
- Barreca, D.; Massignan, C.; Daolio, S.; Fabrizio, M.; Piccirillo, C.; Armelao, L.; Tondello, E. Composition and Microstructure of Cobalt Oxide Thin Films Obtained from a Novel Cobalt (II) Precursor by Chemical Vapor Deposition. Chem. Mater. 2001, 13, 588. [Google Scholar] [CrossRef]
- Švegl, F.; Orel, B.; Hutchins, M.G.; Kalcher, K. Spectroelectrochemical Investigations of Sol-Gel Derived Electrochromic Spinel Co3O4 Films. J. Electrochem. Soc. 1996, 143, 1532. [Google Scholar] [CrossRef]
- Barnasas, A.; Kanistras, N.; Ntagkas, A.; Anyfantis, D.I.; Stamatelatos, A.; Kapaklis, V.; Bouropoulos, N.; Mystiridou, E.; Poulopoulos, P.; Garoufalis, C.S. Quantum confinement effects of thin ZnO films by experiment and theory. Phys. E Low-Dimens. Syst. Nanostruct. 2020, 120, 114072. [Google Scholar] [CrossRef]
- Petitto, S.C.; Langell, M.A. Surface composition and structure of Co3O4 (110) and the effect of impurity segregation. J. Vac. Sci. Technol. A 2004, 22, 1690. [Google Scholar] [CrossRef] [Green Version]
- Vaz, C.A.F.; Wang, H.-Q.; Ahn, C.H.; Henrich, V.E.; Baykara, M.Z.; Schwendemann, T.C.; Pilet, N.; Albers, B.J.; Schwarz, U.D.; Zhang, L.H.; et al. Interface and electronic characterization of thin epitaxial films. Surf. Sci. 2009, 603, 291–297. [Google Scholar] [CrossRef] [Green Version]
- Cox, V.P.A. Transition Metal Oxides an Introduction to Their Electronic Structure and Properties; Oxford University Press: Oxford, UK, 1992; Volume 284. [Google Scholar]
- Lohaus, C.; Morasch, J.; Brötz, J.; Klein, A.; Jaegermann, W. Investigations on RF-magnetron sputtered Co3O4 thin films regarding the solar energy conversion properties. J. Phys. D Appl. Phys. 2016, 49, 155306. [Google Scholar] [CrossRef]
- Angelov, S.; Zhecheva, E.; Stoyanova, R.; Atanasov, M. Bulk Defects in CoO Pure and Slightly Doped with Lithium, Revealed by EPR of the Tetrahedral Co+ Ions. J. Phys. Ckm. Sd 1990, 51, 1157–1161. [Google Scholar]
- Kupfer, B.; Majhi, K.; Keller, D.A.; Bouhadana, Y.; Rühle, S.; Barad, H.N.; Anderson, A.Y.; Zaban, A. Thin Film Co3O4 /TiO2 Heterojunction Solar Cells. Adv. Energy Mater. 2015, 5, 11401007. [Google Scholar]
- Nam, H.-J.; Sasaki, T.; Koshizaki, N. Optical CO Gas Sensor Using a Cobalt Oxide Thin Film Prepared by Pulsed Laser Deposition under Various Argon Pressures. J. Phys. Chem. B 2006, 110, 23081. [Google Scholar] [CrossRef]
- Han, K.; Song, S.W.; Yoshimura, M. Room-Temperature Fabrication of Lithium Cobalt Oxide Thin-Film Electrodes by Lithium Hydroxide Solution Treatment. J. Am. Ceram. 2005, 81, 2465–2468. [Google Scholar] [CrossRef]
- Huang, B.; Cao, K.; Liu, X.; Qian, L.; Shan, B.; Chen, R. Tuning the morphology and composition of ultrathin cobalt oxide films via atomic layer deposition. RSC Adv. 2015, 5, 71816–71823. [Google Scholar] [CrossRef]
- Vaz, C.A.F.; Prabhakaran, D.; Altman, E.I.; Henrich, V.E. Experimental study of the interfacial cobalt oxide in Co3O4/a-Al2O3 (0001) epitaxial films. Phys. Rev. B-Condens. Matter Mater. Phys. 2009, 80, 1–7. [Google Scholar] [CrossRef] [Green Version]
- Baskoutas, S.; Poulopoulos, P.; Karoutsos, V.; Angelakeris, M.; Flevaris, N.K. Strong quantum confinement effects in thin zinc selenide films. Chem. Phys. Lett. 2006, 417, 461–464. [Google Scholar] [CrossRef]
- Rieth, M.; Schommers, W.; Baskoutas, S. Exact numerical solution of Schrodinger’s equation for a particle in an interaction potential of general shape. Int. J. Mod. Phys. B 1992, 16, 4081. [Google Scholar] [CrossRef]
- Baskoutas, S.; Terzis, A.F. Size-dependent band gap of colloidal quantum dots. J. Appl. Phys. 2006, 99, 013708. [Google Scholar]
- Baskoutas, S.; Terzis, A.F.; Schommers, W. Size-dependent exciton energy of narrow band gap colloidal quantum dots in the finite depth square-well effective mass approximation. J. Comp. Theor. Nanosci. 2006, 3, 269. [Google Scholar] [CrossRef]
- Karoutsos, V. Scanning probe microscopy: Instrumentation and applications on thin films and magnetic multilayers. J. Nanosci. Nanotechnol. 2009, 9, 6783–6798. [Google Scholar]
- Garoufalis, C.S.; Poulopoulos, P.; Bouropoulos, N.; Barnasas, A.; Baskoutas, S. Growth and optical properties of Fe2O3 thin films: A study of quantum confinement effects by experiment and theory. Phys. E Low-Dimens. Syst. Nanostruct. 2017, 89, 67. [Google Scholar] [CrossRef]
- JCPDS Card No. 211276. unpublished.
- Escobar, M.A.; Magana, L.F.; Valenzuela, R. Effect of the grain size distribution on the magnetization curve. J. Appl. Phys. 1985, 57, 2142–2147. [Google Scholar] [CrossRef]
- Martens, J.; Peeters, W.; Noort, H.V.; Erman, M. Optical, magneto-optical and mössbauer spectroscopy on Co3+ substituted cobalt ferrite Co2+ Fe2− xCo3+ xO4 (0 ≤ x ≤ 2). J. Phys. Chem. Solids 1985, 46, 411. [Google Scholar] [CrossRef]
- Yamamoto, H.; Tanaka, S.; Hirao, K. Effects of substrate temperature on nanostructure and band structure of Co3O4 sputtered thin films. J. Appl. Phys. 2003, 93, 4158. [Google Scholar] [CrossRef] [Green Version]
- Jiang, C.-M.; Baker, L.R.; Lucas, J.M.; Vura-Weis, J.; Alivisatos, A.P.; Leone, S.R. Characterization of Photo-Induced Charge Transfer and Hot Carrier Relaxation Pathways in Spinel Cobalt Oxide (Co3O4). J. Phys. Chem. C 2014, 118, 22774. [Google Scholar] [CrossRef] [Green Version]
- Waegele, M.M.; Doan, H.Q.; Cuk, T. Long-Lived Photoexcited Carrier Dynamics of d–d Excitations in Spinel Ordered, Co3O4. J. Phys. Chem. C 2014, 118, 3426. [Google Scholar] [CrossRef]
- Wheeler, D.A.; Wang, G.; Ling, Y.; Li, Y.; Zhang, J.Z. Nanostructured hematite: Synthesis, characterization, charge carrierdynamics, and photoelectrochemical properties. Energy Environ. Sci. 2012, 5, 6682. [Google Scholar] [CrossRef]
- Smart, T.J.; Pham, T.A.; Ping, Y.; Ogitsu, T. Optical absorption induced by small polaron formation in transition metal oxides: The case of Co3O4. Phys. Rev. Mater. 2019, 3, 102401(R). [Google Scholar] [CrossRef] [Green Version]
- Fox, M. Optical Properties of Solids, 2nd ed.; Oxford University Press: New York, NY, USA, 2010; ISBN 9780199573370. [Google Scholar]
- Garoufalis, C.S.; Barnasas, A.; Stamatelatos, A.; Karoutsos, V.; Grammatikopoulos, S.; Poulopoulos, P.; Baskoutas, S. A Study of Quantum Confinement Effects in Ultrathin NiO Films Performed by Experiment and Theory. Materials 2018, 11, 949. [Google Scholar] [CrossRef] [PubMed] [Green Version]
- Qiao, L.; Xiao, H.Y.; Meyer, H.; Sun, J.; Rouleau, C.M.; Puretzky, A.A.; Geohegan, D.B.; Ivanov, I.N.; Yoon, M.; Weber, W.J.; et al. Nature of the band gap and origin of the electro-/photo-activity of Co3O4. J. Mater. Chem. C 2013, 1, 4628. [Google Scholar] [CrossRef]
- Poulopoulos, P.; Wilhelm, F.; Wende, H.; Baberschke, K.; Benea, D.; Ebert, H.; Angelakeris, M.; Flevaris, N.K.; Rogalev, A.; Brookes, N.B. X-ray magnetic circular dichroic magnetometry on Ni/Pt multilayers. J. Appl. Phys. 2001, 89, 3874. [Google Scholar] [CrossRef]
- Blakemore, J.D.; Gray, H.B.; Winkler, J.R.; Müller, A.M. Co3O4 Nanoparticle Water-Oxidation Catalysts Made by Pulsed-Laser Ablation in Liquids. ACS Catal. 2013, 3, 2497–2500. [Google Scholar] [CrossRef]
- Lany, S. Semiconducting transition metal oxides. J. Phys. Condens. Matter 2015, 27, 283203. [Google Scholar] [CrossRef] [PubMed]
- Hanken, H. Kopplung nichtrelativistischer teilchen mit einem quantisierten feld. Nuovo Cimento 1956, 3, 1230. [Google Scholar] [CrossRef]
- Prabaharan, D.D.M.; Sadaiyandi, K.; Mahendran, M.; Sagadevan, S. Precipitation method and characterization of cobalt oxide nanoparticles. Appl. Phys. A 2017, 123, 264. [Google Scholar] [CrossRef]
- Li, Y. Investigation of Lattice Vibrations and Band Gaps of Cobalt Oxides by Fourier Transform Infrared, Raman Scattering and Photoluminescence Spectroscopy. Ph.D. Thesis, Department of Electrical Engineering, University of Houston, Houston, TX, USA, 2015. [Google Scholar]
Publisher’s Note: MDPI stays neutral with regard to jurisdictional claims in published maps and institutional affiliations. |
© 2021 by the authors. Licensee MDPI, Basel, Switzerland. This article is an open access article distributed under the terms and conditions of the Creative Commons Attribution (CC BY) license (https://creativecommons.org/licenses/by/4.0/).