Article

Spatial Profile of Neutral Temperature Measurement in Aditya-U Tokamak Plasmas

1
The National Institute of Engineering, Mysuru 570008, India
2
Institute for Plasma Research, Bhat, Gandhinagar 382428, India
3
Department of Physics, Manipal Institute of Technology, MAHE, Manipal 576104, India
4
Department of Physics, Gujarat University, Navrangpura, Ahmedabad 380009, India
*
Author to whom correspondence should be addressed.
Atoms 2019, 7(3), 87; https://doi.org/10.3390/atoms7030087
Submission received: 30 June 2019 / Revised: 19 August 2019 / Accepted: 30 August 2019 / Published: 5 September 2019
(This article belongs to the Special Issue Plasma Spectroscopy in the Presence of Magnetic Fields)

Abstract

:
The spatial profile of neutral hydrogen temperatures in Aditya-U tokamak plasma has been estimated from the spatial profile of the Hα spectral emissions measured using a high-resolution multi-track spectrometer, having a spectral resolution of 0.023 nm at a 50 μm entrance slit width. The neutral temperature estimation from the Doppler broadened spectral line was carried out after considering the Zeeman effect due to the magnetic field present in the tokamak. To accurately obtain the temperature of the neutral hydrogen, two temperature components (warm and hot) were required to be considered. A code was developed to obtain the neutral temperature and is used to analyze two typical plasma discharges. The temperature of warm components varies between 3 and 5 eV, while hot atoms have temperatures in the range of 15–30 eV. It was observed that the chord-integrated neutral temperature increases slightly towards the plasma core region compared to the plasma edge of Aditya-U tokamak.

1. Introduction

In fusion-relevant magnetic confinement plasma experiments, our understanding and the characterization of edge plasma is becoming more and more important, as it influences the core plasma properties through particle recycling, alteration of particle and energy transport, etc. [1]. The presence of neutral hydrogen atoms and molecules in the edge plasma is due to its much lower temperature compared to the bulk plasma of tokamak. It has been found that the neutral particles not only play an important role in the modification of the edge plasma dynamic, but also take active part in pedestal formation in the high confinement (H-mode) plasma in the tokamak [2]. Consequently, the study of the neutral particle dynamic has become very important, and it is mostly done through the investigation of neutral particle penetration into the plasma’s central region through the modeling of the experimentally observed Hα emissivity using neutral particle transport code [3,4]. The role of various atomic and molecular reaction pathways involved in producing the Balmer line (having a transition from the n = 3 to the n = 2 state) of the hydrogen has also been investigated as the product of the hydrogen atom having different temperatures [4,5,6], influencing the neutral particle dynamic inside the plasma. These hydrogen particles are continuously generated by the charge exchange with the ions inside the plasma, and also by the interaction of ions with the plasma facing components (PFC), which recombine and are then re-emitted to the plasma as molecules. They are also produced by the volume recombination of ions and electrons in the relatively cold edge plasma in the diverter region [3,7,8,9]. Nevertheless, the details of the temperature of the neutral particles generated via many reaction pathways is still not well-understood.
However, to estimate the neutral temperature, the Zeeman effect has to be incorporated, as the tokamak has a strong toroidal magnetic field, and it was found that the temperature estimation will be erroneous if the splitting of the spectral lines due to the Zeeman effect is not taken into account [10,11]. This has been done in many tokamaks, not only to estimate the neutral temperature at the plasma edge, but also to determine the ion temperature of various impurities [10,12,13,14,15,16]. Moreover, in a Large Helical Device (LHD), the atom density distribution has been obtained using the spectral line profile of Hα after incorporating the Zeeman effect [17]. The Doppler broadened Hα line profiles produced in high-temperature plasma are normally composed of narrow and broad components. Electron-induced molecular dissociation and elastic collision processes produce cold and warm hydrogen atoms, resulting in narrow components in the line profile. Similarly, the broad components in the line profile are due to the class of hot-excited atoms generated by charge exchange recombination and electron impact dissociation of hydrogen molecules via the Franck–Condon reaction [18,19]. Kammler et al. have studied in detail the reaction probabilities and processes of hot atoms [20]. In TRIAM-1M tokamak, the high-temperature component was not apparent, so spectral fitting was performed using cold and warm components [12]. Temperature measurement with the Hβ spectral line gave the narrow component as ~3 and 5 eV, and the broader component as ~90 and 100 eV in DIII-D diverter tokamak [21]. It has also been observed that a single Hα line sometimes has more than two components depending upon the devices and the locations in the same experimental device. In an LHD, the neutral temperatures were estimated from two locations [22]. It was observed that the inner side of the device had a contribution from cold and warm components of the hydrogen atom, while the outer side had a contribution from cold, warm, and hot components of the hydrogen atom. In our earlier study on Aditya-U tokamak, the Doppler broadened Hα spectral line was modeled considering two components, warm and hot atoms, and by incorporating the Zeeman effect [16]. The neutral temperatures were estimated at four radial locations, two each on the low- and high-field sides. Poloidal asymmetry was found in the neutral temperature. However, to the best of our knowledge, the measurement of the full spatial profile of the neutral temperature in high-temperature plasma has not been done, due to the poor signal-to-noise ratio of the Hα emissions towards the plasma’s central region, as the Hα emissions mainly come from the plasma edge.
In this work, in Aditya-U tokamak, the spatial profile of the chord-integrated neutral hydrogen temperature, for both warm and hot components, was obtained using the Doppler broadened Balmer spectrum by incorporating the Zeeman effect to understand the physics associated with their behavior, including the poloidal asymmetry in the neutral temperature observed in Aditya-U tokamak. This temperature estimation was carried out by recording the spatial profile of the Hα spectral line using a high-resolution multi-track spectrometer, capable of viewing the plasma along the nine lines of sight (LoS) simultaneously, with a good temporal and spatial resolution. The analysis was done by developing a computational code to calculate multiple components’ neutral temperature by incorporating the broadening present due to the Zeeman effect.
The paper is organized as follows. In Section 2, we briefly discuss space-resolved visible spectroscopic diagnostics and the details of the experiments that were carried out. Section 3 presents the technique for evaluating the neutral temperature values. The results and a discussion on the neutral temperature profile are presented in Section 4.

2. Experimental Arrangement and Technique to Measure Neutral Temperature

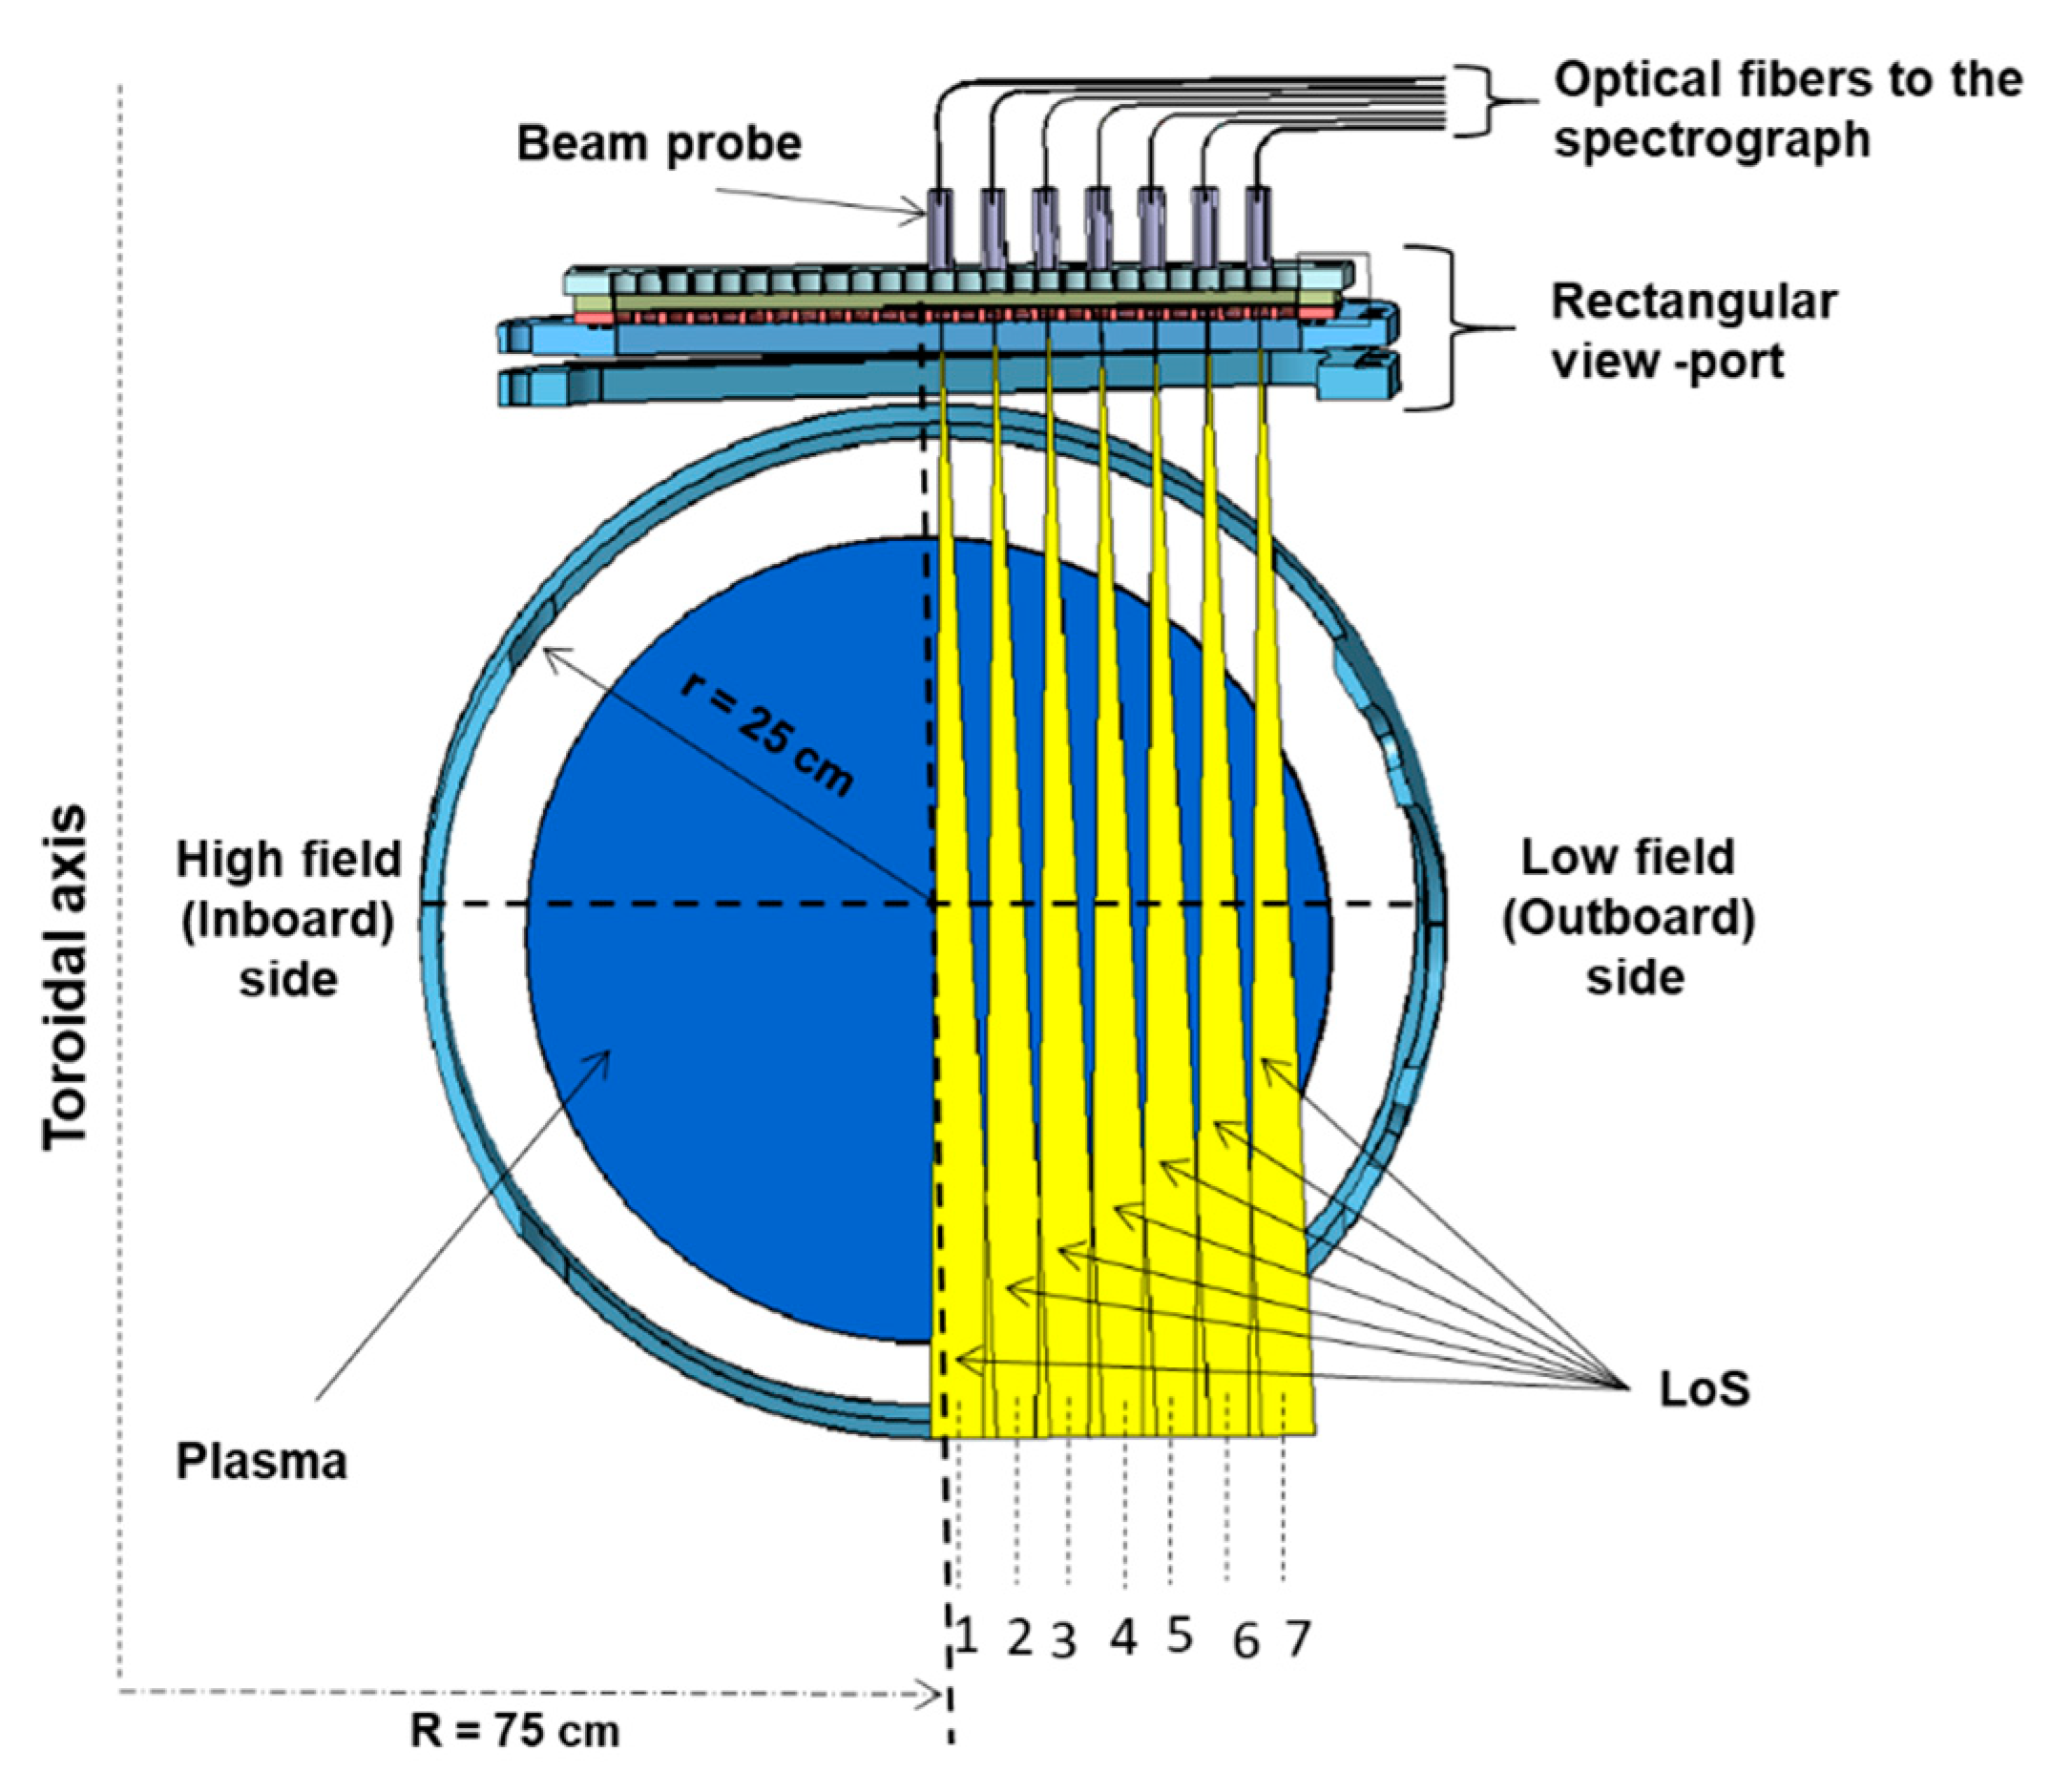
2.1. Experimental Setup

Aditya-U tokamak [23], an upgraded version of Aditya tokamak, has a toroidal belt limiter made of graphite on the inboard side of the wall. It also has two poloidal ring limiters that are toroidally separated at the outboard side. Aditya-U tokamak has a major radius of 75 cm and a minor radius of 25 cm. At present, the machine is operated in the limiter configuration, with a toroidal magnetic field range of 1.0–1.4 T. During this study, Aditya-U tokamak was operated with a toroidal magnetic field, a BT of 1.0 T, a plasma current Ip of 100–120 kA, and a plasma duration of 120–150 ms. The electron density, ne, was ~1.8 to 2.5 × 10¹⁹·m−3, and the electron temperature, Te, was ~200 to 350 eV. It can operate in the divertor configuration, and the rectangular vacuum vessel of Aditya tokamak was changed to a circular one to accommodate a divertor coil.
A high-resolution spectrometer was installed on Aditya-U tokamak to routinely monitor the spatial and temporal profile of hydrogen spectral line emissions at 656.28 nm [24]. The system consists of a 1 m, f/8.7 Czerny Turner spectrometer (model no. AM510, Acton, MA, USA). This spectrometer was coupled with a charged coupled device (CCD, model no DV-420, Andor, UK) detector at its exit port. It has 1024 × 256 pixels and the size of each pixel is 26 × 26 µm2. The spectral resolution of 0.023 nm at 650.024 nm, with a 50 µm slit width that was measured with a grating of 1800 grooves/mm, blazed at 518 nm. The entrance slit of the spectrometer was coupled with a vertical array of nine fibers (400 µm core diameters), which enables the multi-track measurement. Nine tracks were defined with a binning of 16-pixel-high rows (tracks); each track was then separated with a 10-pixel gap to avoid ‘cross-talk’. Seven 13-meter-long fibers with a 1 mm core diameter were arranged on the top of the machine as shown in Figure 1. Each fiber collected light from the plasma with collimating lenses with a diameter of 11 mm and a focal length of 19 mm. The collimating lenses were mounted on a long rectangular viewport (with a length of 48 cm and a width of 2 cm) made of ultraviolet (UV) grade fused silica to collect the light down to 200 nm. The viewport covered the full low-field side of the plasma’s poloidal cross section, and up to r = 21 cm (minor radius r = 25 cm) toward the high-field side from the machine’s center. The outer half of the inboard side of the plasma was inaccessible due to the viewing obstacle that was created by the placement of the diverter plate and its support structure (not shown in the picture). The fiber-plus-lens arrangement provides 2.5 cm of spatial resolution at the horizontal mid-plane of the plasma. The other ends of these 13-m-long fibers were connected to a vertical array of 400 µm fibers at the spectrometer’s entrance slit using a fiber interconnector. The spectrometer setup is very versatile for recording different spectral lines and has good spatial and temporal resolution. In this experiment, we arranged the fibers such that they covered the center to outboard region of the plasma as shown in Figure 1. Data acquisition using the spectrometer is triggered by the onset of loop voltage of the tokamak.

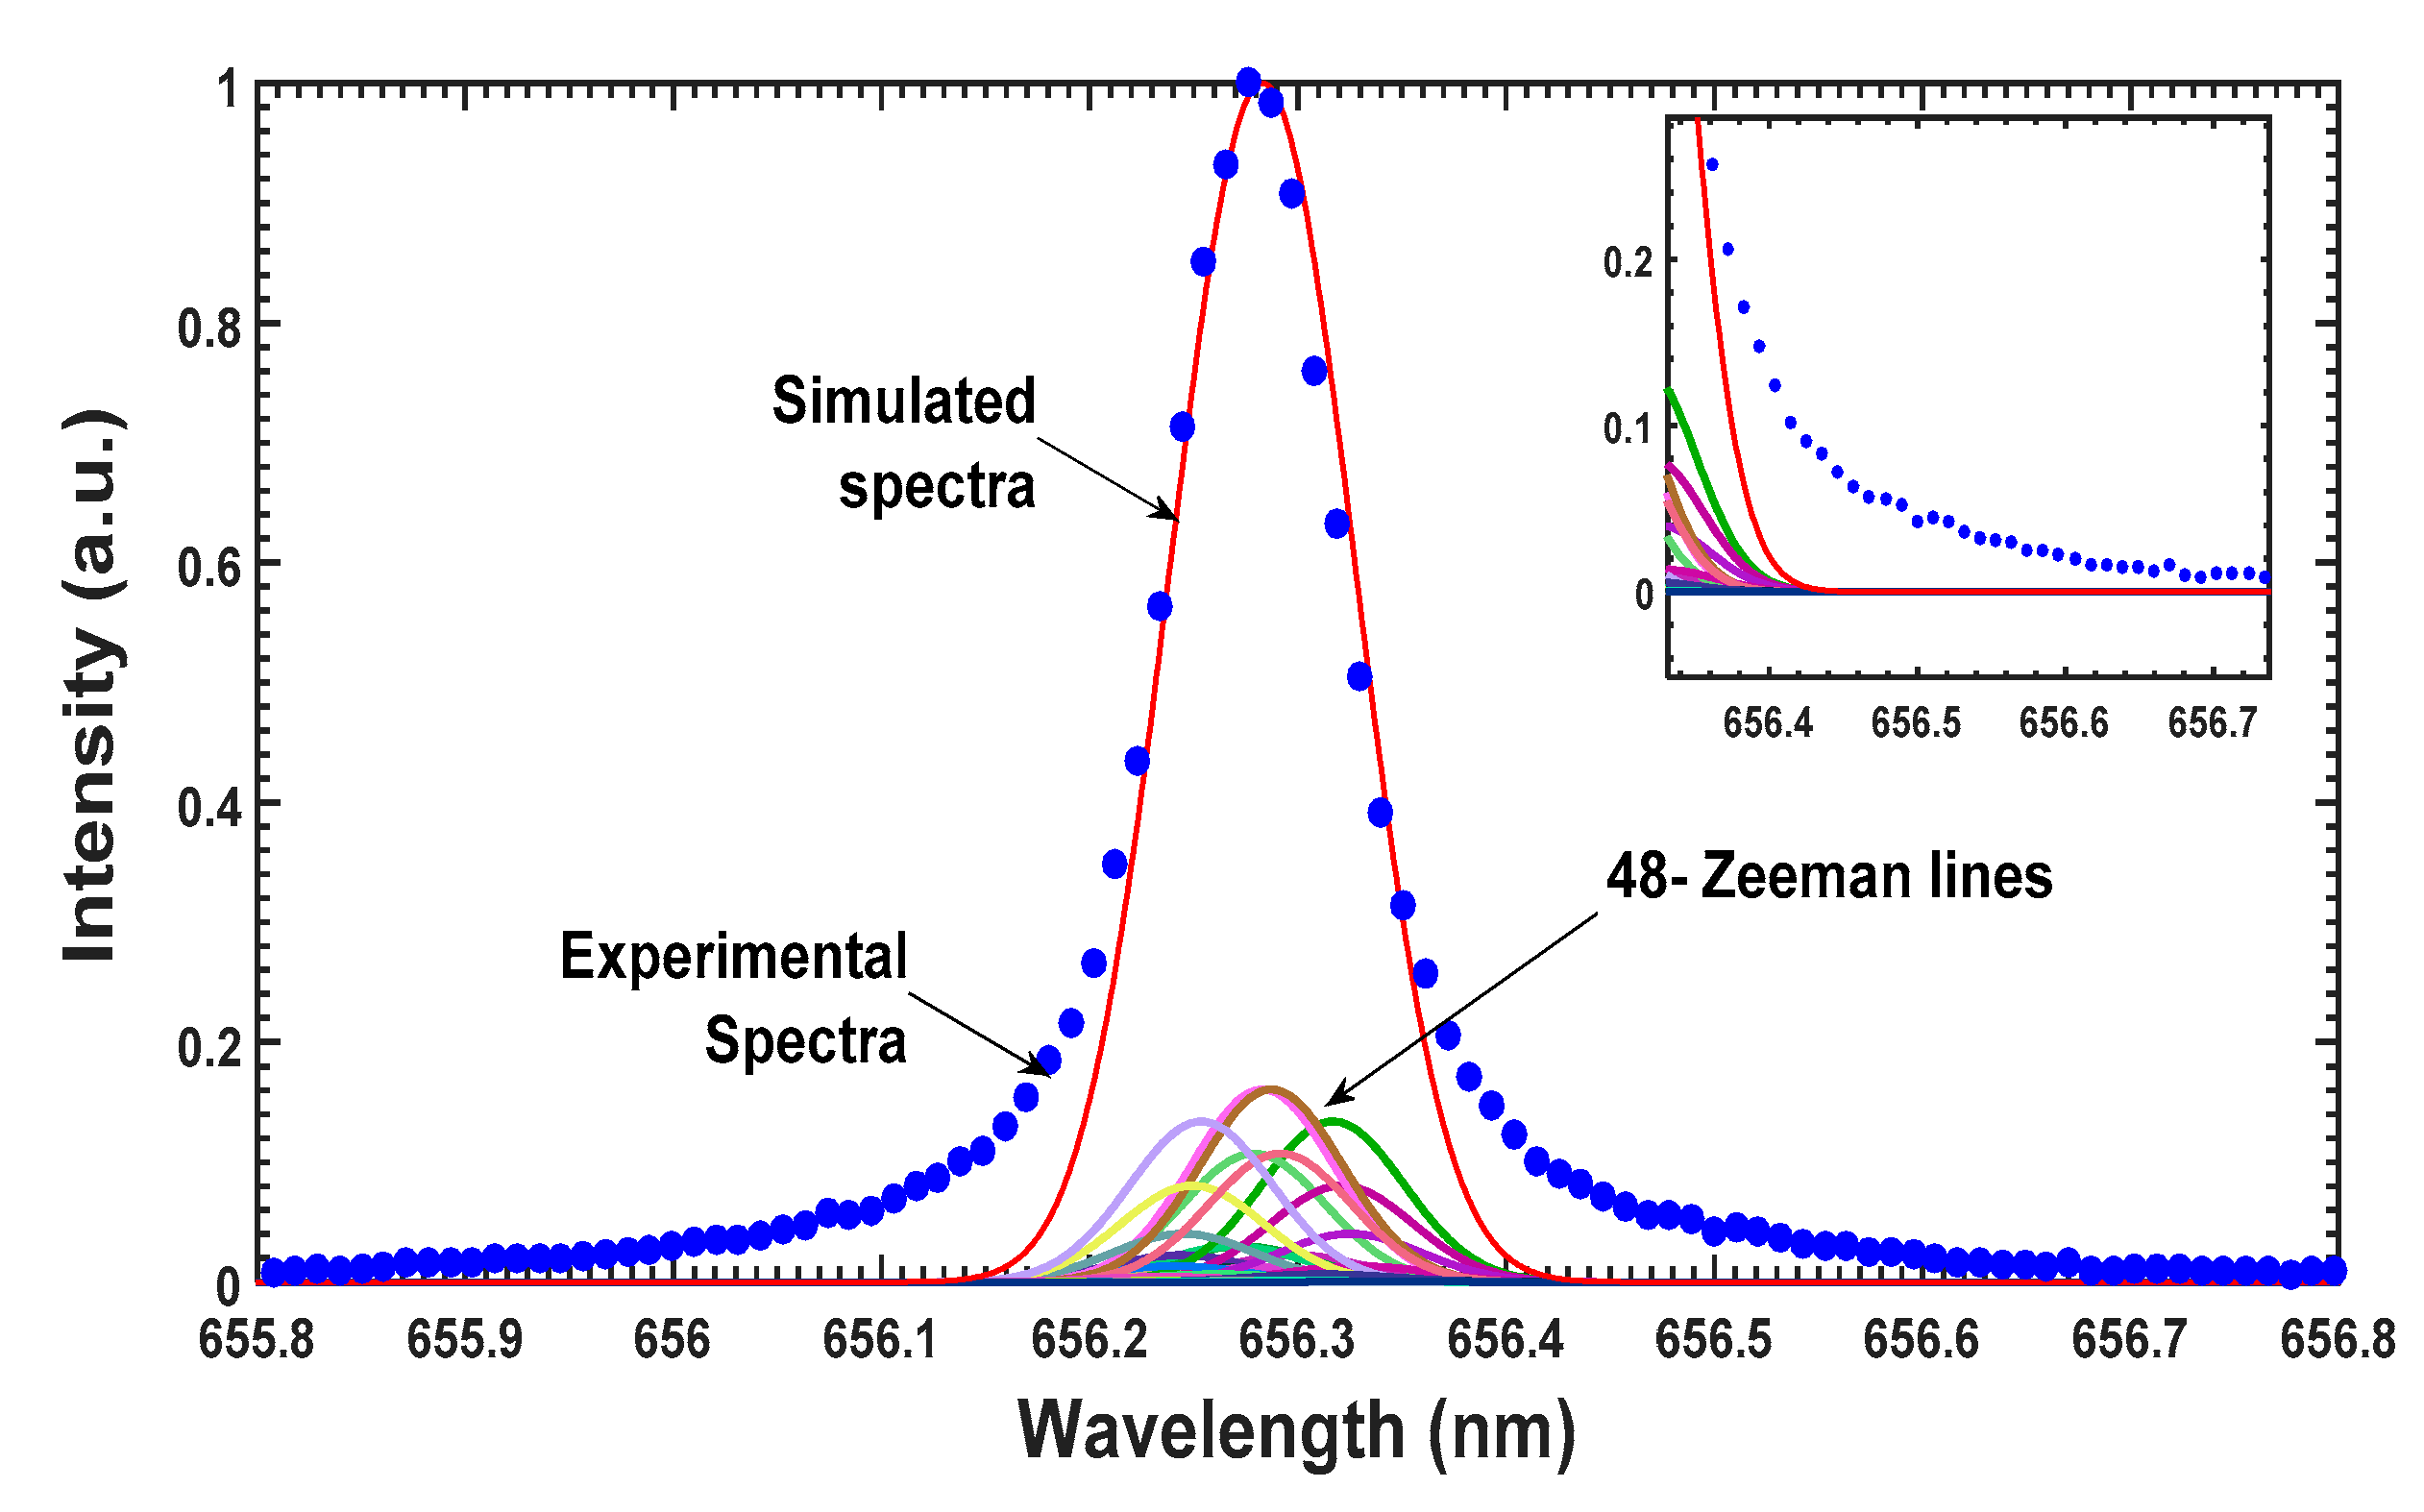
2.2. Technique for Estimating Neutral Temperature

In principle, the spectral line shape is broadened by different broadening mechanisms from where the plasma species is radiated, and the interactions that happen in that region can change the width of the spectrum. These are mainly Doppler broadening, the Stark effect, and broadening due to pressure. Among them, the contribution of the Stark and pressure effects to the broadening of the spectral line, as well as line narrowing due to the Dicke Effect, can be neglected because the plasma density in this region is much lower than the density at the divertor region of the plasma, where the above effects are important [1,25]. Hydrogen atoms follow the Maxwellian velocity distribution, and this gives rise to the Doppler broadening, which has a Gaussian line profile. The width of the Gaussian line profile gives the temperature of the species, which is given as [11]:
T = constant × ( Δ λ λ o ) 2 ( eV )
where Δλ is the full width at half maximum (FWHM), and λo is the central wavelength of the spectral line. Tokamak has a strong magnetic field in order to confine the high-temperature plasma, and it varies between 0.75 and 1.5 T at the center of the vacuum vessel in Aditya-U tokamak. Then, the effect of the magnetic field on the spectral line profile must be taken into account while estimating the FWHM. As per quantum mechanical theory, interaction between a magnetic field and atoms creates a perturbation in energy levels, and this can modify the spectral line shape of atomic and molecular spectra, which is known as the Zeeman effect.
E = g j μ B Bm j
where μ B is the Bohr magneton and gj is the Landé g-factor, which is calculated by,
g j = 1 +   j ( j + 1 ) + s ( s + 1 ) l ( l + 1 ) 2 j ( j + 1 )
where j, l, and s are the total, angular, and spin quantum numbers, respectively. The shift in wavelength due to the change in energy is proportional to the strength of the magnetic field and the central wavelength (λo) of the unperturbed atomic line. The polarization of emitted radiation with an un-shifted component (π) is parallel to the magnetic field, and the shifted components (±σ) are perpendicular to the magnetic field. The observation of the σ and π components of the Zeeman split spectra depends upon the direction of the magnetic field and the line of sight (LoS). If B is parallel to the LoS, then only the σ component is observed, and when B is perpendicular to the LoS, both the σ and π components are observed. The fiber arrangements made here were in such a way that each LoS was perpendicular to the same constant toroidal magnetic field present in the viewing area. It is easier to analyze the effect on temperature present due to splitting of the spectral line. This is the apparent temperature value for each chord passing through different radial locations.
The Hα emission intrinsically consists of seven fine structure components, which further split into a total of 54 Hα components for the high-field Zeeman effect [10,12,25]. Among them, 48 are allowed transitions according to selection rules. Each of these 48 spectral lines broadens individually and contributes to the resultant spectrum. A simulated spectrum for different FWHM values of each Zeeman split line are added up together and produce a broader resultant spectrum. Iterating the resultant spectrum with the experimental spectrum gives the correct temperature values. The instrumental broadening that is caused by the spectrometer has a value of 0.023 nm and has also been taken into account during the temperature estimation. The intensities and number of components in which Zeeman splitting occurs can be found in [16].
Hydrogen atoms are also produced via different atomic and molecular processes, as discussed previously in the introduction section, and each process corresponds to different temperatures. In this study, we have observed that, considering the Zeeman effect and Doppler broadening for a single temperature, the experimental spectrum does not match the simulated one. In order to properly fit the spectrum, we were required to consider the two temperature components of the hydrogen atom corresponding to Hα emissions coming from the plasma. Then, the experimental spectrum was fitted with two components: the warm and hot temperatures of the neutral particles. It should be noted here that a single Hα line may also have more than two components, as found in an LHD by Iwamae et al. [23]. However, in our case, consideration of two components was sufficient to fit the experimental spectrum.

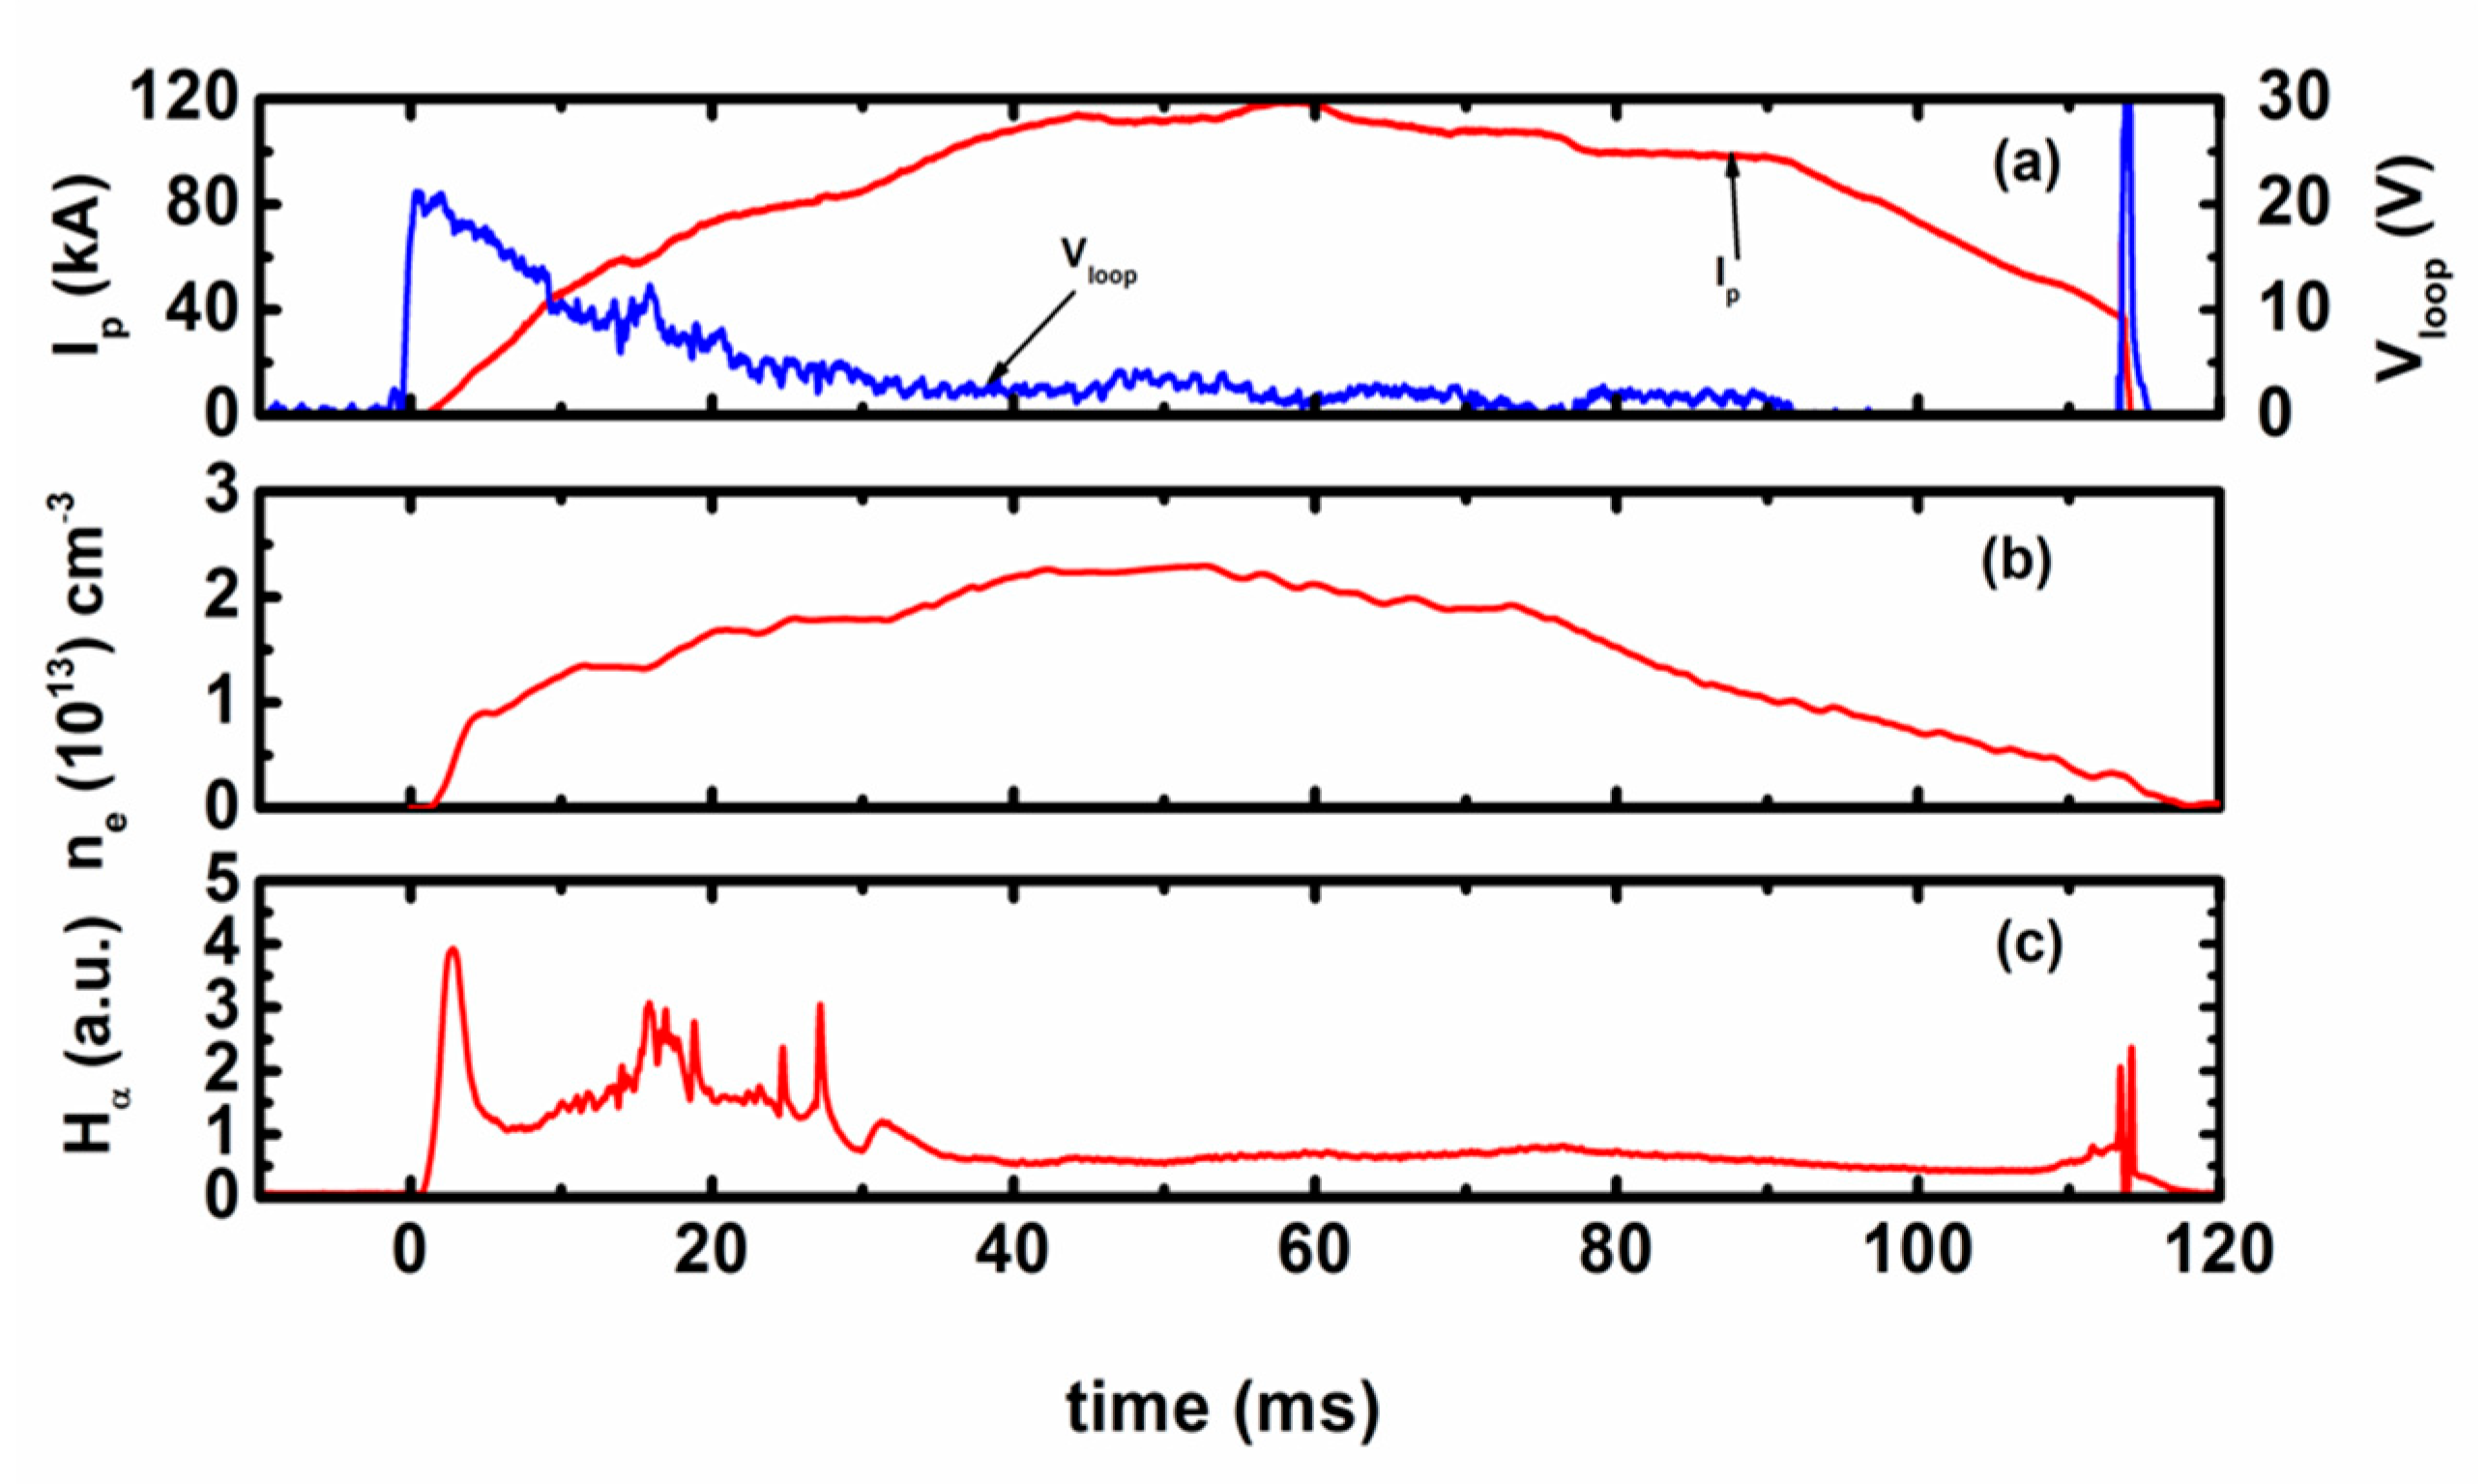
3. Results and Discussion

As shown in Figure 2, typical plasma discharges of Aditya-U tokamak have a plasma current of 120 kA and a duration of 120 ms. The temporal evolution of the plasma current, loop voltage, plasma electron density, and Hα signal are shown in Figure 2. It has a maximum central line averaged density of 2 × 10⁻¹⁹ m−3. The spatially resolved Hα spectral emission for shot no #33,025 is shown in Figure 3. Each frame covers a 12 nm wavelength range. It also contains the spectral line of O4+ at 650.024 and C+ spectral lines at 657 and 658 nm.
As discussed in the previous section, temperature is calculated by considering the 48 Zeeman lines that are present. If all of these lines are at the same temperature, then the resultant spectra generated by these lines are at a single temperature. After iterating the simulated result with experimental data, as presented in Figure 4, the temperature of the neutral particle was estimated to be ~2.5 eV. It shows a major mismatch at the wings of the experimental Hα data. This is a direct indication that Hα does not come from the neutral particle having a single energy distribution, but instead it has multiple energy distributions that are caused by different atomic and molecular processes. As a result, the Hα spectrum was simulated considering that the neutral particles have a temperature of two components, warm and hot. The temperature of both components of the hydrogen atom is influenced by the Zeeman effect, and incorporating this into the MATLAB program gives the result shown in Figure 5, which resolves the discrepancy present at the wings of the spectrum shape in the previous analysis. The temperatures of the warm and hot components were found to be ~4.9 and 45 eV, respectively. The residue in the fitting procedure is shown in the figure for a qualitative assessment of the fitting. The errors in the temperature measurement were estimated by considering the error in the instrumental width’s measurement and errors arising during the fitting procedure. The error associated with the instrumental width is ~2%. The error in temperature estimation falls into the range of ~2–3% and ~6–8% for the warm and hot components, respectively.
The spatial profile of the neutral temperature of the two plasma discharges was estimated using the abovementioned method. Both plasma discharges had (Shot #33,019 and #33,015) a similar plasma current Ip (124 kA), but the former discharge had a longer plasma duration of 115 ms compared to the latter one of 78 ms. The spectrometer was operated during the time window of 40–60 ms of both plasma discharges. During this time, the plasma current was almost constant, and the horizontal position was the same for both discharges. Figure 6a presents the spatial profile of warm hydrogen neutral temperature. The temperature changes from 3 eV to 5 eV, and the warm hydrogen temperature near to the plasma center is slightly higher than that at the plasma edge. The temperature of the warm components indicates that the particle produced by the electron has an impact on molecular hydrogen dissociation, because it has 3 eV of average kinetic energy of the produced atom [18]. Not only that, molecular hydrogen ion dissociation, which produces atoms with an average kinetic energy of 4.3 eV, and molecular hydrogen dissociative ionization (which produces atoms with energy ranges between 0.31 and 4.85 eV), were simultaneously found in the tokamak plasma. It was also observed that the particle generated by Franck–Condon dissociation has an energy of around 7 eV [18], which might reach the Aditya-U tokamak’s central region with reduced energy. It was observed through the modeling of the neutral particle dynamic in Aditya tokamak using DEGAS2 code that the major contribution in neutral hydrogen is related to molecular hydrogen dissociation processes, and, at the plasma edge, molecular hydrogen ion dissociation and molecular hydrogen ion dissociative recombination also make substantial contributions to the hydrogen atom density [26]. Figure 6b plots the spatial profile of the hot atomic hydrogen. In the analyzed discharge of Aditya-U tokamak, it was found that hot atomic hydrogen has a temperature range of 15–30 eV. Hot atomic hydrogen can acquire a temperature greater than 10 eV [16]. These hot atoms are produced mainly due to charge exchange, which generally comes from the plasma core, as it has a higher temperature compared to the plasma edge.

4. Summary

A high-resolution multi-track spectrometer (MTS) was set up on the Aditya-U tokamak, which has a minor radius of 0.25 m and a major radius of 0.75 m. The spatial profile of Hα spectral lines was monitored from seven LoSs, which spread over the center to the edge region of the plasma, and light was collected using collimating lenses and seven 13-m-long 1 mm core diameter fibers. The spectroscopic system enabled us to measure the emissions with 2.5 cm spatial resolution at the mid-plane. A CCD detector with a 26 × 26 μm2 pixel size allowed for spectral line recording with an instrumental width of 0.023 nm at a 50 um entrance slit width. A user-developed MATLAB code was applied to measure the neutral temperature using the relation between the Doppler-broadened FWHM of the spectral line and temperature. The effect of Zeeman splitting was also incorporated for the accurate estimation of the atom temperature. Initially, the estimation was done under consideration of the hydrogen atom having a single temperature. However, it was found that the experimental spectrum could be best fitted by considering two temperature components, warm and hot, indicating that a hydrogen atom was produced via different atomic and molecular processes. In this paper, two plasma discharges with a 1 Tesla magnetic field were analyzed. The warm component had a temperature in the range of ~3–5 eV. The temperature of this component showed a slightly higher value in the core than at the plasma edge. This indicates that different molecular dissociation processes are involved in the production of the warm component. Another temperature component, hot atomic hydrogen, had a temperature variation between ~15 and 30 eV. In the future, further investigation may lead to an understanding of how the neutral particle has different temperature effects on the particle distribution in the Aditya-U tokamak plasma.

Author Contributions

Conceptualization, N.Y., J.G., and M.B.C.; Formal analysis, N.Y.; Funding acquisition, J.G., M.B.C., R.M., and S.P.K.; Investigation, N.Y., M.B.C., R.M., and R.D.; and Aditya-U team Methodology, N.Y., J.G., and M.B.C.; Resources, R.M., S.P.K., R.D., K.A.J., R.L.T., and D.T.; Supervision, J.G., M.B.C., and S.P.K.; Writing—original draft, N.Y.; Writing—review & editing, J.G. and M.B.C.

Funding

The work performed was partially supported by the Atomic Energy Board of Research in Nuclear Sciences (DAE-BRNS) funded under Project Sanction No. 39/14/10/2018-BRNS/39010.

Acknowledgments

The authors are thankful to Gaurav Patel and Kanubhai Rathod from the Drafting Section, IPR for their contribution to the development of the rectangular view port.

Conflicts of Interest

The authors declare no conflict of interest.

References

  1. Stangeby, P.; McCracken, G. Plasma boundary phenomena in tokamaks. Nucl. Fusion 1990, 30, 1225–1379. [Google Scholar] [CrossRef]
  2. Boivin, R.L.; Goetz, J.A.; Irby, J.H.; Marmar, E.S.; Mossessian, D.; Pitcher, C.S.; Carreras, B.A.; Owen, L.W.; Hubbard, A.E.; Hughes, J.W.; et al. Effects of neutral particles on edge dynamics in Alcator C-Mod plasmas. Phys. Plasmas 2000, 7, 1919–1926. [Google Scholar] [CrossRef] [Green Version]
  3. Stotler, D.P.; Scotti, F.; Bell, R.E.; Diallo, A.; Leblanc, B.P.; Podesta, M.; Roquemore, A.L.; Ross, P.W.; Stotler, D. Midplane neutral density profiles in the National Spherical Torus Experiment. Phys. Plasmas 2015, 22, 082506. [Google Scholar] [CrossRef]
  4. Dey, R.; Ghosh, J.; Chowdhuri, M.; Manchanda, R.; Banerjee, S.; Ramaiya, N.; Sharma, D.; Srinivasan, R.; Stotler, D. Investigation of neutral particle dynamics in Aditya tokamak plasma with DEGAS2 code. Nucl. Fusion 2017, 57, 86003. [Google Scholar] [CrossRef]
  5. Reiter, D.; Baelmans, M.; Börner, P. The EIRENE and B2-EIRENE Codes. Fusion Sci. Technol. 2005, 47, 172–186. [Google Scholar] [CrossRef]
  6. Schneider, R.; Bonnin, X.; Borrass, K.; Coster, D.P.; Kastelewicz, H.; Reiter, D.; Rozhansky, V.A.; Braams, B.J. Plasma Edge Physics with B2-Eirene. Contrib. Plasma Phys. 2006, 46, 3–191. [Google Scholar] [CrossRef]
  7. Hinton, F.L.; Hazeltine, R.D. Theory of plasma transport in toroidal confinement systems. Rev. Mod. Phys. 1976, 48, 239–308. [Google Scholar] [CrossRef]
  8. Čadež, I.; Markelj, S.; Rupnik, Z.; Pelicon, P. Processes with neutral hydrogen and deuterium molecules relevant to edge plasma in tokamaks. J. Phys. Conf. Ser. 2008, 133, 12029. [Google Scholar] [CrossRef]
  9. Samm, U. The TEXTOR-94 Team Progress in plasma-wall-interaction research—Contributions from TEXTOR-94. Plasma Phys. Control. Fusion 1999, 41, B57–B76. [Google Scholar] [CrossRef]
  10. Hey, J.D.; Korten, M.; Lie, Y.T.; Pospieszczyk, A.; Rusbüldt, D.; Schweer, B.; Unterberg, B.; Wienbeck, J.; Hintz, E. Doppler Broadening and Magnetic Field Effects on the Balmer Lines Emitted at the Edge of a Tokamak Plasma. Contrib. Plasma Phys. 1996, 36, 583–604. [Google Scholar] [CrossRef]
  11. Kunze, H.-J. Introduction to Plasma Spectroscopy; Springer: Berlin/Heidelberg, Germany, 2009; Volume 56. [Google Scholar]
  12. Shikama, T.; Kado, S.; Zushi, H.; Iwamae, A.; Tanaka, S. Application of the Zeeman patterns in Ov and Hα spectra to the local plasma diagnostics of the TRIAM-1M tokamak. Phys. Plasmas 2004, 11, 4701. [Google Scholar] [CrossRef]
  13. Shikama, T.; Kado, S.; Zushi, H.; Sakamoto, M.; Iwamae, A.; Tanaka, S. Application of the Zeeman patterns to the measurement of local neutral behaviour in the edge plasma of TRIAM-1M tokamak. Plasma Phys. Control. Fusion 2006, 48, 1125–1139. [Google Scholar] [CrossRef]
  14. Ghosh, J.; Griem, H.R.; Elton, R.C.; Terry, J.L.; Marmar, E.; Lipschultz, B.; LaBombard, B.; Rice, J.E.; Weaver, J.L. Measurements of ion and neutral atom flows and temperatures in the inner and outer midplane scrape-off layers of the Alcator C-Mod Tokamak. Phys. Plasmas 2004, 11, 1033–1042. [Google Scholar] [CrossRef]
  15. Blom, A.; Jupén, C. Parametrization of the Zeeman effect for hydrogen-like spectra in high-temperature plasmas. Plasma Phys. Control. Fusion 2002, 44, 1229–1241. [Google Scholar] [CrossRef]
  16. Yadava, N.; Ghosh, J.; Chowdhuri, M.B.; Manchanda, R.; Sripathi, P.K.; Dey, R.; Raj, H.; Banerjee, S.; Tanna, R.; Jadeja, K.A.; et al. Observation of poloidal asymmetry in measured neutral temperatures in the Aditya-U tokamak plasma. Nucl. Fusion 2019, 59, 106003. [Google Scholar] [CrossRef]
  17. Goto, M.; Sawada, K.; Fujii, K.; Hasuo, M.; Morita, S. Evaluation of hydrogen atom density in the plasma core region based on the Balmer-line profile. Nucl. Fusion 2011, 51, 023005. [Google Scholar] [CrossRef]
  18. Takenaga, H.; Higashijima, S.; Sakasai, A.; Hosogane, N.; Kubo, H.; Sugie, T.; Suzuki, S. The spectral profile of the line emitted from the divertor region of JT-60U. Plasma Phys. Control. Fusion 1998, 40, 1115–1126. [Google Scholar]
  19. Koubiti, M.; Marandet, Y.; Escarguel, A.; Capes, H.; Godbert-Mouret, L.; Stamm, R.; De Michelis, C.; Guirlet, R.; Mattioli, M. Analysis of asymmetric Dα spectra emitted in front of a neutralizer plate of the Tore-Supra ergodic divertor. Plasma Phys. Control. Fusion 2002, 44, 261–275. [Google Scholar] [CrossRef]
  20. Kammler, T.; Wehner, S.; Küppers, J. The role of sticking and reaction probabilities in hot-atom mediated abstraction reactions of D on metal surfaces by gaseous H atoms. J. Chem. Phys. 1998, 109, 4071–4077. [Google Scholar] [CrossRef]
  21. Isler, R.C.; Wood, R.W.; Klepper, C.C.; Brooks, N.H.; Fenstermacher, M.E.; Leonard, A.W. Spectroscopic characterization of the DIII-D divertor. Phys. Plasmas 1997, 4, 355–368. [Google Scholar] [CrossRef]
  22. Iwamae, A.; Hayakawa, M.; Atake, M.; Fujimoto, T.; Goto, M.; Morita, S. Polarization resolved H[sub α] spectra from the large helical device: Emission location, temperature, and inward flux of neutral hydrogen. Phys. Plasmas 2005, 12, 42501. [Google Scholar] [CrossRef]
  23. Tanna, R.L.; Raj, H.; Ghosh, J.; Kumar, R.; Aich, S.; Macwan, T.; Kumawat, D.; Jadeja, K.A.; Patel, K.; Kalal, M.B.; et al. Overview of Operation and Experiments in the ADITYA—U Tokamak. Nucl. Fusion 2019. [Google Scholar] [CrossRef]
  24. Banerjee, S.; Ghosh, J.; Manchanda, R.; Dey, R.; Ramasubramanian, N.; Chowdhuri, M.B.; Patel, M.; Kumar, V.; Vasu, P.; Chattopadhyay, P.K.; et al. Observations of Hα emission profiles in Aditya tokamak. J. Plasma Fusion Res. 2010, 9, 29–32. [Google Scholar]
  25. Gao, W.; Huang, J.; Wu, C.; Xu, Z.; Hou, Y.; Jin, Z.; Chen, Y.; Zhang, P.; Team, E. Analysis of the Zeeman effect on D α spectra on the EAST tokamak. Chin. Phys. B 2017, 26, 45203. [Google Scholar] [CrossRef]
  26. Dey, R.; Chowdhuri, M.B.; Ghosh, J.; Manchanda, R.; Yadava, N.; Ramaiya, N.; Banerjee, S.; Nagora, U.C.; Atrey, P.K.; Raval, J.V. Investigation of atomic and molecular processes in Hα emission through modelling of measured Hα emissivity profile using DEGAS2 in the ADITYA tokamak. Nucl. Fusion 2019, 59, 076005. [Google Scholar] [CrossRef]
Figure 1. Schematic of the viewing geometry that was used for the multi-track spectrometer. The lines of sight are represented by Fibers 1 to 7 passing through the plasma radial locations of 1.65, 4.95, 8.25, 11.60, 14.90, 18.20, and 21.44 cm.
Atoms 07 00087 g001
Figure 2. Temporal evolution of a typical Aditya-U plasma for shot no #33,089: (a) Plasma current, Ip and loop voltage, Vloop; (b) plasma electron density, ne; and (c) Hα signal.
Atoms 07 00087 g002
Figure 3. Space-resolved Hα, C+, and O4+ spectra for seven tracks corresponding to seven lines of sight (LoSs).
Atoms 07 00087 g003
Figure 4. Fitting of the Hα experimental spectrum with simulated spectra by considering all 48 Zeeman lines and the hydrogen atom having a single temperature.
Atoms 07 00087 g004
Figure 5. Fitting of the Hα experimental spectrum with simulated spectra by considering all 48 Zeeman lines and two temperature components of the hydrogen atom.
Atoms 07 00087 g005
Figure 6. The spatial profile of temperature of the (a) warm and (b) hot components of the neutral hydrogen atom for shot #33,019 and #33,015.
Atoms 07 00087 g006

