1. Introduction
Si-like S III is an important ion for the studies of a variety of astrophysical plasmas, such as H II regions, planetary atmospheres, and stellar objects; see Tayal et al. [
1] and the references therein. Many of its observed lines varying from infrared to extreme ultraviolet regions have been useful for electron density and temperature diagnostics, for which atomic data, including energy levels, radiative rates (A-values), collision strengths (
), and effective collision strengths (
), are required. Realising its importance, there have been several studies for its atomic data, mainly by Galavís et al. [
2], Tayal and Gupta [
3], Hudson et al. [
4], and Grieve et al. [
5]. However, all of these works (and a few more as listed in [
1] and also compiled by the NIST (the National Institute of Standards and Technology) team, available at their website:
http://www.nist.gov/pml/data/asd.cfm) have some deficiencies and some limitations, as discussed in a more recent paper by Tayal et al. [
1], who performed yet another calculation with a larger number of 198 levels of the 3s
3p
, 3s3p
, 3p
, 3s
3p3d, 3s
4
ℓ, (3s
3p) 5s/5p/5d, 3s
3p6s, 3s3p
3d, 3s3p
4
ℓ, and 3s3p
5s configurations, i.e., 18 in total.
For the generation of wavefunctions, i.e., for the calculations of energy levels and A-values, Tayal et al. [
1] adopted non-orthogonal orbitals in the multi-configuration Hartree–Fock (MCHF) code, which allows independent correlations for each level with many orbitals and their configurations. As a result of this, their calculated energies and A-values were apparently fairly accurate when compared with the existing theoretical and experimental data; see their Tables 1 and 2. With these wavefunctions, they carried out further calculations of collisional data, i.e.,
and
, which are required in the analysis of plasmas. Apart from improving the accuracy of energies and A-values, the additional advantage of these non-orthogonal orbitals is the avoidance of pseudo-resonances, which are often a problem in the standard
R-matrix calculations with orthogonal orbitals. These (unphysical) pseudo-resonances in the variation of
, which arise at energies above thresholds due to the orthogonality conditions imposed on the orbitals, included in the generation of wavefunctions, but not in the collisional calculations, need to be smoothed over, as shown in Figure 1 of Aggarwal and Hibbert [
6] for three transitions of O III.
Since the adopted wavefunctions of Tayal et al. [
1] are accurate, subsequent calculations for collisional data are also “expected” to be equally accurate, particularly when: (i) they have included a large range of partial waves with angular momentum
23.5, to ensure convergence of
for most forbidden transitions, (ii) have included the contribution of higher neglected partial waves through a top-up procedure, to ensure the convergence of
for the allowed ones as well, (iii) have considered a large range of energy, up to 12.6 Ryd, and have even extrapolated their values of
for higher energies to determine the values of
up to T
= 10
K, as accurately as possible, (iv) have resolved resonances in a very fine energy mesh of 0.0001 Ryd, to take care of almost all resonances without giving undue weightage to their widths, and finally, (v) have performed relativistic calculations with the B-spline
R-matrix (BSR) code. Therefore, there should be no reason to suspect their calculations of
for accuracy, which has been estimated to be about 20% for most transitions. Unfortunately, we have a different opinion as discussed below.
Assessing atomic data for accuracy is a (very) difficult task [
7], particularly for
. This is because the corresponding experimental results for most transitions of ions are almost non-existent, and a large calculation, as performed by Tayal et al. [
1], cannot be easily repeated, as it requires enormous computational resources, time, and expertise. However, it also does not (necessarily) mean that nothing can be done, and one has to accept the results at face value. In general, forbidden transitions are appreciably affected by the presence of numerous closed-channel (Feshbach) resonances (see, for example, Figure 1 of Tayal et al.), by more than an order of magnitude in some instances, and particularly towards the lower range of electron temperatures. For this reason, it is much more difficult to assess their accuracy. However, the allowed transitions, particularly the strong (electric dipole) ones, i.e., with a significant magnitude of oscillator strengths (f-values), do not show any appreciable resonances, and as a result of this, their values of
and
vary smoothly with increasing energy and temperature, respectively. Therefore, it is comparatively much easier to assess the accuracy for such transitions. Furthermore, values of
(and subsequently
) for allowed transitions directly depend on their energy (
E) and f-values, because
E
) ln (E), where
is the statistical weight. Therefore, we focus (mainly) on such transitions to perform an accuracy assessment of the data reported by Tayal et al.
The easiest way to calculate
is by using the
flexible atomic code (FAC) of Gu [
8], which is available on the website
https://www-amdis.iaea.org/FAC/. This code is based on the
distorted-wave (DW) method, is fully relativistic, is highly efficient to run, and more importantly, produces results (for background
) that are comparable with other methods, such as the
R-matrix, as has been demonstrated in several of our earlier papers for a wide range of ions; see, for example, Figure 2 of Aggarwal and Keenan [
9] for Mg V. Therefore, to perform our calculations for
and
, we adopted this code and considered the same 18 configurations as included by Tayal et al. [
1] and exclusively listed above. However, these configurations generated 346 levels in total, out of which 148 (mainly the higher lying ones) were omitted by Tayal et al. for computational reasons. Additionally, this code does not (automatically) calculate resonances, as the
R-matrix does, but it should not affect the comparisons, as our main interest is in (strong) allowed transitions.
2. Collision Strengths and Effective Collision Strengths
A closer look at Table 2 of Tayal et al. [
1] shows that there are six transitions with significant f-values, namely 1–25 (3p
P
–3p3d
D
), 2–26 (3p
P
–3p3d
D
), 3–27 (3p
P
–3p3d
D
), 4–29 (3p
D
–3s3p
(
D)
D
), 4–30 (3p
D
–3p3d
F
), and 5–31 (3p
S
–3p3d
P
); the
indices used are those of Tayal et al. given in their Table 1. In
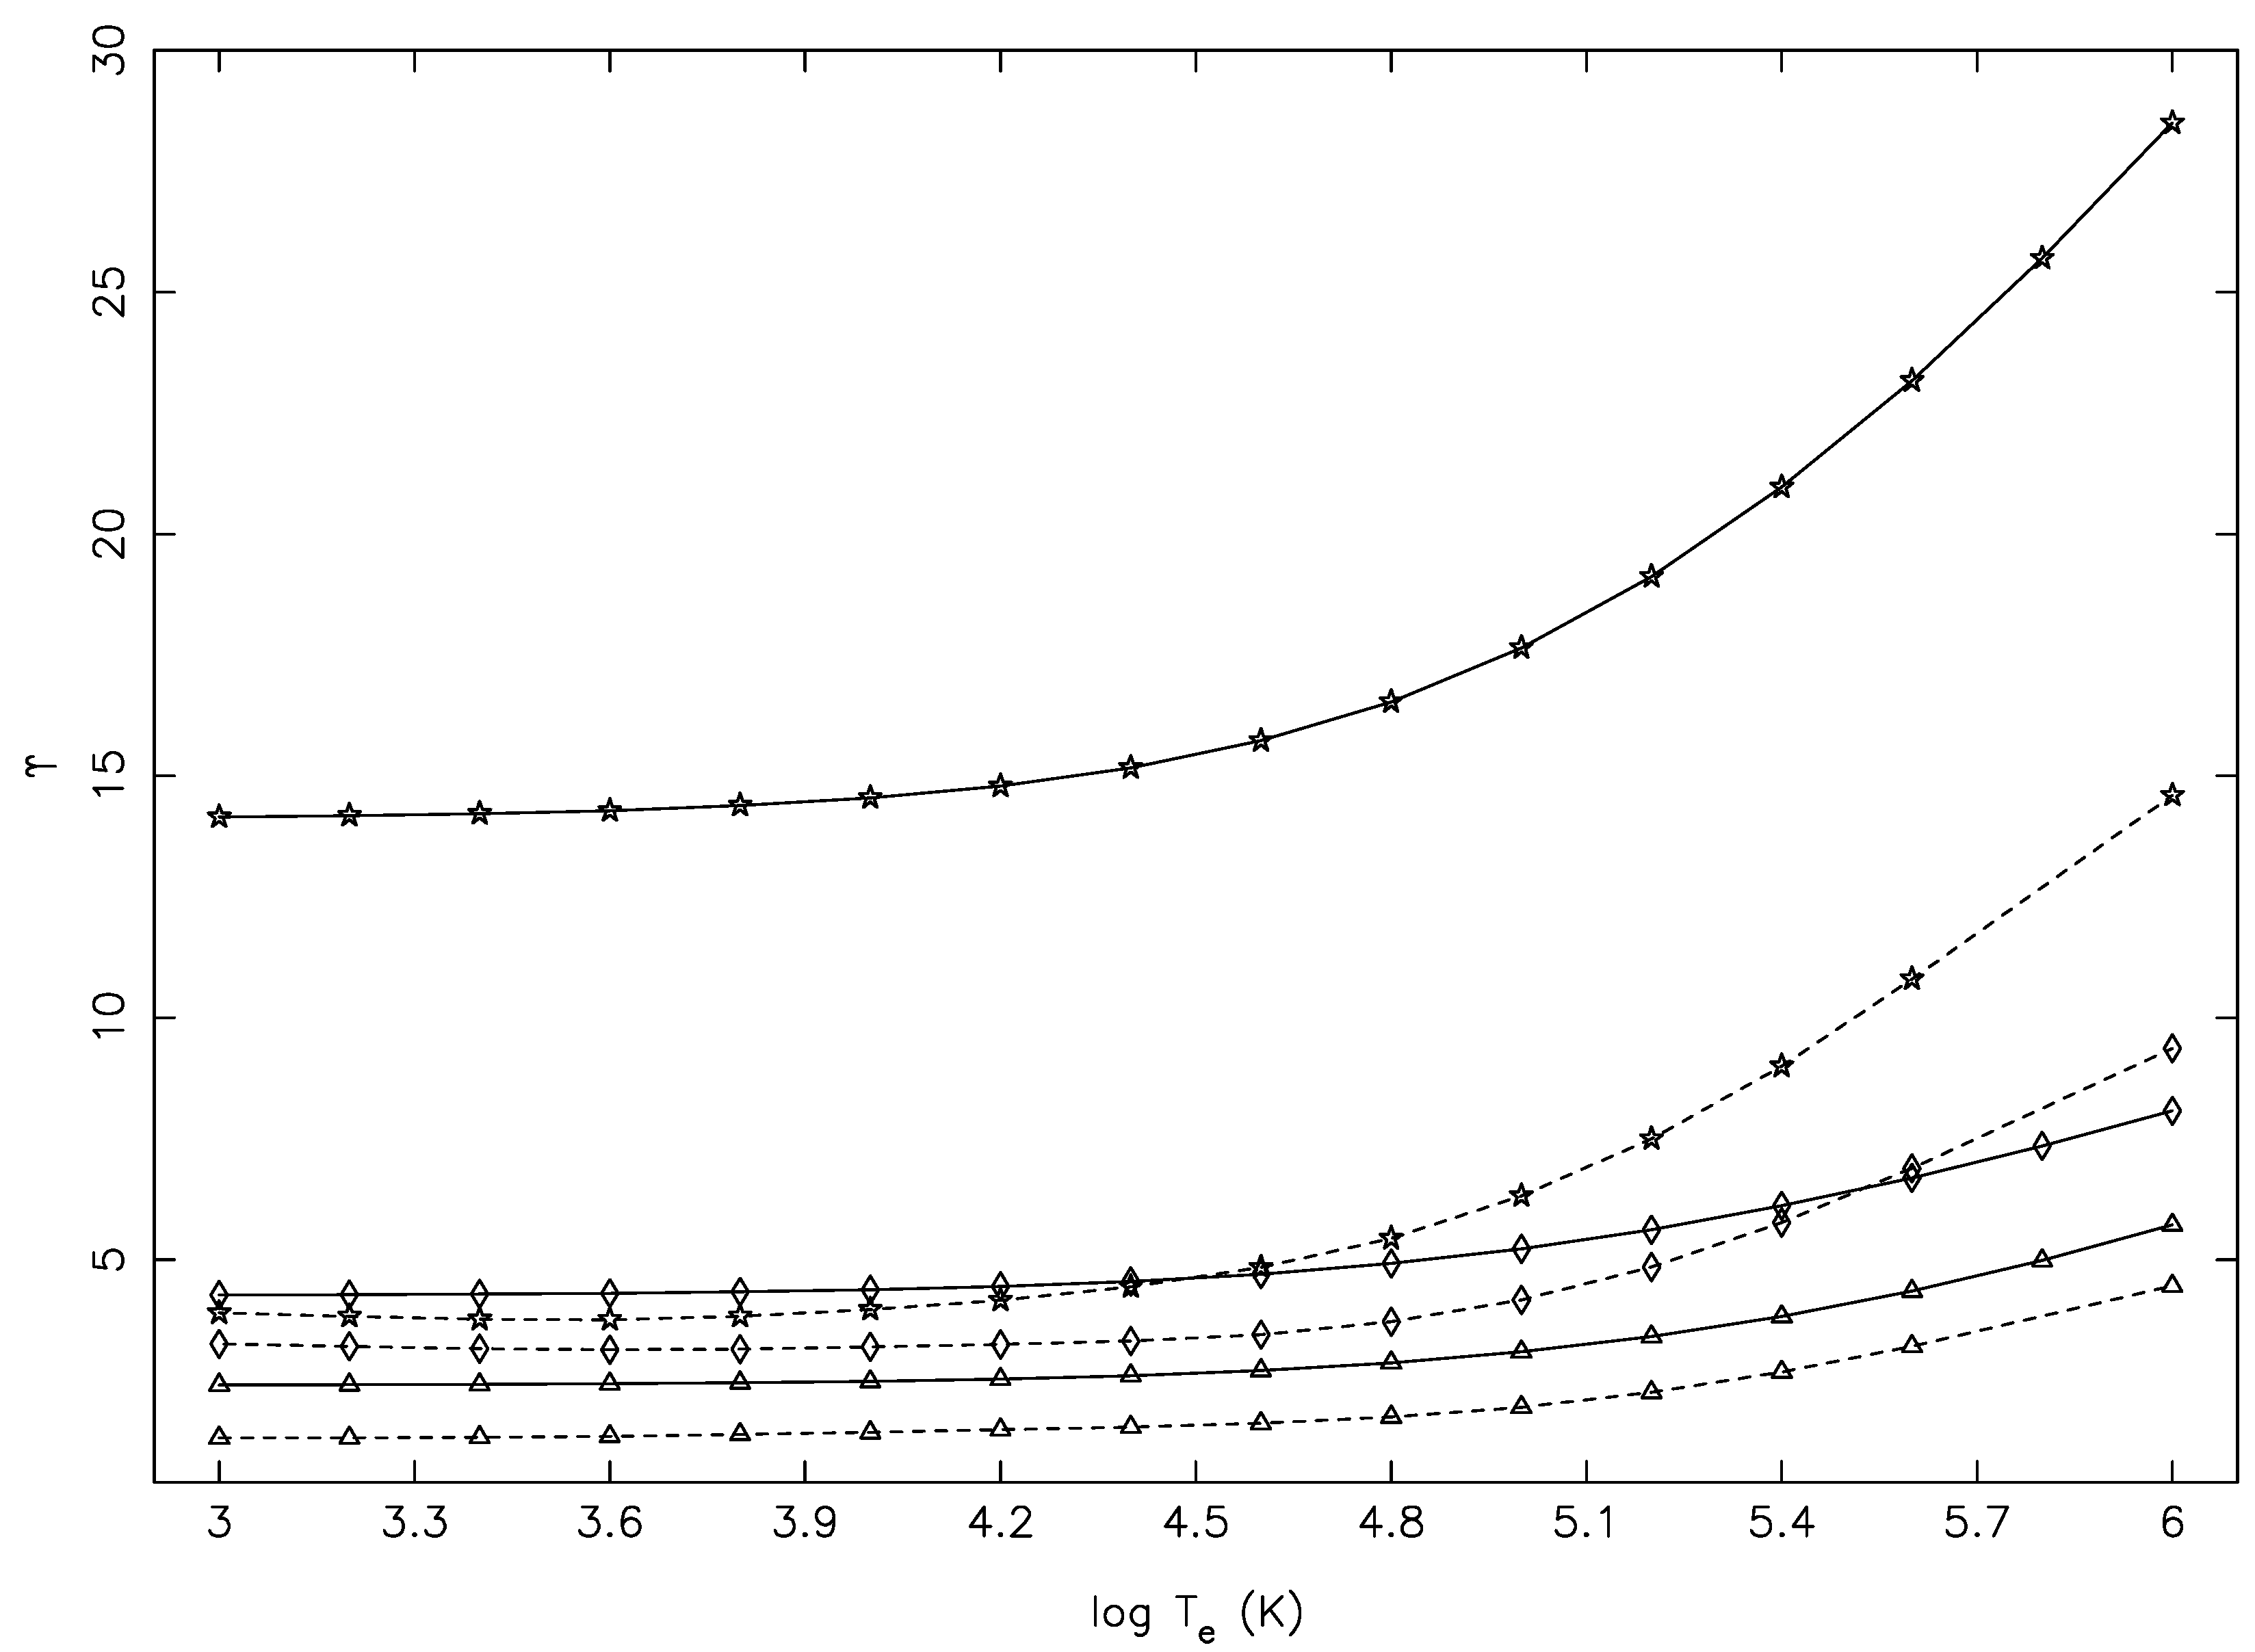
Table 1, we list their transition energies and f-values along with our results with FAC for a ready comparison. Tayal et al. did not report results for
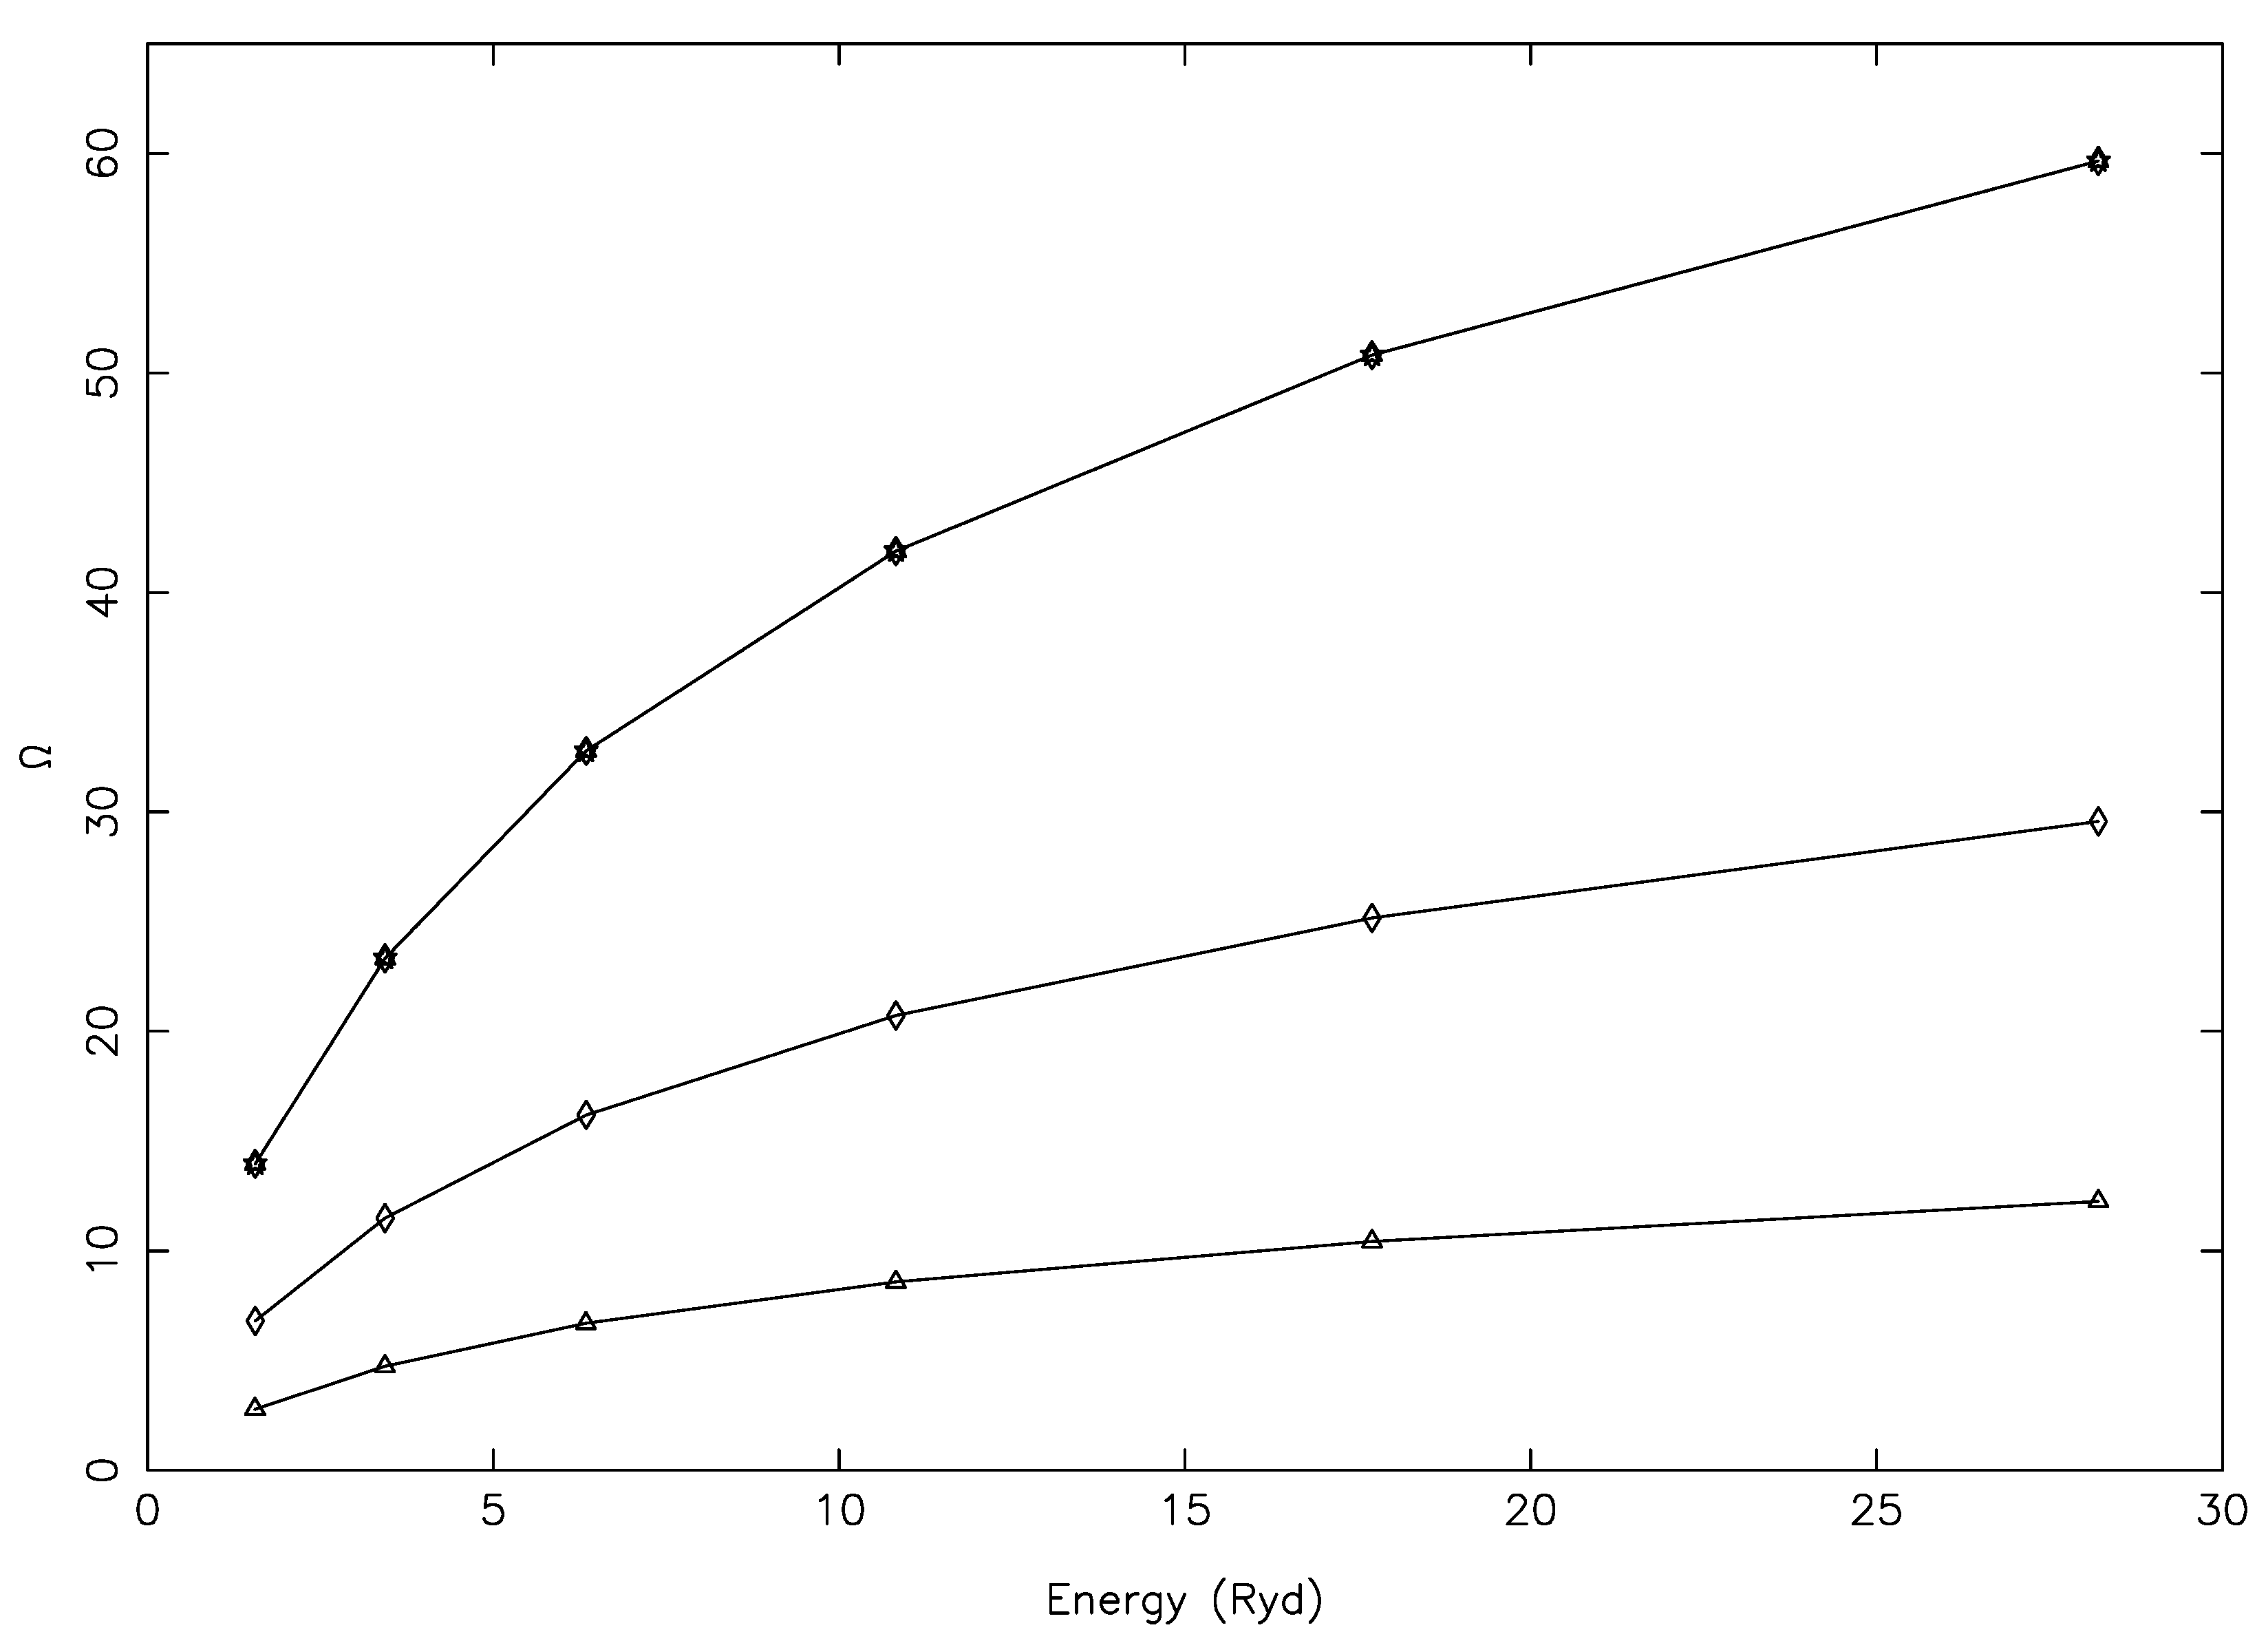
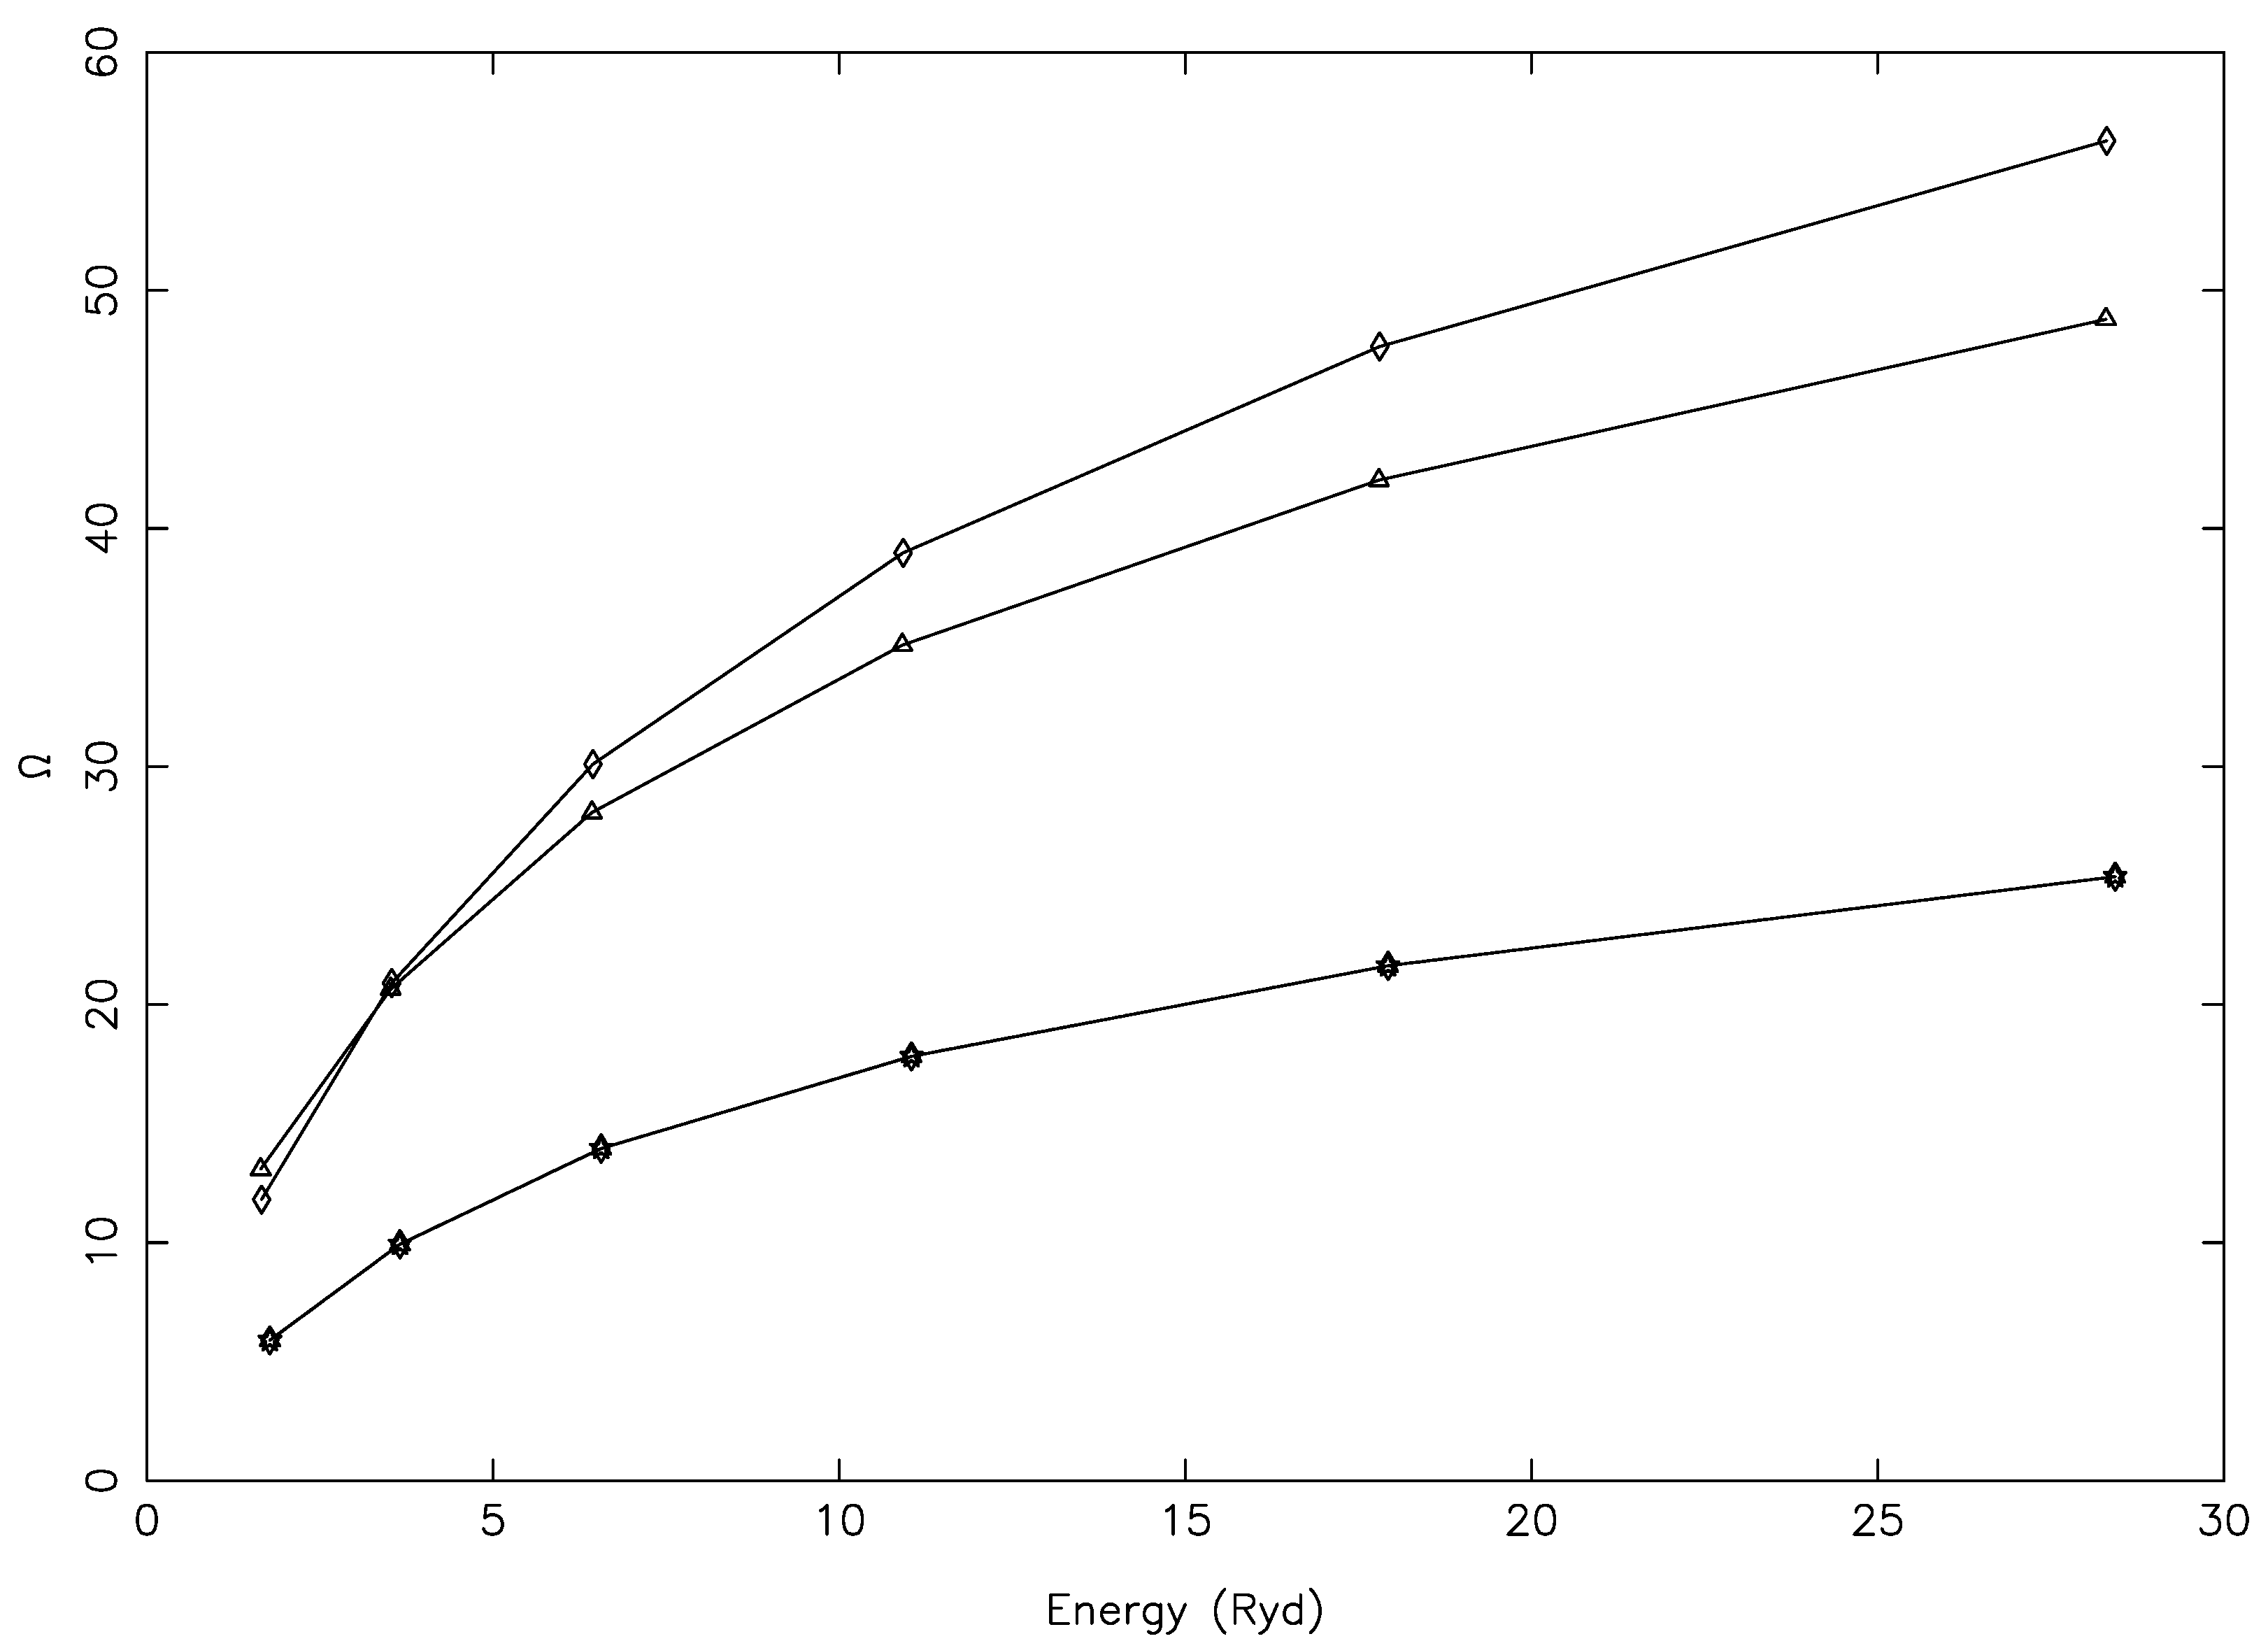
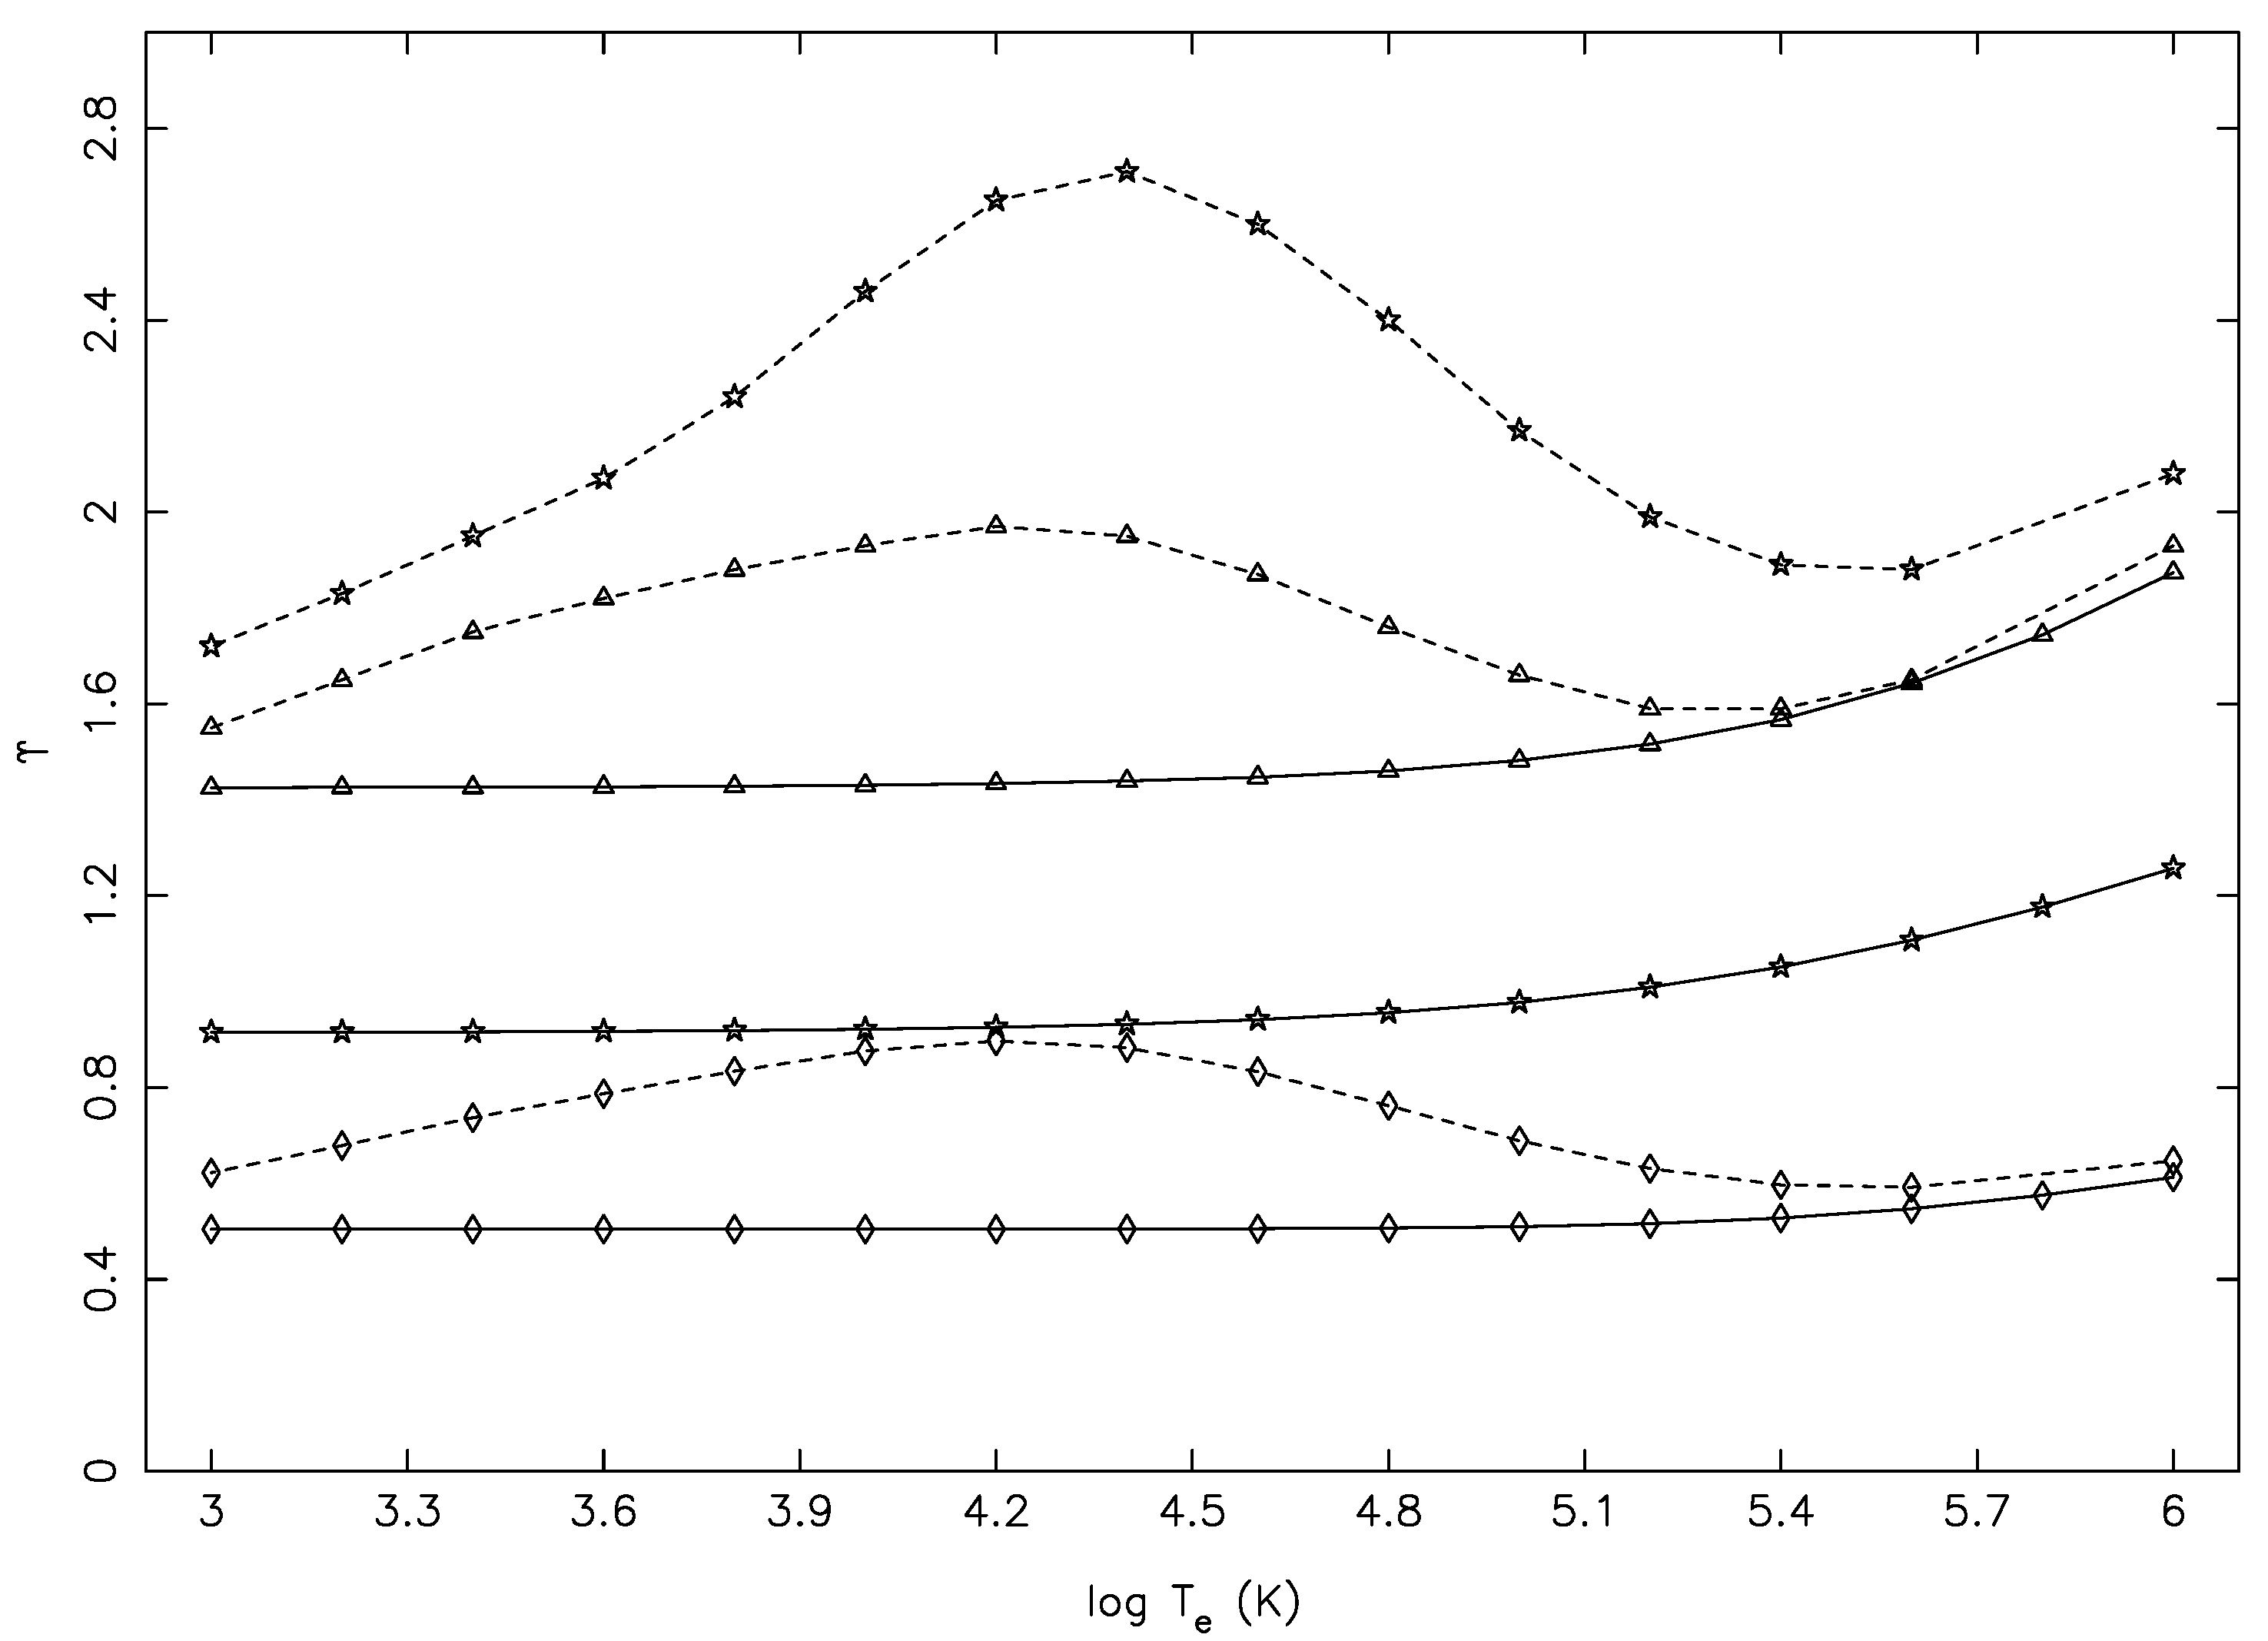
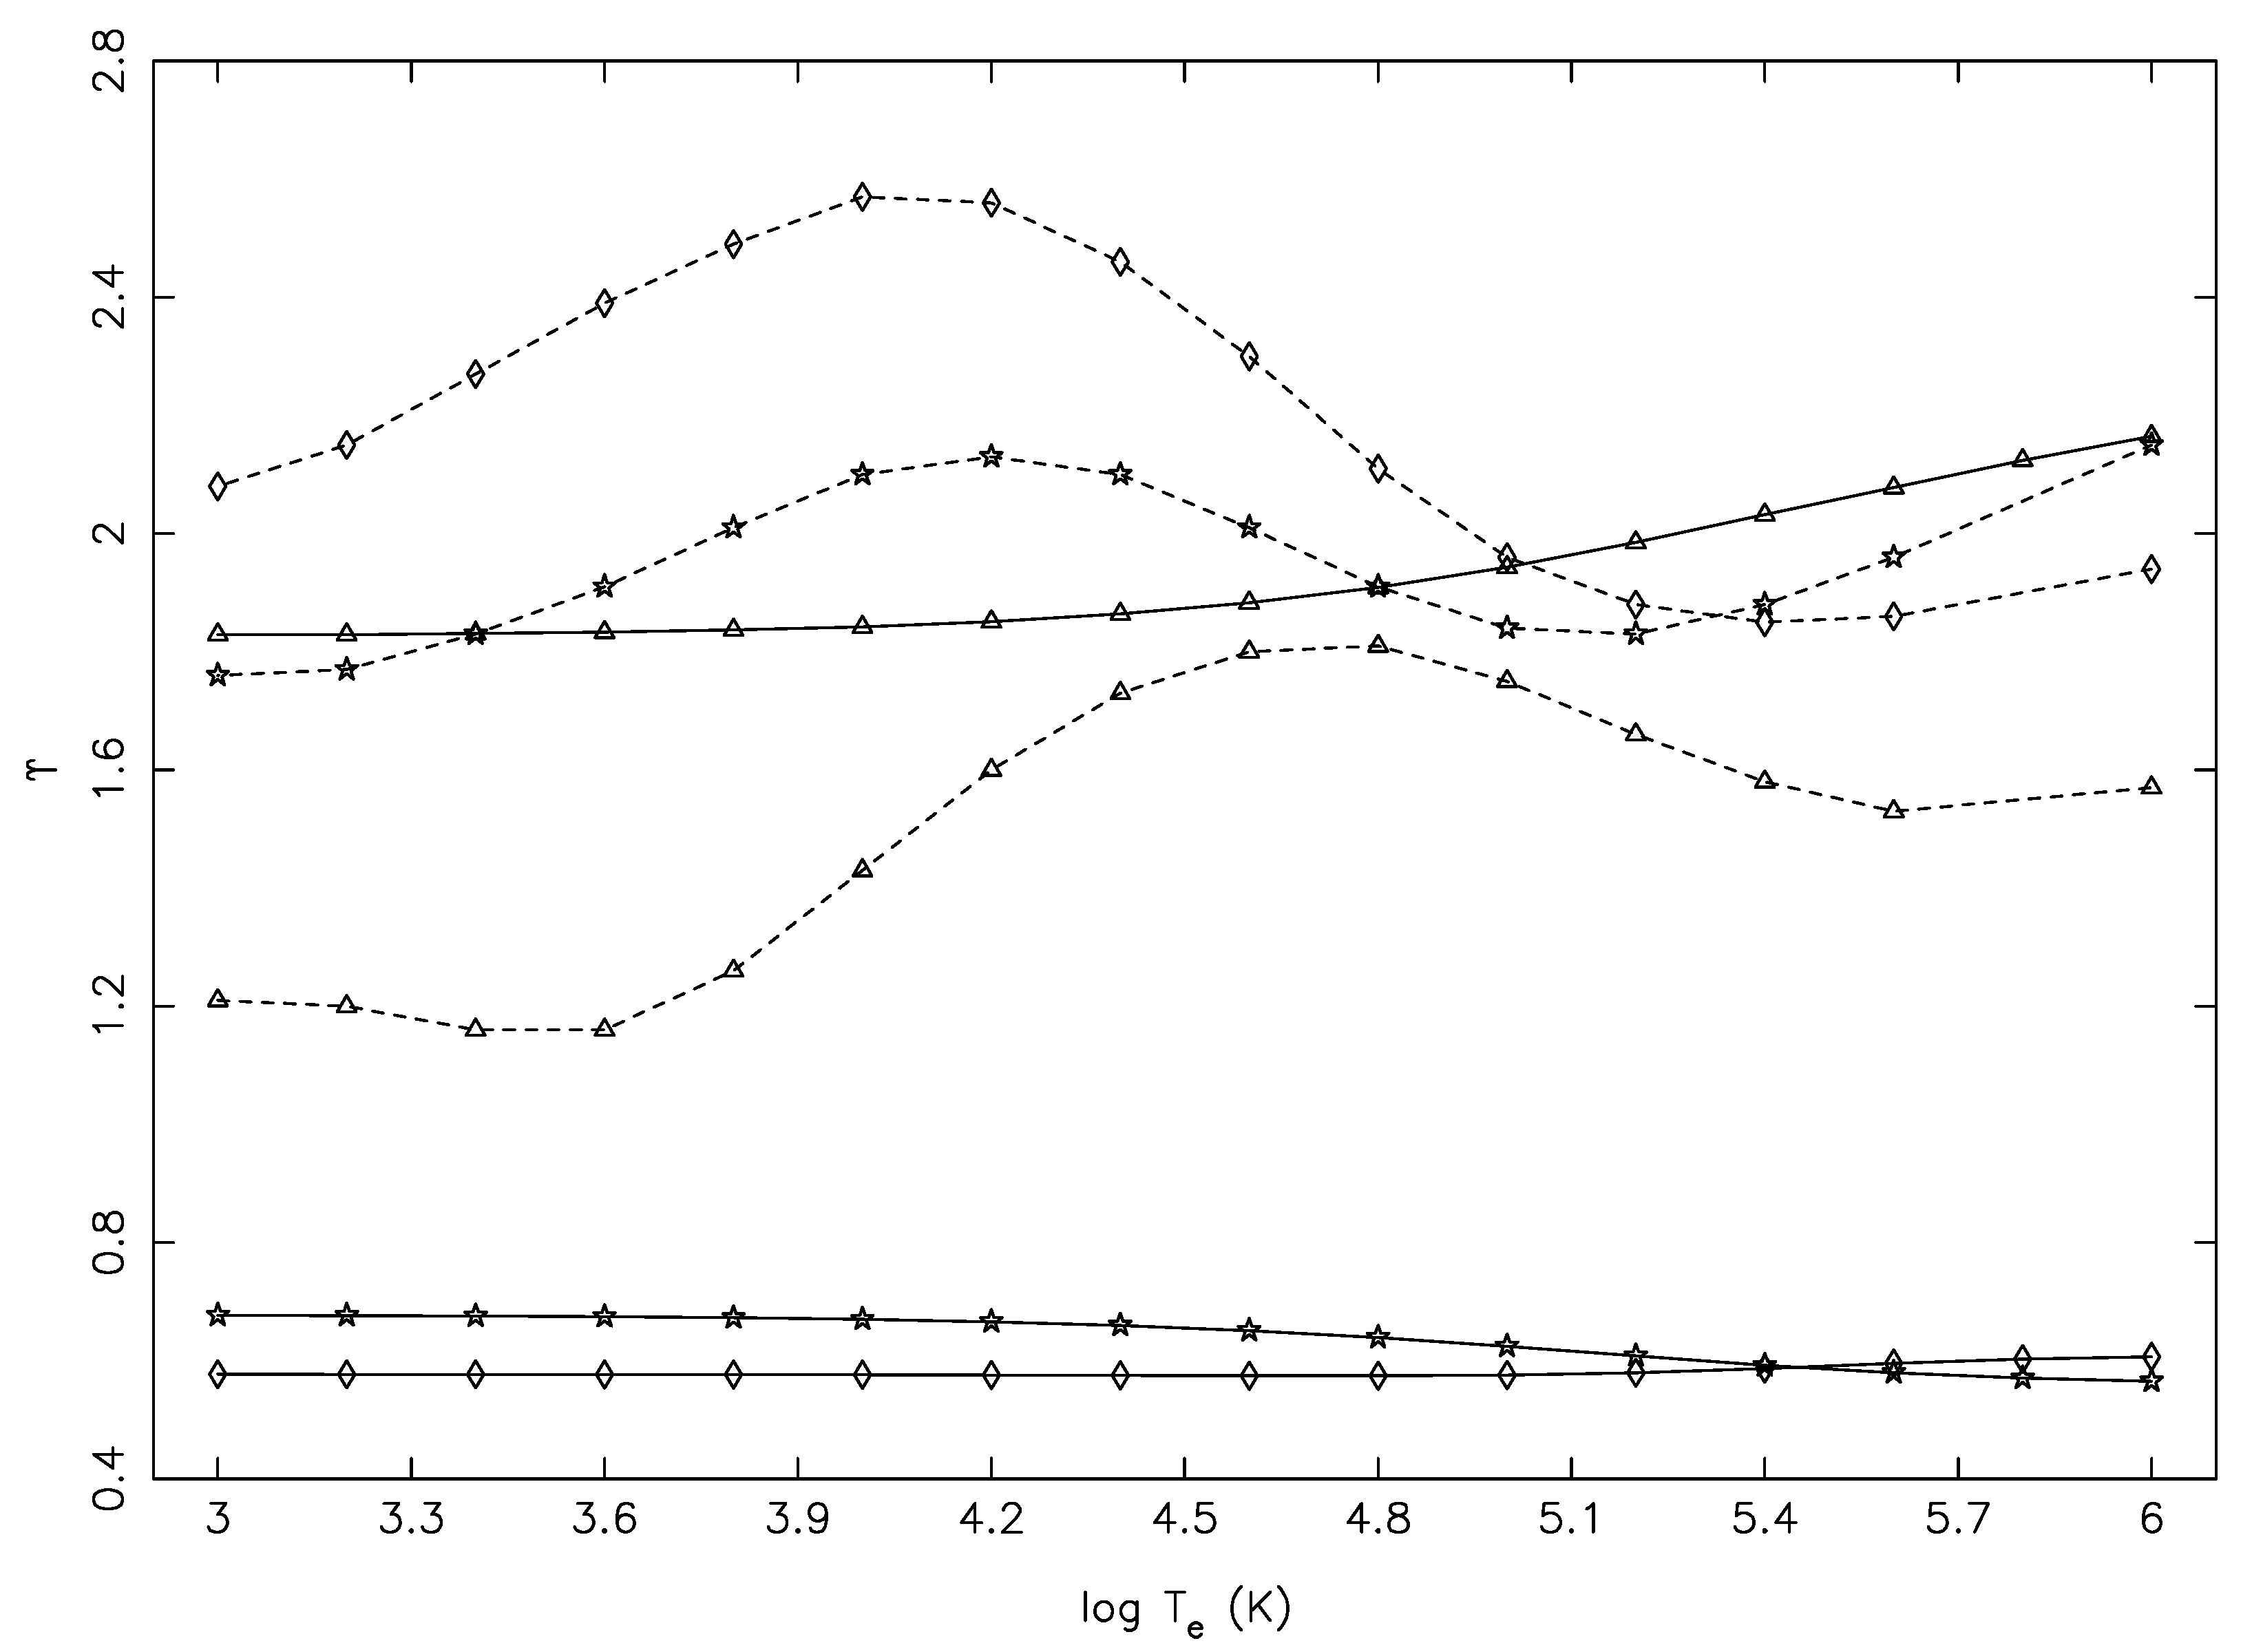
, but our data for these six transitions are shown in
Figure 1 and
Figure 2. As expected, the values of
varied smoothly and increased with increasing energy. The corresponding results for
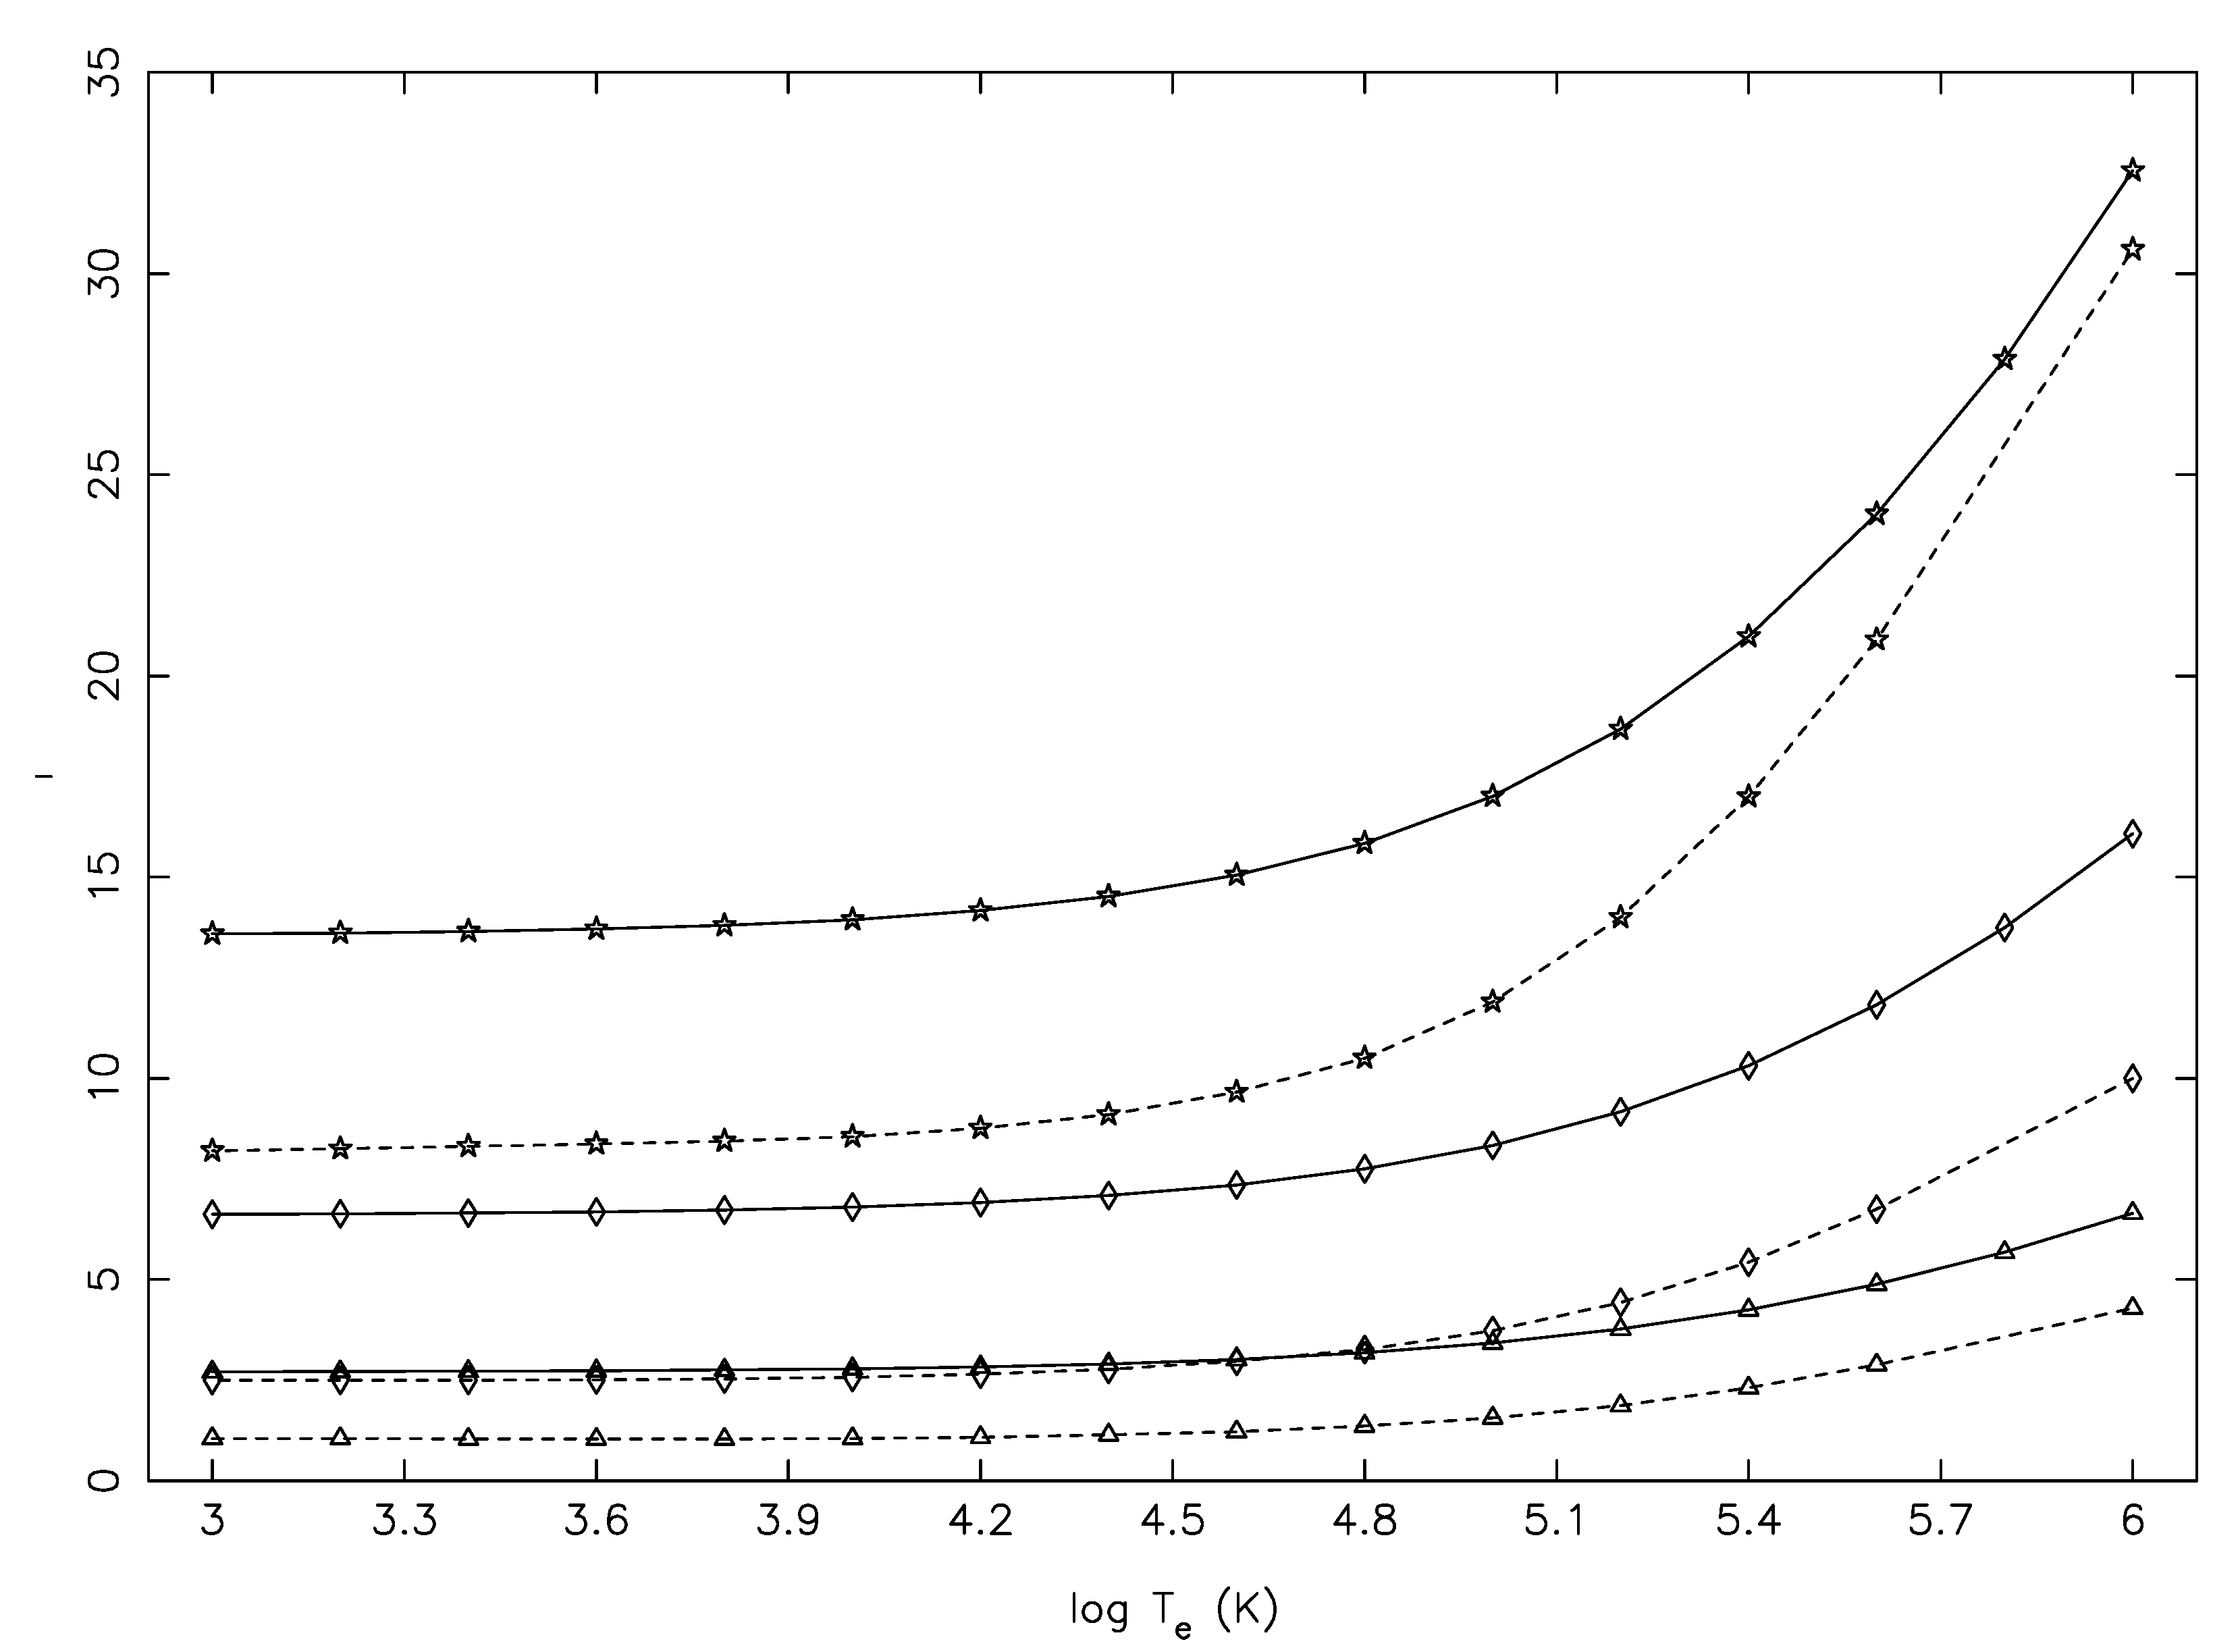
are shown in
Figure 3 and
Figure 4 at T
up to 10
K. Similar results of Tayal et al. are also included in these figures for comparisons. Since both transition energies and f-values were comparable between the two independent calculations (with MCHF and FAC), the subsequent results for
were also expected to be comparable, as already stated. Unfortunately, for all six transitions (and many more), the
values of Tayal et al. were highly
underestimated, by up to a factor of two, and almost at all temperatures, although for a few, the differences decreased towards the higher end of the temperature range. In the absence of the
data of Tayal et al., no direct comparisons/conclusions can be made, but we can definitely speculate on the source of discrepancies.
In some
R-matrix calculations, it is
assumed that
values (for all types of transitions)
converge within a few partial waves, particularly in the threshold region, and we suspected this was the case with the calculations of Tayal et al. [
1] as well. However, there are many transitions (mainly allowed ones, but some forbidden also) for which this is not true. As an example, see Figure 4 of Aggarwal et al. [
10] for the 3s3p
P
–3p
D
transition of Fe XV in which the whole
is lifted upwards with the inclusion of larger ranges of
J. Similarly, see Figure 3 of Aggarwal and Keenan [
11] for the 3p
3d
P
–3p
S
transition of Fe XI, which clearly demonstrates the importance of including a larger range of partial waves than (perhaps) done by Tayal et al. We understand that Tayal et al. included a top-up procedure to compensate for the higher neglected partial waves, at energies
above the thresholds, but this process at an early stage is insufficient, as it underestimates the values of
and has clearly been demonstrated in Figure 2 of Aggarwal and Keenan [
12] for a transition of Ni XI, in which the effect of the top-up procedure is shown at
9.5, 19.5, 29.5, and 39.5. Therefore, in our opinion, inclusion of an insufficient number of partial waves is the reason for the underestimated values of
reported by Tayal et al.
Since the above-mentioned underestimation of
is mostly at higher energies, one would expect that the values of
will only be underestimated towards the higher end of the temperature range, whereas these are at all temperatures, as seen in
Figure 3 and
Figure 4. This is because the top-up procedure was performed only at energies
above the thresholds, and thus, the values of
remained
uncorrected in the threshold region, if a sufficient number of partial waves was not included in the calculation. Therefore, all energies and temperatures are affected for the
and
values.
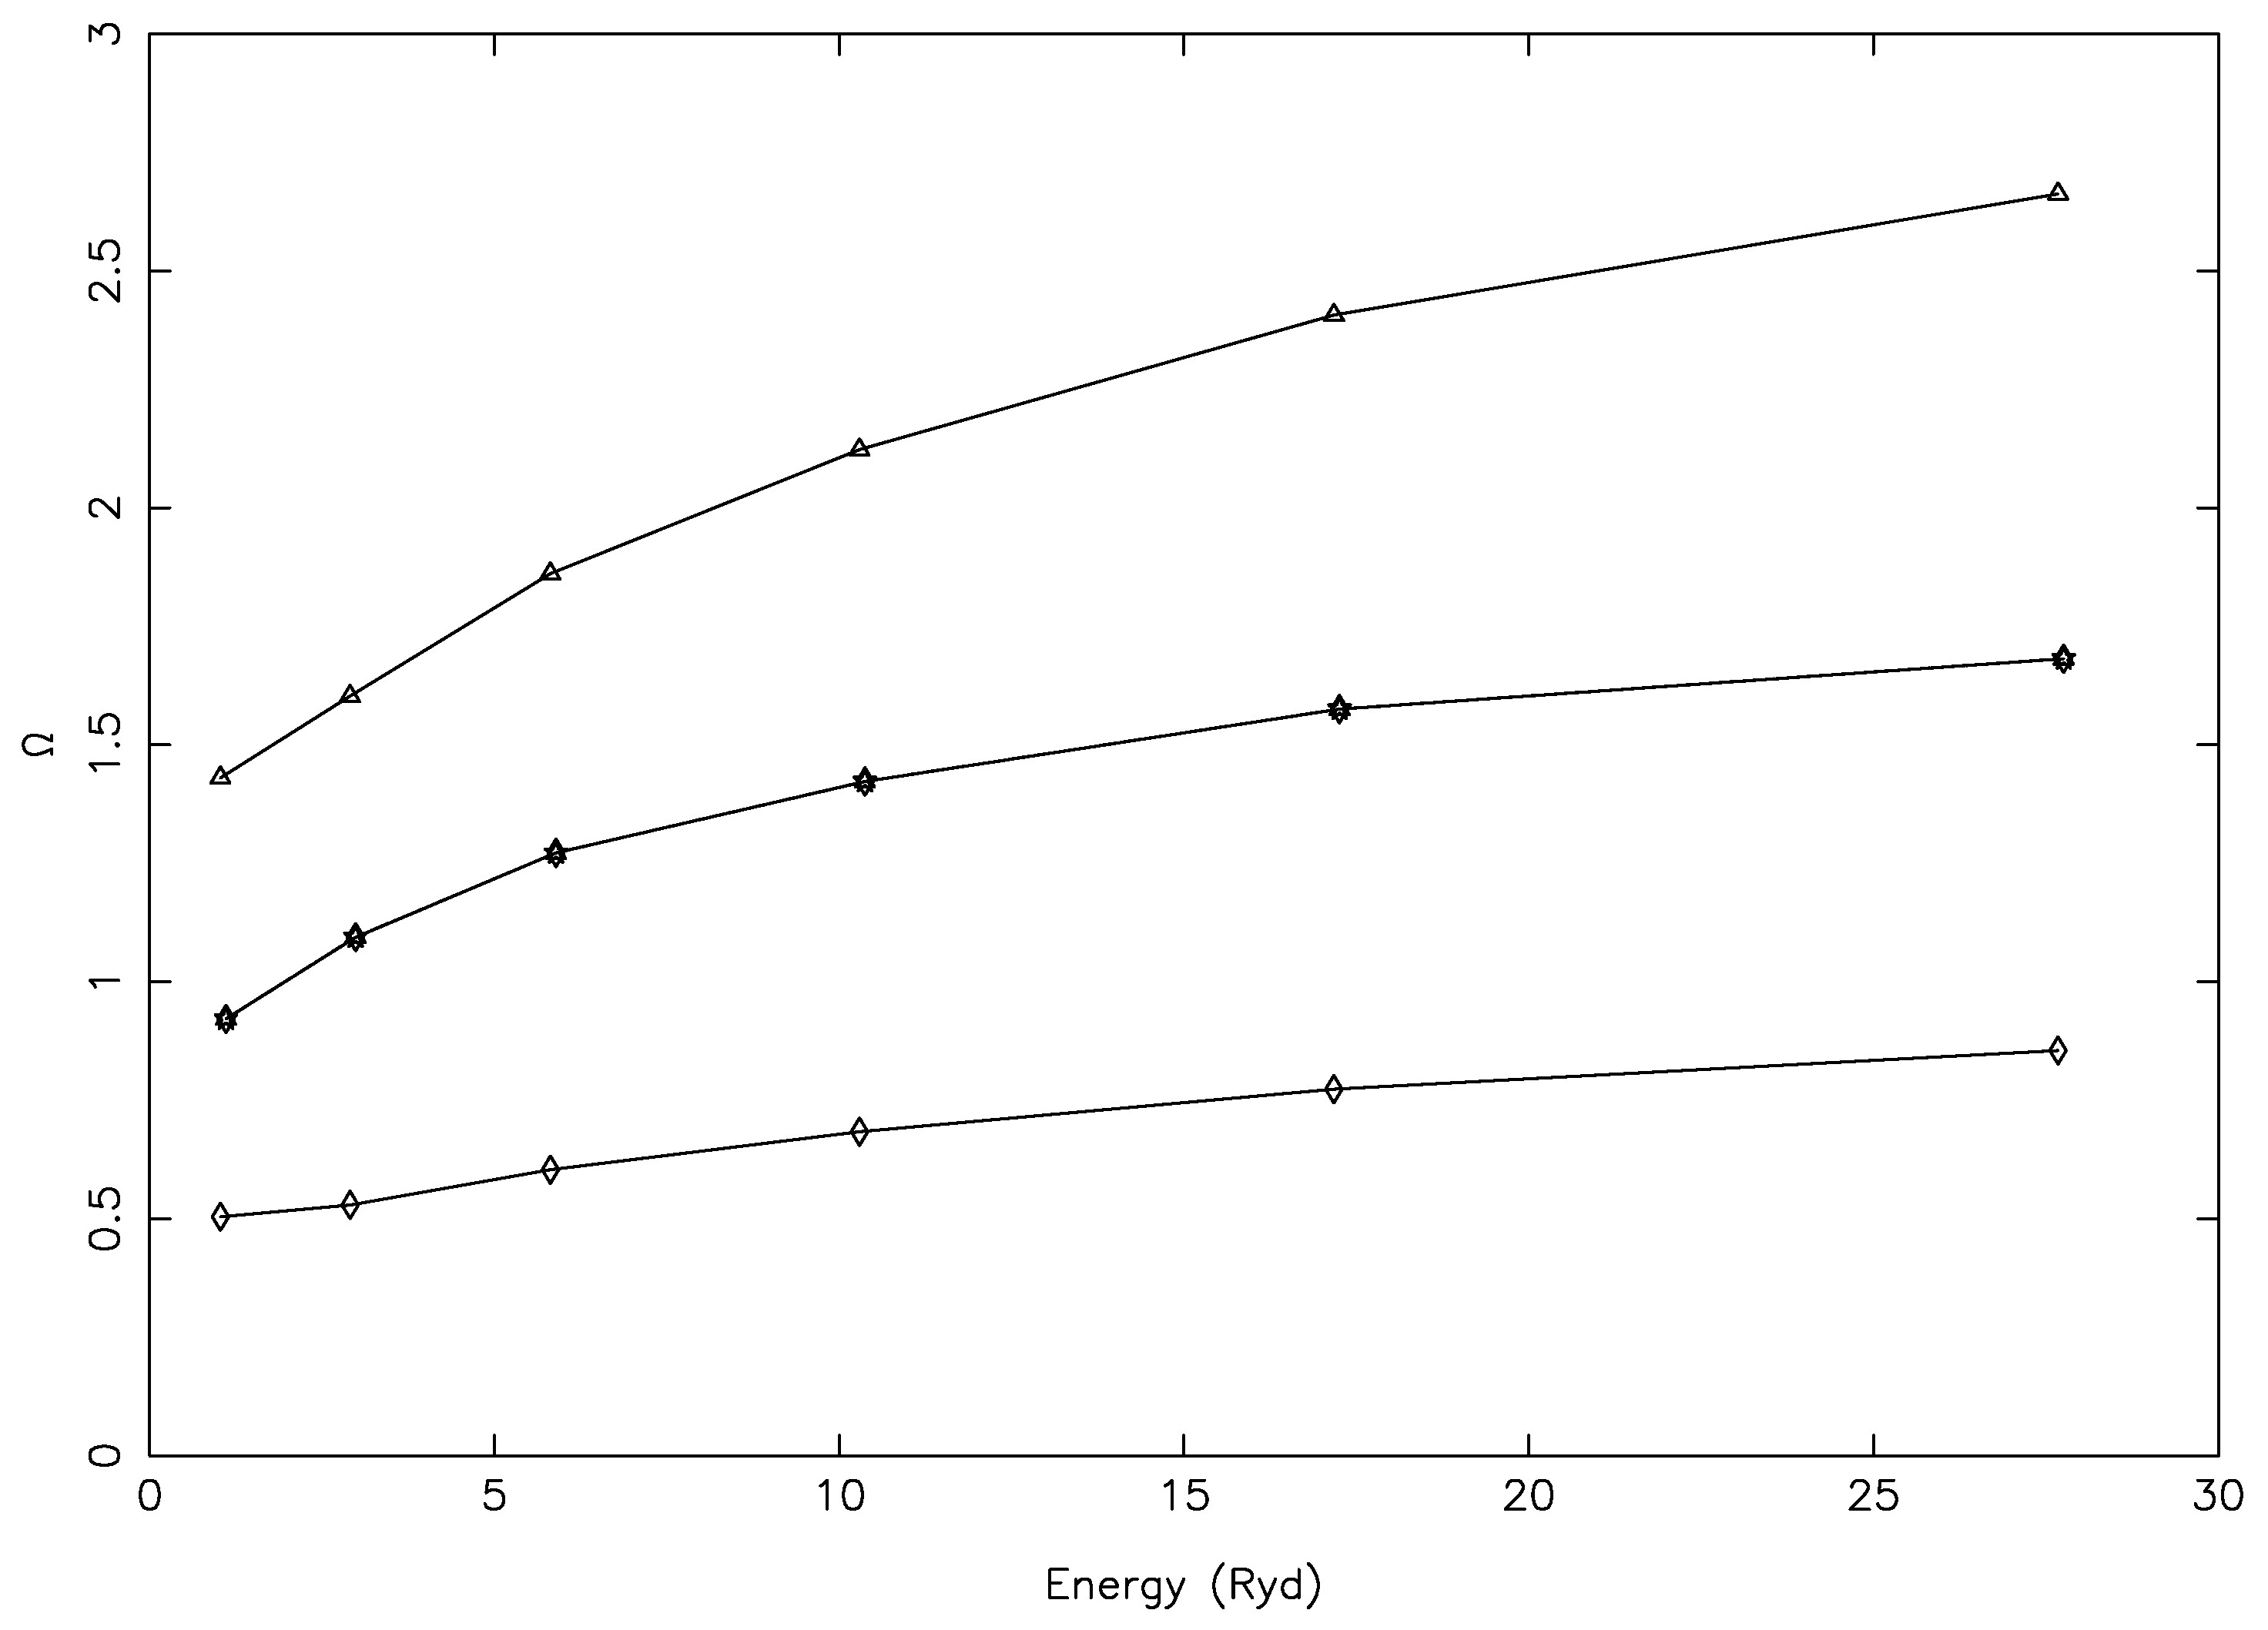
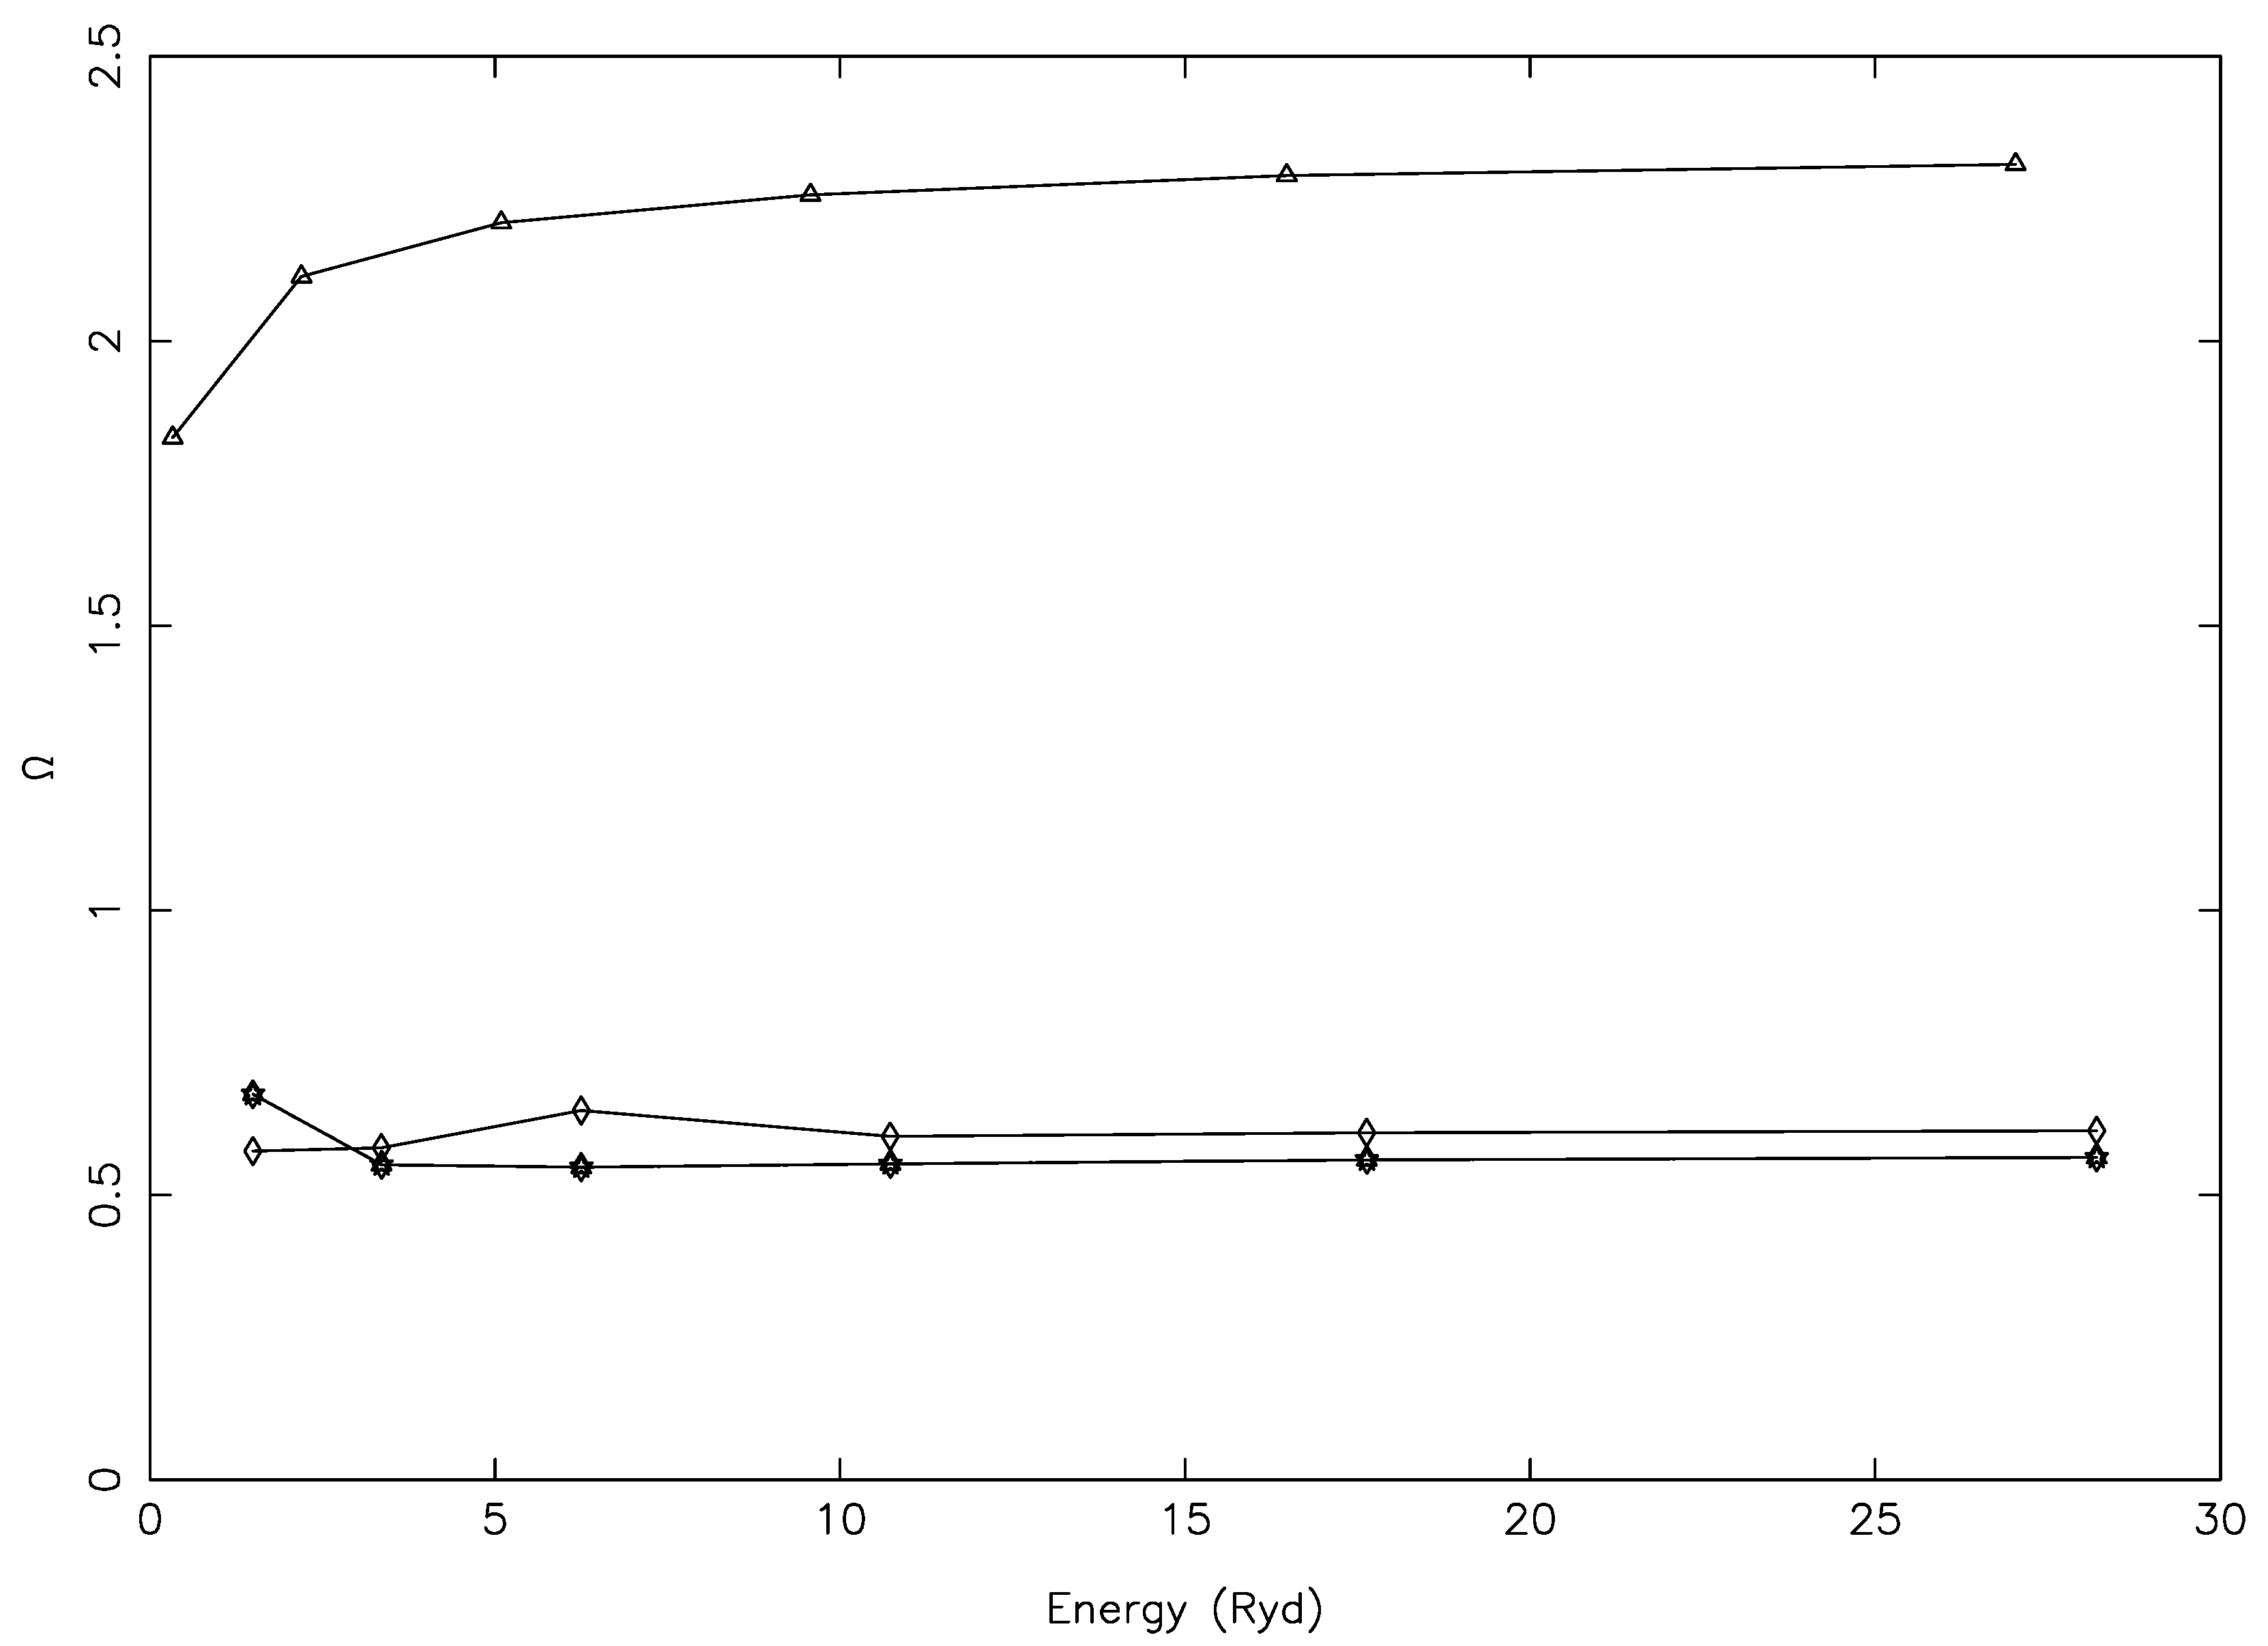
In
Figure 5 and
Figure 6, we consider three other transitions, namely 3–10 (3p
P
–3s3p
(
P)
P
), 3–11 (3p
P
–3s3p
(
P)
P
), and 4–13 (3p
D
–3p3d
D
), which also have comparable
E, as listed in
Table 1, but the f-values differed considerably between the MCHF and FAC calculations, as the transitions were
weak. For such transitions, resonances often contribute towards the determination of
, and this can clearly be noted by the humps seen in
Figure 6 in the results of Tayal et al. [
1]. It may also be noted that the BSR values of
for the 4–13 transition were larger than our results with FAC because the corresponding f-value was also larger, whereas for the other two transitions, the
values were similar, particularly towards the higher end of the temperature range, in spite of the large differences in the f-values.
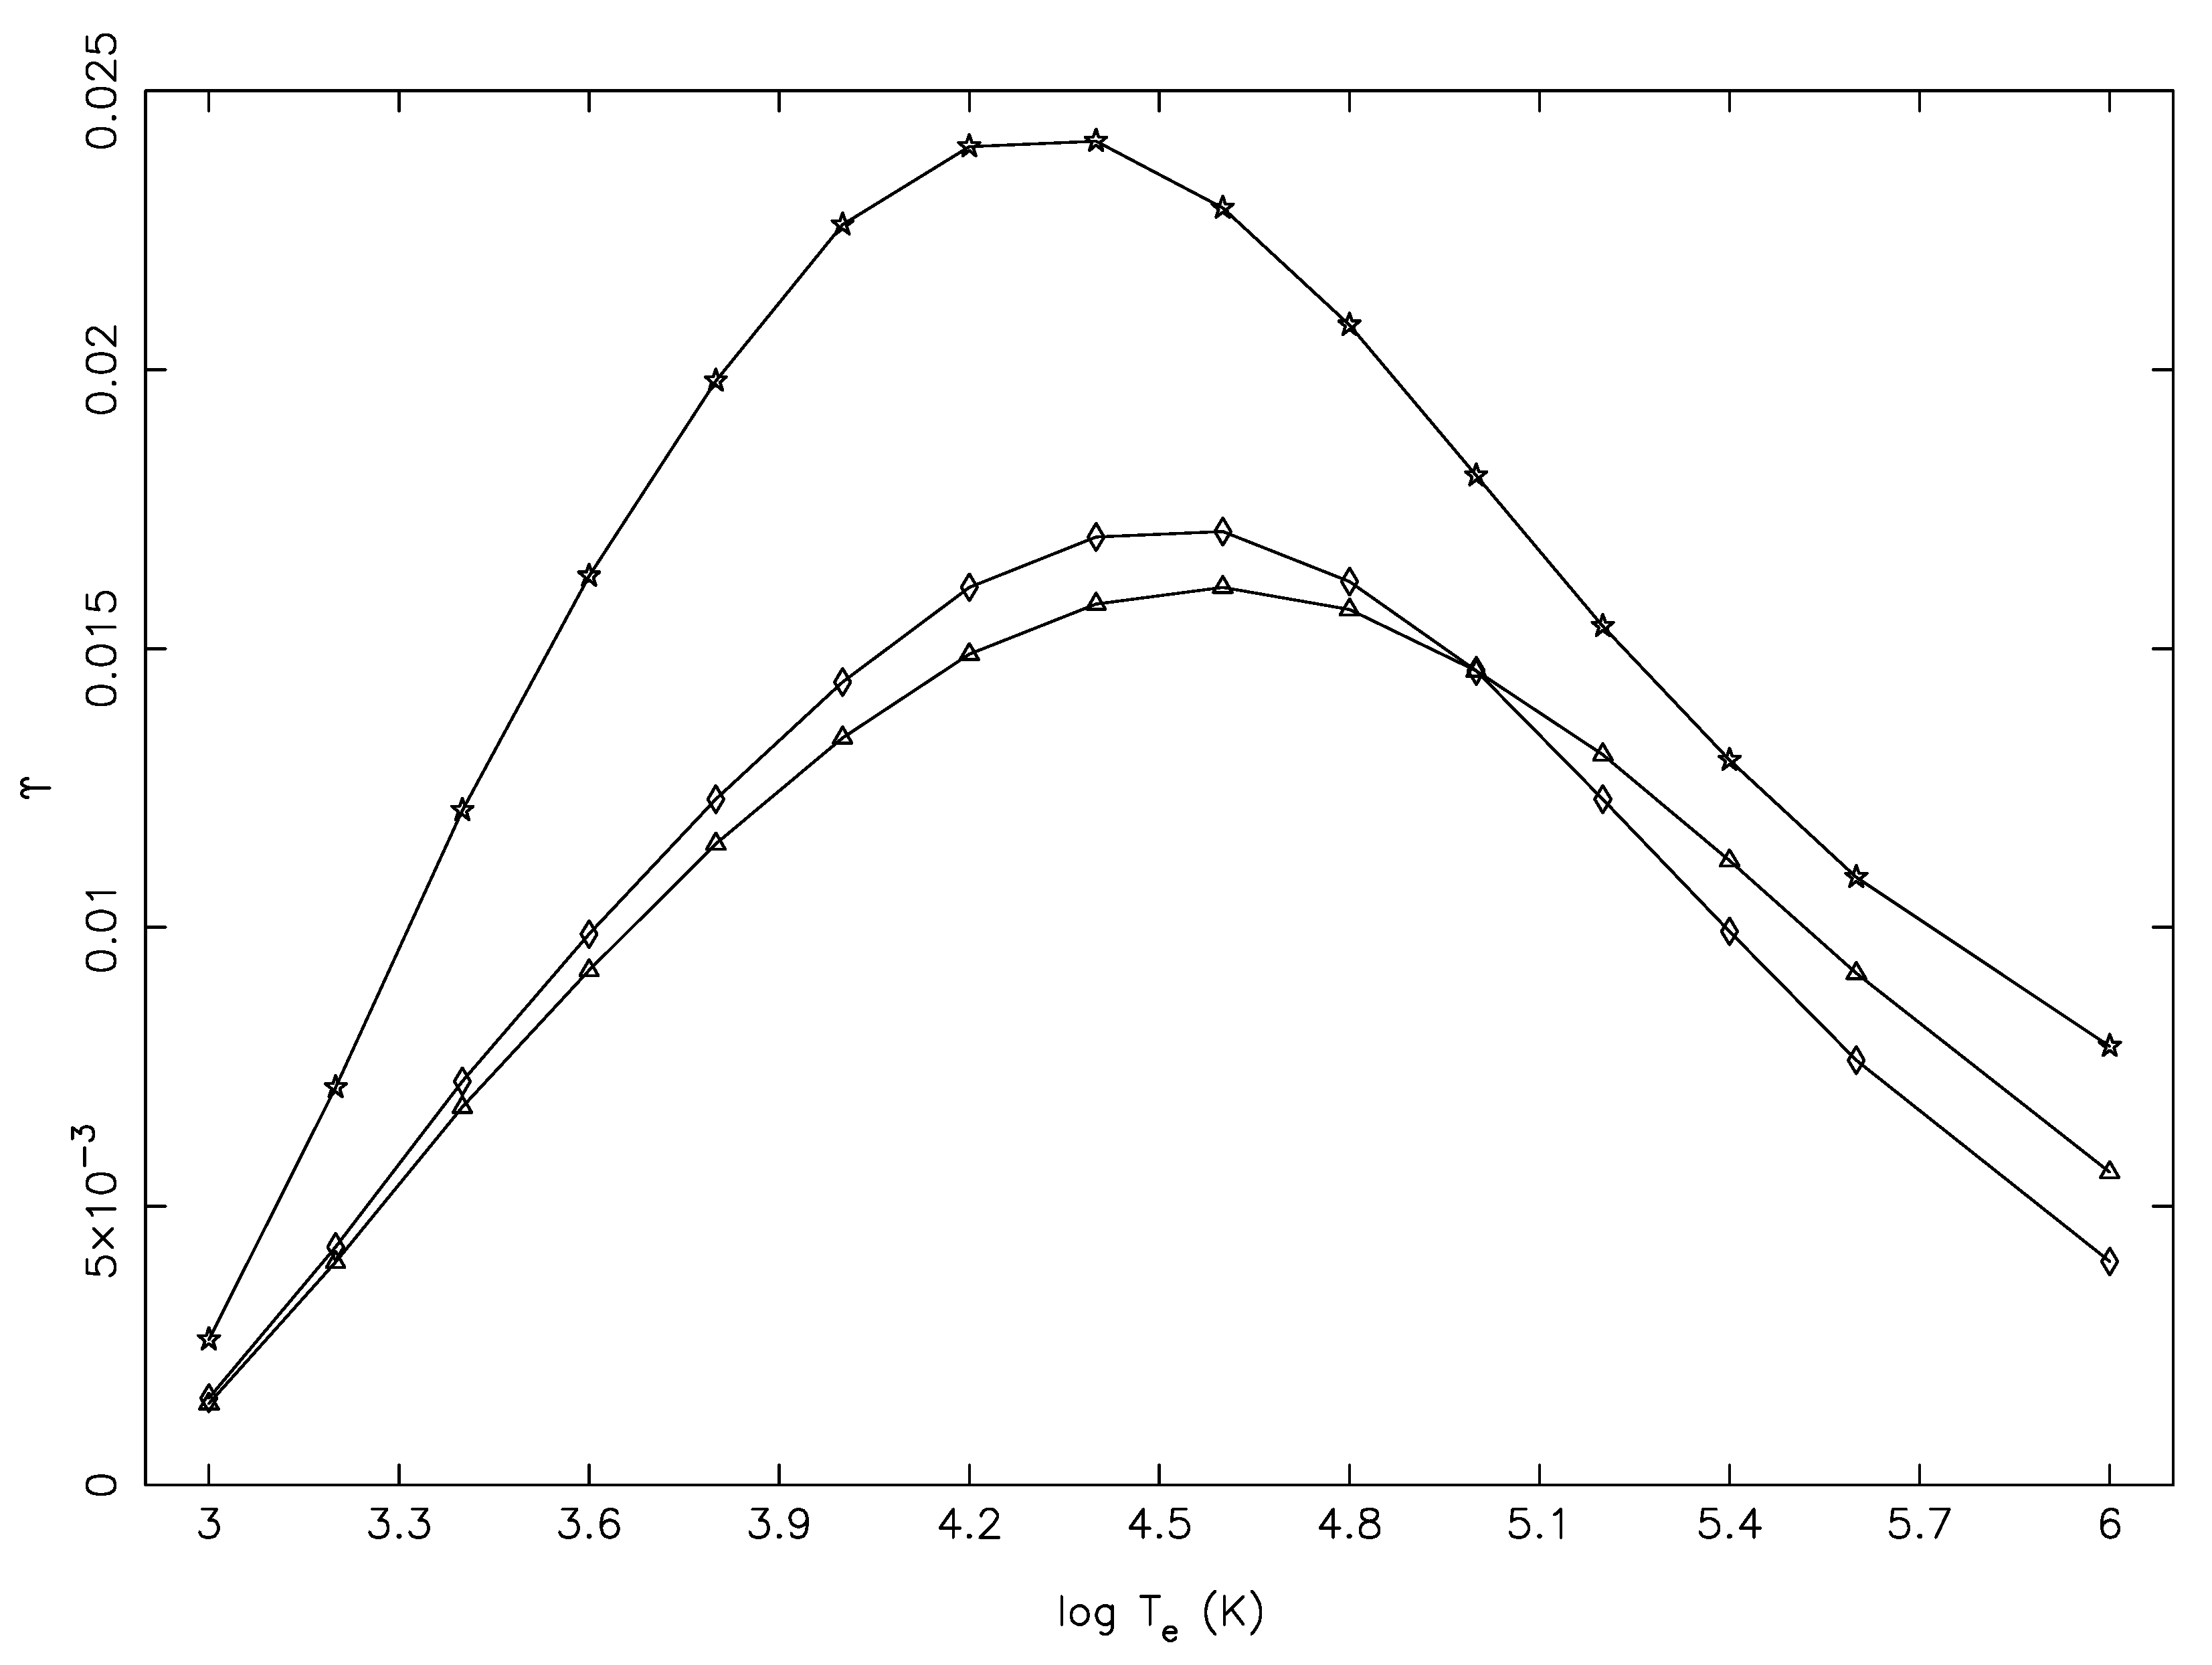
In
Figure 7, we show our results of
for three
forbidden transitions, namely 4–5 (3p
D
–3p
S
), 20–25 (3p3d
P
–3p3d
D
), and 20–27 (3p3d
P
–3p3d
D
), which have comparable magnitudes as the ones shown in
Figure 5. Particularly, for the 4–5 (type of) transition, the convergence of
with respect to
J was slow; see, for example, Figure 2 of Aggarwal and Keenan [
13] for a similar transition of Fe XIII. However, for this transition, the BSR values of
by Tayal et al. [
1] were considerably
lower than our results, and at all temperatures, as seen in
Figure 8. This was in spite of the inclusion of resonances in their calculations, and this indicated, yet again, that they included an insufficient number of partial waves in their work. Furthermore, note that 20–27 was a clear forbidden transition for which both
and
should decrease with increasing energy and T
, as was the case in our calculations, but not in the BSR results. However, such small anomalies may sometimes occur in a large calculation, but may not affect the modelling results.
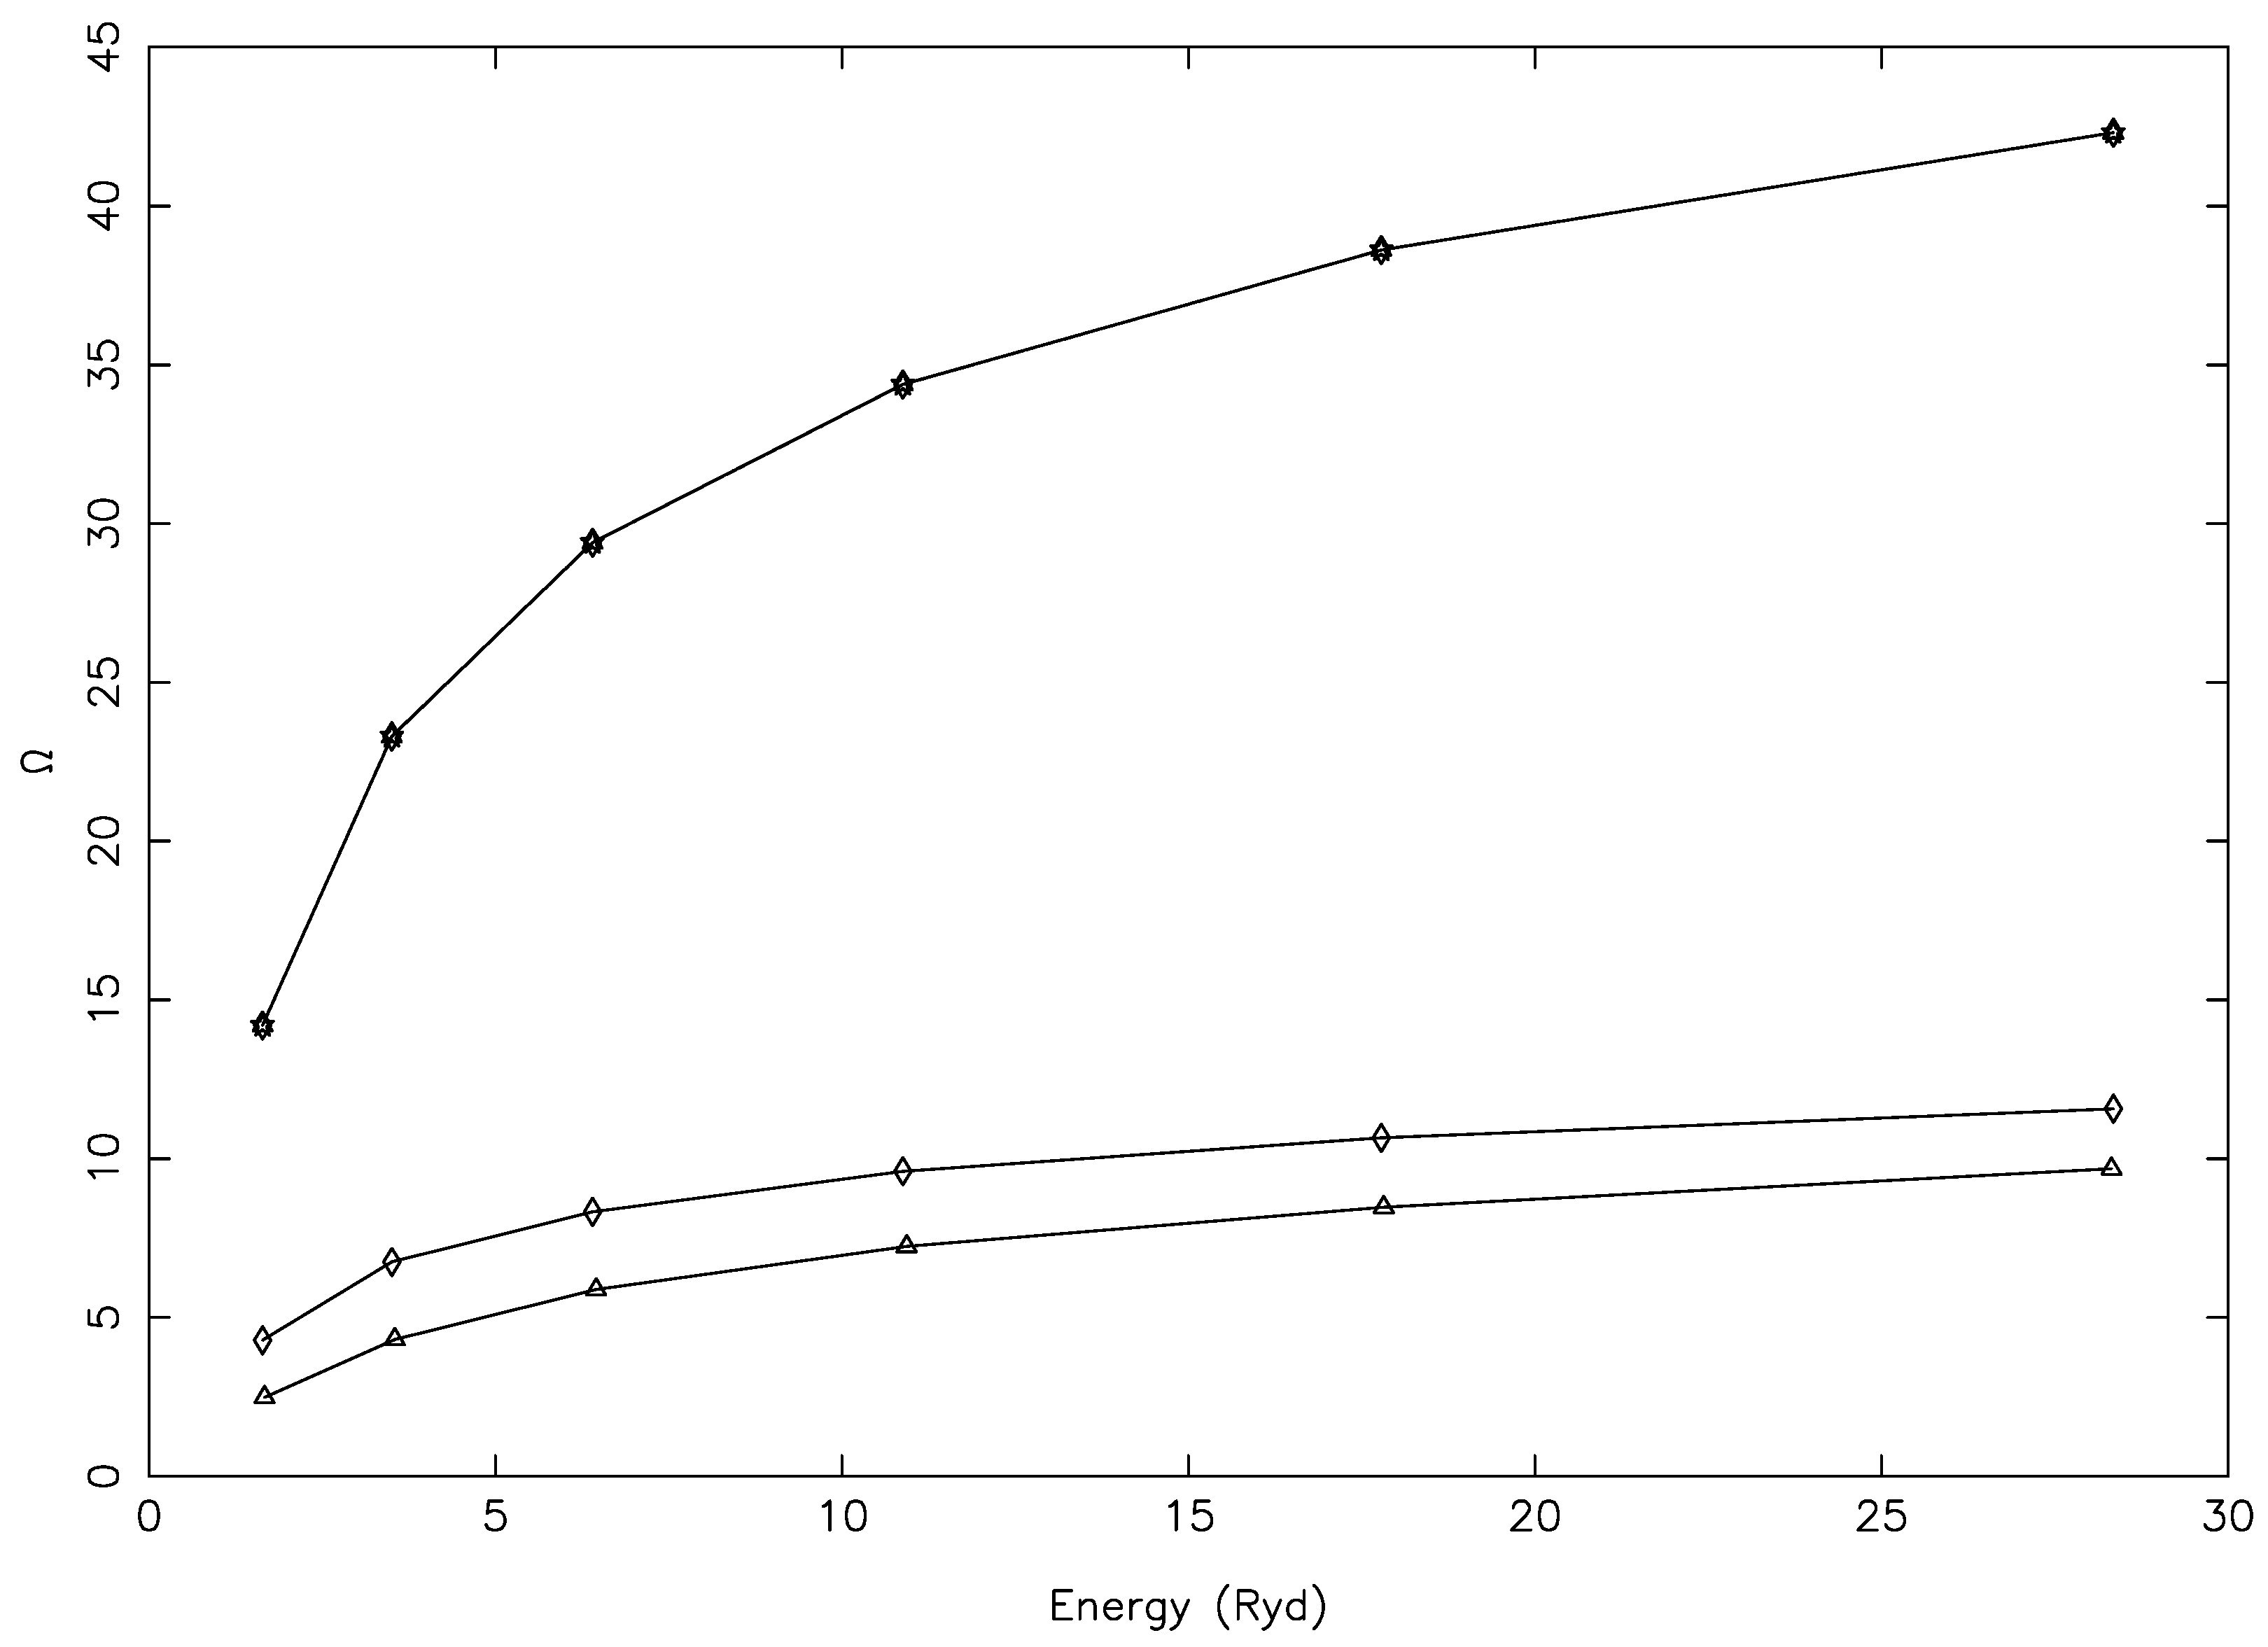
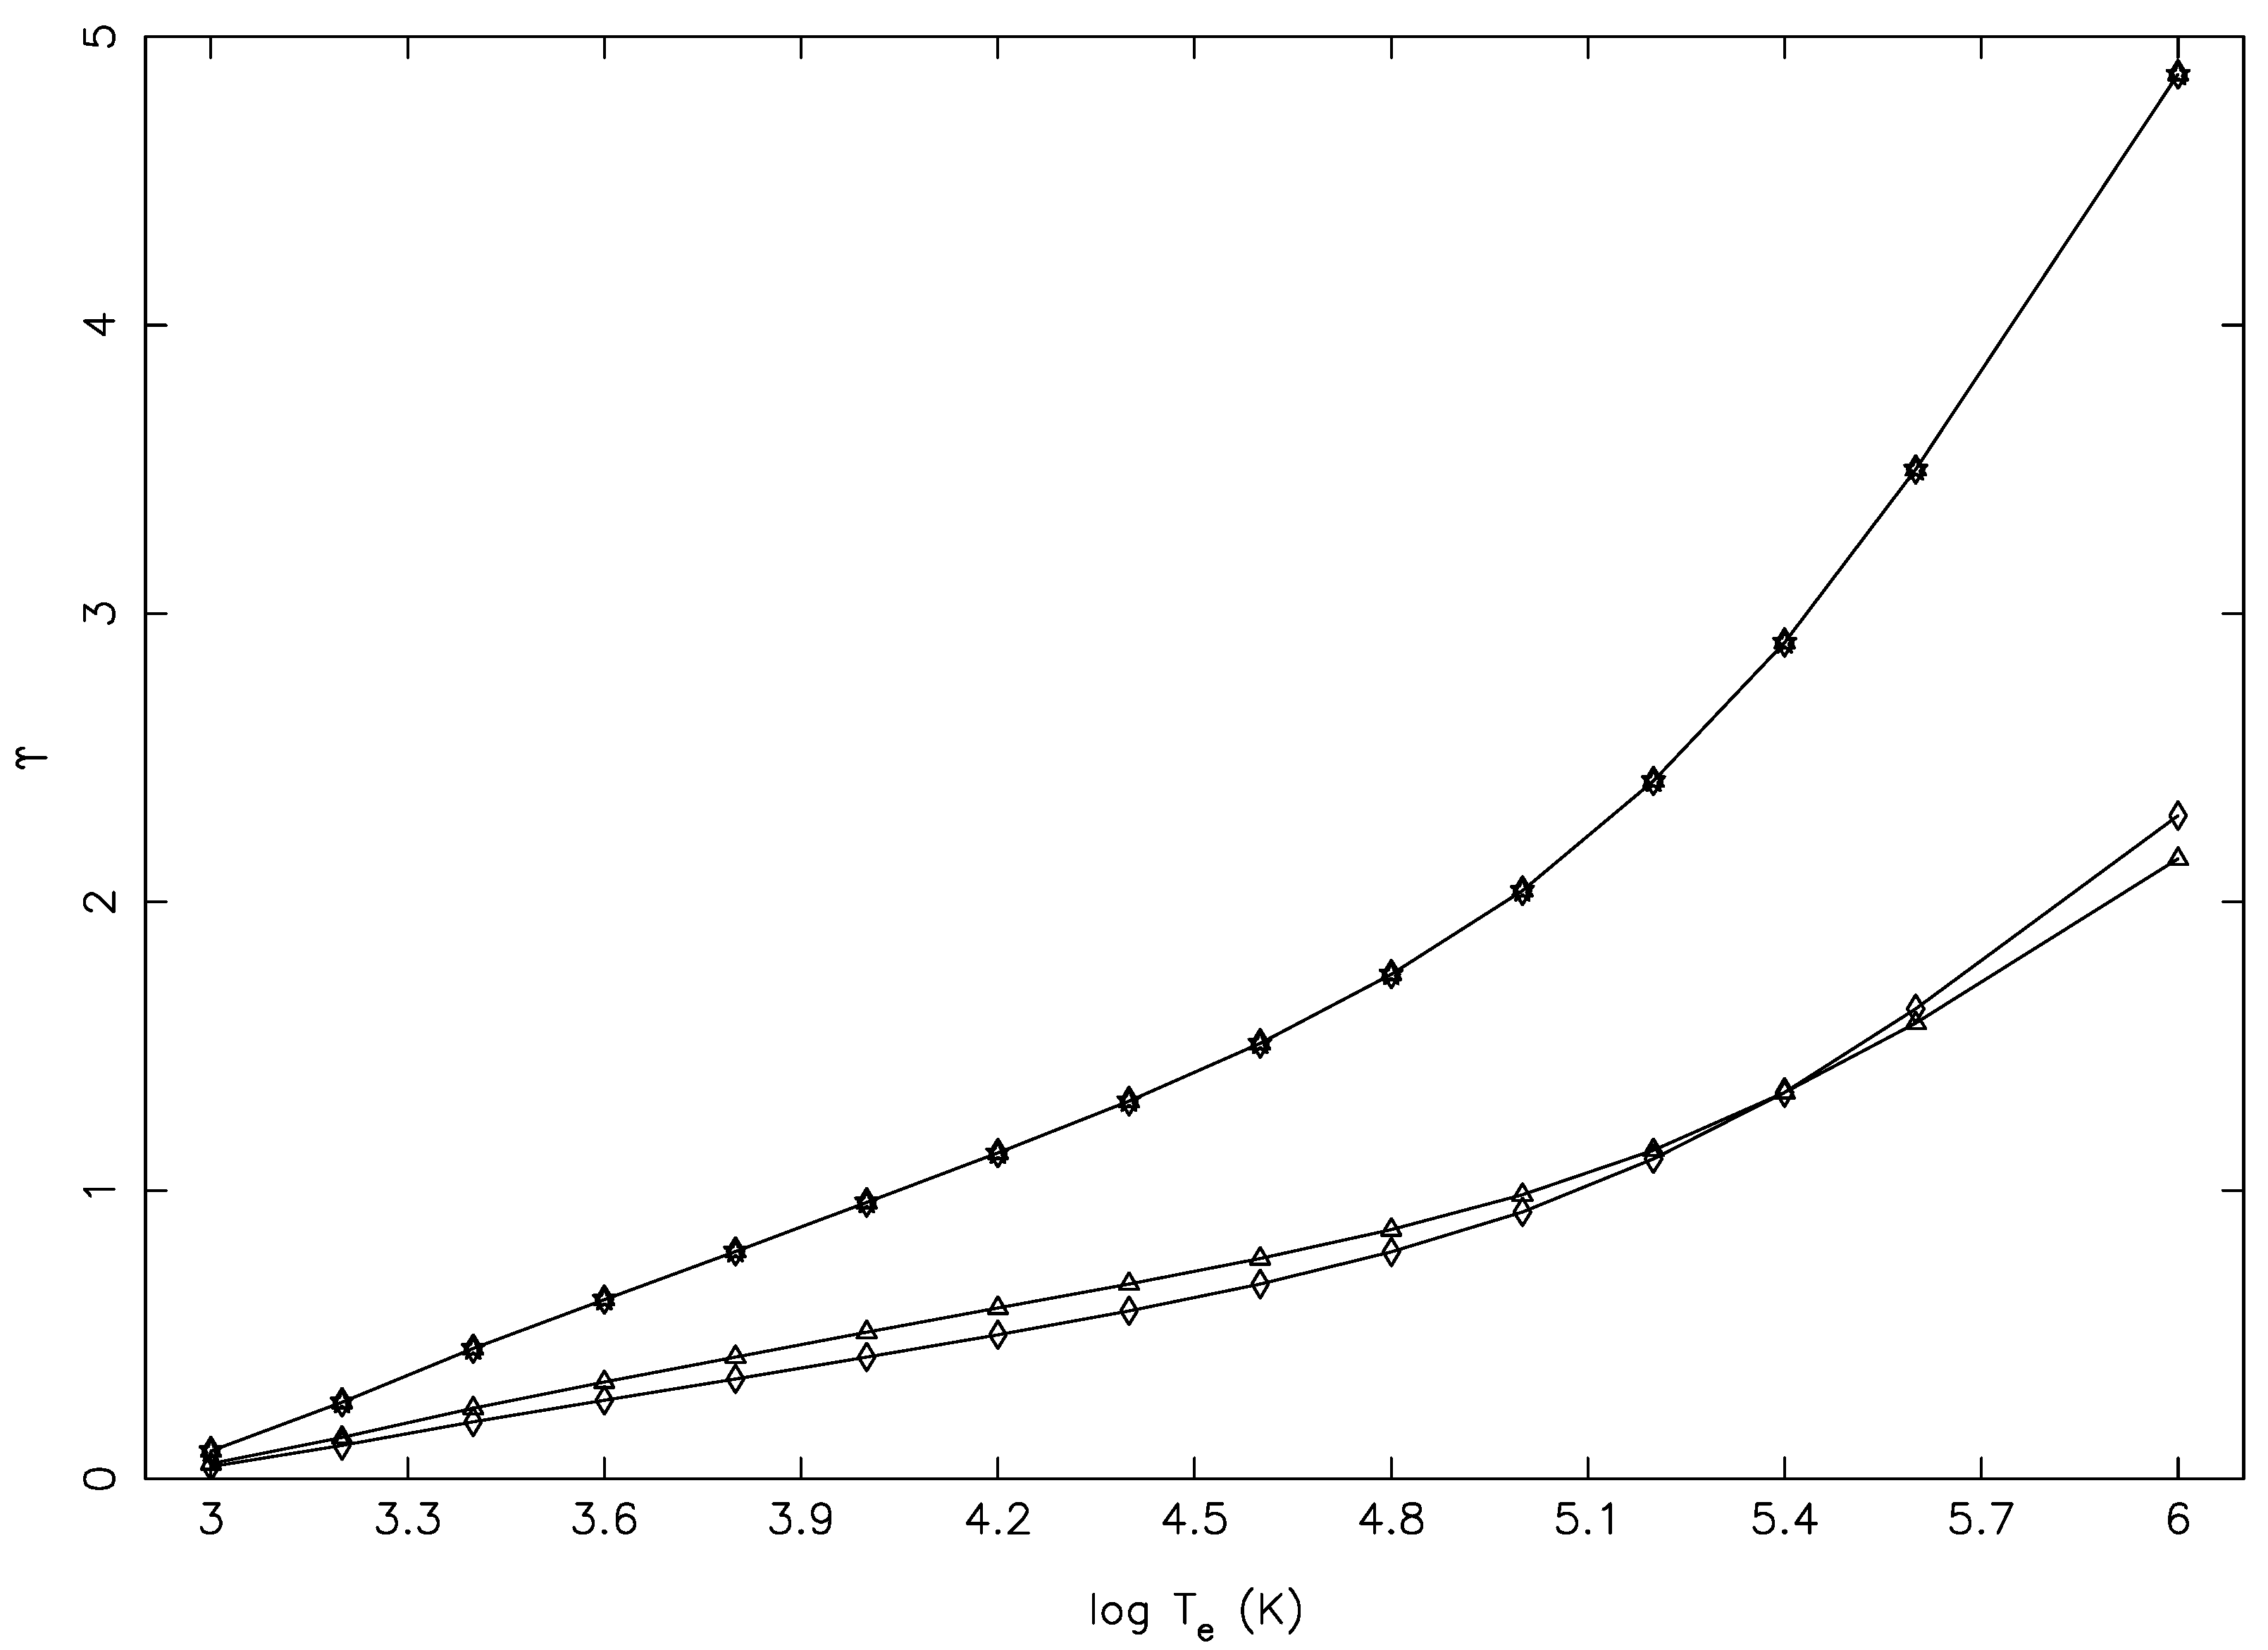
Finally, in
Figure 9 and
Figure 10, we show similar results of
and
, respectively, for three other transitions, which are allowed, have comparatively smaller f-values, do not differ as largely as for the transitions of
Figure 5 and
Figure 6, but have comparable
E (within 10%), as listed in
Table 1. Unfortunately, for these transitions also, the
values of Tayal et al. [
1] were underestimated at (almost) all temperatures, and this was in spite of their f-value being larger for the 20–33 transition by a factor of two! Therefore, it is clear from the comparisons of
shown for 18 representative transitions (including both allowed and forbidden types) that the reported results of Tayal et al. were underestimated, particularly for the (strong) allowed transitions.
Before we conclude, we would like to note that apart from the underestimation of
by Tayal et al. [
1] for several transitions of S III, the behaviour of this parameter was not correct for some transitions involving the higher levels. As an example, in
Figure 11, we show the variation of their
with T
for three transitions, which had comparatively small magnitudes, namely 1–198 (3p
P
–3s3p
(
P)3d
D
), 6–198 (3s3p
(
S)
S
–3s3p
(
P)3d
D
), and 24–198 (3s
3p4s
P
–3s3p
(
P)3d
D
). The first one was parity forbidden, whereas the other two were allowed transitions. For any (type of) transition involving the
highest level, there should be no resonances, or equivalently, the values of
and hence
should vary smoothly, decreasing or increasing, depending on the transition. However, as seen in this figure, there were clear “humps”, which indicated the presence of pseudo resonances. In a calculation with non-orthogonal orbitals, as performed by Tayal et al. there should be no pseudo resonances, and this was also
reaffirmed by them. This is the same problem as noted earlier (Aggarwal and Keenan [
9]) in their work on Mg V; see also Figure 7 of [
7]. However, in a later paper, Wang et al. [
14] argued that this behaviour happened due to a “coarse” energy mesh adopted at energies beyond thresholds, which was 0.2 Ryd in the present case; also note the contrast between 0.0001 Ryd in the threshold region and 0.2 Ryd above it. This coarse energy mesh was the cause of the incorrect behaviour seen in the figure. It needs to be finer. We would also like to note that such incorrect behaviours are not confined to the highest level alone, but to others as well; see, for example, the 12–195/196/197 transitions. Transitions among the higher lying levels may or may not affect the modelling or diagnostics of plasmas, but the incorrect behaviour of
for these certainly undermines the confidence in their calculations.
For some other transitions with larger magnitudes, we note a different kind of problem, shown in
Figure 12 for three, namely 14–198 (3s
3p3d
F
–3s3p
(
P)3d
D
), 19–198 (3s
3p3d
P
–3s3p
(
P)3d
D
), and 25–198 (3p3d
D
–3s3p
(
P)3d
D
), all of which were allowed. For these (and several more) transitions, the values of
were rising too steeply, i.e., by over a factor of 50 between 10
and 10
K, a short span of 6.3 Ryd. Such a steep rise in
values was (generally) neither noted nor expected, as may also be confirmed from
Figure 3 and
Figure 4, beside others. This was yet another indication of their
values not being converged, particularly at the lower end of the energy range. In fact, there were several transitions for which the values of
increased between the lowest and the highest T
by up to three orders of magnitude, and examples include 10–141 (3s3p
(
P)
P
–3p
P
), 11–137 (3s3p
(
P)
P
–3s3p
(
P)4p
D
), 18–137 (3s3p
(
S)
S
–3s3p
(
P)4p
D
), 159–198 (3s3p
(
D)4p
D
–3s3p
(
P)3d
D
), and 160–198 (3s3p
(
D)3d
D
–3s3p
(
P)3d
D
). Among these, only 10–141 was allowed, and the rest were forbidden; in particular, for the last two, there should be no resonances to contribute, and therefore, there was no convincing reason to see such a high rise in the values of
.
3. Conclusions
In this paper, we made an attempt to assess the recently-reported atomic data for S III by Tayal et al. [
1]. Their calculated energy levels and transition rates appear to be accurate, as claimed. However, their estimated accuracy of 20% for the collisional parameter (
), for most transitions, was unrealistic. They did not report results for
, but through our own calculations with FAC, we clearly demonstrated that their reported
results were underestimated, by up to a factor of two and (almost) at all temperatures, for many (strong) allowed transitions, as well as (at least a few) forbidden ones. This was mainly because their included range of partial waves with
23.5 was insufficient for the convergence of
, and in the threshold regions, they might have included even less fewer of these. Apart from this, the behaviour of their
results was not correct for transitions involving the higher levels, and this was because of the coarse energy mesh adopted at energies above the thresholds.
Adoption of accurate wavefunctions is a desirable criterion for the further calculations of collisional data, which are much more complicated, not only to generate, but also to assess for accuracy and reliability. Since there is often a paucity of corresponding experimental results, accuracy is determined mainly by comparisons with existing results, if available, or by performing other independent calculations by a different method/code, which may not always be possible. Nevertheless, often, large discrepancies are noted among different sets of data for an ion, as discussed, highlighted, and explained in one of our papers (Aggarwal [
7]). The assessment of data, particularly for
(an important parameter), becomes even more difficult if the corresponding data for
are not reported. Therefore, we
emphasise yet again that the producers of atomic data should also report results for
, at least for some transitions. They may alternatively put these data on an easily accessible website. These steps are very helpful for accuracy assessments and give an opportunity to other workers to make improvements, if possible.
In view of our assessments of the available data for
, we recommend that either fresh calculations be performed for S III or that the authors of [
1] should improve their results by not only enlarging the range of partial waves, but by also making their energy mesh finer at energies above the thresholds. Alternatively, they can convincingly demonstrate that their reported results are still accurate and reliable, and our assessment is not satisfactory. Till this is done, our recommendation to the users of the data is that they should adopt both calculations, i.e., the one by Tayal et al. [
1] and ours, which can either be easily generated or can be obtained from the author upon request, who should then make their own assessment and judgement. In our view, the available results of Tayal et al. were (heavily) underestimated for the allowed transitions, whereas ours for the forbidden ones, because of the omission of resonances. Unfortunately, the two sets of data can also not be (easily) combined, because the level orderings are incompatible.
Our results obtained with FAC have considerable scope for improvements, mainly in two areas. Firstly, our wavefunctions were simple and included only those orbitals and configurations that were also adopted for further calculations of scattering parameters. The inclusion of additional orbitals improved the accuracy of energy levels and A-values, as was shown by Tayal et al. [
1]. However, this should not affect the subsequent values of
and
by more than 20%, for most transitions. The other one is the inclusion of resonances, which were omitted in our work. Their contribution is difficult to assess without performing actual calculations, because some forbidden transitions
and at low temperatures may get affected by over an order of magnitude, as may be noted in Table 6 of our work [
15] for three transitions of Ne V.
