Communication

X-ray Spectroscopy Based Diagnostic of GigaGauss Magnetic Fields during Relativistic Laser-Plasma Interactions

1
LULI—Sorbonne Université-Campus Pierre et Marie Curie, CNRS, Ecole Polytechnique, CEA: Université Paris-Saclay, CEDEX 05, F-75252 Paris, France
2
206 Allison Lab, Physics Department, Auburn University, Auburn, AL 36849, USA
*
Author to whom correspondence should be addressed.
Atoms 2018, 6(4), 60; https://doi.org/10.3390/atoms6040060
Submission received: 20 September 2018 / Revised: 31 October 2018 / Accepted: 1 November 2018 / Published: 6 November 2018
(This article belongs to the Special Issue Stark Broadening of Spectral Lines in Plasmas)

Abstract

:
GigaGauss (GG), and even multi-GG magnetic fields are expected to be developed during relativistic laser-plasma interactions. Sub-GG magnetic fields were previously measured by a method using the self-generated harmonics of the laser frequency, and the fact that the magnetized plasma is birefringent and/or optically active depending on the propagation direction of the electromagnetic wave. In the present short communication, we outline an idea for a method of measuring GG magnetic fields based on the phenomenon of Langmuir-wave-caused dips (L-dips) in X-ray line profiles. The L-dips were observed in several experimental spectroscopic studies of relativistic laser-plasma interactions. Ultrastrong magnetic fields affect the separation of the L-dips from one another, so that this relative shift can be used to measure such fields.

GigaGauss (GG), and even multi-GG magnetic fields are expected to be developed during relativistic laser-plasma interactions. These fields should be localized at the surface of the relativistic critical density—see, e.g., review [1] and references therein. In particular, according to Equation (11) from paper [2], the maximum magnetic field Bmax is related to the laser intensity I as follows:
Bmax (G) = 10−1[I(W/cm2)]1/2.
So, at the laser intensities I ~ 1021 W/cm2 achieved in recent experiments (see paper [3]), the magnetic fields can be as high as Bmax ~ 3 GG.
On the experimental side, in paper [4] magnetic fields B ~ 0.7 GG were measured by using the polarization measurements (the Cotton-Mouton effect of an induced ellipticity) of high-order VUV laser harmonics generated at the incident irradiation intensity I = 9 × 10¹⁹ W/cm2. In an earlier experiment [5,6], magnetic fields up to B ~ 0.4 GG were measured at the incident irradiation intensity up to I = 9 × 10¹⁹ W/cm2, by a method also using the self-generated harmonics of the laser frequency and the fact that the magnetized plasma is birefringent (the Cotton-Mouton effect) and/or optically active (the Faraday effect of the rotation of the polarization vector) depending on the propagation direction of the electromagnetic wave.
In the present short communication, we propose a method for measuring GG magnetic fields based on the phenomenon of Langmuir-wave-cased dips (L-dips) in X-ray line profiles. The L-dips were observed in several experimental spectroscopic studies of relativistic laser-plasma interactions—see, e.g., papers [3,7] and review [8].
According to the theory (presented, e.g., in books [9,10]), L-dips originate from a dynamic resonance between the Stark splitting
ωstark(F) = 3nħF/(2Zrmee)
of hydrogenic energy levels, caused by a quasistatic part of the electric field F in a plasma, and the frequency ωL of the Langmuir wave, which practically coincides with the plasma electron frequency ωpe = (4πe2Ne/me)1/2:
ωstark(F) = pe (Ne), s = 1, 2, …
Here n and Zr are the principal quantum number and the nuclear charge of the radiating hydrogenic atom/ion (radiator), s is the number of quanta (Langmuir plasmons) involved in the resonance. Despite the applied electric field being quasimonochromatic, there occurs a nonlinear dynamic resonance of a multifrequency nature, as explained in detail in paper [11].
From the resonance condition (3), one determines the specific locations of L-dips in spectral line profiles, which depend on Ne, since ωpe depends on Ne. Generally, there could be two sets of L-dips in the spectral line profile at distances Δωdip from the unperturbed frequency ω0 of the spectral line. One set, located at
Δωdip(α) = (qαqβnβ/nα)pe
results from the resonance with the splitting of the upper sublevel α (of the principal quantum number nα) involved in the radiative transition. Another set located at
Δωdip(β) = (qαnα/nβqβ)pe
results from the resonance with the splitting of the lower sublevel β (of the principal quantum number nβ) involved in the radiative transition. Here q = n1n2 is the electric quantum number expressed via the parabolic quantum numbers n1 and n2: q = 0, ±1, ±2, …, ±(n − 1). The electric quantum numbers mark Stark components of hydrogenic spectral lines. It should be emphasized that for the Ly-lines, there is no second set of the L-dips at Δωdip(β) because there is no linear Stark splitting of the state of n = 1. Below for brevity we omit the subscript “pe” and use ω instead of ωpe.
In paper [12], for the specific case of the one-quantum resonance (s = 1) in hydrogen atoms (Zr = 1), Gavrilenko generalized Equations (4) and (5) for the situation where there is also a magnetic field B in plasmas. His corresponding formulas are as follows:
Δωdip(α) = ω{(n’ + n”)α − [(n’+n”)β/nα][(nα2nβ2)b02 + nβ2]1/2},
Δωdip(β) = ω{[(n’ + n”)α/nβ][ nα2 − (nα2nβ2)b02]1/2 − (n’ + n”)β}.
Here the quantum numbers n’ and n” correspond to the basis of the wave functions diagonalizing the Hamiltonian of a hydrogen atom in a non-collinear static electric (F) and magnetic (B) fields (see, e.g., paper [13]):
n’, n” = −j, −j +1, …, j; j = (n − 1)/2.
The quantity b0 in Equations (6) and (7) is the scaled, dimensionless magnetic field
b0 = μ0B/(ħω),
where μ0 is the Bohr magneton.
We further slightly generalize Gavrilenko’s formulas by allowing for any number of quanta s involved in the resonance and for any nuclear charge Zr of hydrogenic atoms/ions:
Δωdip(α) = {(n’ + n”)α − [(n’ + n”)β/nα][(nα2nβ2)b2 + nβ2]1/2},
Δωdip(β) = {[(n’ + n”)α/nβ][ nα2 − (nα2nβ2)b2]1/2 − (n’ + n”)β},
where the scaled dimensionless magnetic field b now reads:
b = μ0B/(sħω) = (1/s)[B(GG)/0.201][ω(s–1)/(1.77 × 1015)]−1
For example, for the one-quantum resonance (s = 1), for the frequency ω = 1.77 × 10¹⁵ s−1, which is the frequency of the laser used, e.g., in experiments [3,7], the quantity b reaches unity at B = 0.201 GG. We note that the nuclear charge Zr does not enter Equations (10) and (11), but obviously does affect the unperturbed frequency of the spectral line.
The idea of a new method for measuring the magnetic fields is as follows. It is possible to select such a pair of the L-dip at Δωdip(α) and the L-dip at Δωdip(β), both corresponding to the same combination of the sums (n’ + n”)α and (n’ + n”)β, such that the location of one of the two L-dips is unaffected by the magnetic field while the location of the other of the two L-dips is shifted by the magnetic field. Then from the relative separation of the two L-dips it is possible to determine the magnetic field.
Namely, we are talking about the following pairs of the L-dips. One pair corresponds to
(n’ + n”)α = 0, (n’ + n”)β = −1,
while another pair corresponds to
(n’ + n”)α = 1, (n’ + n”)β = 0.
The ratio
Δωdip(α)ωdip(β) = (1/nα)[(nα2nβ2)b2 + nβ2]1/2
in the first case and the ratio
Δωdip(β)ωdip(α) = (1/nβ)[nα2 − (nα2nβ2)b2]1/2
in the second case are simple functions of the magnetic field, as it is seen from the above formulas.
Figure 1 shows the ratio Δωdip(α)ωdip(β) in the pair of the L-dips corresponding to (n’ + n”)α = 0, (n’ + n”)β = −1, versus the scaled dimensionless magnetic field b for the Balmer-alpha line (solid curve) and for the Balmer-beta line (dashed curve).
It is seen that in the range of b presented in Figure 1, the magnetic field significantly affects the relative positions of the L-dips, so that by measuring the latter it is possible to determine the magnetic field. For the laser frequency ω = 1.77 × 10¹⁵ s−1used, e.g., in experiments [3,7], the range of b ~ (1–10) corresponds to the range of the magnetic field B ~ (0.2–2) GG for the one-quantum resonance and to B ~ (0.4–4) GG for the two-quantum resonance. For b >> 10, the possible L-dips at Δωdip(α) would be shifted too far into the wings of the spectral lines, so that most probably they could not be observed.
For completeness we note that if one would use the pair of the L-dips in the profiles of Stark components characterized by the quantum numbers from Equation (14), then according to Equation (16) the range of b would be limited to bmax = nα2/(nα2nβ2). This is because at bmax = nα2/(nα2nβ2), the possible L-dips at Δωdip(β)) would disappear.
Here is a practical example based on measuring the relative shift of the L-dips in the profiles of the Balmer lines of Cu XXIX. (We note that it is technologically simple to make and use thin Cu foils to irradiate them by a powerful laser). The wavelengths of the Balmer-alpha and Balmer-beta lines of Cu XXIX are 0.77 nm and 0.57 nm, respectively. This is practically the same range of the wavelength as it was employed, e.g., in experiments [3,7] while studying the L-dips in the profiles of the Ly-beta line of Si XIV and Al XIII. Therefore, the same kind of spectrometers can be used without any major additional tuning for experimental studies of possible L-dips in the profile of the Balmer-alpha and Balmer-beta lines of Cu XXIX, and thus for the experimental determination of GG (or sub-GG) magnetic fields.
In summary, ultrastrong magnetic fields affect the separation of the L-dips from one another, so that this relative shift can be used to measure sub-GG and GG magnetic fields. Earlier there was proposed another diagnostic of magnetic fields in plasmas based on the polarization measurements of X-ray spectral line profiles [14]. However, the method proposed in the present research note is easier to implement experimentally: it does not require performing the polarization measurements in the X-ray range, which would be relatively difficult to implement.

Author Contributions

Both authors contributed equally.

Funding

This work has been done within the LABEX Plas@par project. It received a state financial support by the Agence Nationale de la Recherche, as a part of the program “Investissements d’avenir” under the reference ANR-11-IDEX-0004-02.

Conflicts of Interest

The authors declare no conflict of interest.

References

  1. Belyaev, V.S.; Krainov, V.P.; Lisitsa, V.S.; Matafonov, A.P. Generation of fast charged particles and superstrong magnetic fields in the interaction of ultrashort high-intensity laser pulses with solid targets. Physics-Uspekhi 2008, 51, 793. [Google Scholar] [CrossRef]
  2. Belyaev, V.S.; Matafonov, A.P. Fast Charged Particles and Super-Strong Magnetic Fields Generated by Intense Laser Target Interaction. In Femtosecond-Scale Optics; Andreev, A., Ed.; InTech: Shanghai, China, 2011. [Google Scholar] [Green Version]
  3. Oks, E.; Dalimier, E.; Faenov, A.Y.; Angelo, P.; Pikuz, S.A.; Tubman, E.; Butler, N.M.H.; Dance, R.J.; Pikuz, T.A.; Skobelev, I.Y.; et al. Using X-ray spectroscopy of relativistic laser plasma interaction to reveal parametric decay instabilities: a modeling tool for astrophysics. Opt. Express 2017, 25, 1958–1972. [Google Scholar] [CrossRef] [PubMed]
  4. Wagner, U.; Tatarakis, M.; Gopal, A.; Beg, F.N.; Clark, E.L.; Dangor, A.E.; Evans, R.G.; Haines, M.G.; Mangles, S.P.D.; Norreys, P.A.; et al. Laboratory measurements of 0.7 GG magnetic fields generated during high-intensity laser interactions with dense plasmas. Phys. Rev. E 2004, 70, 026401. [Google Scholar] [CrossRef] [PubMed]
  5. Tatarakis, M.; Gopal, A.; Watts, I.; Beg, F.N.; Dangor, A.E.; Krushelnick, K. Measurements of ultrastrong magnetic fields during relativistic laser–plasma interactions. Phys. Plasmas 2002, 9, 2244. [Google Scholar] [CrossRef]
  6. Tatarakis, M.; Watts, I.; Beg, F.N.; Clark, E.L.; Dangor, A.E.; Gopal, A.; Haines, M.G.; Norreys, P.A.; Wagner, U.; Wei, M.-S.; et al. Measuring huge magnetic fields. Nature 2002, 415, 280. [Google Scholar] [CrossRef] [PubMed]
  7. Oks, E.; Dalimier, E.; Faenov, A.Y.; Angelo, P.; Pikuz, S.A.; Pikuz, T.A.; Skobelev, I.Y.; Ryazanzev, S.N.; Durey, P.; Doehl, L.; et al. In-depth study of intra-Stark spectroscopy in the X-ray range in relativistic laser–plasma interactions. J. Phys. B At. Mol. Opt. Phys. 2017, 50, 245006. [Google Scholar] [CrossRef]
  8. Dalimier, E.; Pikuz, T.; Angelo, P. Mini-Review of Intra-Stark X-ray Spectroscopy of Relativistic Laser–Plasma Interactions. Atoms 2018, 6, 45. [Google Scholar] [CrossRef]
  9. Oks, E. Plasma Spectroscopy: The Influence of Microwave and Laser Fields; Springer Series on Atoms and Plasmas; Springer: New York, NY, USA, 1995; Volume 9. [Google Scholar]
  10. Oks, E. Diagnostics of Laboratory and Astrophysical Plasmas Using Spectral Lines of One-, Two-, and Three-Electron Systems; World Scientific: Hackensack, NJ, USA, 2017. [Google Scholar]
  11. Gavrilenko, V.P.; Oks, E. New effect in Stark spectroscopy of atomic hydrogen: dynamic resonance. Sov. Phys. JETP 1981, 53, 1122. [Google Scholar]
  12. Gavrilenko, V. Resonance effects in the spectroscopy of atomic hydrogen in a plasma with a quasimonochromatic electric field and located in a strong magnetic field. Sov. Phys. JETP 1988, 67, 915. [Google Scholar]
  13. Demkov, Y.; Monozon, B.; Ostrovsky, V. Energy levels of a hydrogen atom in crossed electric and magnetic fields. Sov. Phys. JETP 1970, 30, 775–776. [Google Scholar]
  14. Demura, A.V.; Oks, E. New method for polarization measurements of magnetic fields in dense plasmas. IEEE Trans. Plasma Sci. 1998, 26, 1251–1258. [Google Scholar] [CrossRef]
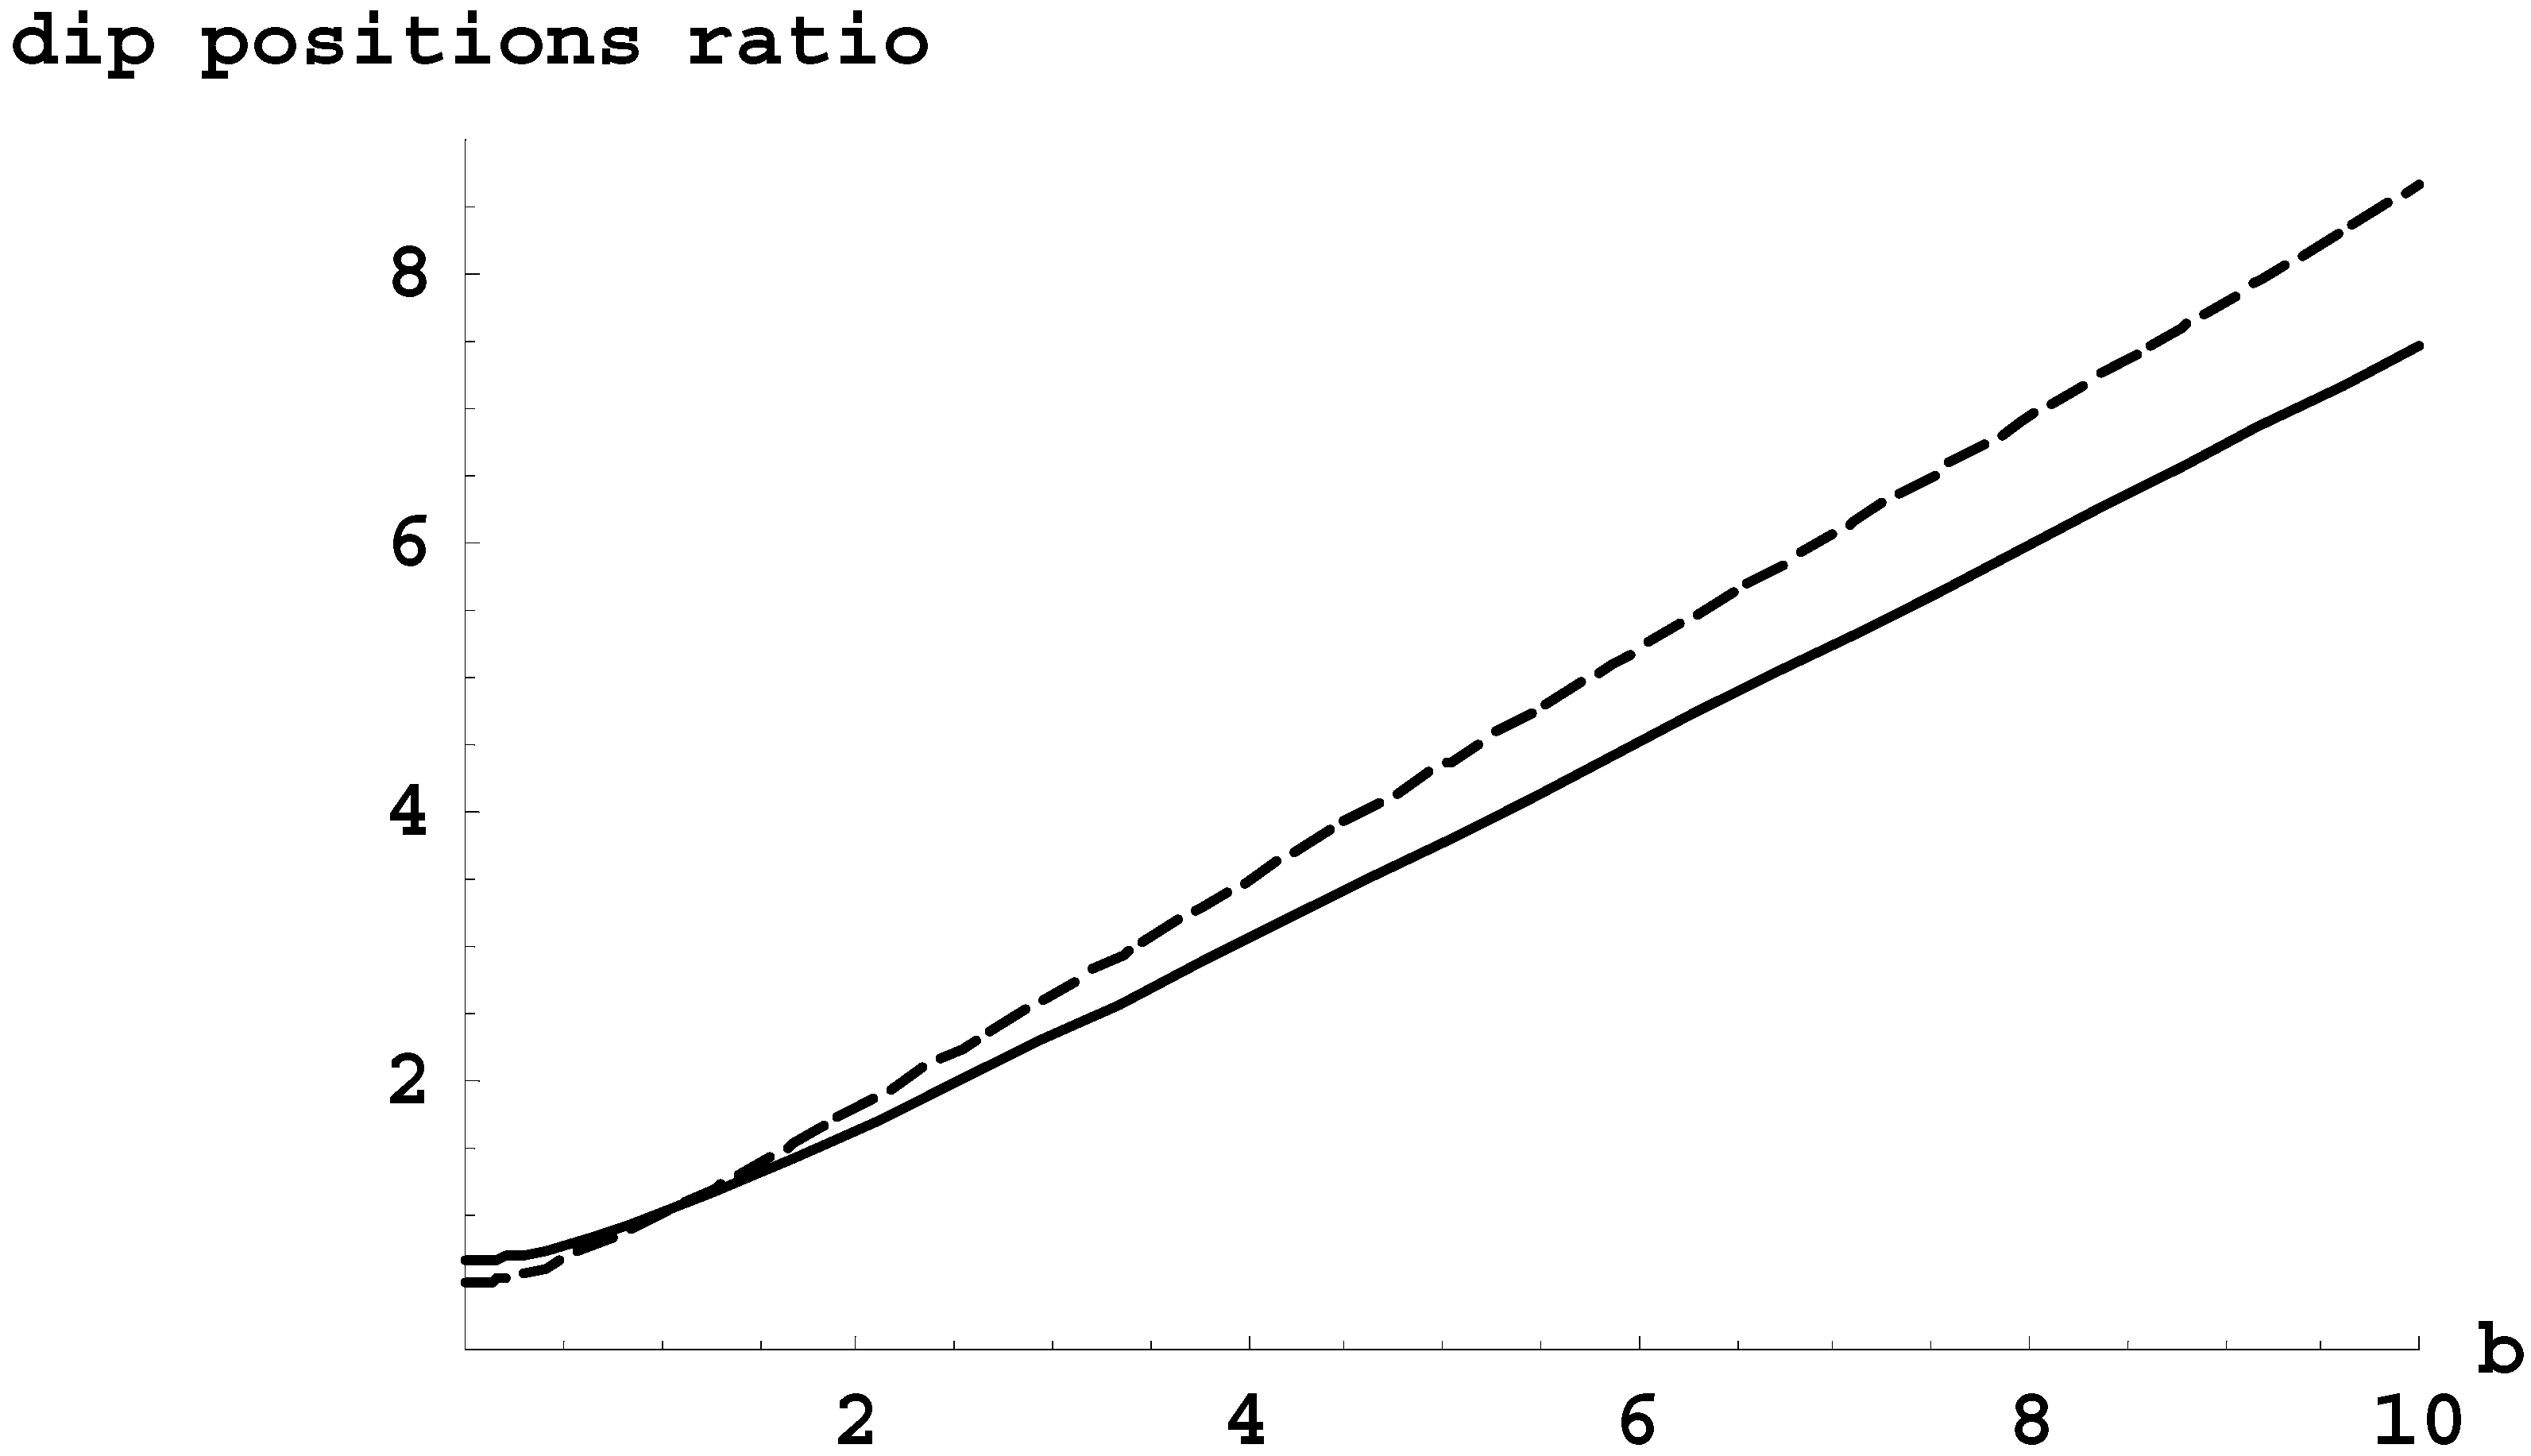
Figure 1. The ratio of positions Δωdip(α)ωdip(β) in the pair of the L-dips corresponding to (n’ + n”)α = 0, (n’+n”)β = −1, versus the scaled (dimensionless) magnetic field b (defined by Equation (12)) for the Balmer-alpha line (solid curve) and for the Balmer-beta line (dashed curve).
Atoms 06 00060 g001