Article

Electron Impact Ionization and Partial Ionization Cross Sections of Plasma-Relevant SiClx (x = 1–3) Molecules

1
Department of Physics, SGTB Khalsa College, University of Delhi, Delhi 110007, India
2
Department of Physics, Ramjas College, University of Delhi, Delhi 110007, India
3
Department of Physics and Astrophysics, University of Delhi, Delhi 110007, India
4
Department of Physics, Bhaskaracharya College of Applied Sciences, University of Delhi, Delhi 110075, India
*
Author to whom correspondence should be addressed.
Retired Professor.
Atoms 2025, 13(7), 64; https://doi.org/10.3390/atoms13070064
Submission received: 29 May 2025 / Revised: 24 June 2025 / Accepted: 28 June 2025 / Published: 3 July 2025
(This article belongs to the Special Issue Electron-Impact Ionization: Fragmentation and Cross-Section)

Abstract

The electron-impact ionization and partial ionization cross sections are reported for few silicon-chlorine molecules using semi-empirical methods. The partial ionization cross sections are determined using a modified version of the binary-encounter-Bethe model. In this approach, the binary-encounter-Bethe model is modified through a two-step process, namely, transforming the binding energies of the occupied orbitals and introducing a scaling factor. The scaling can be done using either the mass spectrometry data or experimental values of cross sections. It correctly adjusts the scaling term of the BEB model so that the order of magnitude of resulting partial ionization cross sections is the same as that of experimental values. Further, the use of the experimental value of ionization and appearance energy values ensures that the cross sections have a correct threshold. This further mitigates the dependence of cross sections on energy at low values. The role of the scaling factor and the behavior of branching ratios is also examined at different energies. The species whose partial ionization cross sections are reported are highly relevant in plasma processing. However, the proposed model can be extended to any multi-centerd molecular structures comprising a large number of atoms or electrons, except in cases where resonance effects or additional ionization channels become significant. The mass spectrometry data is of utmost importance in computing partial ionization cross sections in order to obtain reliable results.

1. Introduction

Electron scattering studies from atoms and molecules are ubiquitous in the plasma processing of materials, cometary and planetary atmospheres, space and atmospheric physics, fusion plasma, combustion physics, and laser physics [1]. They also help to understand the chemical and biological activity of molecules [2]. The electron–molecule interaction is responsible for the fragmentation of a neutral molecule into anionic and cationic species via dissociative electron-attachment (DEA) [3] and dissociative ionization (DI) [4,5] processes, respectively. The DEA is a low-energy resonant phenomenon, whereas ionization is a high-energy process. The DI process occurs at energies higher than the ionization energy of the molecule. Being the energy carriers, ions are used for the fabrication of nano-crystalline silicon dots [6,7], the etching of semiconductors [8,9,10,11], the enhancement of the efficiency of combustion engines [12], fusion plasma [5], etc. Electron–molecule interactions are quantified in terms of energy-dependent quantity known as scattering cross sections, while the ions formed by DI are represented by partial ionization cross sections (PICS). The PICS of all cations add up to give the total ionization cross sections (TICS).
The PICS of any cation can be expressed as the product of the branching ratio (BR) and TICS [13]. BRs can be computed from the electron ionization mass spectra (EIMS) [14] or cross sections [15] and help one to understand the chemical pathways of the formation of cations. Certain plasma and radiation biology simulation codes also require PICS [16,17,18,19,20] as an essential input. The electron ionization mass spectrometry (EIMS) is a powerful and highly advanced technique to identify cations formed during DI. The most favored cation in mass spectrum corresponds to maximum relative cation intensity. The NIST database comprises mass spectra of millions of cations [21].
Rigorous calculations of electron ionization cross sections (total and partial) for molecules are challenging both from the theoretical and experimental perspectives. The complex nature of molecules, the inclusion of a variety of final states in the ionization process, and numerical issues make theoretical methods difficult to use, and the results may be intractable at times. The computational requirements further compound the problem. This has made semi-empirical methods [22] popular while computing ionization cross sections. On the experimental front, the resolution and efficiency of detectors, separating singly ionized ions from higher-order ionized ions from fragment ions, highlight the problems faced by experimentalists.
The radicals like SiClx (x = 1–3) are formed due to electron interactions with SiCl4 [23,24]. These are used as an admixture in processing plasma feed gas mixtures [9,10].
Becker and co-workers, using an improvised fast-beam apparatus, have obtained TICS and PICS of various singly ionized cations formed due to the electron-impact DI of SiCl, SiCl2 [23], and SiCl3 [24] molecules. These measurements were performed up to 200 eV energy and had a maximum uncertainty of 18%. Their upgraded apparatus consisted of a high-intensity dispenser-type electron emitter. It could produce an electron beam exceeding 2 mA above 50 eV. A position-sensitive triple multi-channel plate ion detector was used in the measurements. Although the authors used the DM method [25] to cross check their experimental findings of electron ionization (EI) cross sections, to date there are no theoretical calculations available for PICS of SiClx cations.
Inspired by the success of the modified BEB model to compute PICS [26,27,28], in this work we present the PICS of SiClx radicals to a much larger energy range using the modified version of the binary-encounter-Bethe model. This model is based on the binary-encounter-Bethe (BEB) model [29], which is commonly used to compute TICS of atoms and molecules. Besides reporting PICS, we try to bring greater clarity to our model in terms of justification. This is discussed in subsequent sections.

2. Methodology

2.1. Ionization Cross Sections: The BEB Model

The total ionization cross sections are computed using the BEB model [29]. The cross sections are expressed in terms of bound molecular orbital. The sum of all the bound orbitals gives total ionization cross sections. The cross sections for each molecular orbital are given by:
Q I ( t ) = i S i t i + u i + 1 Q 2 1 1 t i 2 l n t i + ( 2 Q ) ( 1 1 t i l n t i t i + 1 ) ,
Here, t i is the reduced energy. R is the Rydberg energy. a 0 is the Bohr radius. U i , B i , and N i represent the orbital kinetic energy, binding energy, and occupancy number of the ith orbital. t i = E i / B i , u i = U i / B i . S i = 4 π a 0 2 N i ( R / B i ) 2 . Q represents the dipole oscillator parameter and is defined in terms of ionization to a continuum state. This is the binary-encounter-dipole (BED) model. Putting Q = 1 gives the BEB model. The BEB results are generally within 5% to 20% of the experimentally measured values from the first ionization threshold to several keV incident electron energies [30]. In some cases, the deviation was found to exceed this range. Such differences can be explained due to the neglect of resonance formation, indirect channels, multiple ionization process, and the differential oscillator term of the BED [30]. The BEB model assumes that the transition probability from each molecular orbital to the continuum is related only to B, U, and N. The B values of inner orbitals do not account for electron shielding effects and hence may lead to deviations in TICS computed from the BEB model when compared with experimentally measured values. The scaling term used in Equation (1) is another important reason [31].

2.2. Partial Ionization Cross Sections: The Modified BEB Model

Once the energy of the incident electron exceeds the threshold energy, the ionized molecule undergoes fragmentation via the DI process. This threshold energy is known as the appearance energy (AE) of the cation. The BEB model [29] cannot compute the PICS of all cations formed through the DI process. However, the model can be suitably modified to compute PICS [26,28]. This is achieved by applying a simple two-step modification in the BEB model.
(a) Incrementing the input value B of occupied orbitals in the BEB model by Δ. The highest occupied molecular orbital (HOMO) of the cations can then be made to represent the AE of a particular cation j. This approach mirrors the BEB model, where the HOMO represents the IE of the neutral molecule. The increment (Δ) is the difference between the ionization energy (IE) of the neutral molecule and AE.
(b) Replacing the scaling term ( t + u + 1 ) in the BEB model with ( t + u + 1 ) / Γ . The redefining of the scaling term results in the PICS, which align more closely with the experimental values. The scaling factor Γ can be easily computed using the EIMS data or from experimental cross section data. For more details, the readers may refer to earlier publications [26,27]. It is pertinent to mention that all characteristics of the BEB model (advantages and limitations) apply to the modified version as well. Also, no additional data is required to compute cross sections from modified-BEB model. In the absence of the experimental value of AE, quantum mechanical software can be used to estimate them. The PICS of a cation j from the modified BEB model are computed using the equation:
Q j ( t ) = i S j i t j i + u j i + 1 1 2 1 1 t j i 2 l n t j i + 1 1 t j i l n t j i t j i + 1
Q j ( t ) = Γ j Q j ( t )
Here, t j i = E i / ( B j i + Δ j i ) , and S j i = 4 π a 0 2 N i ( R / ( B j i + Δ j i ) ) 2 . Γ j represents the scaling factor. This model is now termed as the modified BEB model (mBEB). Γ j can be obtained as a ratio of experimental BR (PICS/TICS) and Q j ( t ) / Q I ( t ) [14]. The overall uncertainty in computed PICS is due to the basic nature and limitations of the BEB model as highlighted above. It must be kept in mind that while the TICS are measured fairly accurately from experimental set ups, the PICS have shown greater uncertainty, varying between 20–25%.

3. Computational Details

The geometry of SiClx (x = 1–3) molecules was optimized at the HF level using LANL2DZ effective core potential (ECP) basis sets [32] with the help of Gaussian (version 03) software [33]. The reasons for using the ECP have been discussed previously [34,35,36] and hence are not repeated here. SiCl2 is a closed-shell molecule where each bound orbital has an occupancy number 2. The other two molecules, SiCl and SiCl3, are open shell. The experimental values of IE were used to compute BEB-TICS, whereas the experimental values of AE listed by Mahoney et al. [23] and Gutkin et al. [24] were used in to obtain PICS. This offers several advantages over computed theoretical values. The cross sections exhibit threshold behavior consistent with experimental results, which also rules out the impact of threshold on computed cross sections. The HOMO plays the dominant role in the electron impact process and contributes to the BEB TICS to a maximum degree. Also, adjusting the threshold for each ion to certain extent mitigates the damage from the approximation of energy-independent branching ratios. Since the numerical values of relative cation intensities of fragments determined from EIMS data were not available, the branching ratio (BR) was estimated using experimental cross section data [28] and to choose the scaling factor ( Γ ). Γ j was obtained at 70 eV, where the experimental TICS exhibited the maximum value. The input parameters used in computation of PICS using the modified-BEB model are given in Table 1, Table 2 and Table 3.

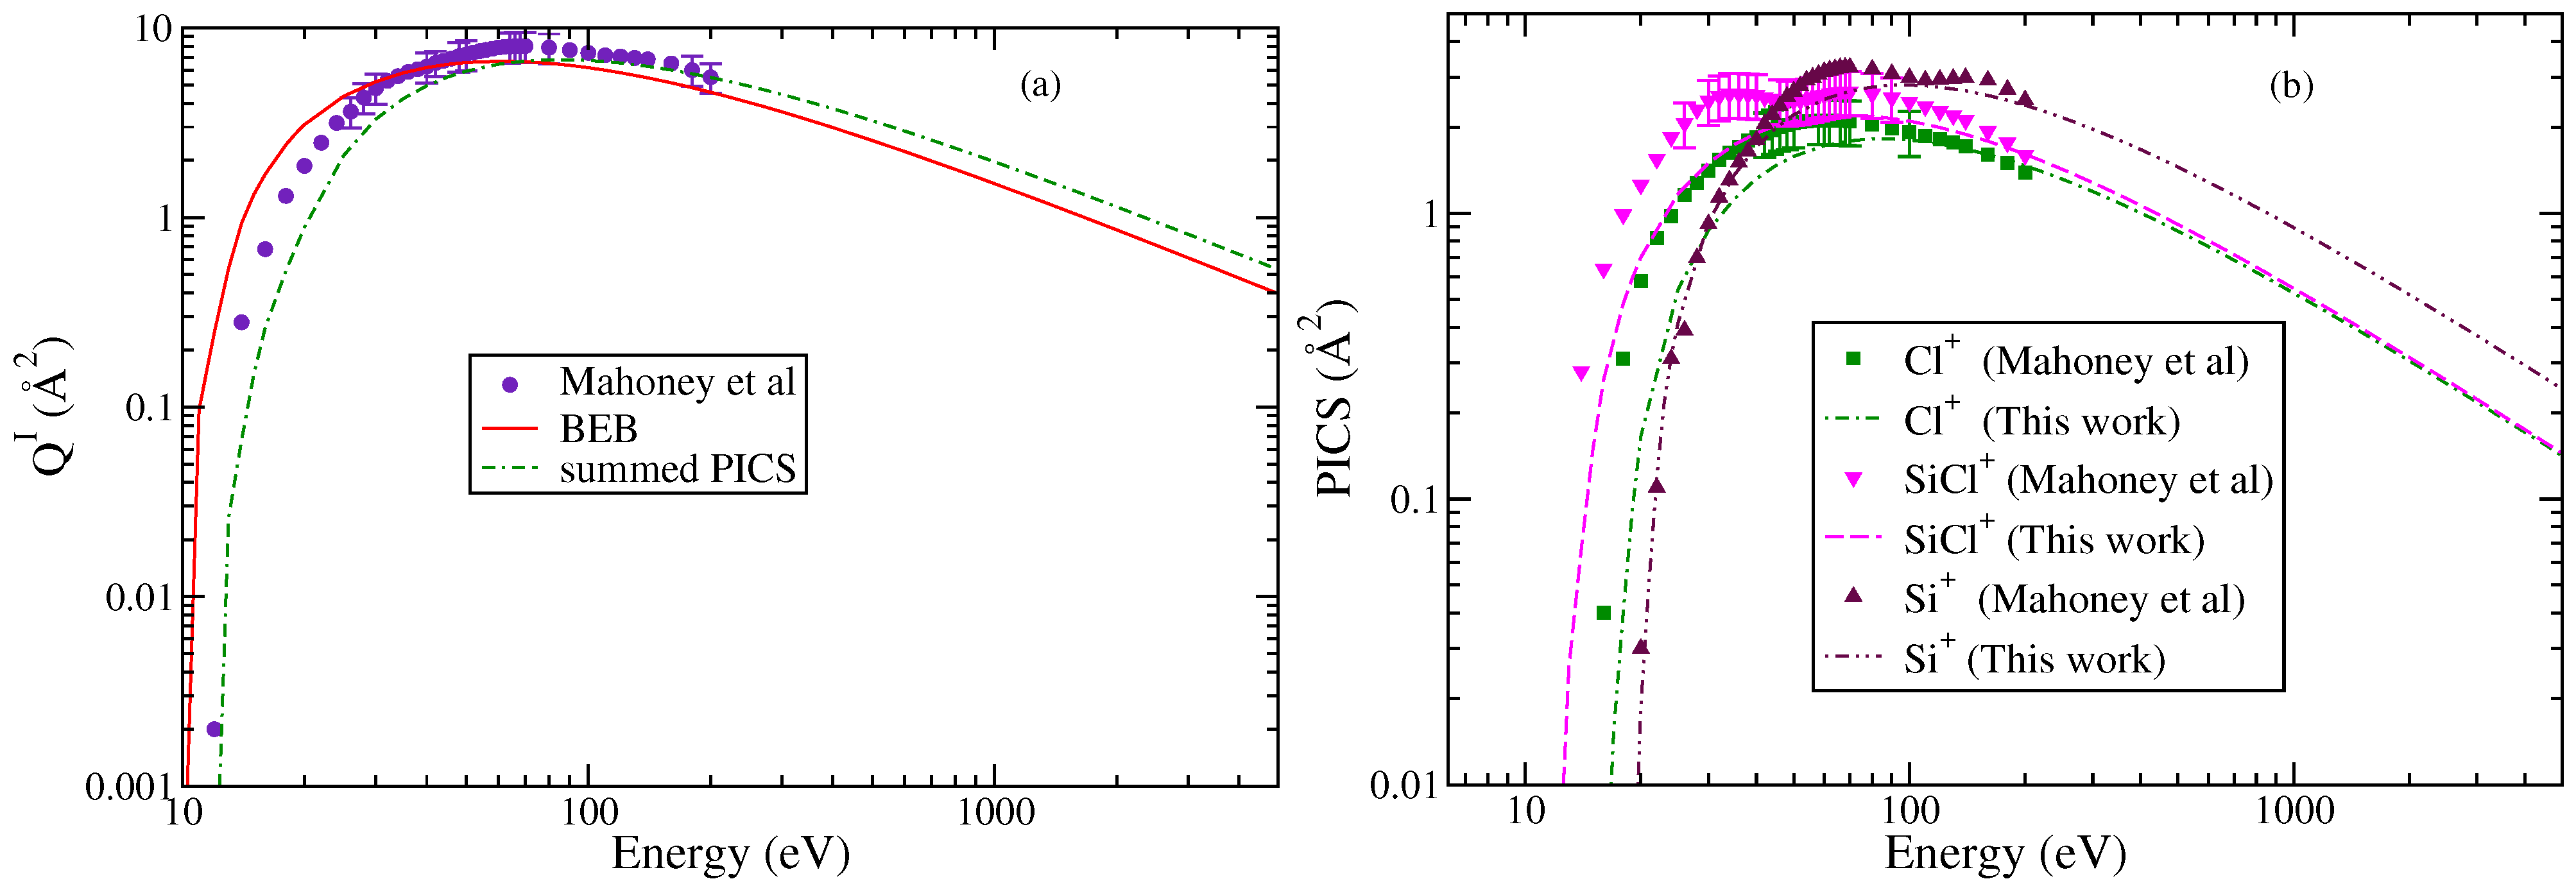
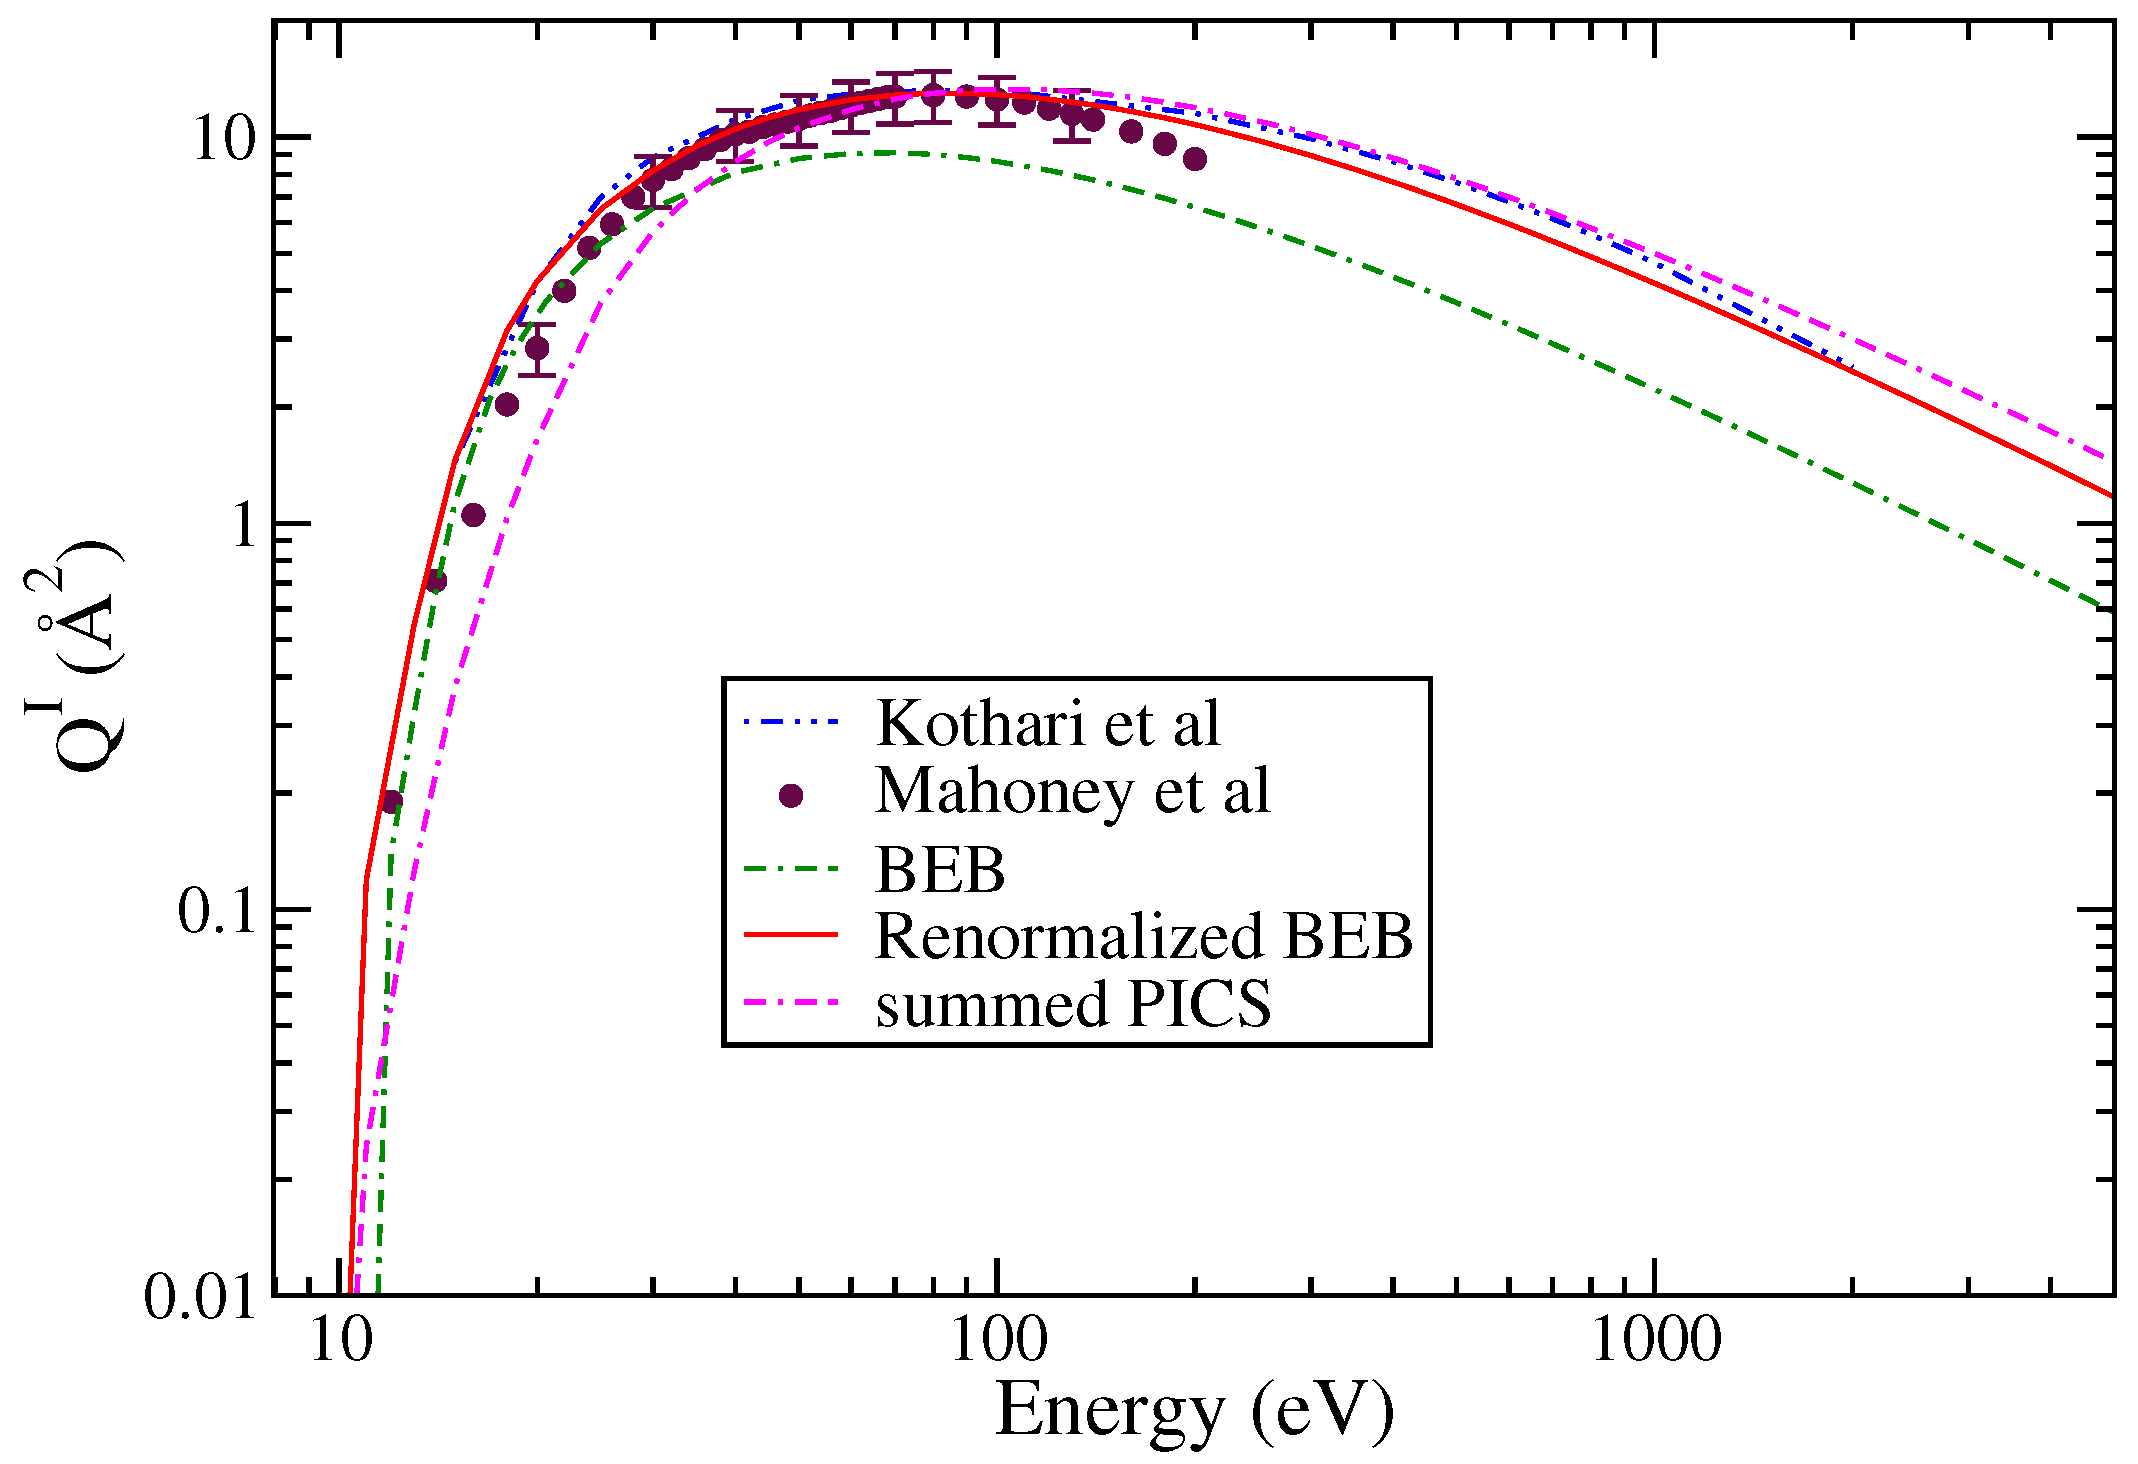
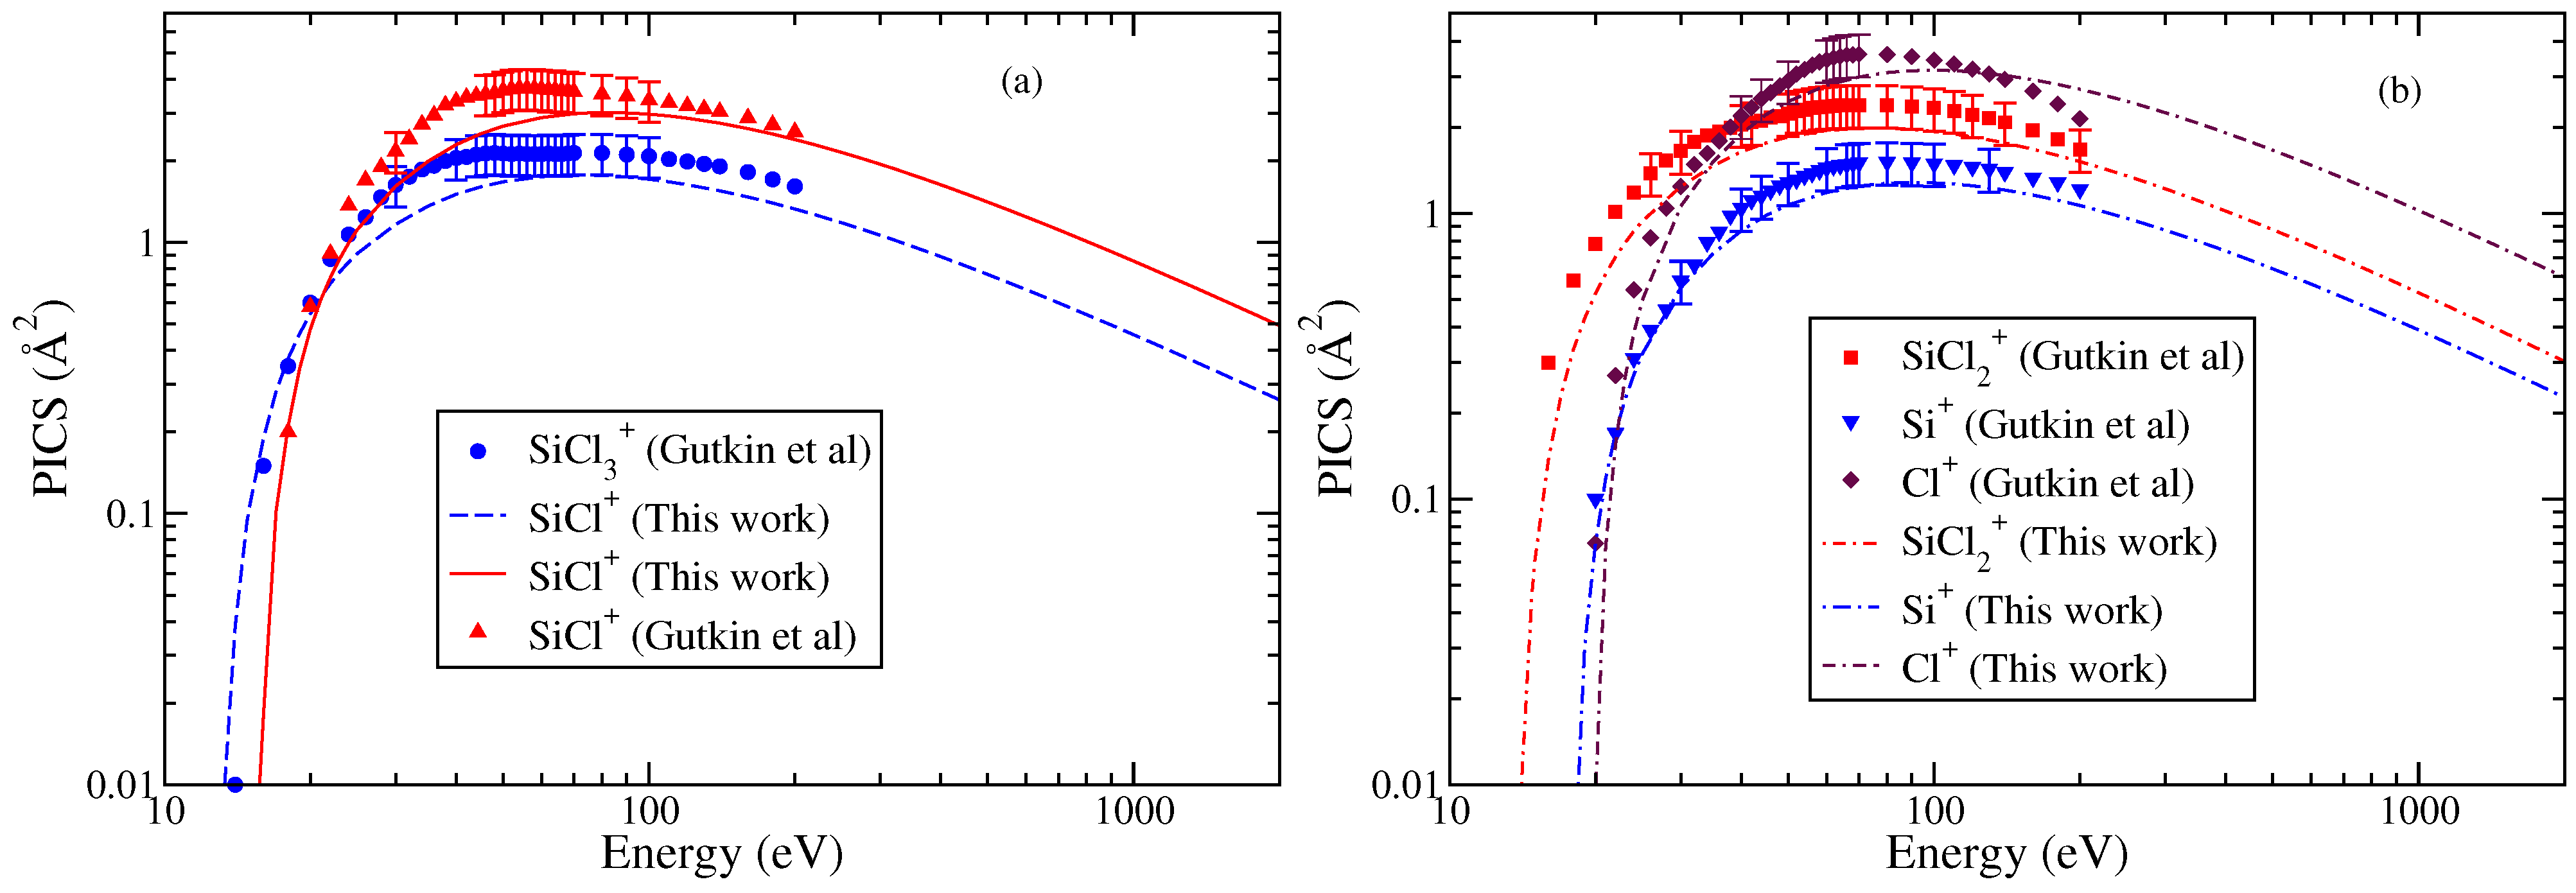
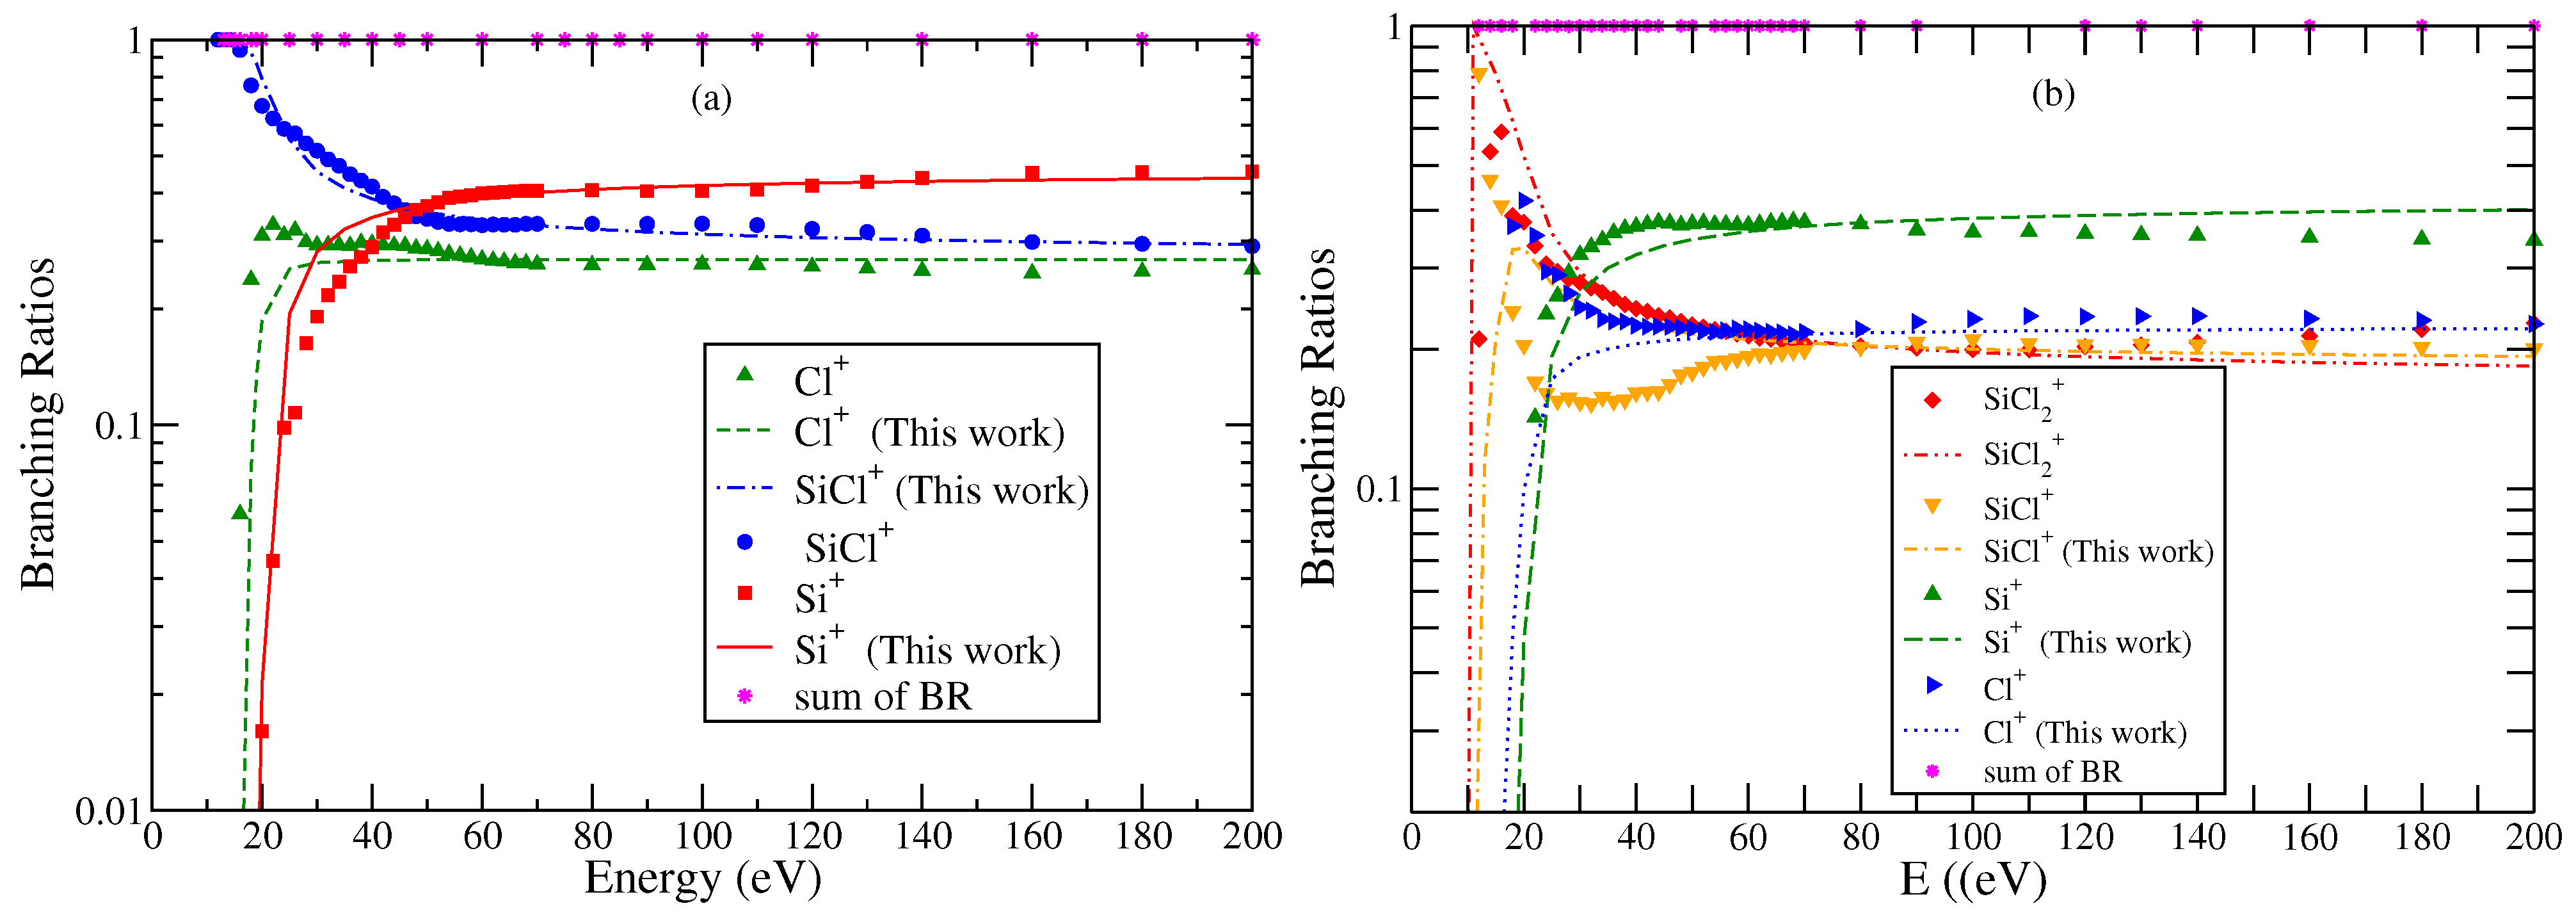
3.1. Clorosilylidyne (SiCl)

It is a simple diatomic molecule under DI fragments to Si+ and Cl+. The parent cation is the SiCl+. Mahoney et al. [23] measured TICS and PICS up to 200 eV for singly charged ions. The experimentally measured PICS for all three cations exhibit comparable maximum values but with significant differences in their energy dependencies. Cations like SiCl+ and Si+ show a pronounced structure in PICS around 30 eV, indicating the contributions of indirect ionization channels. All cations were formed with minimal excess kinetic energy. The experimental TICS were found to be zero below 10 eV.
The BEB and experimental TICS are shown in Figure 1a. The agreement is reasonable as the theoretical cross sections lie within experimental uncertainties. The maximum in TICS from the BEB method is 6.66 Å2 and appears at 65 eV, whereas the experimental results show a peak at 70 eV with a maximum value of 8.66 Å2. The minor variations may be attributed to the threshold value and the contributions of indirect channels to experimental values. The BEB method does not account for the contributions from post collision or Auger effects [29].
In Figure 1b, the PICS for all three fragments are shown and were obtained using the AE value of 12 eV for SiCl+, 16 eV for Cl+, and 19 eV for Si+, respectively [23]. The AE values were close to the thermochemical minimum energy required for the formation of each ion. It is apparent that each cation exhibits distinct energy-dependent behavior consistent with experimental results. The PICS of SiCl+ rise sharply from the threshold to 30 eV followed by a decline and then a secondary rise up to 80 eV. After this, the PICS decrease with an increase in energy. A similar trend is observed in PICS of Si+ but at different energies.
The PICS obtained from modifying the BEB model cannot reproduce features arising observed in the experimental measurements. This is expected because the BEB model itself is a semi-empirical model and has its limitations [30]. However, we observe a satisfactory trend in the PICS after 20 eV for Si+, 45 eV for Cl+, and 40 eV for SiCl+, respectively. The deviation at low energies in the PICS of SiCl+ and Cl+ is a consequence of the indirect ionization channels contributing to PICS, which are not accounted for by the mBEB model. The availability of EIMS data would have been an asset for better understanding of the ionization process and the formation probabilities of cations, as the PICS of cations are close to each other. Still, the study demonstrates that the modified BEB model can effectively yield the PICS of cations formed through the DI process.

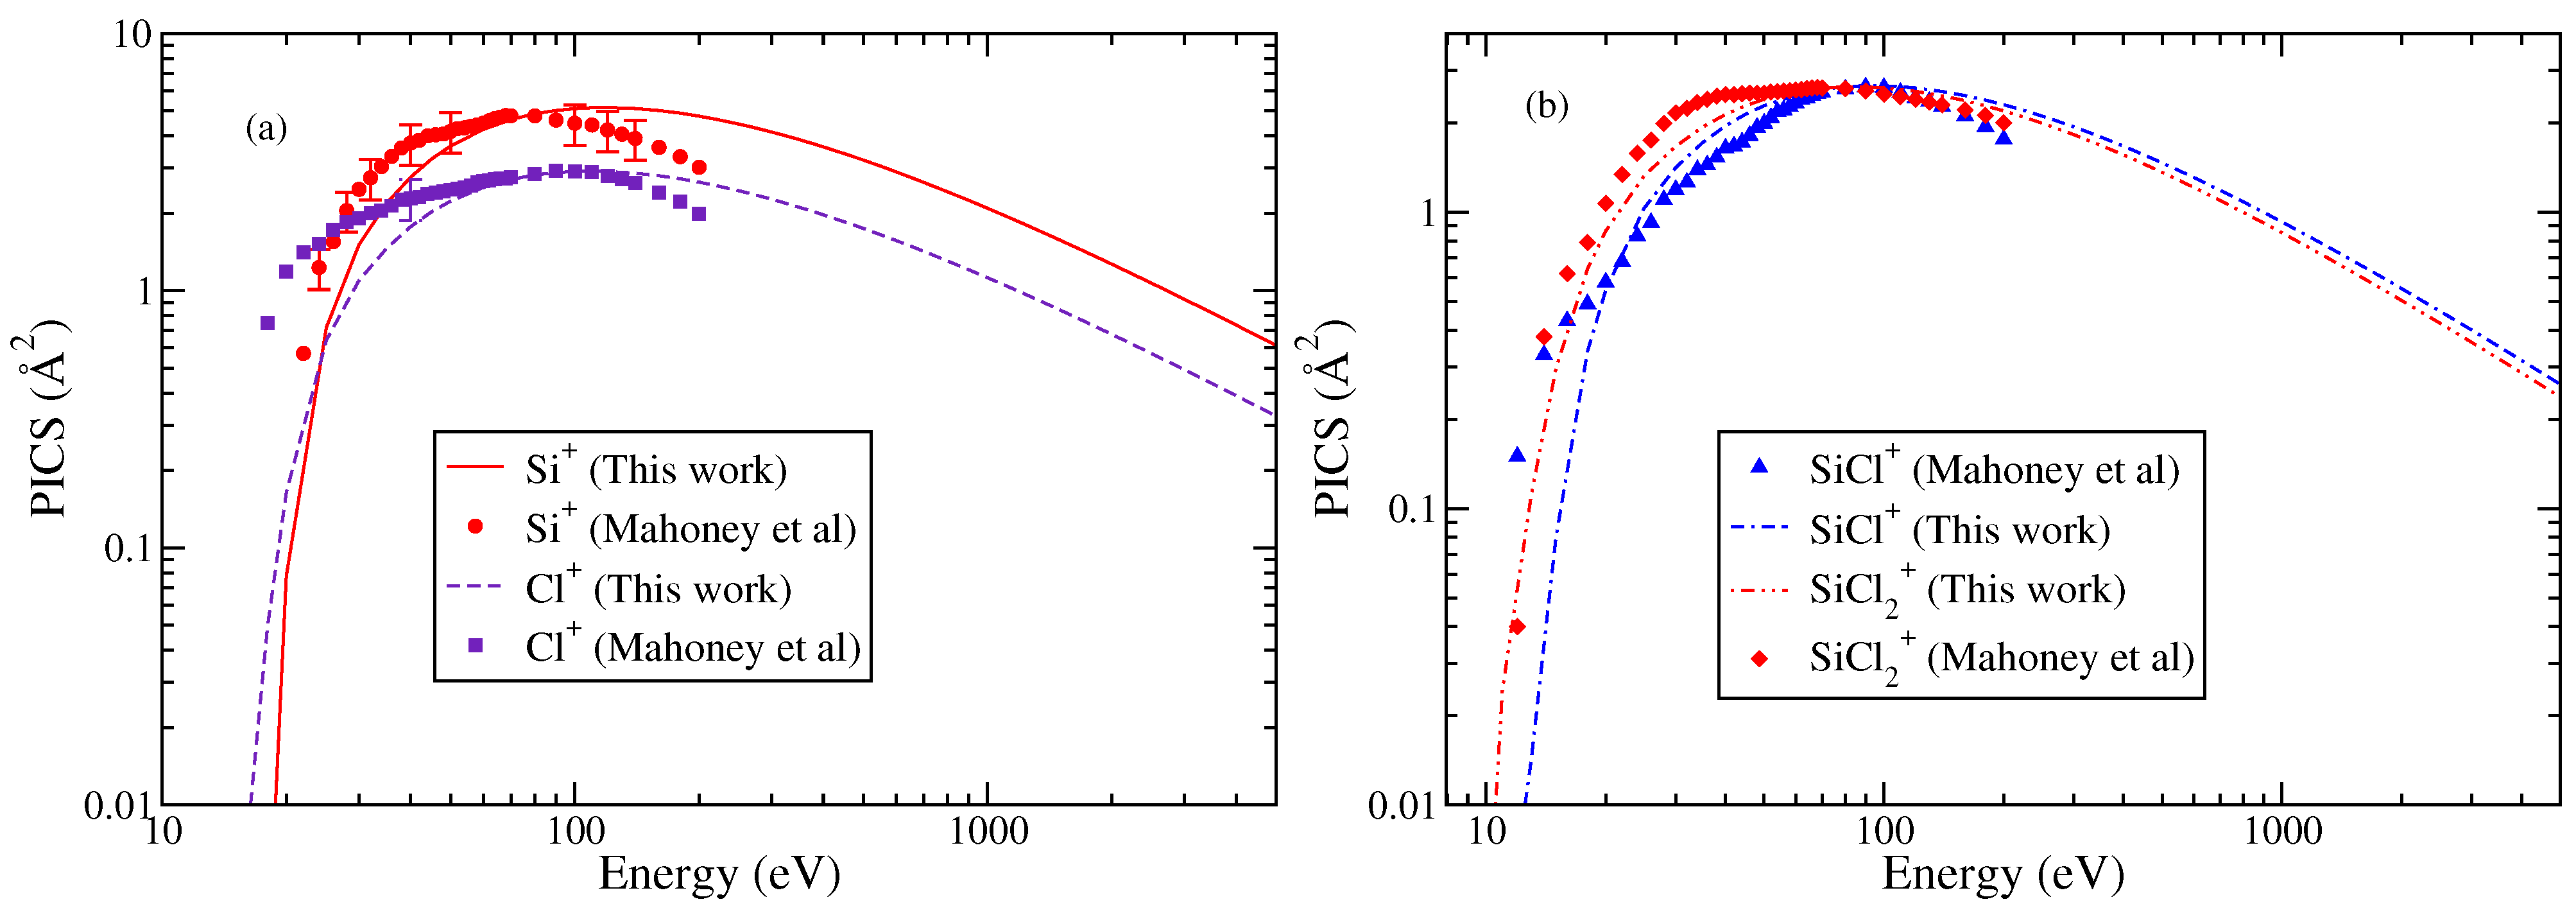
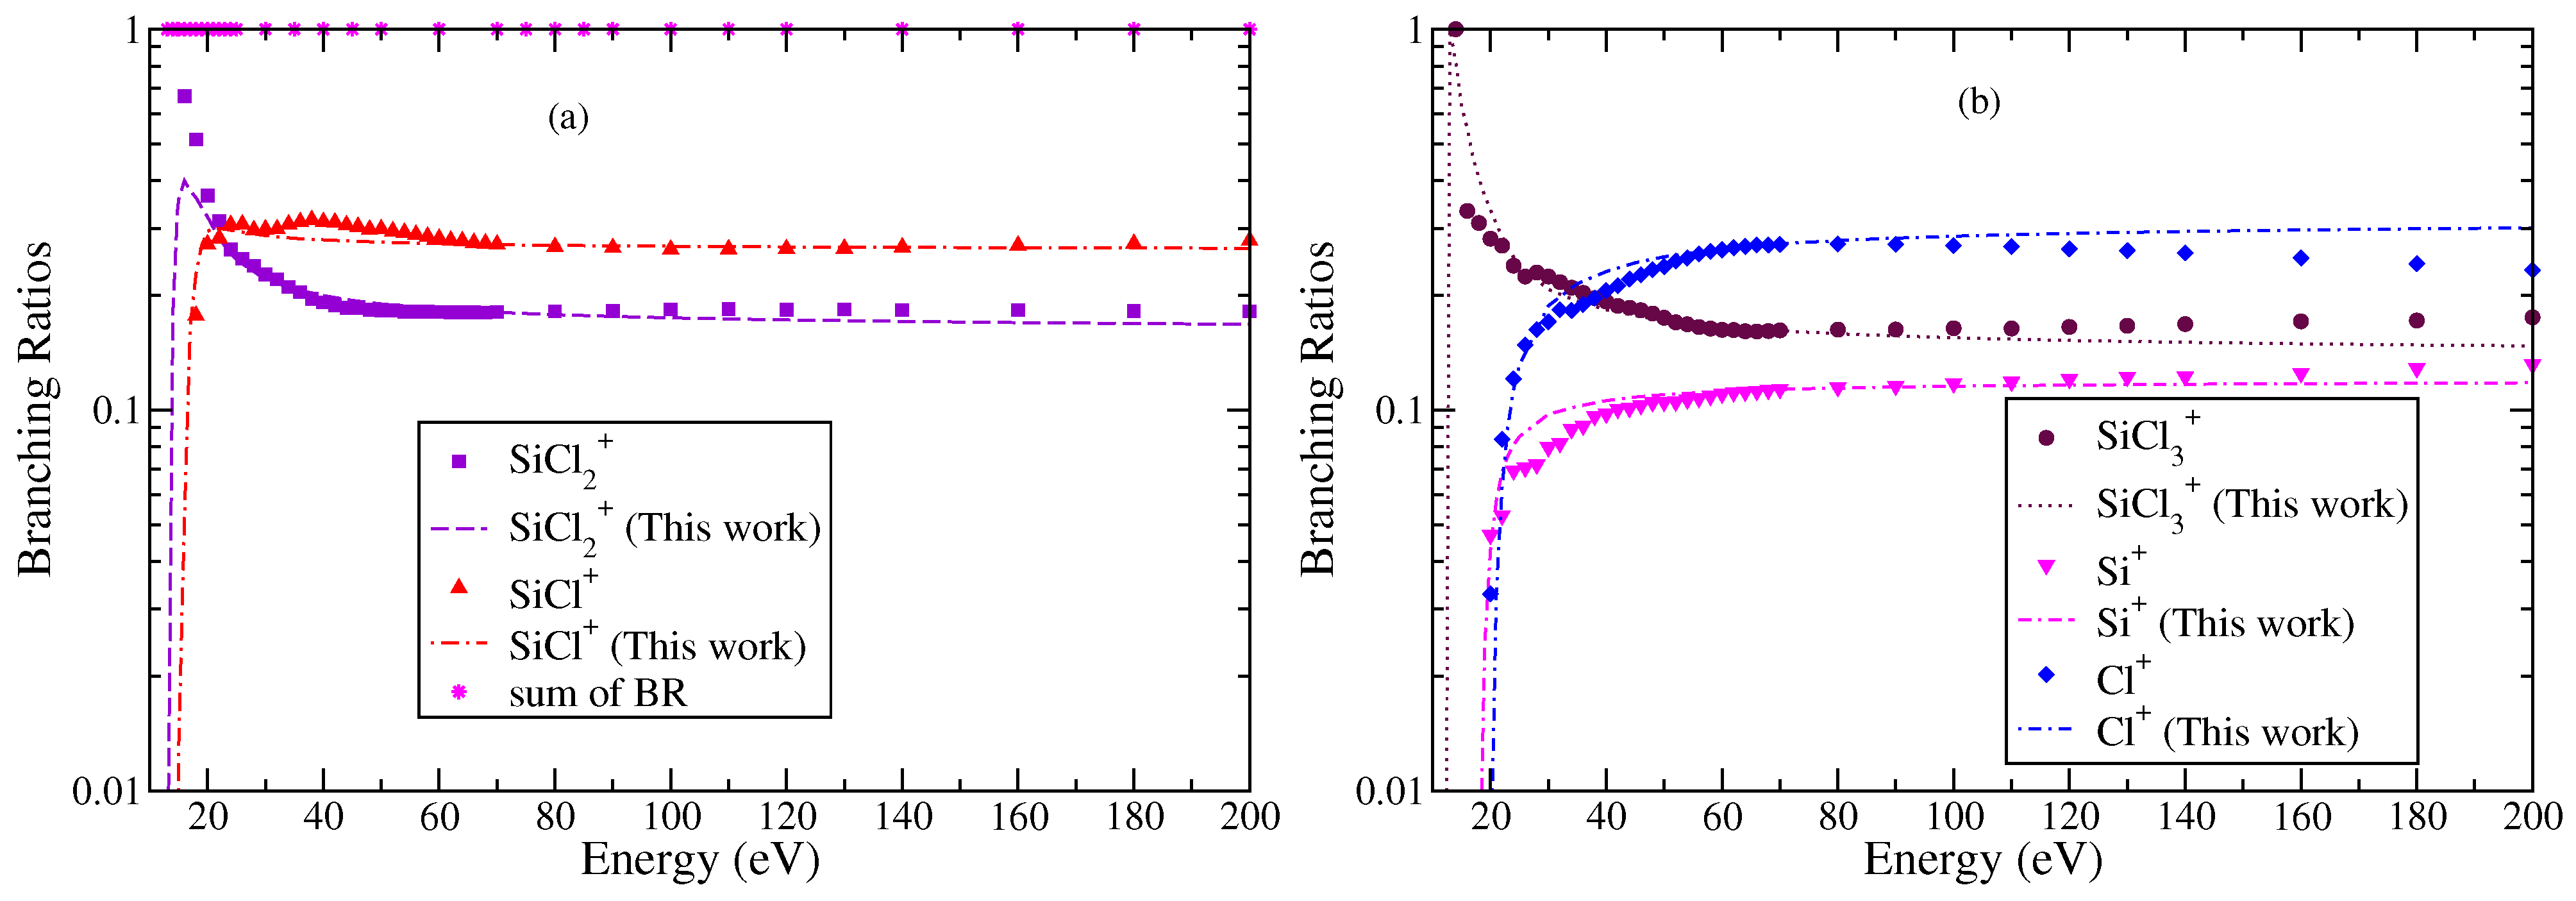
3.2. Dichlorosilylene (SiCl2)

The total ionization cross sections are shown in Figure 2. This includes the experimental results of Mahoney et al. [23], the theoretical results of Kothari et al. [37], and the BEB results. The BEB results are consistently lower than all other results even after using ECP basis sets.
The experimental data of Mahoney et al. [23] for various singly charged ions is available from threshold to 200 eV. These measurements have experimental uncertainty between ±15 and 18%. The cross section data reveal that the PICS of Si+ cation dominate over all other cations, including the molecular ion SiCl 2 + .
Since the BEB results were lower than the experimental results, these were therefore normalized to match the experimental data at peak value. This practice was followed in the past [26,27] to obtain best results from the modified BEB model. The PICS were then obtained for singly ionized cations like SiCl 2 + , SiCl+, Si+, and Cl+ using Equation (2). The results shown in Figure 3a,b were obtained using the AE for the various ions, which ranged between 10.3 and 12.5 eV for SiCl 2 + and SiCl+, and were 18 eV for Cl+ and 20 eV for Si+ [23].
As with SiCl cations, indirect ionization channels also contribute to the TICS at low energies. This is the primary reason for the deviations observed between the theoretical and experimental results at low-energy values in Si+ and Cl+ cations. However, the overall shape of the PICS curves for all cations closely resembles the experimental data. The calculated cross sections show good agreement with the experimental data after 30–35 eV. This point is discussed later in the text. Nevertheless, considering the fact that the measured PICS include contributions from indirect ionization channels at low electron energies (around 30 eV), which are not captured by the BEB or modified BEB model, the quantitative agreement remains satisfactory with experimental PICS at low energies.

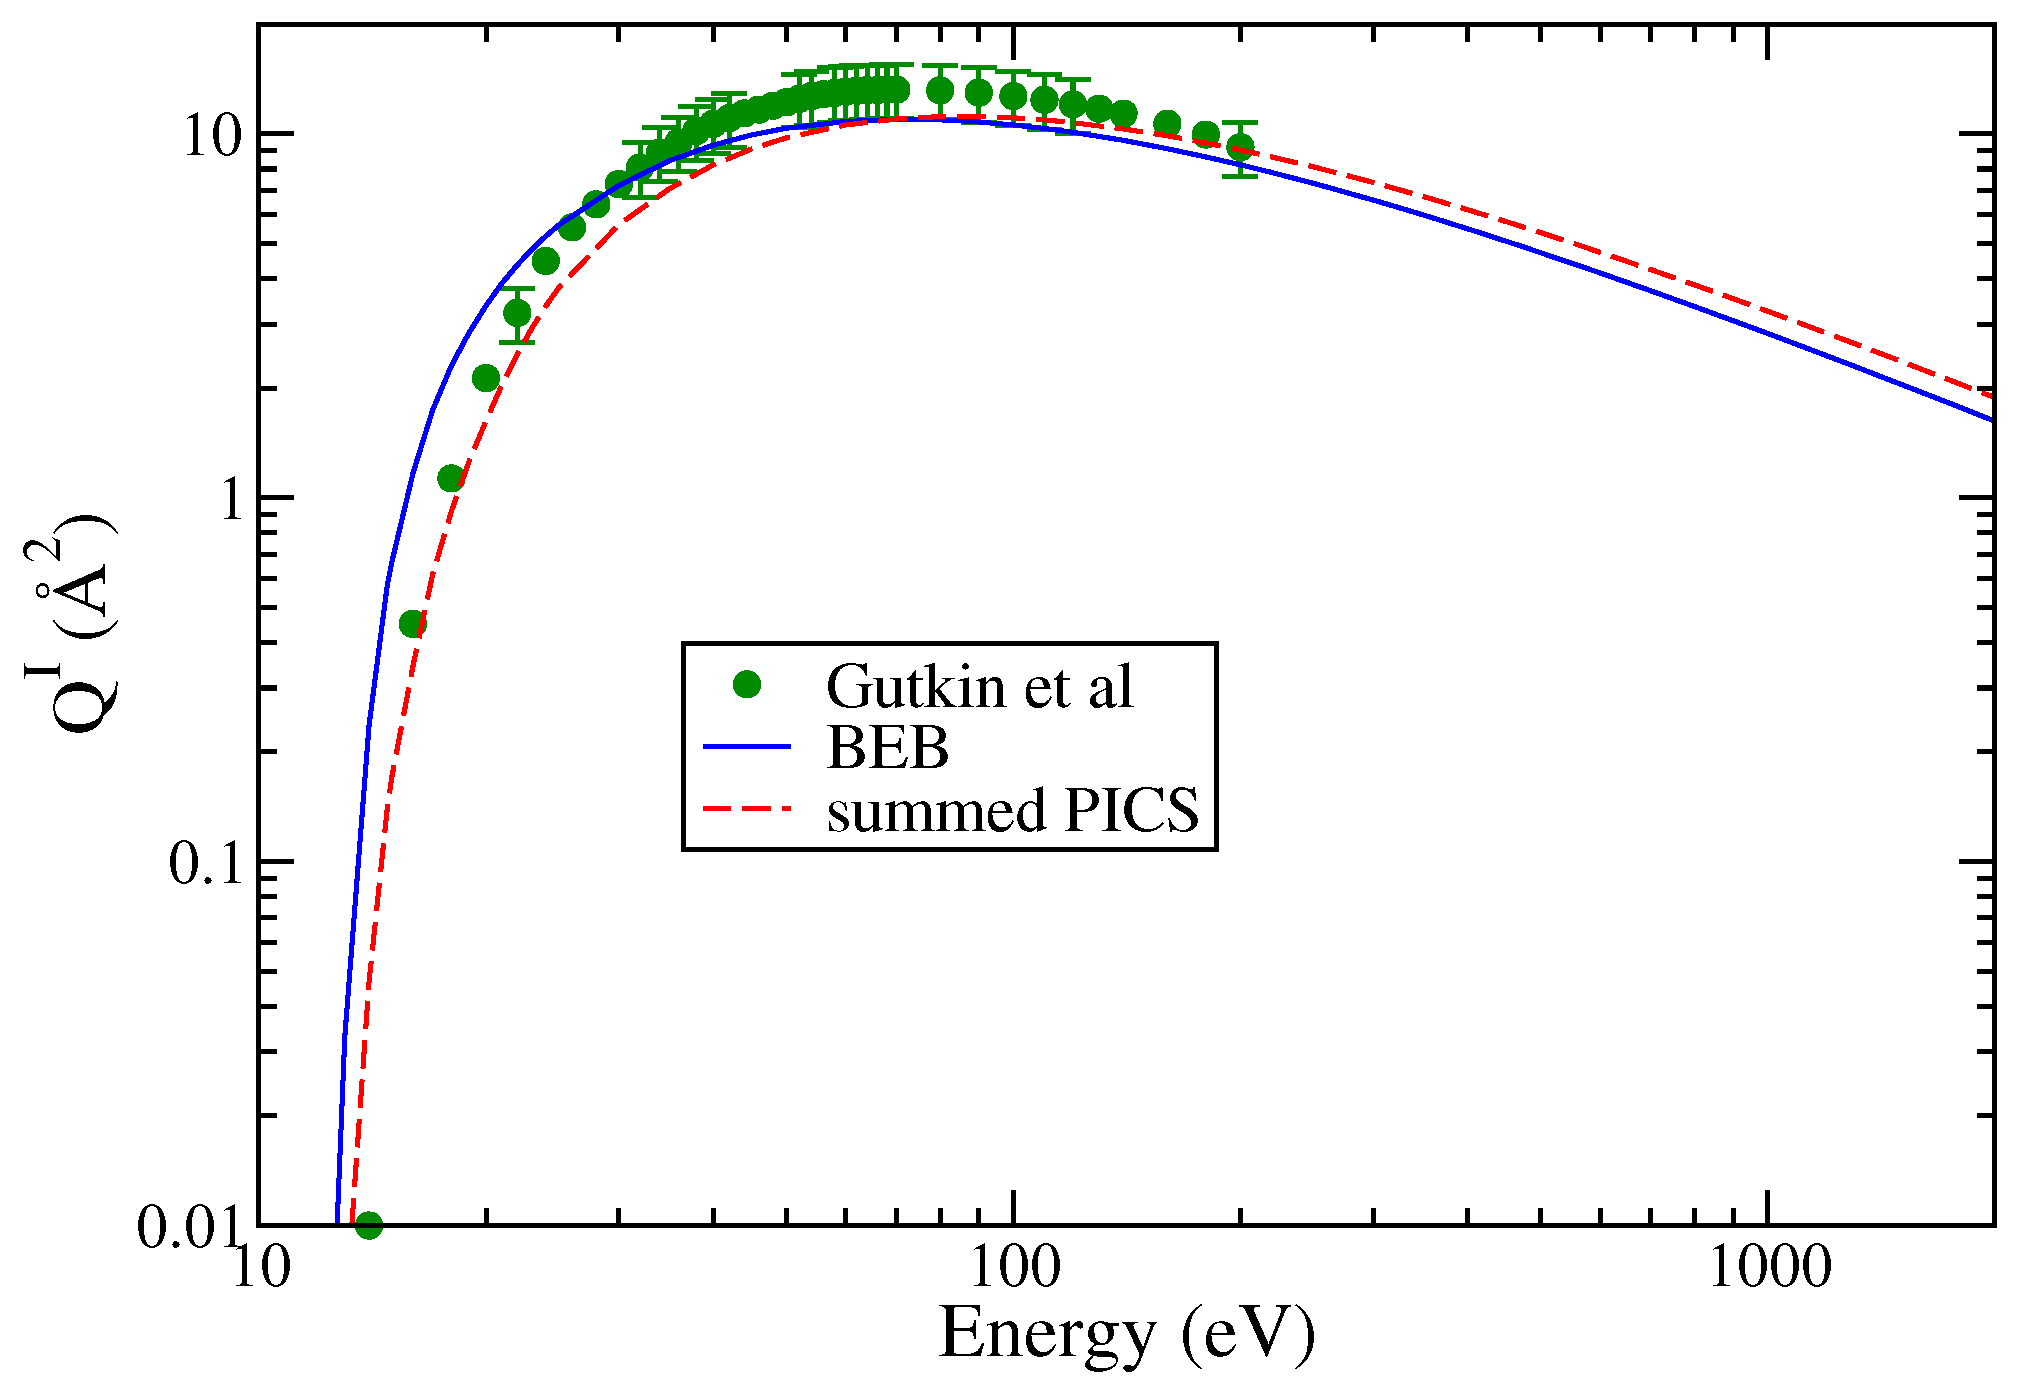
3.3. Trichlorosilyl (SiCl3)

Gutkin et al. [24] have reported cross sections for the formation of singly charged ions. The doubly charged ions had very small PICS (less than 0.1 Å2) and hence were not reported. Among all the cations, SiCl+ and Cl+ cations exhibit the largest maximum cross section values though at different energies. The PICS of SiCl 3 + show a hump indicating a double maxima in the energy dependent curve. The Cl+ PICS shows a sharp maximum in contrast to Si+ PICS and a broad maximum around 80 eV. The double-maximum is also observed in the PICS of SiCl2 and SiCl. The TICS are shown in Figure 4, and the PICS are shown in Figure 5a,b to provide greater clarity to the results. The values of AE were referred from Gutkin et al.’s [24] work only. These were approximately 14 eV for SiCl 3 + and SiCl 2 + and ranged between 16 and 20 eV for all other cations. Again, we observe fairly good agreement between theoretical and experimental PICS and TICS.
In general, good agreement is observed between measured and calculated TICS (single ionization) and PICS over a broad energy range. The low-energy deviations are an exception and reflect the limitation of the mBEB model. The results are encouraging considering the simplicity of the model. The computation is economical in terms of resources and time and does not require expertise in running the code. This is in contrast with the method followed by Pal et al. [38], where optical oscillator strength (OOS) is an essential input. OOS is not easy to obtain.
The PICS from the mBEB model require the BEB input data of neutral molecule along with the information about AE and the scaling factor. While the AE values can be easily obtained using quantum chemistry computational codes in the absence of experimental data, the scaling factor can be computed using the EIMS data. The use of experimental values helps one to understand and explain the other reasons for deviations in cross sections. The reliance on experimental cross section data to obtain the scaling factor was solely due to the unavailability of the EIMS data. Recently, machine learning techniques have also been used in electron–molecule collision to compute mass spectra [39] and ionization cross sections [40,41]. While only ab initio approaches are expected to reproduce true experimental features, unlike the semi-empirical methods, we have not come across any ab initio study that can compute the PICS of all cations of a complex molecule over a wide energy range.
It can further be concluded from the above studies that the theoretical PICS of all fragments align with experimental data broadly after 35–40 eV. The success of the mBEB model is largely attributed to the modification introduced in the scaling term. This has been discussed in the above-referenced papers but seems to lack the proper justification of a scaling factor. This is now discussed thoroughly in this paper. The PICS of dominant channels formed due to direct ionization or with a small energy barrier are estimated more accurately than those involving indirect processes or a large energy barrier.
It also appears from the use of a fixed value of the scaling factor that is does not have a profound impact on computed PICS as the energy increases. In other words, branching ratios appear to be energy invariant over a broad energy range, indicating that the basic dynamical mechanism for all ionization channels remains the same. The differences at low-energy values are purely related to the characteristics of individual cations. To confirm this, we obtained the BRs of cations from experimental cross section data. The BRs for each cation showed variations with energy only in the low-energy region up to 35–40 eV. Beyond this, the BRs for all cations were practically independent of incident energy. This essentially corresponds to the energy range where the PICS show good agreement with the experimental results. The low-energy region is where indirect channels make a maximum contribution. This variation provides an important insight to fragmentation dynamics and supports the use of a single scaling factor. It greatly simplifies the computation process as we need not introduce the energy behavior in BRs explicitly. At energies below 35 eV, good quantitative agreement is introduced by using the experimental values of AE.
The BRs of all cations obtained using experimental data and theoretically calculated cross sections are plotted in Figure 6 and Figure 7. It can be noticed that the BRs obtained from two sources are in very good agreement with each other. This is also a reflection of the fact that we have correctly scaled BEB cross sections after applying the binding energy transformation using the modified BEB model. This modification makes the BEB model more versatile in nature. It must be remembered that the choice of scaling using BR in the mBEB is inherently biased. The preferred energy must be where the TICS are at a maximum. This ensures all PICS are scaled proportionally without altering the energy position. As a result, the PICS and TICS will exhibit the maximum at the same energy. However, this may not be the case always. In several cases, PICS and TICS have shown a peak in cross sections at different energies [42,43,44]. The semi-empirical theoretical methods are not expected to reproduce this feature.
Huber et al. [45] proposed a predictive method based on dissociation energy to compute BRs and hence the PICS. They applied this approach to compute the PICS of diatomic molecules. The ionization mass spectrum of several complex molecules like hexamethyldisiloxane [42] and methyl and ethyl alcohols [43] shows the formation of more than one cation with the same dissociation energy but a different probability. This means that cations are formed with different chemical pathways with a different likelihood. Huber et al’s [45] form predicts the same energy behavior of BR for such cations. Their approach might be well suited for diatomic or simple polyatomic molecules where cations have different dissociation energy but is likely to fail in complex molecules. Tennyson et al. [46] have advocated that working with the mass spectrometry data is a more reliable approach as it provides better estimates of PICS than Huber et al.’s [45] approach.
It can be argued that the modified BEB model is not fully predictive. However, the following points are worth noting:
(1) The BRs can be computed from EIMS data [14,47,48], typically reported at a single energy. In practice, experimentalists also measure and report the electron ionization mass spectrum before performing experiments to measure PICS. If the EIMS data is reported at multiple energies, BRs can then be computed as a function of energy, which can then be used to obtain PICS from the mBEB model.
(2) The EIMS is the most reliable technique for determining accurate fragmentation probabilities. This provides a useful insight into the contribution made by each cation to TICS at a given energy and is also vital to determine PICS accurately.
(3) Omission of any channel would lead to deviations in results [48], while including any extraneous channel would lower all PICS.
(4) The same methodology in principle can be extended very well to compute PICS due to the positron impact, provided its impact mass spectroscopy data is available. This is because the BEB model has shown good results for direct ionization due to the positron impact [49,50]. This makes the mass spectrometry an indispensable tool in computing PICS for the leptonic projectiles (electron or positron). The modified BEB currently is not only the simplest working model but also offers a resource-efficient approach to compute the PICS across a wide energy range.

4. Conclusions

The study reports partial ionization cross sections of various cations derived from chlorosilyl radicals. The modified BEB model is capable of providing PICS of any molecule (simple or complex) that dissociates into cations due to ionization without exploring the pathways of their formation. This makes the model extremely simple and easy to implement. It also significantly lowers the computational cost. The mass spectrometry data plays a crucial role and has direct applications in determining the cross sections of individual cations. The results from the modified BEB model are within experimental error limits. This is encouraging, bearing in mind the simplicity of the approach. The BEB model relies on the bound-state properties of the target without explicitly using continuum functions to obtain the electron-impact ionization cross section. The same information can be used further with suitable modification to the BEB model to obtain PICS. A key advantage of this method is its applicability to any complex molecule where the number of channels may be extremely large. The essential requirement of this method is the availability of mass spectrometry data and appearance energies. This will minimize the impact of threshold on cross sections. In the absence of experimental values, quantum mechanical methods can always be used to obtain the dissociation energies of cations, which can be further used to generate PICS. The potential to refine this model within the framework of BEB approach remains.

Author Contributions

Supervision, K.L.B. Calculations, writing, review, and editing, S.K., A.K.A., and A.B. All authors have read and agreed to the published version of the manuscript.

Funding

This research received no external funding.

Data Availability Statement

The data may be obtained from the authors upon request.

Acknowledgments

The authors are also thankful to the University of Delhi for providing the necessary computational and other facilities to carry out the study.

Conflicts of Interest

The authors declare no conflicts of interest.

Abbreviations

DEADissociative electron attachment
DIDissociation ionization
BEBBinary-encounter-Bethe
mBEBModified binary-encounter-Bethe
EIMSElectron impact mass spectrum
ECPEffective core potential
AEAppearance energy
IEIonization energy
DEDissociation energy
PICSPartial ionization cross sections
TICSTotal ionization cross sections
eVelectron volt
HOMOHighest occupied molecular orbital
OOSOptical oscillator strength

References

  1. Srivastava, R.; Fursa, D.V. “Atoms” Special Issue (Electron Scattering from Atoms, Ions and Molecules). Atoms 2023, 11, 31. [Google Scholar] [CrossRef]
  2. Sanche, L. Low energy electron-driven damage in biomolecules. Eur. Phys. J. D 2005, 35, 367–390. [Google Scholar] [CrossRef]
  3. Fabrikant, I.I. Long-range effects in electron scattering by polar molecules. J. Phys. B At. Mol. Opt. Phys. 2016, 49, 222005. [Google Scholar] [CrossRef]
  4. Märk, T.D.; Dunn, G.H. (Eds.) Electron Impact Ionization; Springer: Berlin/Heidelberg, Germany, 1985. [Google Scholar]
  5. Janev, R.K. Atomic and Molecular Processes in Fusion Edge Plasmas; Plenum Press: New York, NY, USA, 1995. [Google Scholar]
  6. Lin, N.; Han, Y.; Wang, L.; Zhou, J.; Zhou, J.; Zhu, Y.; Qian, Y. Preparation of Nanocrystalline Silicon from SiCl4 at 200 °C in Molten Salt for High-Performance Anodes for Lithium Ion Batteries. Angew. Chem. Int. Ed. 2015, 54, 3822–3825. [Google Scholar] [CrossRef]
  7. Li, C.; Yang, Y.; Qu, R.; Cao, X.; Liu, G.; Jin, X.; Liu, Y.; Liu, S.; Jiang, W.; Zhang, X. Recent advances in plasma etching for micro and nano fabrication of silicon-based materials: A review. J. Mater. Chem. C 2024, 12, 18211–18237. [Google Scholar] [CrossRef]
  8. Economou, D.J. Modeling and simulation of plasma etching reactors for microelectronics. Thin Solid Film. 2000, 365, 348–367. [Google Scholar] [CrossRef]
  9. Economou, D.J. Pulsed plasma etching for semiconductor manufacturing. J. Phys. D 2014, 47, 303001. [Google Scholar] [CrossRef]
  10. Donnelly, V.M.; Kornblit, A. Plasma etching: Yesterday, today, and tomorrow. J. Vac. Sci. Tech. A 2013, 31, 050825. [Google Scholar] [CrossRef]
  11. Oehrlein, G.S.; Brandstadter, S.M.; Bruce, R.L.; Chang, J.P.; DeMott, J.C.; Donnelly, V.M.; Dussart, R.; Fischer, A.; Gottscho, R.A.; Hamaguchi, S.; et al. Future of plasma etching for microelectronics: Challenges and opportunities. J. Vac. Sci. Tech. B 2024, 42, 041501. [Google Scholar] [CrossRef]
  12. Starikovskiy, A. Physics and chemistry of plasma-assisted combustion. Phil. Trans. R. Soc. A 2015, 373, 20150074. [Google Scholar] [CrossRef]
  13. Irikura, K.K. Semi-empirical estimation of ion-specific cross sections in electron ionization of molecules. J. Chem. Phys. 2016, 145, 224102. [Google Scholar] [CrossRef] [PubMed]
  14. Goswami, K.; Arora, A.K.; Bharadvaja, A.; Baluja, K.L. Electron impact partial ionization cross sections of methyl alcohol up to 5 keV using the mass spectrometry data. Eur. Phys. D 2021, 75, 228. [Google Scholar] [CrossRef]
  15. Janev, R.; Reiter, D. Collision processes of C2,3Hy and C2,3Hy+ hydrocarbons with electrons and protons. Phys. Plasmas 2004, 11, 780–829. [Google Scholar] [CrossRef]
  16. Hagelaar, G.J.M.; Pitchford, L.C. Solving the Boltzmann equation to obtain electron transport coefficients and rate coefficients for fluid models. Plasma Sources Sci. Technol. 2005, 14, 722. [Google Scholar] [CrossRef]
  17. Cooper, B.; Tudorovskaya, M.; Mohr, S.; O’Hare, A.; Hanicinec, M.; Dzarasova, A.; Gorfinkiel, J.D.; Benda, J.; Mašín, Z.; Al-Refaie, A.F.; et al. Quantemol Electron Collisions (QEC): An Enhanced Expert System for Performing Electron Molecule Collision Calculations Using the R-Matrix Method. Atoms 2019, 7, 97. [Google Scholar] [CrossRef]
  18. Mohr, S.; Tudorovskaya, M.; Hanicinec, M.; Tennyson, J. Targeted Cross-Section Calculations for Plasma Simulations. Atoms 2021, 9, 85. [Google Scholar] [CrossRef]
  19. Albert, D.; Antony, B.; Ba, Y.A.; Babikov, Y.L.; Bollard, P.; Boudon, V.; Delahaye, F.; Del Zanna, G.; Dimitrijević, M.S.; Drouin, B.J.; et al. A Decade with VAMDC: Results and Ambitions. Atoms 2020, 8, 76. [Google Scholar] [CrossRef]
  20. Van Laer, K.; Bogaerts, A. Fluid modelling of a packed bed dielectric barrier discharge plasma reactor. Plasma Sources Sci. Technol. 2016, 25, 015002. [Google Scholar] [CrossRef]
  21. NIST Chemistry WebBook. NIST Standard Reference Database Number 69. Available online: https://webbook.nist.gov/chemistry/ (accessed on 15 March 2025).
  22. Graves, V. BEB-based models for ionisation cross sections of electron and positron impact with diatomic molecules. Eur. Phys. J. D 2024, 78, 56. [Google Scholar] [CrossRef]
  23. Mahoney, J.; Tarnovsky, V.; Becker, K. Electron impact ionization of SiCl2 and SiCl. Eur. Phys. J. D 2008, 46, 289–293. [Google Scholar] [CrossRef]
  24. Gutkin, M.; Mahoney, J.M.; Tarnovsky, V.; Deutsch, H.; Becker, K. Electron-impact ionization of the SiCl3 radical. Int. J. Mass Spectrom. 2009, 280, 101–106. [Google Scholar] [CrossRef]
  25. Deutsch, H.; Becker, K.; Matt, S.; Märk, T.D. Theoretical determination of absolute electron-impact ionization cross sections of molecules. Int. J. Mass Spectrom. 2000, 197, 37. [Google Scholar] [CrossRef]
  26. Luthra, M.; Goswami, K.; Arora, A.K.; Bharadvaja, A.; Baluja, K.L. Mass Spectrometry-Based Approach to Compute Electron-Impact Partial Ionization Cross-Sections of Methane, Water and Nitromethane from Threshold to 5 keV. Atoms 2022, 10, 74. [Google Scholar] [CrossRef]
  27. Goswami, K.; Luthra, M.; Bharadvaja, A.; Baluja, K.L. Partial Ionization Cross Sections of Tungsten Hexafluoride Due to Electron Impact. Atoms 2022, 10, 101. [Google Scholar] [CrossRef]
  28. Hamilton, J.R.; Tennyson, J.; Huang, S.; Kushner, M.J. Calculated cross sections for electron collisions with NF3, NF2 and NF with applications to remote plasma sources. Plasma Sources Sci. Technol. 2017, 26, 065010. [Google Scholar] [CrossRef]
  29. Kim, Y.-K.; Rudd, M.E. Binary-encounter-dipole model for electron-impact ionization. Phys. Rev. A 1994, 50, 3954. [Google Scholar] [CrossRef]
  30. Ali, M.A.; Kim, Y.-K.; Hwang, W.; Weinberger, N.M.; Rudd, M.E. Electron-impact total ionization cross sections of silicon and germanium hydrides. J. Chem. Phys. 1997, 106, 9602. [Google Scholar] [CrossRef]
  31. Wang, Y.-C.; Visentin, G.; Jiao, L.G.; Fritzsche, S. Acceleration correction to the binary-encounter Bethe model for the electron-impact ionization of molecules. Phys. Rev. A 2024, 109, 022804. [Google Scholar] [CrossRef]
  32. Wadt, W.R.; Hay, P.J. Ab initio effective core potentials for molecular calculations. Potentials for K to Au including the outermost core orbitals. J. Chem. Phys. 1985, 82, 299–310. [Google Scholar] [CrossRef]
  33. GAUSSIAN 03; Gaussian, Inc.: Wallingford, UK, 2003; Available online: https://gaussian.com/g03citation/ (accessed on 28 May 2025).
  34. Graves, V.; Cooper, B.; Tennyson, J. The efficient calculation of electron impact ionization cross sections with effective core potentials. J. Chem. Phys. 2021, 154, 114104. [Google Scholar] [CrossRef]
  35. Scott, G.E.; Irikura, K.K. Performance of binary-encounter-Bethe (BEB) theory for electron-impact ionization cross sections of molecules containing heavy elements (Z > 10). Surf. Interface Anal. 2005, 37, 973. [Google Scholar] [CrossRef]
  36. Huo, W.M.; Kim, Y.-K. Use of relativistic effective core potentials in the calculation of total electron-impact ionization cross-sections. Chem. Phys. Lett. 2000, 319, 576. [Google Scholar] [CrossRef]
  37. Kothari, H.N.; Pandya, S.H.; Joshipura, K.N. Electron impact ionization of plasma important SiCl4 (X = 1–4) molecules. J. Phys. B At. Mol. Opt. Phys. 2011, 44, 125202. [Google Scholar] [CrossRef]
  38. Pal, S.; Singh, R.; Kumar, M.; Kumar, N. Ionization cross-sections for C2H2 and C2H5OH by electron-impact. Radiat. Phys. Chem. 2020, 173, 108877. [Google Scholar] [CrossRef]
  39. Zhang, B.; Zhang, J.; Xia, Y.; Chen, P.; Wang, B. Prediction of electron ionization mass spectra based on graph convolutional networks. Int. J. Mass Spectrom. 2022, 475, 116817. [Google Scholar] [CrossRef]
  40. Lemishko, K.M.; Armstrong, G.S.J.; Mohr, S.; Nelson, A.; Tennyson, J.; Knowles, P.J. Machine learning-based estimator for electron impact ionization fragmentation patterns. J. Phys. D 2025, 58, 105208. [Google Scholar] [CrossRef]
  41. Wei, J.N.; Belanger, D.; Adams, R.P.; Sculley, D. Rapid Prediction of Electron–Ionization Mass Spectrometry Using Neural Networks. ACS Cent. Sci. 2019, 5, 2374–7943. [Google Scholar] [CrossRef]
  42. Basner, R.; Foest, R.; Schmidt, M.; Becker, K.; Deutsch, H. Absolute total and partial electron impact ionization cross sections of hexamethyldisiloxane. Int. J. Mass Spectrom. 1998, 176, 245. [Google Scholar] [CrossRef]
  43. Nixon, K.L.; Pires, W.A.D.; Neves, R.F.C.; Duque, H.V.; Jones, D.B.; Brunger, M.J.; Lopes, M.C.A. Electron impact ionisation and fragmentation of methanol and ethanol. Int. J. Mass Spectrom. 2016, 404, 48. [Google Scholar] [CrossRef]
  44. Amorim, R.A.A.; Pires, W.A.D.; Fernandes, A.C.P.; Casagrande, T.M.; Jones, D.B.; Blanco, F.; García, G.; Brunger, M.J.; Lopes, M.C.A. Absolute partial ionization cross sections for electron impact of R-carvone from threshold to 100 eV. Eur. Phys. J. D 2021, 75, 217. [Google Scholar] [CrossRef]
  45. Huber, S.E.; Mauracher, A.; Süß, D.; Sukuba, I.; Urban, J.; Dmitry, D.; Probst, M. Total and partial electron impact ionization cross sections of fusion-relevant diatomic molecules. J. Chem. Phys. 2019, 150, 024306. [Google Scholar] [CrossRef] [PubMed]
  46. Graves, V.; Cooper, B.; Tennyson, J. Calculated electron impact ionisation fragmentation patterns. J. Phys. B At. Mol. Opt. Phys. 2021, 54, 235203. [Google Scholar] [CrossRef]
  47. Luthra, M.; Garkoti, P.; Goswami, K.; Bharadvaja, A.; Baluja, K.L. Electron impact cross-sections of tetraethyl silicate. Plasma Sources Sci. Technol. 2022, 31, 095013. [Google Scholar] [CrossRef]
  48. Arora, A.K.; Gupta, K.K.; Goswami, K.; Bharadvaja, A.; Baluja, K.L. A binary-encounter-Bethe approach to compute electron-impact partial ionization cross sections of plasma relevant molecules such as hexamethyldisiloxane and silane. Plasma Sources Sci. Technol. 2022, 31, 015008. [Google Scholar] [CrossRef]
  49. Fedus, K.; Karwasz, G.P. Binary-encounter dipole Model for positron-impact direct ionization. Phys. Rev. A 2019, 100, 062702. [Google Scholar] [CrossRef]
  50. Franz, M.; Wiciak-Pawlowska, K.; Franz, J. Binary-encounter model for direct ionization of molecules by positron-impact. Atoms 2021, 9, 99. [Google Scholar] [CrossRef]
Figure 1. “(Color online)”. (a) Total ionization cross sections: circle; Mahoney et al. [23], line curve; and BEB (this work). (b) PICS. Square, triangle, and inverted triangle; experimental PICS reported by Mahoney et al. [23] of Cl+, SiCl+, and Si+, respectively. The curves denote this work: dotted dashed curves; Cl+, dashed curve; SiCl+, double dotted dashed curve; Si+, dashed dotted curve; and summed PICS.
Atoms 13 00064 g001
Figure 2. “(Color online)” total ionization cross sections: circle; Mahoney et al. [23], dotted dashed curve; Kothari et al. [37], line curve, renormalized BEB results; dashed curve; BEB results; dashed dotted curve; and summed PICS.
Atoms 13 00064 g002
Figure 3. “(Color online)” partial ionization cross sections. (a) Cl+, Si+. (b) SiCl+, SiCl 2 + . Circle, square, diamond, triangle, and experimental PICS of Mahoney et al. [23]. Theoretical results obtained from modified BEB model are shown by line curves, dashed curve, dashed dotted curves, and double dotted dashed curves.
Atoms 13 00064 g003
Figure 4. “(Color online)” total ionization cross sections of SiCl3: circle; Gutkin et al. [24], line curve; BEB model, dashed curve; and summed PICS.
Atoms 13 00064 g004
Figure 5. “(Color online) ”partial ionization cross sections using the modified-BEB model of various cations of SiCl3 (a) SiCl 3 + and SiCl+ and (b) SiCl 2 + , Si+, and Cl+. Experimental results of Gutkin et al. [24] are indicated by symbols like circle, triangle, square, inverted triangle, and diamond. Lines (dashed, continuous, dotted dashed, double dotted dashed, and dashed dotted) show the results from modified-BEB model.
Atoms 13 00064 g005
Figure 6. “(Color online)” branching ratios of various cations formed due to electron impact ionization or DI of neutral molecules (a) SiCl and (b) SiCl2. Symbols indicate BR obtained using experimental cross section data of Mahoney et al. [23]. Curves indicate BR obtained using theoretical values of cross section data.
Atoms 13 00064 g006
Figure 7. “(Color online)” branching ratios of various cations formed due to electron impact ionization or DI of SiCl3 (a) SiCl 2 + and SiCl+ and (b) SiCl 2 + , Si+, and Cl+. Symbols indicate BR obtained using experimental cross section data of Gutkin et al. [24]. Curves are BR obtained using theoretical values of cross section data.
Atoms 13 00064 g007
Table 1. Input values for computing PICS of SiCl molecule having ionization energy 10 eV.
S. NoIonsAEΔΓ
(eV)(eV)
1.SiCl+12.02.00.4302
2.Si+19.09.01.108
3.Cl+16.06.00.530
Table 2. Input values for computing PICS of SiCl2 molecule having ionization energy 10.3 eV.
S. NoIonsAEΔΓ
(eV)(eV)
1. SiCl 2 + 10.300.3841
2.SiCl+11.00.70.4838
3.Si+18.07.70.8571
4.Cl+16.05.70.7713
Table 3. Input values for computing PICS of SiCl3 molecule having ionization energy 12.3 eV.
S. NoIonsAEΔΓ
(eV)(eV)
1. SiCl 3 + 12.300.16187
2. SiCl 2 + 13.00.70.1967
3.SiCl+14.802.50.3630
4.Si+17.04.70.1906
5.Cl+19.06.70.5602
Disclaimer/Publisher’s Note: The statements, opinions and data contained in all publications are solely those of the individual author(s) and contributor(s) and not of MDPI and/or the editor(s). MDPI and/or the editor(s) disclaim responsibility for any injury to people or property resulting from any ideas, methods, instructions or products referred to in the content.

