1. Introduction
The development of high-power femtosecond lasers in the near-infrared (NIR) range over the past two decades has enabled the exploration of a variety of nonlinear and multiphotonic processes, where multiple photons can be emitted or absorbed, such as above-threshold ionization (ATI) and high-order harmonic generation (HHG) [
1].
The discovery of the latter has not only paved the way for the use of primary IR sources to produce intense coherent radiation ranging from ultraviolet to extreme ultraviolet (XUV), as shown by the pioneering work of Schultze et al. and Klünder et al. [
2,
3], but it has also expanded the study of ionization by introducing the possibility of using two laser fields of different frequencies [
4]. When combining a harmonic field with its fundamental laser field, it becomes possible to explore new physical phenomena, pushing the study of ionization beyond the limits of the single laser field.
The results, whether theoretical or experimental, related to the process of atomic ionization, can vary depending on numerous parameters, such as the intensity of the laser, its frequency, or the polarization of the field. These results can be analyzed using advanced spectroscopy techniques [
5] or theoretical models, with the aim of deepening the understanding of atomic processes and laser–matter interactions. They significantly contribute to the enrichment of knowledge in atomic physics and spectroscopy, while paving the way for potential technological applications.
Remarkable physical effects appear, particularly when the atom is simultaneously subjected to an intense infrared pulse and one of its harmonics in the XUV range. The absorption of an XUV photon allows an electron to access the continuum, followed by the exchange of infrared photons between different states. These processes manifest in photoelectron spectra (PES) through the appearance of equidistant satellite peaks around the main peak corresponding to the absorption of an XUV photon.
To describe these processes, we adopt a rigorous theoretical approach to model the interaction between the atom and the laser field. The numerical solution of the time-dependent Schrödinger equation (TDSE) constitutes the most effective tool for representing atomic dynamics under an intense laser field, while exploiting advanced numerical methods. We use the single active electron (SAE) approximation, which simplifies the problem by neglecting electron–electron interactions, as only one electron (the valence electron) is primarily involved in the ionization dynamics. This approximation allows for an accurate description of the evolution of the system’s wave function under the influence of the external laser field. A similar approach was employed by Ivanov and Kheifets [
6] for the helium atom in the context of a RABBITT study. In our case, the analysis focuses on the argon atom, for which an effective potential is carefully adjusted based on reproducing its atomic properties.
At the end of the laser–atom interaction, the PES are obtained by spectral analysis of the final wave function, which is obtained by resolving the TDSE. Several theoretical approaches can be used to determine this PES, such as the Fourier transform of the wave function [
7], the standard projection technique [
8], and the window operator method proposed by Schäfer et al. [
9]. The latter was selected due to its numerical efficiency in directly extracting the electronic energy distributions without explicitly calculating the continuum wave functions.
Thanks to this ab initio approach, we were able to simulate the multiphotonic and two-color ionization mechanisms of the argon atom by modifying the intensities of the near-infrared laser field. The PES resulting from these processes will exhibit several peaks, whose positions are determined by the law of conservation of energy, provided that the dynamic Stark shifts of the ionization threshold [
10], induced by the ponderomotive force
of the laser field, are correctly taken into account. It is important to remember that, in the multiphotonic ionization process, the infrared laser field acts as the main ionization field, whereas, in two-color ionization, it serves as the dressing field.
To go further, it is also necessary to take a closer look at the angular distributions associated with the observed peaks. This analysis not only allows for a better understanding of the angular structure of the photoelectron continuum but also helps to grasp the effects induced by the intensity of the infrared laser field. These distributions thus become a powerful tool for highlighting interference phenomena, particularly when multiple electron trajectories simultaneously contribute to the generation of photoelectrons.
The interpretation of these observations is based on the formalism of the generalized Fano rule [
11], which describes the preferential transitions in the continuum of laser-assisted photoionization. Although our approach differs from the angular-channel-resolved perturbative treatment used in that reference, this theoretical framework has proven useful in interpreting the angular patterns observed in our simulations, thus allowing the angular distributions to be linked to the dynamic properties of the system [
12].
This contribution aims to analyze the complex angular and energy patterns observed during the intense field ionization of the argon atom. It should be noted that the marked dependence of photoelectron energy and angular distributions on the intensity of the infrared laser field is quantitatively taken into account within the framework of the single active electron approximation.
2. Formal Theory
As mentioned at the beginning of this manuscript, we need to solve the time-dependent Schrödinger equation (TDSE) to understand how the system interacts with the laser field over time.
Our study focuses on multi-photon ionization processes, including both single-color multi-photon ionization and two-color ionization in multi-electron atoms. Due to the complexity of analytical and numerical calculations, we have opted for an approximate approach using the single active electron (SAE) model. In this model, the atom’s inner electrons are assumed to be “frozen” in their ground states, which simplifies the calculations by considering only the interaction between the active electron (valence electron) and the nucleus, defined by a suitable model potential, without taking into account the direct interaction between the inner electrons and the nucleus.
The Schrödinger equation cannot be solved with high precision for multi-electron atomic systems due to the inability to mathematically manage the repulsion energy terms of the potential energy of such systems with analytical precision. According to approximate numerical methods based on the single active electron (SAE) approach, such systems can be handled with good precision by reducing the problem to a single-electron equation, expressed in atomic units (
)
with
being the unperturbed Hamiltonian for the atom, and
representing the atom–field interaction. The operator
refers to the Laplacian written in atomic units (a.u.) and spherical coordinates
as
denotes the angular momentum operator.
In Equation (
2),
denotes the model potential that describes the coulombic interaction between the active electron and the nucleus, where
r is the electron–nucleus distance.
The model potential used in our calculations is well suited to rare gas atoms with a single active electron and takes the following form [
13]
where
Z represents the nuclear charge, and the parameters of the model potential (see
Table 1) are obtained by numerically solving the Stationary Schrödinger Equation (SSE), by diagonalizing the Hamiltonian
in spherical coordinates using the QL method [
14]. The energies thus calculated were then compared with experimental data from the NIST (National Institute of Standards and Technology) atomic spectra database [
15].
The other Hamiltonian term,
, shown in Equation (
1), represents the interaction between the laser field and the atomic system. Its expression depends on the choice of gauge: in the length gauge,
, whereas in the velocity gauge,
.
The length gauge has been used to make the calculations easier, which requires a high angular momentum value
. This choice allows us to express the TDSE (Equation (
1)) in spherical coordinates, as
3. Numerical Solution of the TDSE
The methodology adopted for the numerical resolution of the TDSE involves several steps. First, the wave function
was expanded using the spherical harmonics basis
, allowing the radial dependence
r to be separated from the angular dependence
when solving the TDSE. In this way, the wave function is expressed in terms of spherical harmonics according to the following relation:
where
represents the radial part of the wave function, dependent only on distance
r and time
t, while
designates the spherical harmonics that define the angular dependence.
For a linearly polarized field aligned along the
axis, the interaction Hamiltonian in the length gauge can be expressed using the position operator in spherical coordinates
where
represents the polarization angle of the electric field with respect to the
z-axis.
This choice of polarization imposes the transitions permitted by the electric dipolar selection rules, which apply to magnetic m and orbital ℓ quantum numbers ( and ).
In the angular momentum basis, the matrix element associated with the interaction Hamiltonian
is written as
where the coefficient
is defined by
Using Equations (6) and (8) above, and with the change of variable
, the radial form of the TDSE is generated as follows
The numerical solution of Schrödinger’s equation, whether time-dependent or time-independent, requires the discretization of space and time on a grid. In other words, it involves selecting a finite number n of points in the spatial domain and N points in the temporal domain to approximate the exact solution at the points of the discretization.
Applying the finite difference method to discretize the Laplacian operator (related to kinetic energy) stably and accurately, the unperturbed Hamiltonian
is discretized in matrix form. This allows efficient numerical resolution of quantum systems exposed to an intense laser field and the discretized TDSE (Equation (
10)) then becomes
The coefficients
and
are defined as follows:
where
is the radial grid point.
These coefficients are introduced to adapt the three-point finite difference approximation of the radial kinetic operator near the boundary, where the spherical coordinate system requires special attention. As the radial distance increases, i.e., for larger values of , both coefficients and asymptotically approach unity, recovering the standard finite difference scheme.
System (11) shows that the matrix is tridiagonal concerning the grid index i and diagonal in the angular momentum basis ℓ. Conversely, the matrix is tridiagonal in the angular momentum basis ℓ and diagonal concerning the index i.
To guarantee the reliability of the results, we ensure the convergence of the approximation method used. Regular checks are carried out to ensure that the wave function obtained satisfies the following normalization condition
The formal solution of TDSE (Equation (10)) describing the propagation of the wave function in time is given by
The approximation of this solution is a function of the choice of the exponential term approximation method. Although the Crank–Nicholson method offers optimal convergence for tridiagonal linear systems, it is not suitable for our study of laser–argon interaction, where the Hamiltonian becomes non-tridiagonal due to the size of the system. An alternative implicit method is therefore required, based on decomposing the total Hamiltonian
H into two sub-Hamiltonians,
and
. This method, inspired by Crank–Nicholson, also uses the Cayley form to approximate the exponential operator
for sufficiently small
, while maintaining numerical stability through operator splitting. The exponential operator is then expressed as
where the
error arises from the second-order Taylor expansion of the exponential terms.
This approach, known as the Alternate Direction Implicit (ADI) method, is stable and exploits the ability to easily invert the tridiagonal matrices of
and
, whose spatial derivatives are approximated using the finite difference method. Applying this approach to the period
, the TDSE solution is
Denoting
the discrete value of the wave function at point
and time
, and
the function at time
, the discretised solution is then written
where
I is the unit matrix.
To facilitate the process of solving this equation, it can be rewritten using the following formula
The resolution method used will be essentially iterative. Each time iteration requires the calculation of the wave function on the grid , from , by solving the system (18).
5. Multiphoton Ionization Process
We are interested here in the multiphoton ionization process, a process in which the atom can ionize by absorbing multiple photons of energy a.u., with this energy, attributed to a single photon, being much smaller than the atom’s ionization potential, i.e., .
The multiphoton ionization and tunneling regimes can be distinguished using the Keldysh parameter
[
17], defined as the ratio of the time
required for an electron to tunnel through the potential barrier to the optical period of the laser
. This parameter also depends on the ionization potential
and the ponderomotive energy shift
, as given by the relation
where
is the ionization energy, and
is the ponderomotive energy, which can be interpreted as the average energy a free electron gains during its oscillation in the laser field. The latter depends on the intensity and frequency of the laser field and is expressed in atomic units as
The system is in the multiphoton regime if
. According to Equation (
21), the operating condition for this regime is then
.
Given that the frequency of the near-infrared laser (NIR) is low compared to the timescales characteristic of electronic dynamics, it can be assumed that the electron reacts instantly to field variations. Depending on the intensity of the field, the electrons will oscillate in this field until they can be ionized and reach the continuum with low energy. The required NIR intensities must be sufficiently high for the laser field potential to meet the condition that allows ionization by tunneling, potential barrier suppression, or multiple photon absorption.
When the intensity of the laser field becomes large enough to lower the potential barrier to the point where it disappears completely, the electron is released without requiring a multiphoton absorption process. The corresponding intensity, called the barrier suppression intensity and denoted
, can be calculated from the following expression
For the argon atom, whose ionization potential is
eV, this intensity is estimated at
Thus, in the case of multiphoton ionization of the argon atom, the laser field intensity must remain lower than , i.e., eV. When this condition is met, the ionization process is dominated by multiphoton absorption rather than barrier suppression.
The interaction is described within a semi-classical model, where the electric field is treated classically. We place ourselves in the dipole approximation (long-wavelength approximation, , where is the Bohr radius), with laser intensities not exceeding , corresponding to the boundary between the multiphoton and tunnel regimes.
In this study, we work with near-infrared (NIR) lasers, which generally have a central wavelength of around 800 nm, ensuring that the long-wavelength approximation remains valid.
The representation of the electric field
, with a maximum amplitude
and frequency
, can then be expressed as
with
, the unit vector of the electric field associated with the laser field along the
direction, and
, the envelope of the laser pulse, which can be chosen in the form of a square-sine or trapezoidal function.
The total duration of the pulse,
, is defined from the laser period
by the following expression
For a trapezoidal envelope of
optical cycles, with
m cycles in ascent,
cycles in the plateau (constant) and
m cycles in descent, the function
is given by the following form (see
Figure 1)
With a laser pulse of frequency a.u., a single infrared photon cannot ionize the argon atom from its ground state 3p, where the electron has an energy of a.u., corresponding to an ionization threshold of 15.76 eV for the transition from the ground state to the ionized state.
Suppose the atom absorbs
N photons of energy
, and this energy exceeds the ionization energy
of the electron. In that case, the electron is ejected from the atom, reaching the continuum and causing ionization via a multiphoton ionization process. For a low laser field intensity, the number
N of photons required for ionization is given by
where
represents the integer part of
x.
This relation indicates that at least 11 infrared photons are required to reach the ionization threshold of the argon atom and induce its ionization.
For higher laser intensity, the ponderomotive potential
becomes large enough to induce a shift in the atomic levels, a phenomenon known as the Stark effect. This ponderomotive shift modifies the ionization threshold of the argon atom by an amount of the order of
. Consequently, the number of photons required to ionize the argon atom increases and is rewritten as follows
This means that for sufficiently high laser intensity, ionization of the argon atom will require more than 11 photons. The following inequality can express this condition
Once the electron is ejected into the continuum, it acquires an initial kinetic energy that depends on the number of absorbed photons. According to the law of energy conservation, this energy is given by the difference between the total absorbed energy and the ionization potential of the atom shifted by
. It is expressed as
As mentioned above, the minimum number of photons required to ionize the atom, denoted by
N, increases with the laser field intensity. Therefore, a higher intensity implies the absorption of more infrared photons than
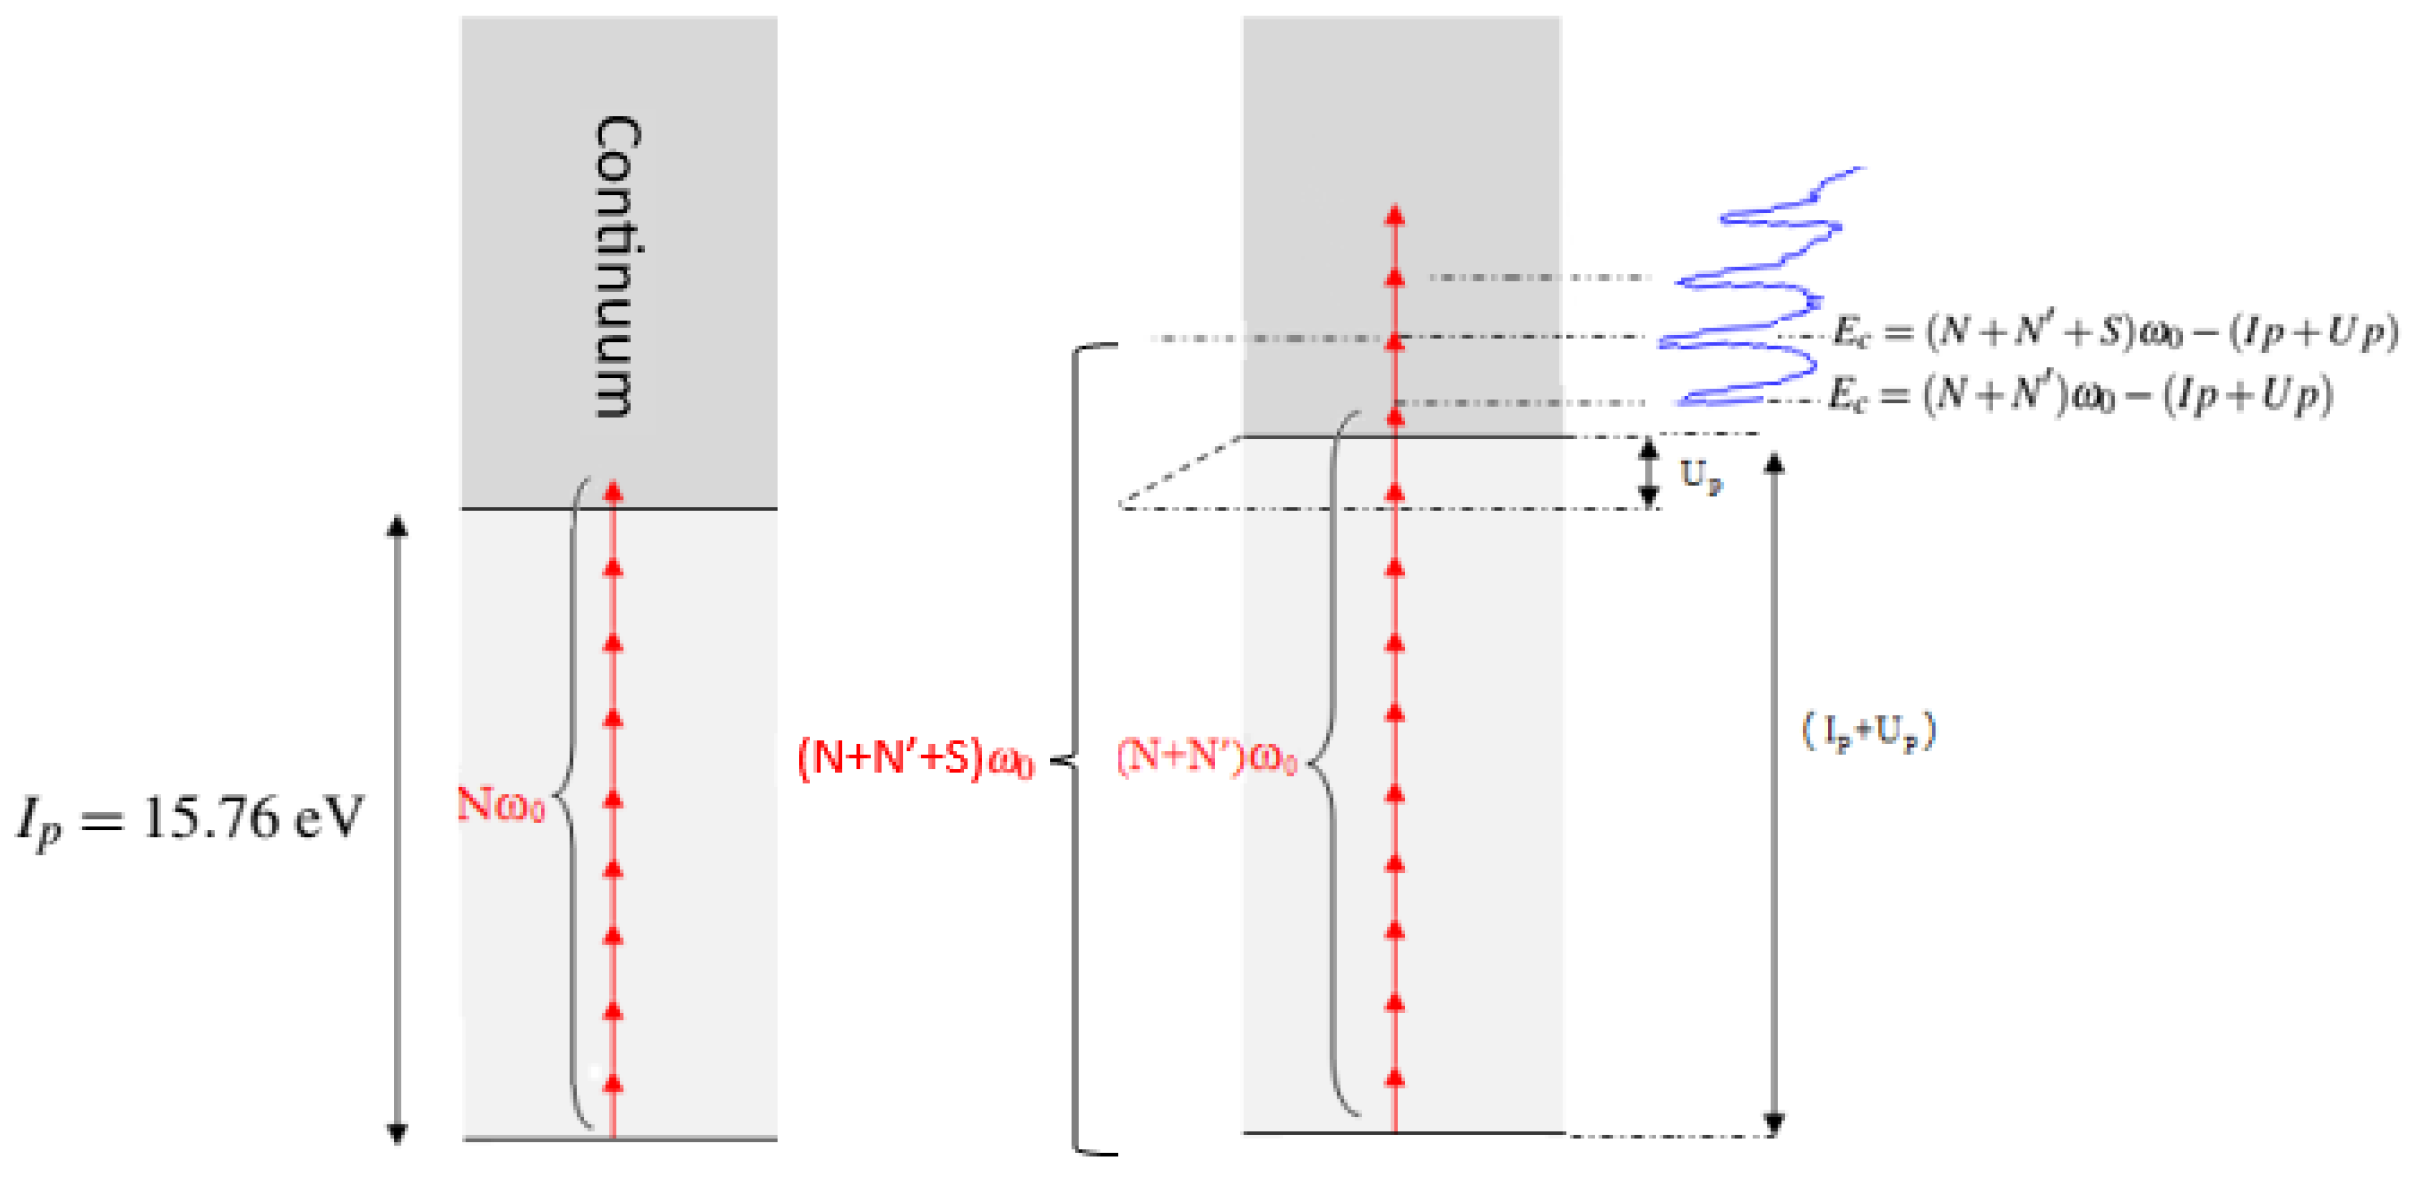
N to ionize the atom. Furthermore, in the continuum, the electron can interact with the laser field and absorb a number S of additional photons, giving it excess energy beyond that required for ionization (
Figure 2). This phenomenon, known as ATI, leads to a kinetic energy of the ejected electron that adjusts to become
with
the number of additional photons for ionization, compared to the low-field situation, and S the number of additional photons absorbed beyond that required for ionization.
The one-color multiphoton ionization simulation results, obtained using TDSE resolution, will be used to analyze PES. These have revealed the characteristic signatures of ionization processes induced by several infrared photons. This information is crucial for understanding the dynamics of electrons interacting with intense laser fields.
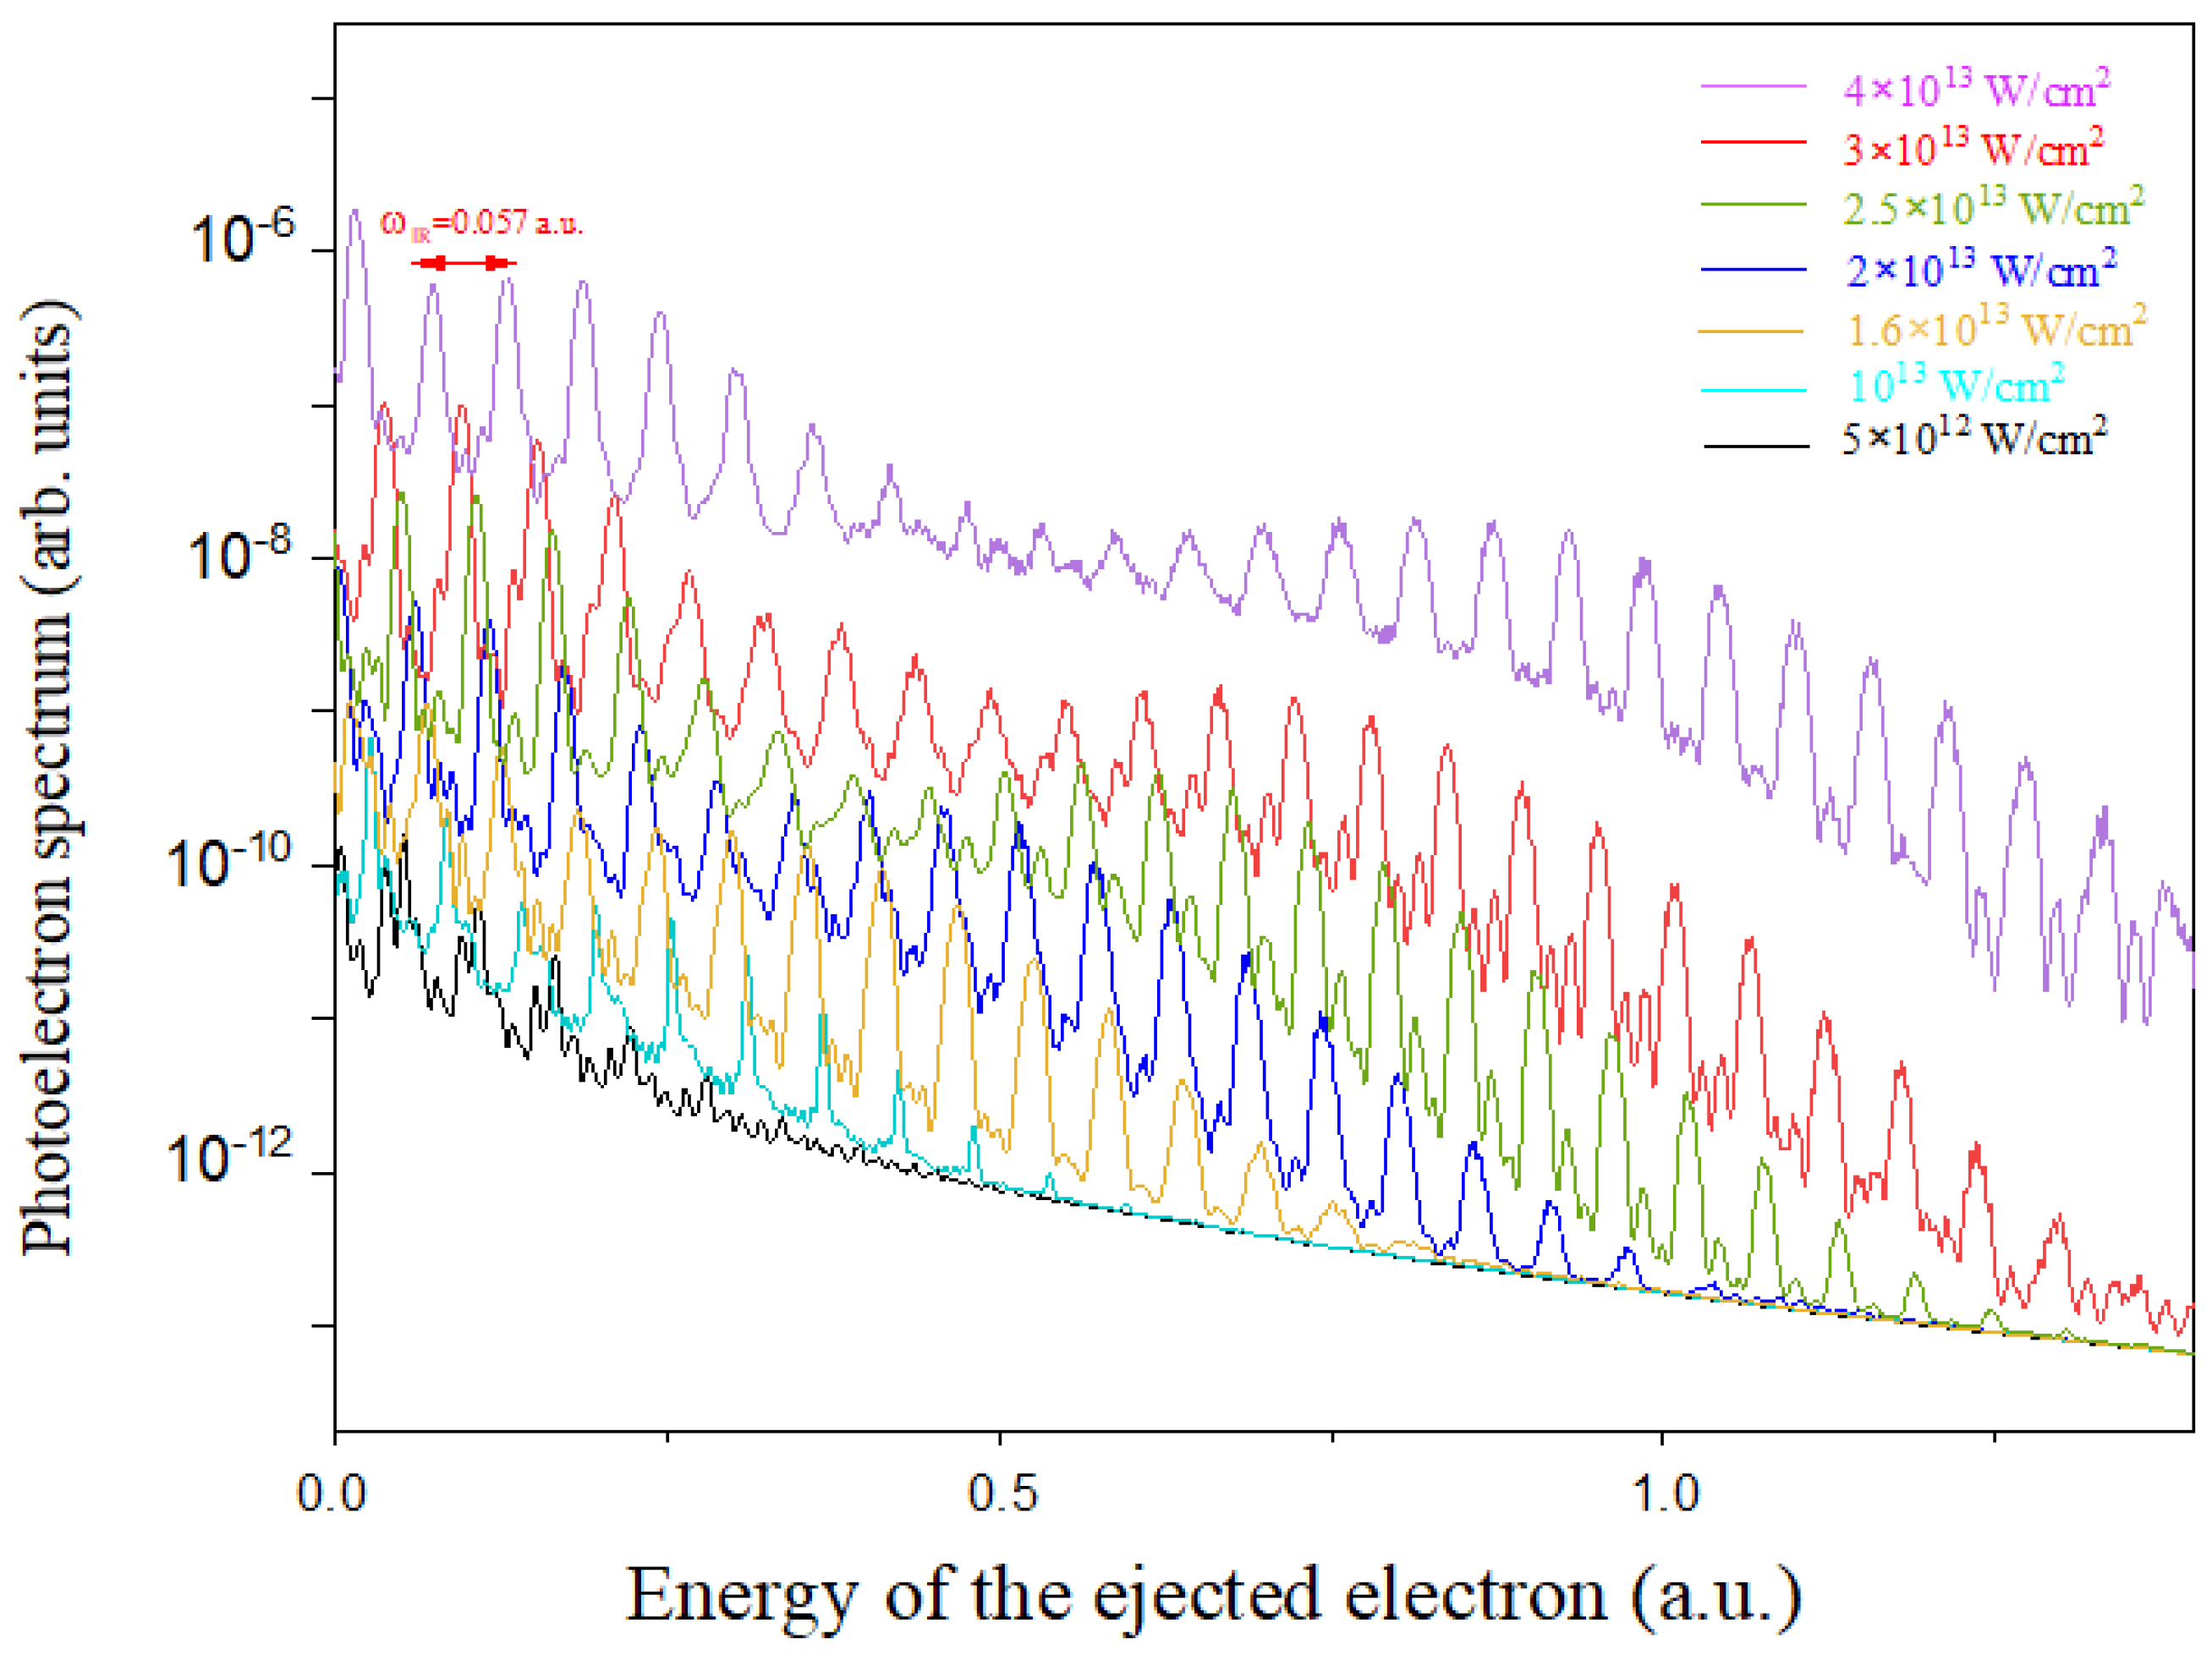
The results shown in
Figure 3 present PES resulting from ionization of the argon atom from the
ground state, induced by a laser pulse with frequency
a.u. and duration
at various intensities. The analysis reveals distinct peaks emerging at intensities above
. For each intensity, we obtain a well-defined spectrum where the first peak corresponds to the multiphoton ionization of the argon atom, while the other peaks are attributed to the ATI phenomenon, indicating the absorption of additional photons above the ionization threshold. As a result, the peaks are regularly spaced by the energy of the incident photon
. Moreover, increasing the laser intensity generates additional ATI peaks and extends the spectrum to higher energies.
Based on the ionization potential of argon (
eV) and the laser field intensity, we expect to observe peaks at the energies predicted by Equation (
32). Our analysis focuses on the first two peaks in each spectrum. The first corresponds to the absorption of
photons, which is the minimum required to overcome the ionization threshold, while the second arises from the absorption of one additional photon beyond that threshold.
Table 2 compares the kinetic energies extracted from the numerical simulations (from the peak positions in
Figure 3) with the theoretical values calculated using the system parameters.
When accounting for the numerical precision introduced by the analysis window width ( a.u.), the kinetic energies extracted from the TDSE simulations show excellent agreement with the theoretical values predicted by the analytical relation. This consistency confirms the validity of the energy conservation approach used to interpret the photoelectron spectra.
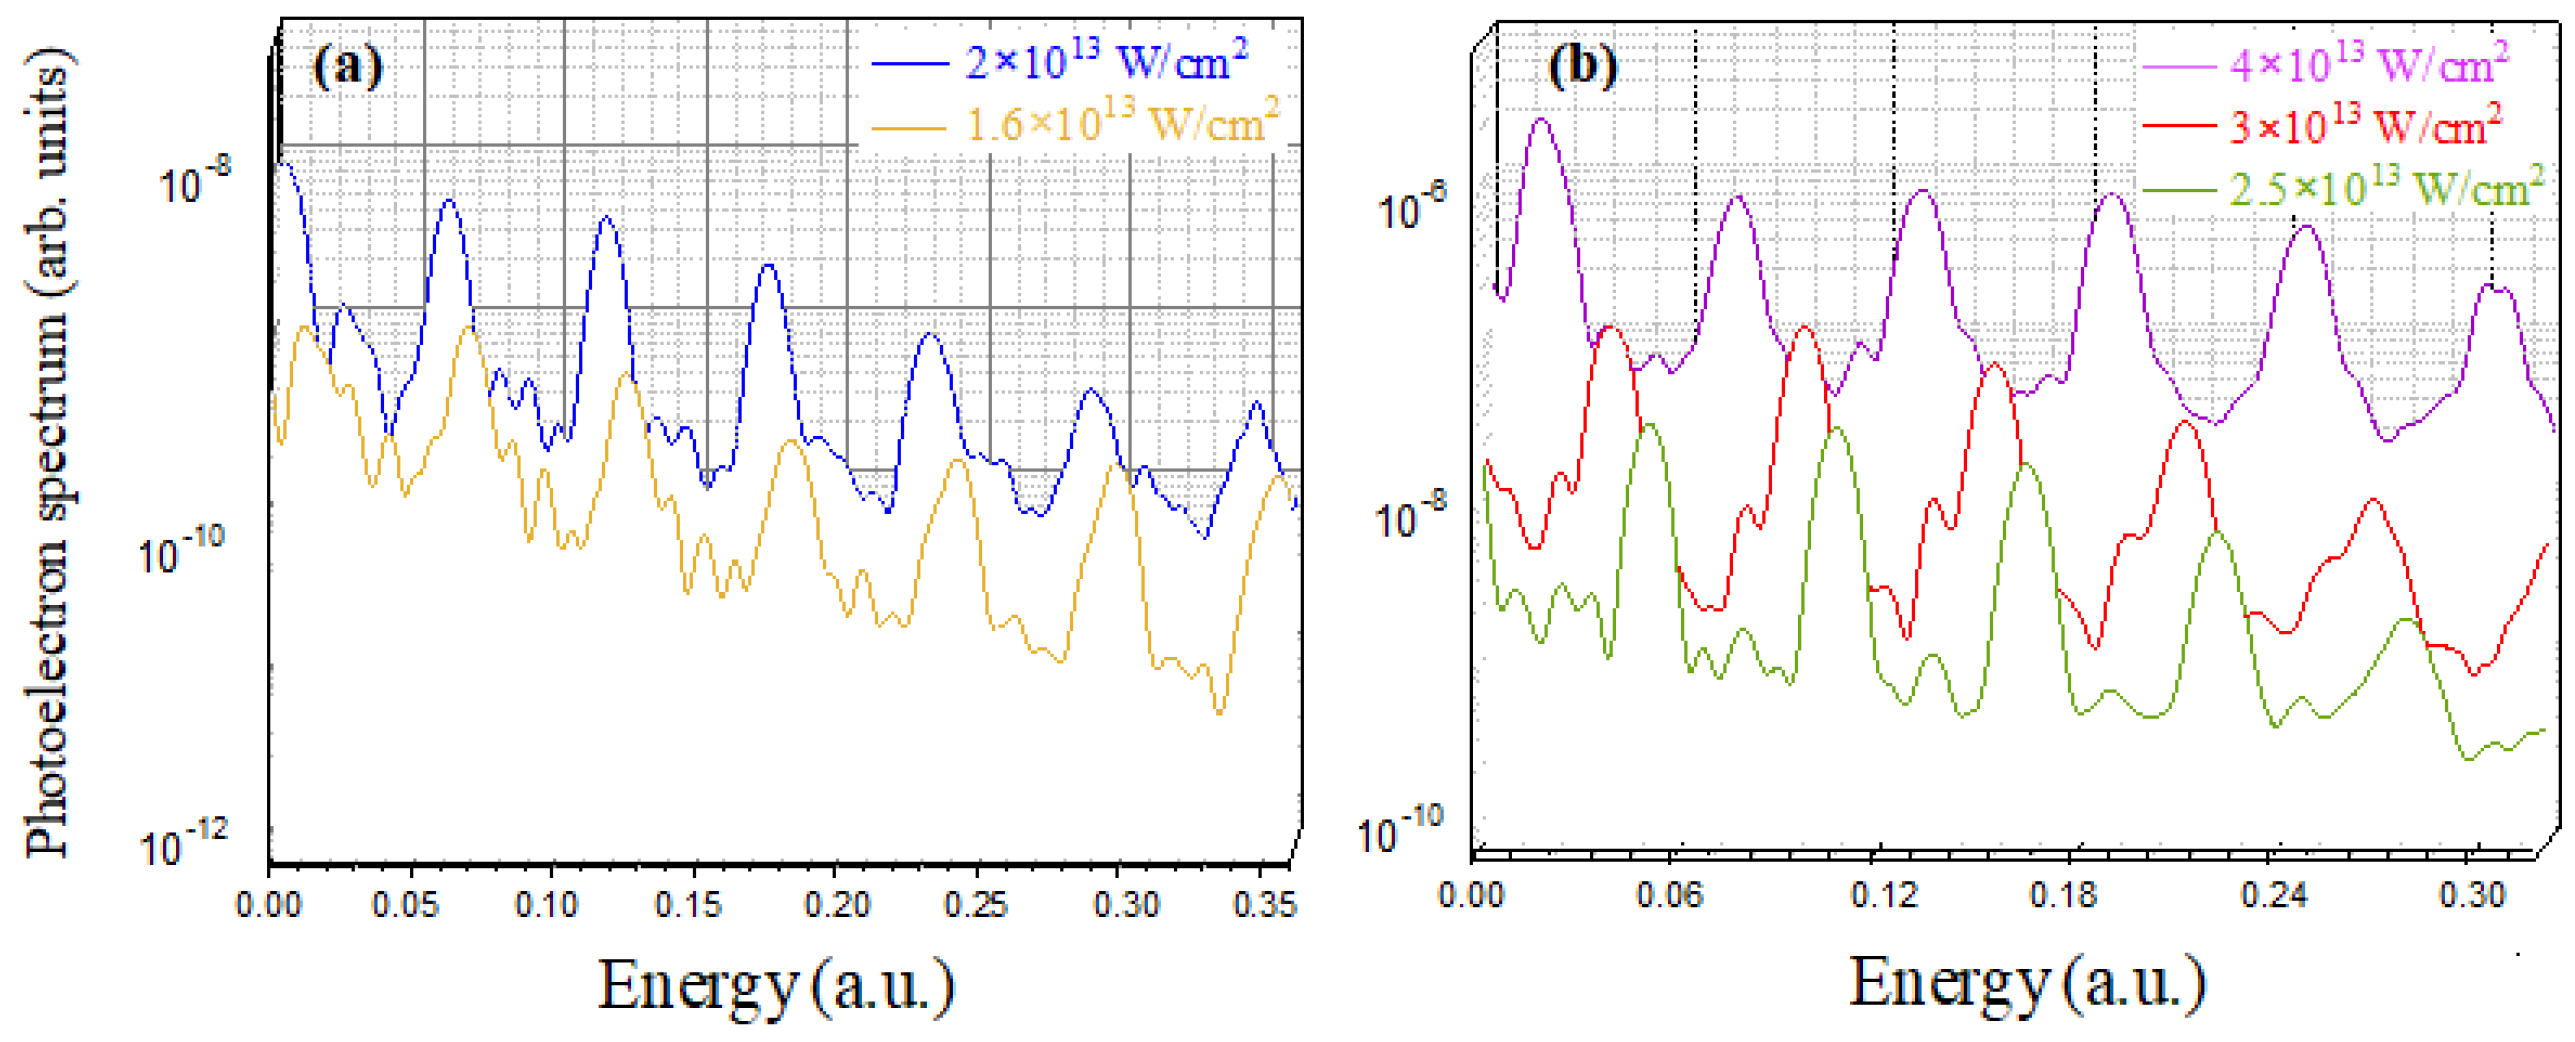
The ionization of the argon atom requires a minimum of 11 photons. However, as mentioned earlier, when the laser intensity exceeds (corresponding to a ponderomotive energy a.u.), ionization requires the absorption of additional photons beyond this minimum threshold.
Figure 4a, demonstrates that while the absorption of 11 photons is sufficient for ionization at low intensity, increasing the laser intensity causes a shift in the kinetic energy peaks
toward lower energies. This shift indicates that, at high intensities, ionization can only occur after the absorption of an additional photon (
Figure 4b). Consequently, the total number of photons required for atomic ionization increases with laser field intensity, highlighting the impact of the weighting energy on the ionization process.
6. Two-Color Ionization
The results obtained in the multiphoton ionization regime by the NIR (near-infrared) field provide the basis for the study of the XUV-NIR two-color ionization process. In this study, an argon atom is simultaneously exposed to extreme-ultraviolet radiation (XUV) and to an intense and synchronised near-infrared laser field (NIR).
Analysis of the PES, representative of two-color XUV-NIR ionization processes, revealed a central peak associated with ionization by a single XUV photon, surrounded by additional peaks known as sidebands (SB), regularly spaced by the energy of the NIR photons (). These sidebands are attributable to the exchange (absorption/emission) of one or more photons in the NIR pulse.
To study the photoionization of the argon atom within the single active electron approximation, it is essential to select an appropriate photon energy. This energy must be sufficiently high to ionize the electron from the ground state (), meaning it must be greater than the ionization potential , while avoiding any impact on the other electronic shells.
The range of photon energies is chosen to bypass the effects of the Cooper minimum, which occurs between 45 and 60 eV. Thus, we use photons with energies either below 45 eV or above 60 eV. This selection allows for an optimal study of ionization by avoiding the reduction in the cross-section associated with this minimum. Furthermore, it is crucial not to approach eV too closely to ensure efficient ionization.
For the numerical simulation of the two-color photoionization process, we considered a laser field combining a fundamental infrared beam ( eV) from a Ti: Sapphire laser and its 15th harmonic frequency (corresponding to an energy of eV, in the XUV range). The frequency of the latter is chosen high enough to allow the ionization of an atom by a single photon while keeping the energy of the XUV photons far enough away from the threshold of eV. This ensures the distinct appearance of the sidebands characteristic of two-colour XUV-NIR processes.
The shape of the resulting electric field can be expressed as follows
Both fields have the same linear polarization along the quantization axis z and the same total duration
.
where
and
represent the amplitudes of the IR and XUV fields, respectively.
From a theoretical point of view, when the atom is subjected only to the harmonic field
, with a frequency
, and the intensity is low, the absorption of a single photon can ionize the atom. The released electron then acquires a kinetic energy determined by the law of conservation of energy, according to the following relation
When an IR laser pulse is combined with the XUV field, new nonlinear photoionization transitions become accessible, with their accessibility depending on the intensity of the IR field. These two-color processes involve either the simultaneous absorption of a high-frequency harmonic photon and a low-frequency infrared (IR) photon, or the absorption of a harmonic photon accompanied by the stimulated emission of an IR photon. In both cases, they lead to the appearance of sidebands () in the photoionization spectrum, symmetrically distributed around the central harmonic peak.
The positions of these photoelectron peaks are shifted to the left by an amount
due to the dynamic Stark effect on the ionization threshold. This quantity is primarily induced by the intense infrared laser field, given its lower frequency and the fact that the XUV field’s intensity is relatively weaker, as explained in the previous section (for a detailed understanding, see [
18]). The energy shift appears equally for both the central harmonic peak and all sidebands. The corresponding kinetic energies are then given by the following expressions
where “n” is an integer representing the number of IR photons, whether absorbed or emitted.
Our objective here is to analyze the impact of the IR laser pulse on the photoionization process of the argon atom through two-color interaction (XUV + IR), within the framework of the SAE approximation. For this purpose, we fixed the intensity of the XUV pulse at
, and varied that of the IR pulse. The simulation results are presented in
Figure 5. As shown in this figure, in the absence of the infrared field (red curve), a single photoelectron peak is observed, corresponding to the photoionization of argon by absorption of a single XUV photon. This peak is located at the energy
(see
Table 3). The value obtained by the simulation agrees closely with that predicted by relation (35), confirming the validity of the theoretical model used in the simulation.
The introduction of the IR field leads to a significant modification of the spectrum, marked by the appearance of more distinct satellite peaks separated by the same amount of energy . These peaks are associated with the additional exchange of IR photons through absorption processes () or stimulated emission (). They become clearly visible starting from an intensity of . Beyond this value, the number of satellite peaks increases significantly with the IR laser intensity, including the appearance of higher-order sidebands(, , etc.). This evolution illustrates the dependence of the number of peaks N on the intensity of the infrared field, following the qualitative relation .
Moreover, another noteworthy observation highlights the effect of the infrared field intensity on the dynamics of two-color photoionization, namely, the increase in the number of satellite peaks accompanied by a gradual decrease in the intensity of the harmonic peak. This reduction is associated with the fact that the introduction of the IR field leads to a redistribution of the ionization probability, initially concentrated on the direct path (absorption of a single XUV photon), between the direct and the lateral paths , which leads to a probability transfer and therefore to a decrease in the intensity of the main harmonic peak and an increase in the number and intensity of satellite peaks in the spectrum.
Notably, the analysis of
Figure 5 (zoomed area) reveals a shift of the harmonic peaks maxima towards lower energies by an amount
. This observation is accompanied by a similar shift of the satellite peaks, thus illustrating the effect of the oscillation energy acquired by the electron in the IR field. This shift becomes more pronounced for both types of peaks as the laser intensity increases.
The numerical results obtained by simulation are compared with those from the analytical relations (36) and (37), as shown in
Table 3, where the kinetic energy values are presented for certain intensities, both for the harmonic peak and for the
satellites.
The discrepancy between the two results is of the order of a.u., which corresponds to the value of used in the window operator during the numerical treatment. This deviation reflects the level of precision achieved in our photoelectron spectra and confirms the reliability of the methods employed to simulate the photoionization process.
7. Photoelectron Angular Distribution
Understanding the mechanisms involved requires examining the angular distribution of the emitted electron with respect to the polarization direction, based on its energy spectrum. Different methods exist to calculate the angular distributions of photoelectrons produced during two-color photoionization, such as the one based on calculating the photoelectron flux in a given energy window. We opted for a simple method based on projecting the final wavefunction
onto discretized continuum eigenstates
, associated with the energy
. Thus, the differential ejection cross-section of a photoelectron of energy
in the solid angle
is given by
where
represents the final continuum state in the emission direction
,
denotes the electronic state at the instant of maximum ionization in the same direction, and
is the unit radial vector in spherical coordinates corresponding to the photoelectron emission direction.
In our case, taking into account the cylindrical symmetry of the problem, the solid angle reduces to the angle
, defined as the angle between the polarization direction of the fields, chosen parallel to the Oz axis, and the photoelectron wave vector
. The integrated angular distribution on a spectral peak (harmonic or sideband) is deduced by coherent summation of the individual contributions to each energy
. The angular distribution of a peak, whether harmonic or satellite, is obtained by the summation of the angular distributions of energies corresponding to points of this peak
In accordance with the Fano rule, at low near-infrared field intensity (NIR), the structure of the angular distribution of the main peak, associated with XUV single-photon absorption photoionization, exhibits a well-known dipolar character, corresponding mainly to the transition
[
12]. The ejected electron then exhibits an orbital angular momentum of
.
Restricting ourselves to the case where
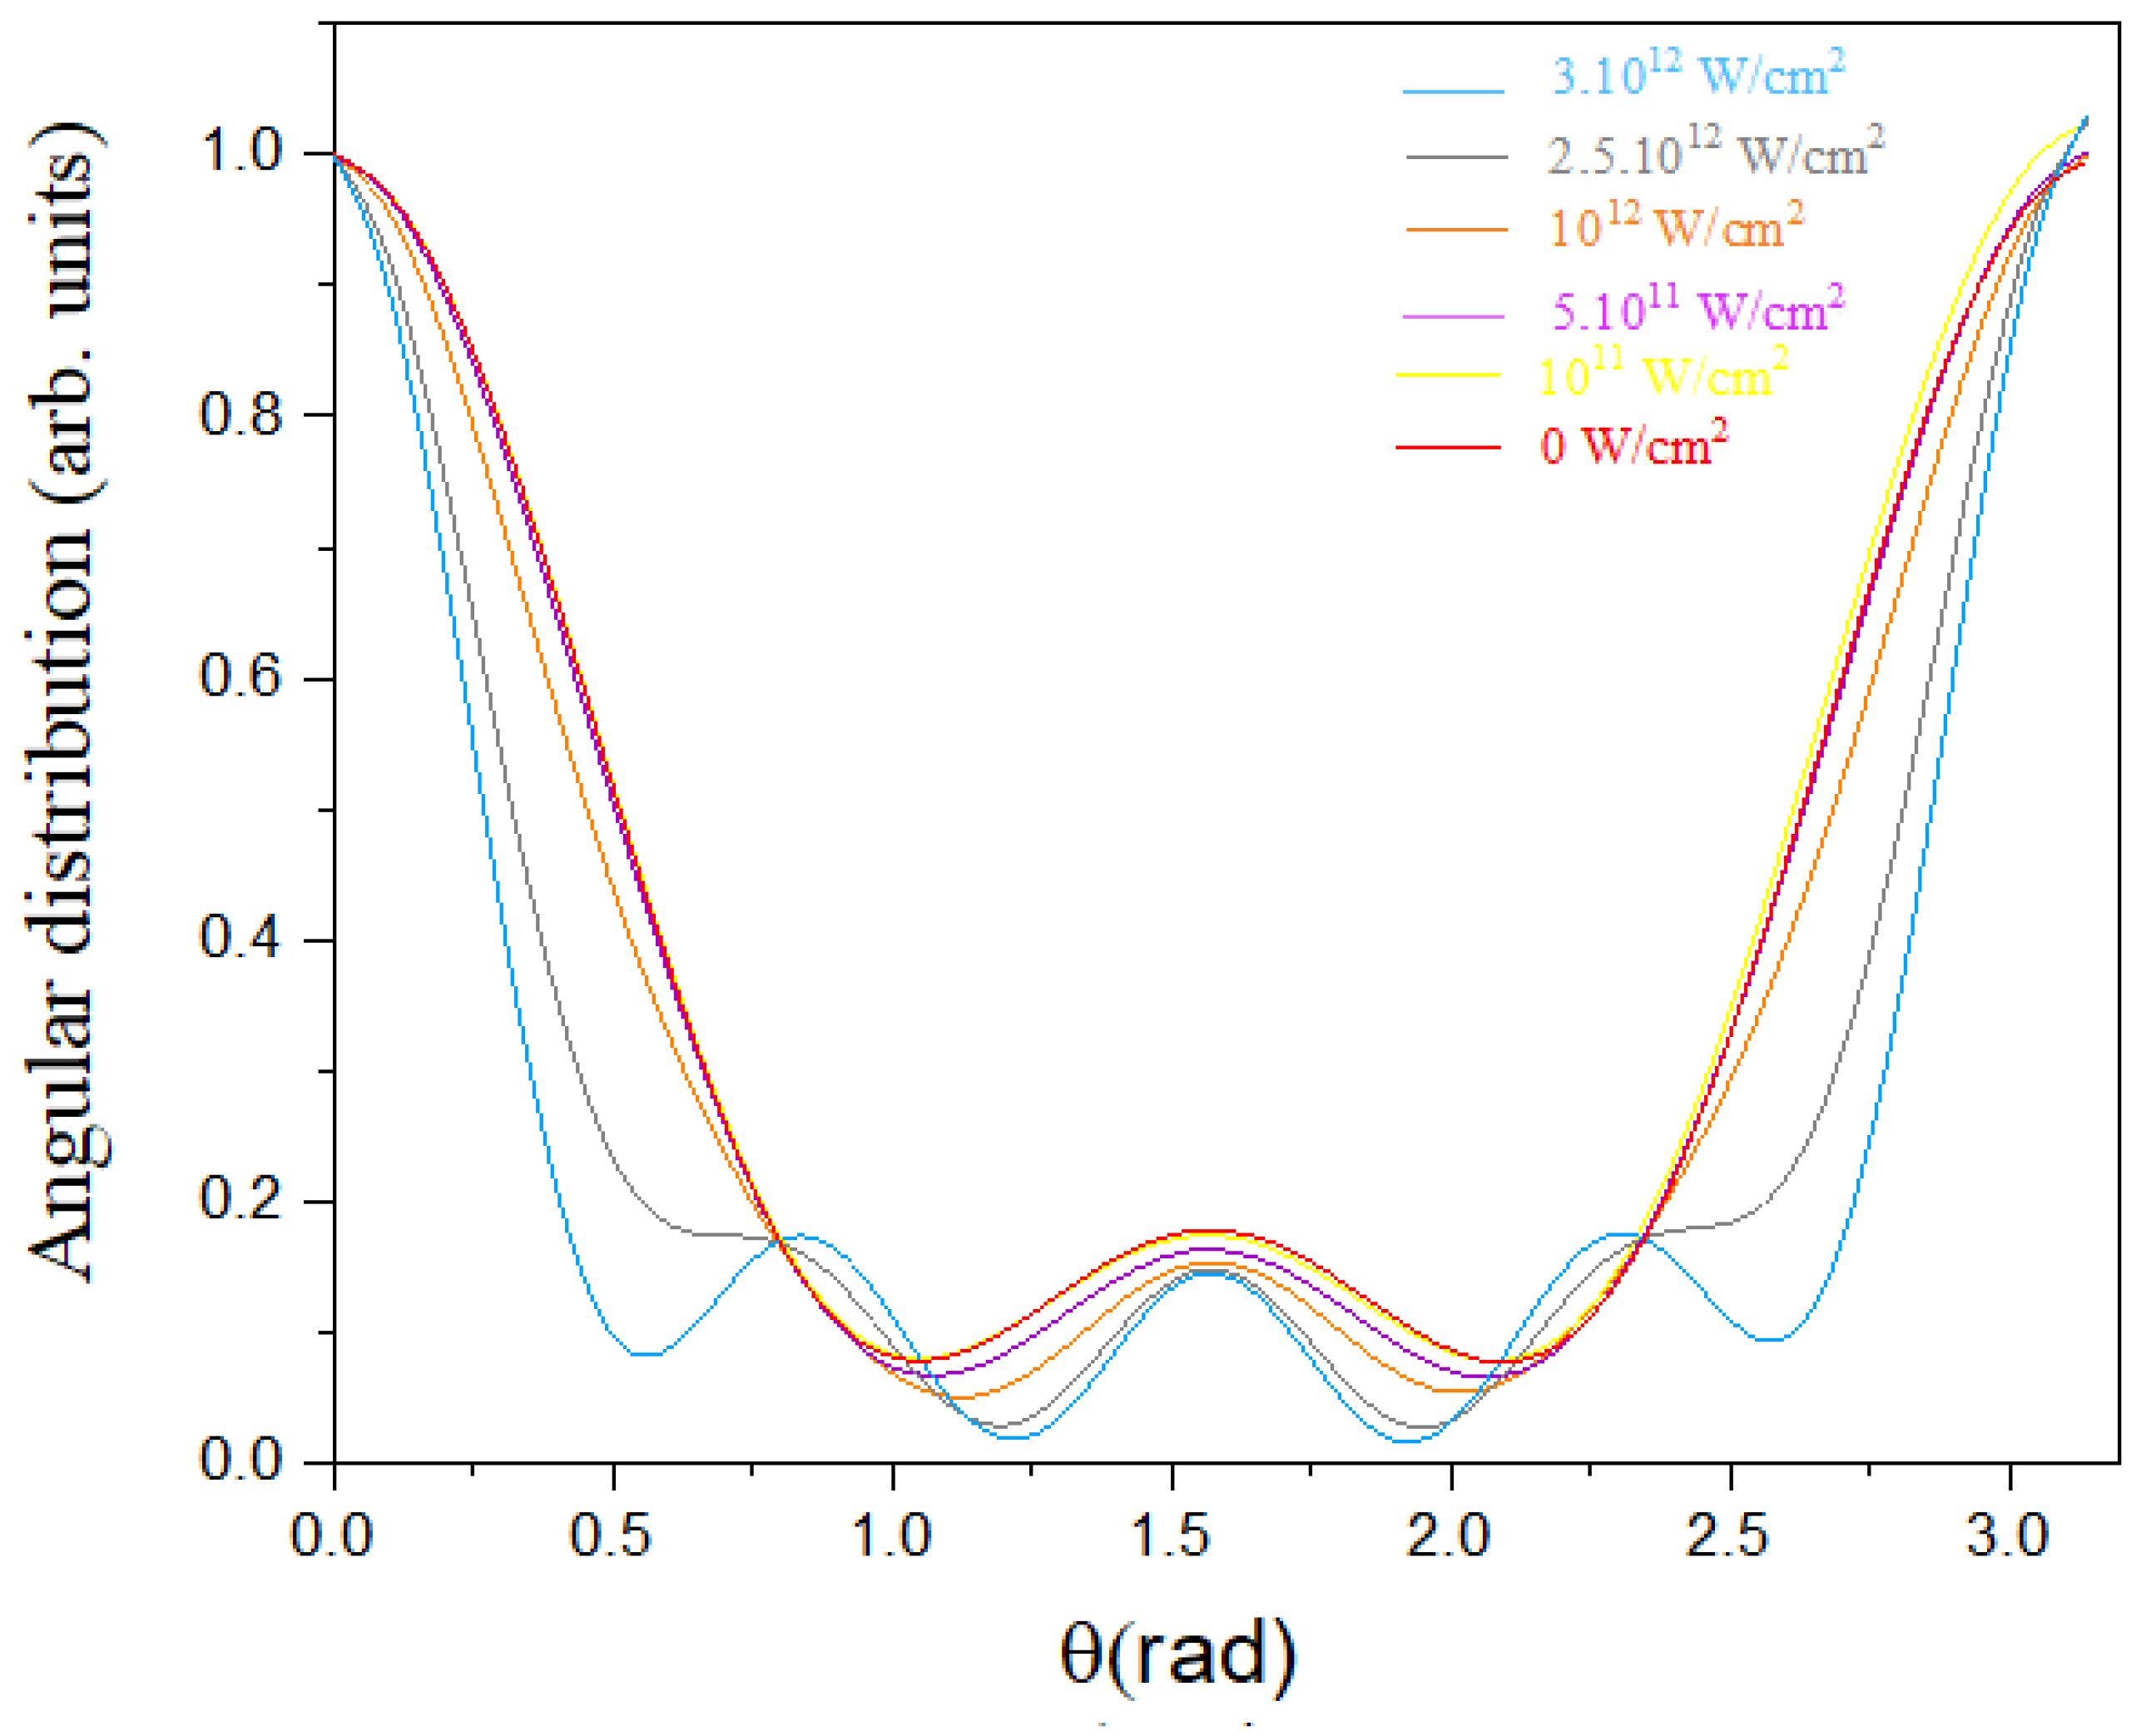
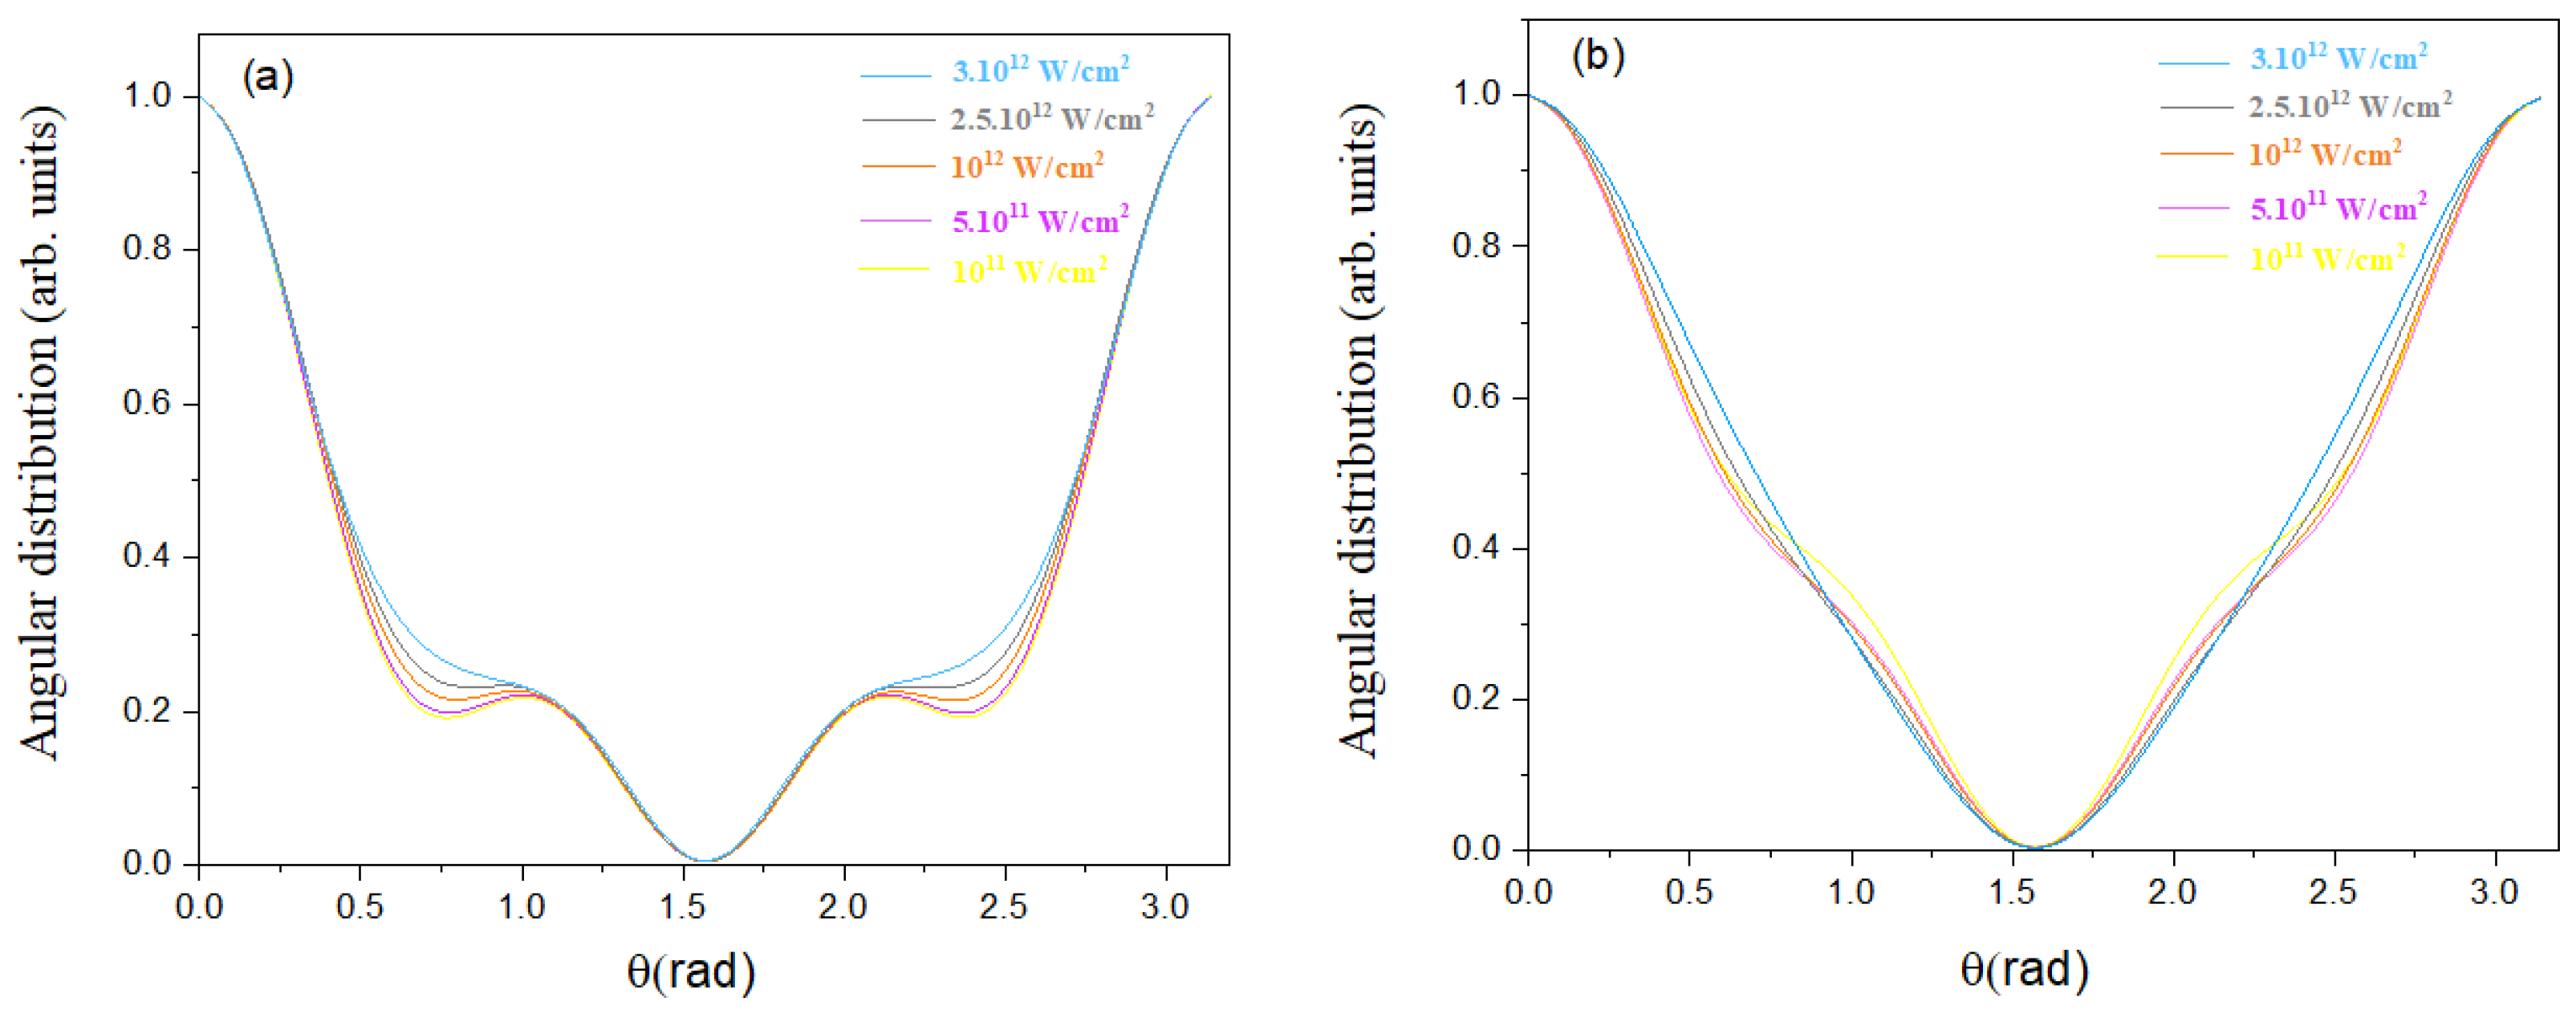
, we observe that as the infrared field intensity increases, the angular distribution of the central harmonic peak becomes more sharply peaked, until it exhibits marked oscillations (see
Figure 6). This behavior can be explained by the fact that at high NIR intensity, the ejected electron can absorb and emit an increasing number of infrared quanta, with each quantum contributing one unit of angular momentum.
These interactions, which do not change the kinetic energy of the ejected electron (such as absorption followed by emission, or vice versa), modify the angular shape of the electronic wave. The electron can thus access higher angular momentum states (
), and the interference between these different partial waves creates an oscillatory structure in the angular distribution of the electrons, evidenced by the presence of additional maxima in
Figure 6.
By limiting ourselves to the first two satellite peaks,
, the shape of their angular distribution becomes slightly narrower as the infrared field intensity increases (see
Figure 7). This evolution is explained by the progressive increase in the intensity of these satellite peaks, reflecting a probability of infrared photon exchange (via absorption or emission) without marked interference with other electronic waves, which explains the absence of marked oscillations in the angular distribution, in contrast to the central harmonic peak.
Although the intensity of the infrared laser field has been increased, it is still insufficient to reach the regime where significant interference between different electronic trajectories, especially those involving both absorption and emission of IR photons, becomes noticeable in the angular distribution.

