Article

Comparison of Different Rydberg Atom-Based Microwave Electrometry Techniques

by
Eliel Leandro Alves Junior
1,
Manuel Alejandro Lefrán Torres
1,
Jorge Douglas Massayuki Kondo
2 and
Luis Gustavo Marcassa
1,*
1
Instituto de Física de São Carlos, Universidade de São Paulo, Caixa Postal 369, São Carlos 13560-970, SP, Brazil
2
Departamento de Física, Universidade Federal de Santa Catarina, Florianópolis 88040-900, SC, Brazil
*
Author to whom correspondence should be addressed.
Atoms 2025, 13(7), 59; https://doi.org/10.3390/atoms13070059
Submission received: 27 April 2025 / Revised: 11 June 2025 / Accepted: 17 June 2025 / Published: 20 June 2025
(This article belongs to the Section Atom Based Quantum Technology)

Abstract

:
In this study, we have compared different Rydberg atom-based microwave electrometry techniques under the same experimental conditions and using the same Rydberg states ( 68 S 1 / 2 , 68 P 3 / 2 , and 67 P 3 / 2 ). The comparison was carried out for the following techniques: (i) auxiliary microwave field, (ii) microwave amplitude modulation, and (iii) polarization spectroscopy. Our results indicate that all three techniques have a similar minimum measurable microwave electric field. A slightly better result can be obtained by performing polarization spectroscopy using a Laguerre–Gauss coupling laser beam.

1. Introduction

Rydberg atoms, characterized by high excitation levels and a significant principal quantum number n [1,2], possess remarkable properties such as enhanced sensitivity to electromagnetic fields. Electromagnetically induced transparency (EIT) is a quantum interference effect [3,4] that creates a transparency window in a medium’s absorption spectrum, facilitating precise and targeted detection. The synergy between Rydberg atoms and EIT has created an exciting research domain with various applications [5,6,7,8]. In particular, in recent years, the application of microwave field detection (MW) has been successfully realized by numerous research teams [9,10,11,12,13,14,15,16,17,18,19,20,21,22]. Compact devices like atomic vapor cells have achieved unprecedented sensitivity and speed in detecting microwave signals.
The Rydberg atom-based microwave electrometry involves a four-level atom ladder configuration coupled by two laser beams (probe and coupling) and microwave radiation. Under particular conditions, the EIT transparency spectrum presents an Autler–Townes (AT) splitting [23,24,25], which is very sensitive to the strength and frequency of the MW field. The AT splitting provides an accurate means to measure the MW electric field strength and is also traceable to the International System of Units (SI) [9]. Although Rydberg EIT sensing has led to notable advancements, it still faces certain challenges. The AT splitting defines the threshold for detecting minimal MW electric fields, constrained by the EIT linewidth [10]. In observing the reduction in probe light transparency near the Rydberg EIT resonance, the smallest MW electric field strength detected to date in vapor cells is 55 nV/cm [26]. This approach offers high sensitivity but necessitates comparing transmittance measurements both with and without MW fields. Therefore, it is timely to develop techniques to measure small MW fields.
Several techniques have been developed recently to lower the minimum detected MW field using simple spectroscopical methods. In a recent work, Jia and coworkers developed the auxiliary microwave field technique [27]. It consists of an extra MW field in resonance with a nearby different Rydberg state, which is called the auxiliary field. This field introduces an AT splitting that is larger than the EIT linewidth. The measurement is performed in the target MW field, which is resonant to a different Rydberg state. The final AT splitting depends on both fields, and the authors were able to measure a field as low as 31 μV/cm at 14.2 GHz. In another work, Liu and coworkers used MW amplitude modulation to reach a minimum detectable electric field strength of 430 μV/cm at 14 GHz [28]. Gomes and coworkers have investigated Rydberg atom-based microwave electrometry using polarization spectroscopy and were able to detect 870 μV/cm at 11.6 GHz [29]. By combining an MW lens, the minimum field was improved to 310 μV/cm.
All these techniques were applied to different Rb atomic states under different experimental conditions (probe and control laser powers). Therefore, comparison is not straightforward. In this work, we have applied all these techniques (auxiliary microwave field [27], microwave amplitude modulation [28] and polarization spectroscopy [29]) to the same Rydberg state under the same experimental conditions. Our results indicate that the best technique is polarization spectroscopy [29]. The structure of this work is organized as follows: (i) Section 2 presents the experimental setup and procedure; (ii) Section 3 provides the experimental results; (iii) Section 4 presents the discussions; (iv) Finally, Section 5 concludes the study with a presentation of the main findings and conclusions.

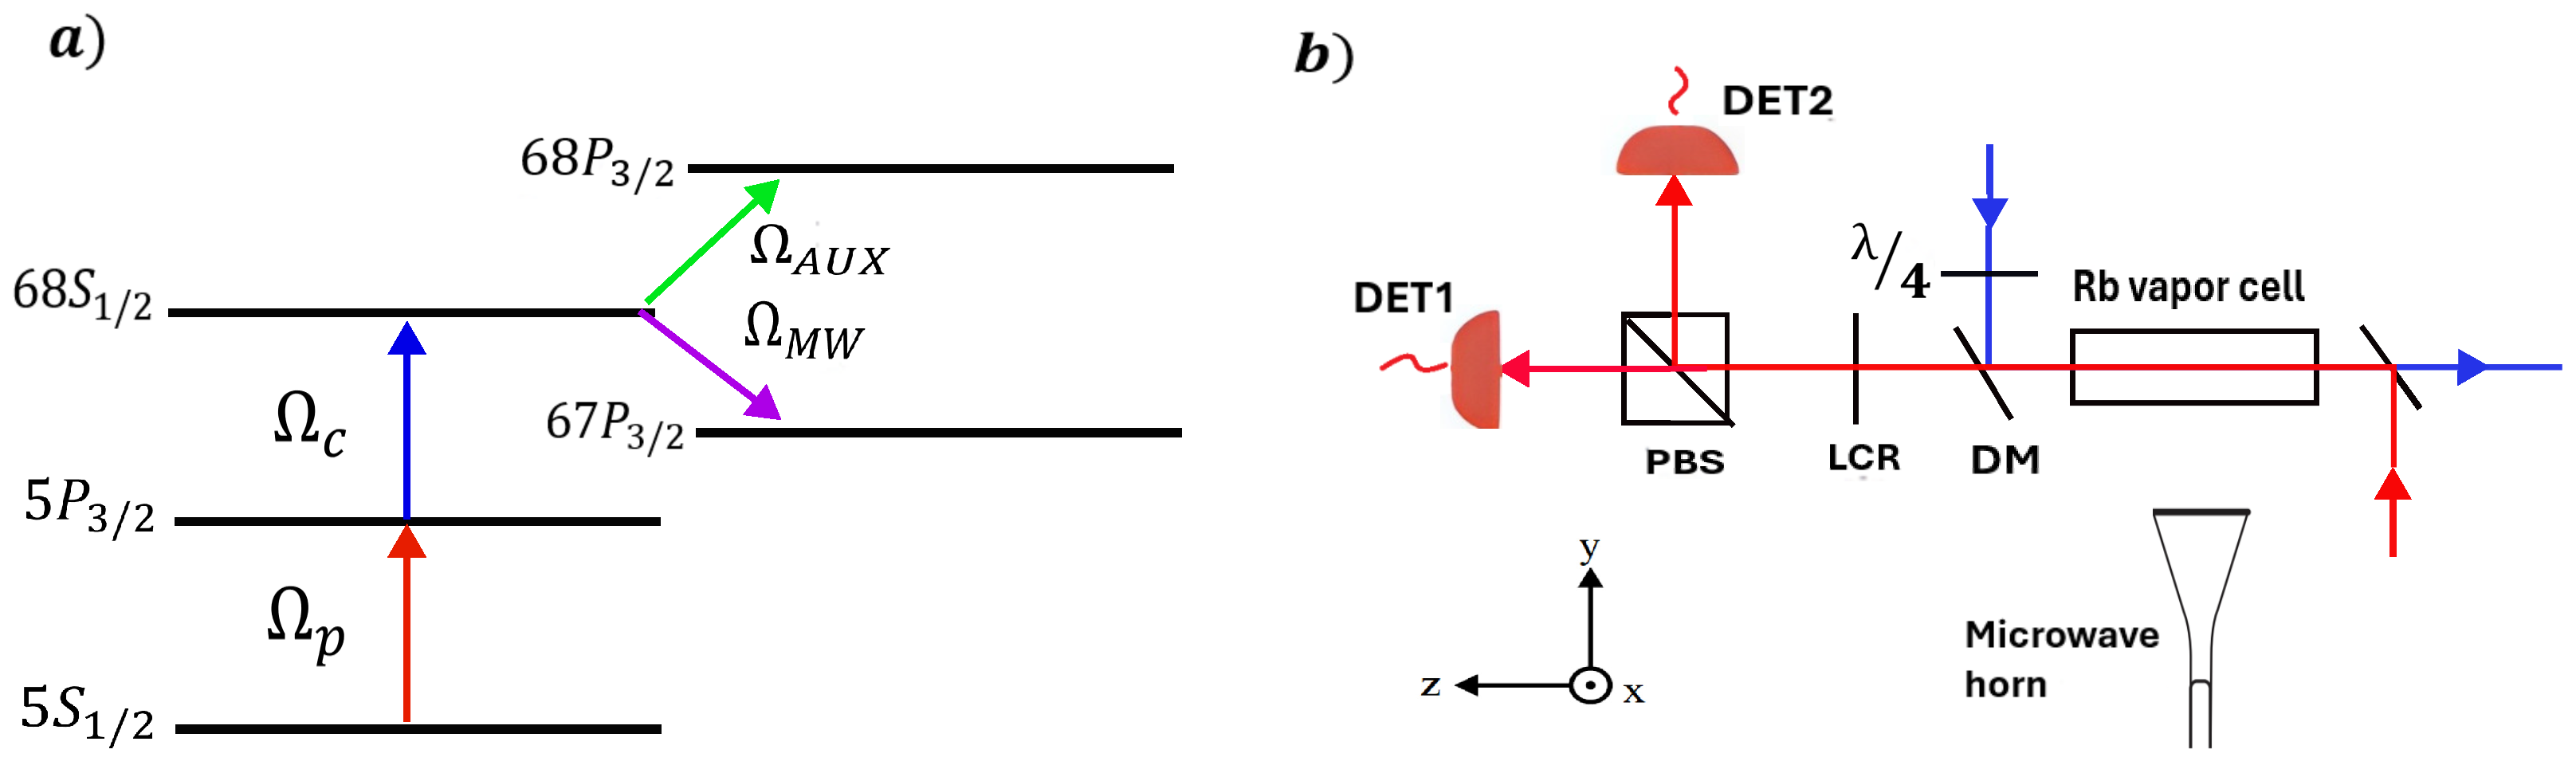
2. Materials and Methods

Figure 1a shows the configuration of the five-level atomic ladder used in this work ( 5 S 1 / 2 , 5 P 3 / 2 , 68 S 1 / 2 , 67 P 3 / 2 and 68 P 3 / 2 ) to measure the EIT Autler–Townes (AT) splitting to perform microwave electrometry. Here, we will compare different experimental techniques: (i) auxiliary microwave field [27], (ii) microwave amplitude modulation [28], (iii) and polarization spectroscopy [29,30]. The basic common experimental setup for all techniques is composed of probe (red line) and coupling (blue line) laser beams filtered by single-mode optical fibers, which travel in opposite directions and are focused on the center of an Rb cell (Figure 1b). The probe laser beam operates at a calculated Rabi frequency Ω p / 2 π = 2.3 MHz and is stabilized to an optical cavity at the 85Rb 5 S 1 / 2 ( F = 3 ) 5 P 3 / 2 ( F = 4 ) transition [31]. The coupling laser beam has a calculated Rabi frequency of Ω c / 2 π = 3.6 MHz, and it is stabilized to the same optical cavity. Its frequency is scanned over the 5 P 3 / 2 ( F = 4 ) 68 S 1 / 2 ( F = 3 ) transition by varying the electro-optical modulator frequency (EOM) used in the optical cavity locking system [31]. The probe beam is separated by a dichroic mirror (DM), and it passes through a half-wave liquid crystal retarder (LCR) (Thorlabs model LCC1111-B) and a polarizing beam splitter (PBS), which decomposes it into two orthogonal linearly polarized beams. Each beam is detected by a photodiode (DET1 and DET2). To detect the EIT signal for the auxiliary microwave field and the microwave amplitude modulation techniques, the probe and the coupling laser beams are linearly polarized in the x-direction, while the MW electric field is polarized in the z-direction, and a single detector detects the probe laser. To detect the polarization spectroscopy signal [29,30], both the probe and microwave fields are linearly polarized as before, while the coupling laser beam is circularly polarized. In this case, the photodiode signals are subtracted, resulting in a dispersive signal. The microwave (MW) is provided by a commercial two-channel MW generator (Model SynthPRO, Windfreak Technologies, New Port Richey, FL, USA). Both channels are fed into a horn antenna (model PE9856B/SF-15, Pasternack, Irvine, CA, USA) using an MW combiner (model ZX10-2-183-S+, Minicircuits, Brooklyn, NY, USA), producing a MW electric field polarized in the z axis. To ensure a plane wave on the Rb cell, the MW horn is placed 82 cm from it. One channel is tuned to the 68 S 1 / 2 68 P 3 / 2 transition at 11.6660 ± 0.0001 GHz and is defined as the auxiliary MW field ( Ω A u x ). This MW field is used in the auxiliary microwave-dressed Rydberg EIT-AT technique [27]. The other channel is tuned to the 68 S 1 / 2 67 P 3 / 2 transition at 12.4550 ± 0.0001 GHz, and it is the target MW field ( Ω M W ). To increase the signal-to-noise ratio, the coupling beam is modulated at 1 kHz for the auxiliary microwave field [27] and polarization spectroscopy techniques [29,30]. For the MW amplitude modulation technique, an MW switch (model D1956, General Microwave, Jerusalem, Israel) is used to modulate the target MW field at 1 kHz. The detected signals are processed by a lock-in amplifier. A zero-order vortex half-wave retarder (VWR) (Thorlabs, Newton, NJ, USA, model WPV10L-405) is used to generate the L G 0 1 mode with an efficiency of 97%. Ten spectra were acquired for each experimental condition.

3. Results

For a fair comparison of all techniques, we processed all signals identically. Figure 2 shows typical EIT spectra as functions of coupling laser detuning ( Δ c ) for the auxiliary microwave field technique (Figure 2a); the microwave amplitude modulation technique (Figure 2b); and polarization spectroscopy technique (Figure 2c). The red lines represent the interpolation polynomials, which are used for data analysis. They are obtained in the following way, we employed the interp1d(x, y_smooth, kind=“cubic”) function, from the Python 3.12 library SciPy [32], to perform the cubic spline interpolation. This method generates a set of cubic polynomials, each of which approximates the data between two consecutive points. The resulting interpolated curve is smooth and ensures continuity not only of the values but also of the first and second derivatives between the data points. By applying this technique, we obtain a smooth and continuous approximation of the experimental data, suitable for estimating values at points that lie between the observed measurements. Following this, we identified the positions of the peaks by finding the minima of the interpolated polynomial using the function minimize_scalar(objective, bounds=bounds) from the same library. This approach allowed us to accurately determine the critical points of the data. Here, we have used the AT splitting defined in each different work: (a) Δ f m from [27]; (b) Δ f s h o from [33] and (c) Δ P S E I T A T from [29]. We must point out that instead of using the zero crossing points of the EIT dispersion signal ( Δ f A M ), used by Liu et al. [28], we used the two symmetric peaks proposed by Hao et al. [33] ( Δ f s h o ). According to the authors, this parameter allows the measurement of MW fields smaller than those of the zero-crossing parameter. The experimental points are the average of 10 spectra for each experimental condition, and the error bars are their standard deviation.
To calibrate the MW field, we have measured the AT splitting in the linear regime as a function of the root square of the MW power. This was performed for the auxiliary MW field ( Ω A u x at the 68 S 1 / 2 68 P 3 / 2 transition at 11.666 GHz) and the target MW field ( Ω M W at the 68 S 1 / 2 67 P 3 / 2 transition at 12.455 GHz). Figure 3a shows Δ f m as a function of the amplitude of the electric field, which allows measurement of the amplitude of the minimum MW electric field. For a low field, Δ f m is constant; as the field increases, Δ f m also increases. The intersection between two linear fit functions allows the determination of the minimum measurable MW electric field amplitude, which is 0.40 ± 0.02 mV/cm for the auxiliary microwave field technique. Figure 3b shows Δ f s h o as a function of the amplitude of the electric field, which allows us to determine the minimum measurable MW electric field amplitude of 0.27 ± 0.02 mV/cm for the microwave amplitude modulation technique. Figure 4a,b show Δ P S E I T A T as functions of the applied electric field using polarization spectroscopy with the Gaussian and Laguerre–Gauss coupling laser beam, respectively. For the Gaussian coupling beam, we have measured a minimum measurable MW electric field amplitude of 0.18 ± 0.02 mV/cm. For the Laguerre–Gauss coupling beam, we have measured 0.17 ± 0.02 mV/cm.

4. Discussion

In our work, the polarization spectroscopy technique obtained the best results, with a minimum measurable MW electric field amplitude of about 0.18 ± 0.02 mV/cm. The difference between the Gaussian and Laguerre–Gaussian coupling laser beams was negligible. The only difference is that the Δ P S E I T A T value for zero-MW power was smaller for the Laguerre–Gaussian coupling laser beam than for the Gaussian coupling laser beam. We must point out that our results are ≃4 times better than those obtained by Gomes et al. [29]. The two linear fit functions, in a linear plot, allow for a smaller minimum measurable MW electric field amplitude than in a log–log plot. We believe this is due to the fact we have used a smaller electric field fitting range in this work (≤1 mV/cm). Our result for the minimum measurable MW electric field amplitude using the auxiliary field technique ( 0.40 ± 0.02 mV/cm) is worse than the result obtained by Jia et al. (31 μV/cm) [27]. We should point out that a direct comparison is difficult for several reasons: (i) the authors measured only six points in a small MW field (<1 mV/cm), (ii) the origin of the error bars is not discussed in their work, and (iii) they did not describe the procedure used to measure Δ f m .
Our result for the minimum measurable MW electric field amplitude using the microwave amplitude modulation technique ( 0.27 ± 0.02 mV/cm) is better than the result obtained by Liu et al. (430 μV/cm) [28]. However, it is important to note that we have used Δ f s h o [33] instead of Δ f A M [28]. On the other hand, our result is worse than that obtained by Hao et al. (56 μV/cm at 9.2 GHz). Again, direct comparison is difficult for several reasons: (i) the authors measured only a few points in a small MW field (<1 mV/cm), (ii) the origin of the error bars is not discussed in their work, and (iii) they did not describe the procedure used to measure Δ f s h o . It is important to point out that Jia and coworkers [27] used a D 5 / 2 F 7 / 2 Rydberg transition, while Liu and coworkers and Hao and coworkers [28,33] used D 5 / 2 P 3 / 2 Rydberg transition. Such transitions are polarization dependent as shown in [34] and influence any comparison. On the other hand, our S 1 / 2 P 3 / 2 Rydberg transition is polarization-independent [35].

5. Conclusions

In this work, we have compared different Rydberg atom-based microwave electrometry techniques (auxiliary microwave field [27], microwave amplitude modulation [28], and polarization spectroscopy [29,30]) for the same atomic Rydberg states and under the same experimental conditions. Our results indicate that polarization spectroscopy allows for the best minimum measurable MW electric field amplitude ( 0.18 ± 0.02 mV/cm). It is essential to highlight that all techniques used in this work require calibration of the AT splitting against a primary microwave electric field standard prior to their usage measuring an unknown field. We note, however, that a detailed sensitivity comparison among the techniques lies beyond the scope of this work and may be addressed in future investigations. Such a primary standard might be based on a superheterodyne technique [26], which would be used to calibrate a simpler and faster secondary standard. We should also point out that the use of a microwave lens could expand the range of applications of such a secondary standard, as demonstrated in [29].

Author Contributions

Conceptualization, E.L.A.J. and L.G.M.; methodology, E.L.A.J., M.A.L.T., J.D.M.K. and L.G.M.; software, E.L.A.J.; validation, E.L.A.J. and L.G.M.; formal analysis, E.L.A.J., M.A.L.T. and L.G.M.; investigation, E.L.A.J., M.A.L.T. and L.G.M.; resources, L.G.M.; data curation, L.G.M.; writing—original draft preparation, E.L.A.J., M.A.L.T. and L.G.M.; writing—review and editing, E.L.A.J., M.A.L.T., J.D.M.K. and L.G.M.; visualization, L.G.M.; supervision, L.G.M.; project administration, L.G.M.; funding acquisition, L.G.M. All authors have read and agreed to the published version of the manuscript.

Funding

This work is supported by grants 2019/10971-0 and 2021/06371-7, São Paulo Research Foundation (FAPESP), and CNPq (305257/2022-6). It was supported by the Army Research Office—Grant Number W911NF-21-1-0211.

Institutional Review Board Statement

Not applicable.

Data Availability Statement

Dataset available on request from the authors.

Conflicts of Interest

The authors declare no conflicts of interest.

References

  1. Gallagher, T. Rydberg Atoms; Springer: New York, NY, USA, 2006. [Google Scholar]
  2. Šibalić, N.; Adams, C.S. Rydberg Physics; IOP Publishing: Bristol, UK, 2018; pp. 2399–2891. [Google Scholar] [CrossRef]
  3. Fleischhauer, M.; Imamoglu, A.; Marangos, J.P. Electromagnetically induced transparency: Optics in coherent media. Rev. Mod. Phys. 2005, 77, 633. [Google Scholar] [CrossRef]
  4. Marangos, J.P. Electromagnetically induced transparency. J. Mod. Opt. 1998, 45, 471–503. [Google Scholar] [CrossRef]
  5. Mohapatra, A.K.; Jackson, T.R.; Adams, C.S. Coherent Optical Detection of Highly Excited Rydberg States Using Electromagnetically Induced Transparency. Phys. Rev. Lett. 2007, 98, 113003. [Google Scholar] [CrossRef]
  6. Adams, C.S.; Pritchard, J.D.; Shaffer, J.P. Rydberg atom quantum technologies. J. Phys. B At. Mol. Opt. Phys. 2019, 53, 012002. [Google Scholar] [CrossRef]
  7. Carr, C.; Tanasittikosol, M.; Sargsyan, A.; Sarkisyan, D.; Adams, C.S.; Weatherill, K.J. Three-photon electromagnetically induced transparency using Rydberg states. Opt. Lett. 2012, 37, 3858–3860. [Google Scholar] [CrossRef]
  8. Petrosyan, D.; Otterbach, J.; Fleischhauer, M. Electromagnetically Induced Transparency with Rydberg Atoms. Phys. Rev. Lett. 2011, 107, 213601. [Google Scholar] [CrossRef] [PubMed]
  9. Sedlacek, J.A.; Schwettmann, A.; Kübler, H.; Löw, R.; Pfau, T.; Shaffer, J.P. Microwave electrometry with Rydberg atoms in a vapour cell using bright atomic resonances. Nat. Phys. 2012, 8, 819–824. [Google Scholar] [CrossRef]
  10. Holloway, C.L.; Simons, M.T.; Gordon, J.A.; Dienstfrey, A.; Anderson, D.A.; Raithel, G. Electric field metrology for SI traceability: Systematic measurement uncertainties in electromagnetically induced transparency in atomic vapor. J. Appl. Phys. 2017, 121, 233106. [Google Scholar] [CrossRef]
  11. Holloway, C.L.; Gordon, J.A.; Jefferts, S.; Schwarzkopf, A.; Anderson, D.A.; Miller, S.A.; Thaicharoen, N.; Raithel, G. Broadband Rydberg atom-based electric-field probe for SI-traceable, self-calibrated measurements. IEEE Trans. Antennas Propag. 2014, 62, 6169–6182. [Google Scholar] [CrossRef]
  12. Holloway, C.L.; Gordon, J.A.; Schwarzkopf, A.; Anderson, D.A.; Miller, S.A.; Thaicharoen, N.; Raithel, G. Sub-wavelength imaging and field mapping via electromagnetically induced transparency and Autler-Townes splitting in Rydberg atoms. Appl. Phys. Lett. 2014, 104, 244102. [Google Scholar] [CrossRef]
  13. Sedlacek, J.A.; Schwettmann, A.; Kübler, H.; Shaffer, J.P. Atom-Based Vector Microwave Electrometry Using Rubidium Rydberg Atoms in a Vapor Cell. Phys. Rev. Lett. 2013, 111, 063001. [Google Scholar] [CrossRef] [PubMed]
  14. Tanasittikosol, M.; Pritchard, J.; Maxwell, D.; Gauguet, A.; Weatherill, K.; Potvliege, R.; Adams, C. Microwave dressing of Rydberg dark states. J. Phys. B At. Mol. Opt. Phys. 2011, 44, 184020. [Google Scholar] [CrossRef]
  15. Fan, H.; Kumar, S.; Sedlacek, J.; Kübler, H.; Karimkashi, S.; Shaffer, J.P. Atom based RF electric field sensing. J. Phys. B At. Mol. Opt. Phys. 2015, 48, 202001. [Google Scholar] [CrossRef]
  16. Anderson, D.A.; Miller, S.A.; Raithel, G.; Gordon, J.A.; Butler, M.L.; Holloway, C.L. Optical Measurements of Strong Microwave Fields with Rydberg Atoms in a Vapor Cell. Phys. Rev. Appl. 2016, 5, 034003. [Google Scholar] [CrossRef]
  17. Anderson, D.A.; Schwarzkopf, A.; Miller, S.A.; Thaicharoen, N.; Raithel, G.; Gordon, J.A.; Holloway, C.L. Two-photon microwave transitions and strong-field effects in a room-temperature Rydberg-atom gas. Phys. Rev. A 2014, 90, 043419. [Google Scholar] [CrossRef]
  18. Simons, M.T.; Gordon, J.A.; Holloway, C.L. Simultaneous use of Cs and Rb Rydberg atoms for dipole moment assessment and RF electric field measurements via electromagnetically induced transparency. J. Appl. Phys. 2016, 120, 123103. [Google Scholar] [CrossRef]
  19. Holloway, C.L.; Simons, M.T.; Kautz, M.D.; Haddab, A.H.; Gordon, J.A.; Crowley, T.P. A quantum-based power standard: Using Rydberg atoms for a SI-traceable radio-frequency power measurement technique in rectangular waveguides. Appl. Phys. Lett. 2018, 113, 094101. [Google Scholar] [CrossRef]
  20. Simons, M.T.; Kautz, M.D.; Holloway, C.L.; Anderson, D.A.; Raithel, G.; Stack, D.; St. John, M.C.; Su, W. Electromagnetically Induced Transparency (EIT) and Autler-Townes (AT) splitting in the presence of band-limited white Gaussian noise. J. Appl. Phys. 2018, 123, 203105. [Google Scholar] [CrossRef]
  21. Meyer, D.H.; Cox, K.C.; Fatemi, F.K.; Kunz, P.D. Digital communication with Rydberg atoms and amplitude-modulated microwave fields. Appl. Phys. Lett. 2018, 112, 211108. [Google Scholar] [CrossRef]
  22. Fan, H.Q.; Kumar, S.; Daschner, R.; Kübler, H.; Shaffer, J.P. Subwavelength microwave electric-field imaging using Rydberg atoms inside atomic vapor cells. Opt. Lett. 2014, 39, 3030–3033. [Google Scholar] [CrossRef]
  23. Cohen-Tannoudji, C.N. The autler-townes effect revisited. In Amazing Light; Springer: New York, NY, USA, 1996; pp. 109–123. [Google Scholar]
  24. Anisimov, P.M.; Dowling, J.P.; Sanders, B.C. Objectively discerning Autler-Townes splitting from electromagnetically induced transparency. Phys. Rev. Lett. 2011, 107, 163604. [Google Scholar] [CrossRef]
  25. Abi-Salloum, T.Y. Electromagnetically induced transparency and Autler-Townes splitting: Two similar but distinct phenomena in two categories of three-level atomic systems. Phys. Rev. A 2010, 81, 053836. [Google Scholar] [CrossRef]
  26. Jing, M.; Hu, Y.; Ma, J.; Zhang, H.; Zhang, L.; Xiao, L.; Jia, S. Atomic superheterodyne receiver based on microwave-dressed Rydberg spectroscopy. Nat. Phys. 2020, 16, 911–915. [Google Scholar] [CrossRef]
  27. Jia, F.D.; Liu, X.B.; Mei, J.; Yu, Y.H.; Zhang, H.Y.; Lin, Z.Q.; Dong, H.Y.; Zhang, J.; Xie, F.; Zhong, Z.P. Span shift and extension of quantum microwave electrometry with Rydberg atoms dressed by an auxiliary microwave field. Phys. Rev. A 2021, 103, 063113. [Google Scholar] [CrossRef]
  28. Liu, X.; Jia, F.; Zhang, H.; Mei, J.; Yu, Y.; Liang, W.; Zhang, J.; Xie, F.; Zhong, Z. Using amplitude modulation of the microwave field to improve the sensitivity of Rydberg-atom based microwave electrometry. AIP Adv. 2021, 11, 085127. [Google Scholar] [CrossRef]
  29. Duarte Gomes, N.; Marrara Pepino, V.; Viana Borges, B.H.; Varela Magalhães, D.; de Jesus Napolitano, R.; Alejandro Lefrán Torres, M.; Douglas Massayuki Kondo, J.; Gustavo Marcassa, L. Rydberg atom-based microwave electrometry using polarization spectroscopy. J. Phys. B At. Mol. Opt. Phys. 2024, 57, 235502. [Google Scholar] [CrossRef]
  30. Duarte Gomes, N.; da Fonseca Magnani, B.; Massayuki Kondo, J.D.; Marcassa, L.G. Polarization Spectroscopy Applied to Electromagnetically Induced Transparency in Hot Rydberg Atoms Using a Laguerre–Gaussian Beam. Atoms 2022, 10, 58. [Google Scholar] [CrossRef]
  31. Rodriguez Fernandez, D.; Lefran Torres, M.A.; Cardoso, M.R.; Kondo, J.D.M.; Saffman, M.; Marcassa, L.G. Affordable medium-finesse optical cavity for diode laser stabilization. Appl. Phys. B 2024, 130, 60. [Google Scholar] [CrossRef]
  32. Virtanen, P.; Gommers, R.; Oliphant, T.E.; Haberland, M.; Reddy, T.; Cournapeau, D.; Burovski, E.; Peterson, P.; Weckesser, W.; Bright, J.; et al. SciPy 1.0: Fundamental Algorithms for Scientific Computing in Python. Nat. Methods 2020, 17, 261–272. [Google Scholar] [CrossRef]
  33. Hao, J.H.; Jia, F.D.; Cui, Y.; Wang, Y.H.; Zhou, F.; Liu, X.B.; Zhang, J.; Xie, F.; Bai, J.H.; You, J.Q.; et al. Microwave electrometry with Rydberg atoms in a vapor cell using microwave amplitude modulation. Chin. Phys. B 2024, 33, 050702. [Google Scholar] [CrossRef]
  34. Chopinaud, A.; Pritchard, J. Optimal State Choice for Rydberg-Atom Microwave Sensors. Phys. Rev. Appl. 2021, 16, 024008. [Google Scholar] [CrossRef]
  35. Cloutman, M.; Chilcott, M.; Elliott, A.; Otto, J.S.; Deb, A.B.; Kjærgaard, N. Polarization-insensitive microwave electrometry using Rydberg atoms. Phys. Rev. Appl. 2024, 21, 044025. [Google Scholar] [CrossRef]
Figure 1. (Color online) (a) Scheme of the five-level atom. Levels 5 S 1 / 2 and 5 P 3 / 2 are coupled by a probe laser, levels 5 P 3 / 2 and 68 S 1 / 2 are coupled by a coupling laser. The levels 68 S 1 / 2 and 67 P 3 / 2 are Rydberg levels connected by MW radiation ( Ω M W ). The levels 68 S 1 / 2 and 68 P 3 / 2 are Rydberg levels connected by auxiliary MW radiation ( Ω A u x ). (b) Experimental setup: waveplate ( λ / 4 ); polarizing beam splitter (PBS); Dichroic mirror (DM); liquid crystal retarder (LCR); vapor cell and photodetectors (DET1 and DET2). A probe (red) and coupling (blue) laser beams counterpropagate inside a rubidium vapor cell under the influence of an MW field generated at the MW horn antenna. The probe laser beam is linearly polarized in the x-direction, while the MW electric field is polarized in the z-direction. For the EIT measurement, the coupling laser beam is linearly polarized in the x-direction. For the PSEIT measurement, the λ / 4 is used to make it circularly polarized. The probe beam is further detected at DET1 and DET2.
Atoms 13 00059 g001
Figure 2. (Color online) Typical EIT spectra as functions of coupling laser detuning ( Δ c ) for experimental curve (black lines) and interpolation curve (red lines). We have also pointed out the AT splitting used in each technique: (a) Δ f m for the auxiliary microwave field technique [27], (b) Δ f s h o the microwave amplitude modulation technique [33], and (c) Δ P S E I T A T for the polarization spectroscopy technique [29].
Atoms 13 00059 g002
Figure 3. (a) Δ f m and (b) Δ f s h o as a function of the amplitude of the electric field. The lines are two linear fit functions, whose intersection, allows the determination of the minimum measurable MW electric field amplitude, which is 0.40 ± 0.02 mV/cm and 0.27 ± 0.02 mV/cm for the auxiliary microwave field technique and the microwave amplitude modulation technique, respectively. The experimental points are an average of 10 spectra, and the error bars are their standard deviation.
Atoms 13 00059 g003
Figure 4. Δ P S E I T A T as functions of the applied electric field using polarization spectroscopy with (a) Gaussian and (b) Laguerre–Gauss coupling laser beam. The minimum measurable MW electric field amplitude is 0.18 ± 0.02 mV/cm for Gaussian coupling beam and 0.17 ± 0.02 mV/cm for the Laguerre–Gauss coupling beam. The experimental points are an average of 10 spectra, and the error bars are their standard deviation.
Atoms 13 00059 g004aAtoms 13 00059 g004b
Disclaimer/Publisher’s Note: The statements, opinions and data contained in all publications are solely those of the individual author(s) and contributor(s) and not of MDPI and/or the editor(s). MDPI and/or the editor(s) disclaim responsibility for any injury to people or property resulting from any ideas, methods, instructions or products referred to in the content.

