Article

Vibrational Excitation of HDO Molecule by Electron Impact

by
Mehdi Adrien Ayouz
1,2,*,
Alexandre Faure
3,
Ioan F. Schneider
4,5,
János Zsolt Mezei
6 and
Viatcheslav Kokoouline
7
1
SPMS, CentraleSupélec, Université Paris-Saclay, 8-10 rue Joliot-Curie, F-91190 Gif-sur-Yvette, France
2
LGPM, CentraleSupélec, Université Paris-Saclay, 8-10 rue Joliot-Curie, F-91190 Gif-sur-Yvette, France
3
Université Grenoble Alpes, CNRS, IPAG, F-38000 Grenoble, France
4
LOMC CNRS-UMR6294, Université du Havre, F-76058 Le Havre, France
5
LAC CNRS-UMR9188, Université Paris-Sud, ENS Cachan, Université Paris-Saclay, F-91405 Orsay, France
6
HUN-REN Institute for Nuclear Research (ATOMKI), 4026 Debrecen, Hungary
7
Department of Physics, University of Central Florida, Orlando, FL 32816, USA
*
Author to whom correspondence should be addressed.
Atoms 2025, 13(4), 32; https://doi.org/10.3390/atoms13040032
Submission received: 31 January 2025 / Revised: 26 March 2025 / Accepted: 28 March 2025 / Published: 8 April 2025
(This article belongs to the Section Atomic, Molecular and Nuclear Spectroscopy and Collisions)

Abstract

:
Cross sections and thermally averaged rate coefficients for the vibrational excitation and de-excitation by electron impact on the HDO molecule are computed using a theoretical approach based entirely on first principles. This approach combines scattering matrices obtained from the UK R-matrix codes for various geometries of the target molecule, three-dimensional vibrational states of HDO, and the vibrational frame transformation. The vibrational states of the molecule are evaluated by solving the Schrödinger equation numerically, without relying on the normal-mode approximation, which is known to be inaccurate for water molecules. As a result, couplings and transitions between the vibrational states of HDO are accurately accounted for. From the calculated cross sections, thermally averaged rate coefficients and their analytical fits are provided. Significant differences between the results for HDO and H2O are observed. Additionally, an uncertainty assessment of the obtained data is performed for potential use in modeling non-local thermodynamic equilibrium (non-LTE) spectra of water in various astrophysical environments.

1. Introduction

Water, H2O, is ubiquitous in the Universe, in both the gas and solid phases, and it is the third most abundant molecule after H2 and CO. The singly deuterated form of water, HDO, is much less abundant (by typically two to five orders of magnitude), but it is also detected in a variety of astrophysical environments, including interstellar and circumstellar regions and planetary and cometary atmospheres (see Ref. [1] and references therein). Observing H2O and HDO in the same source is particularly interesting because the HDO/H2O ratio is a unique probe of water history and, in (exo)planets, the evolution of their atmospheres. For instance, this ratio was measured in the protoplanetary disk around the sun-like protostar V883 Ori, giving a value comparable to those of protostellar envelopes and comets [2]. Recently, an unexpected increase in the HDO/H2O ratio was observed in the Venus mesosphere [3].
The presence or likely presence of HDO in high (above room) temperature environments has motivated the construction of extensive line lists for ro-vibrational transitions. The most recent one is called TBD, and it was computed recently as part of the ExoMol project [4]. This new line list replaces the old VTT line list [5] and comprises energies up to 41,000 cm−1 with a recommended highest temperature limit of 3000 K. It is of great interest for the modeling of (exo)planetary and cometary atmospheres [6]. In such environments, however, local thermodynamical equilibrium (LTE) is not fulfilled everywhere and in addition to an accurate line list, collisional rate coefficients are critical to accurately model the ro-vibrational excitation of molecules, see e.g., Ref. [7] for water-rich exoplanetary atmospheres.
In astrophysical media, the dominant collisional partners for the excitation of target molecules (here HDO) are neutral atoms and molecules (e.g., H and H2 in the ISM, H2O, CO and CO2 in comets) and free electrons. Electron collisions are competitive or even dominant in harsh environments, when the electron fraction typically exceeds 10 4 . Such high fractional ionization is observed, for instance, in photon-dominated regions (e.g., at the boundary of molecular clouds) and in comets, where free electrons are thermalized by the neutrals, and the kinetic temperature typically varies between 10 and 10 4  K (see e.g., Ref. [8]). Theoretical rate coefficients for the rotational excitation of HDO (in its ground vibrational state) by H2 and electron collisions are available in the literature for kinetic temperatures in the ranges of 5–300 K [9] and 100–8000 K [10], respectively. Moreover, the low energy scattering resonances in the rotational excitation of HDO by H2 were recently studied in a joint theoretical and experimental study [11]. However, to the best of our knowledge, there is no such theoretical or experimental study for the (ro)vibrational excitation of HDO.
In 2024, Ayouz et al. [12] computed cross sections for the vibrational excitation of H2O, including, for the first time, transitions with more than two-quanta excitations as well as inter-mode transitions. Their theoretical approach is based on first principles and employs numerical vibrational wave functions without recourse to the normal-mode approximation. Their calculations were extensively compared to previous theoretical and experimental data, as reviewed in Ref. [13]. In the present work, we extend the theory of Ref. [12] to treat the vibrational excitation of the singly deuterated isotopologue of water, HDO, with a reduced symmetry point group. The 16 lowest vibrational levels of HDO are considered, i.e., up to level ( v 1 v 2 v 3 ) = (130) lying about 6800 cm1 above the ground state, and thermally averaged rate coefficients are obtained for kinetic temperatures up to 10,000 K.
The rest of the article is organized in the following way. Section 2 describes the theoretical approach used in the present calculations. The obtained cross sections and the corresponding rate coefficients are displayed and discussed in Section 3. Section 4 concludes the study.

2. Theoretical Approach

The basic formalism employed in our model is presented in detail in Ref. [12]; we only sketch its major ideas in this section.

2.1. HDO Molecule Properties

HDO molecule is an asymmetric isotopologue of H2O with the symmetry point group reduced from C2v to Cs at equilibrium. Its electronic structure is equivalent to water with a configuration in the ground state of
A 1 1 : 1 a 2 2 a 2 1 a 2 3 a 2 1 a 2 .
The HDO molecule can be characterized by three normal modes of vibration, OD stretching ν 1 , bending ν 2 , and OH stretching ν 3 , with respective frequencies ω 1 , ω 2 , and ω 3 and corresponding dimensionless coordinates q 1 , q 2 , and q 3 . Due to the mass difference m D / m H 2 , the nuclear dynamics of HDO along the O-H and O-D bonds is expected to be asymmetric with a frequency ω 3 much larger than ω 1 .
As the first step of the present theoretical approach, normal-mode frequencies and the matrix of transformation between the Cartesian and normal-mode coordinates are needed. Using the quantum chemistry package MOLPRO [14], we performed the Coupled Cluster Singles, Doubles, and Triples (CCSD(T)) calculations with Hartree–Fock orbitals, followed by the optimization procedure in the C 1 symmetry group. The aug-cc-pVQZ basis set was employed on each atom, including the s, p, d, and f orbitals for the hydrogen and deuterium atoms, while an additional orbital g was added for the oxygen atom. We used a mass of 1.008 u for the hydrogen atom and 2.014 u for the deuterium [15]. The total energy of the molecule decreases from −76.06572148, from the Hartree–Fock self-coherent field calculation to −76.35404102 hartree using CCSD, then to −76.3634191 hartree when adding the triples (T) contribution, and finally stabilizes at −76.3635876 hartree with the CCSD(T) method when combined with the optimization procedure.
Table 1 gives the optimized geometry and vibrational frequencies obtained in the present calculation and compares the results with available experimental data for HDO and H2O. Normal modes of each molecule are displayed in the table with arrows indicating each mode’s direction and magnitude of displacements. Note that the OH stretching mode displacement in HDO is much larger than for the OD stretch according to the frequency values ω 3 and ω 1 . Moreover, the present ab initio model is different than the one used for H2O, in our previous studies [12,16]; it reproduces the experimental frequencies more accurately.

2.2. Fixed Nuclei Scattering Matrix

In the electron-molecule scattering, four fixed geometries q 1 , q 2 , q 3 , q 4 of the molecule were used. The geometries and the corresponding eigenphase sums are shown in Figure 1. The reactance matrix K ̲ ( q ) (K-matrix) was obtained numerically for these geometries using the UK R-matrix codes [19,20] and the Quantemol-N interface [15]. Considering energies below the excitation of the first excited electronic state of the molecule (about 8.3 eV above the ground electronic state at the equilibrium geometry q 0 = ( 0 , 0 , 0 ) ), the obtained K-matrices, for each geometry configuration and the scattering electron energy E e l , are labeled only by channels (indexes) corresponding to the electronic angular momentum l and its projection λ on the axis perpendicular to the molecular plane.
Similar to our previous study, devoted to the H2O molecule [12], we used in the R-matrix calculations the C 1 point group with HDO being in its ground electronic state. The two 1 a 2 core electrons were frozen, and eight electrons were distributed in the active space, including 2 9 a orbitals. For these calculations, we employed the configuration interaction method (CI) with the cc-pVTZ basis set and the radius of the sphere of the R-matrix of 10 bohr and a partial-wave expansion with continuum Gaussian-type orbitals with l 4 . This set of calculations, including the cc-pVTZ basis set and the described complete active space (CAS1), will be referred to hereafter as Model 1. The other models will be introduced further to assess the uncertainty of the obtained results.
Figure 1 shows the eigenphase sum in e HDO scattering (solid line) for the four geometries as a function of the electron energy E e l . Dashed lines in the figure indicate eigenphase sums in e H2O scattering for the same geometries. The electronic structure of H2O and HDO is identical. Therefore, the equilibrium geometry is the same, and the frequencies of the bending mode of both molecules are similar (see Table 1). The eigenphase sums are the same for the equilibrium geometry and similar for small displacements along the bending coordinates q 2 . In the case of the stretching modes ν 1 and ν 3 , the significant difference in harmonic frequencies and normal coordinates affects the positions of resonances in the eigenphase sums. Variation in the eigenphase sums is smooth for energies below 7 eV. Thus, the scattering matrix S ̲ ( q ) can be employed for the vibrational frame transformation at low scattering energies.
The reactance matrices K ̲ ( q ) are transformed into scattering matrices S ̲ ( q ) = ( 1 + i K ̲ ( q ) ) ( 1 i K ̲ ( q ) ) 1 , which are then used to perform the vibrational frame transformation discussed below.

2.3. HDO Vibrational Dynamics

To construct elements of the scattering matrix for transitions from one vibrational level ( v 1 v 2 v 3 ) v to another ( v 1 v 2 v 3 ) v , the vibrational wave functions are needed. For this purpose, the Schrödinger equation for vibrational motion along q = ( q 1 , q 2 , q 3 ) ,
i = 1 3 ω i 2 2 q i 2 + V ( q ) ψ v ( q ) = ϵ v ψ v ( q ) ,
is solved numerically [21]. In the above equation, V ( q ) is the potential energy surface (PES) of H2O given by Ref. [22]. The PES is obtained in ab initio calculations and refined using empirical rovibrational energy levels. It is given in terms of bond coordinates ( r 1 , r 2 , θ ), see Table 1, and then converted to the normal coordinates q using the transformation matrix and the frequencies.
Since the nuclear dynamics of HDO along the O-H and O-D bonds is asymmetric due to the mass difference m D / m H 2 , a large grid of 18 × 18 × 18 points was used in solving Equation (1) with q 1 , q 2 , and q 3 varying from −5 to 5 (dimensionless). For these normal mode coordinate intervals, the bound coordinates ( r 1 , r 2 , θ ) of HDO vary in the following way: From 0.76 Å  to 1.62 Å  for r 1 , from 0.64 Å  to 1.41 Å  for r 2 , and from 66.80° to 166.51° for θ .
Table 2 gives the obtained energies (in cm−1) of the lowest vibrational levels of HDO and compares them with the experimental data by Tennyson et al. [23] and previous calculations by Zobov et al. [24]. The overall difference in energies of the present results and the experiment for HDO is less than 1%.
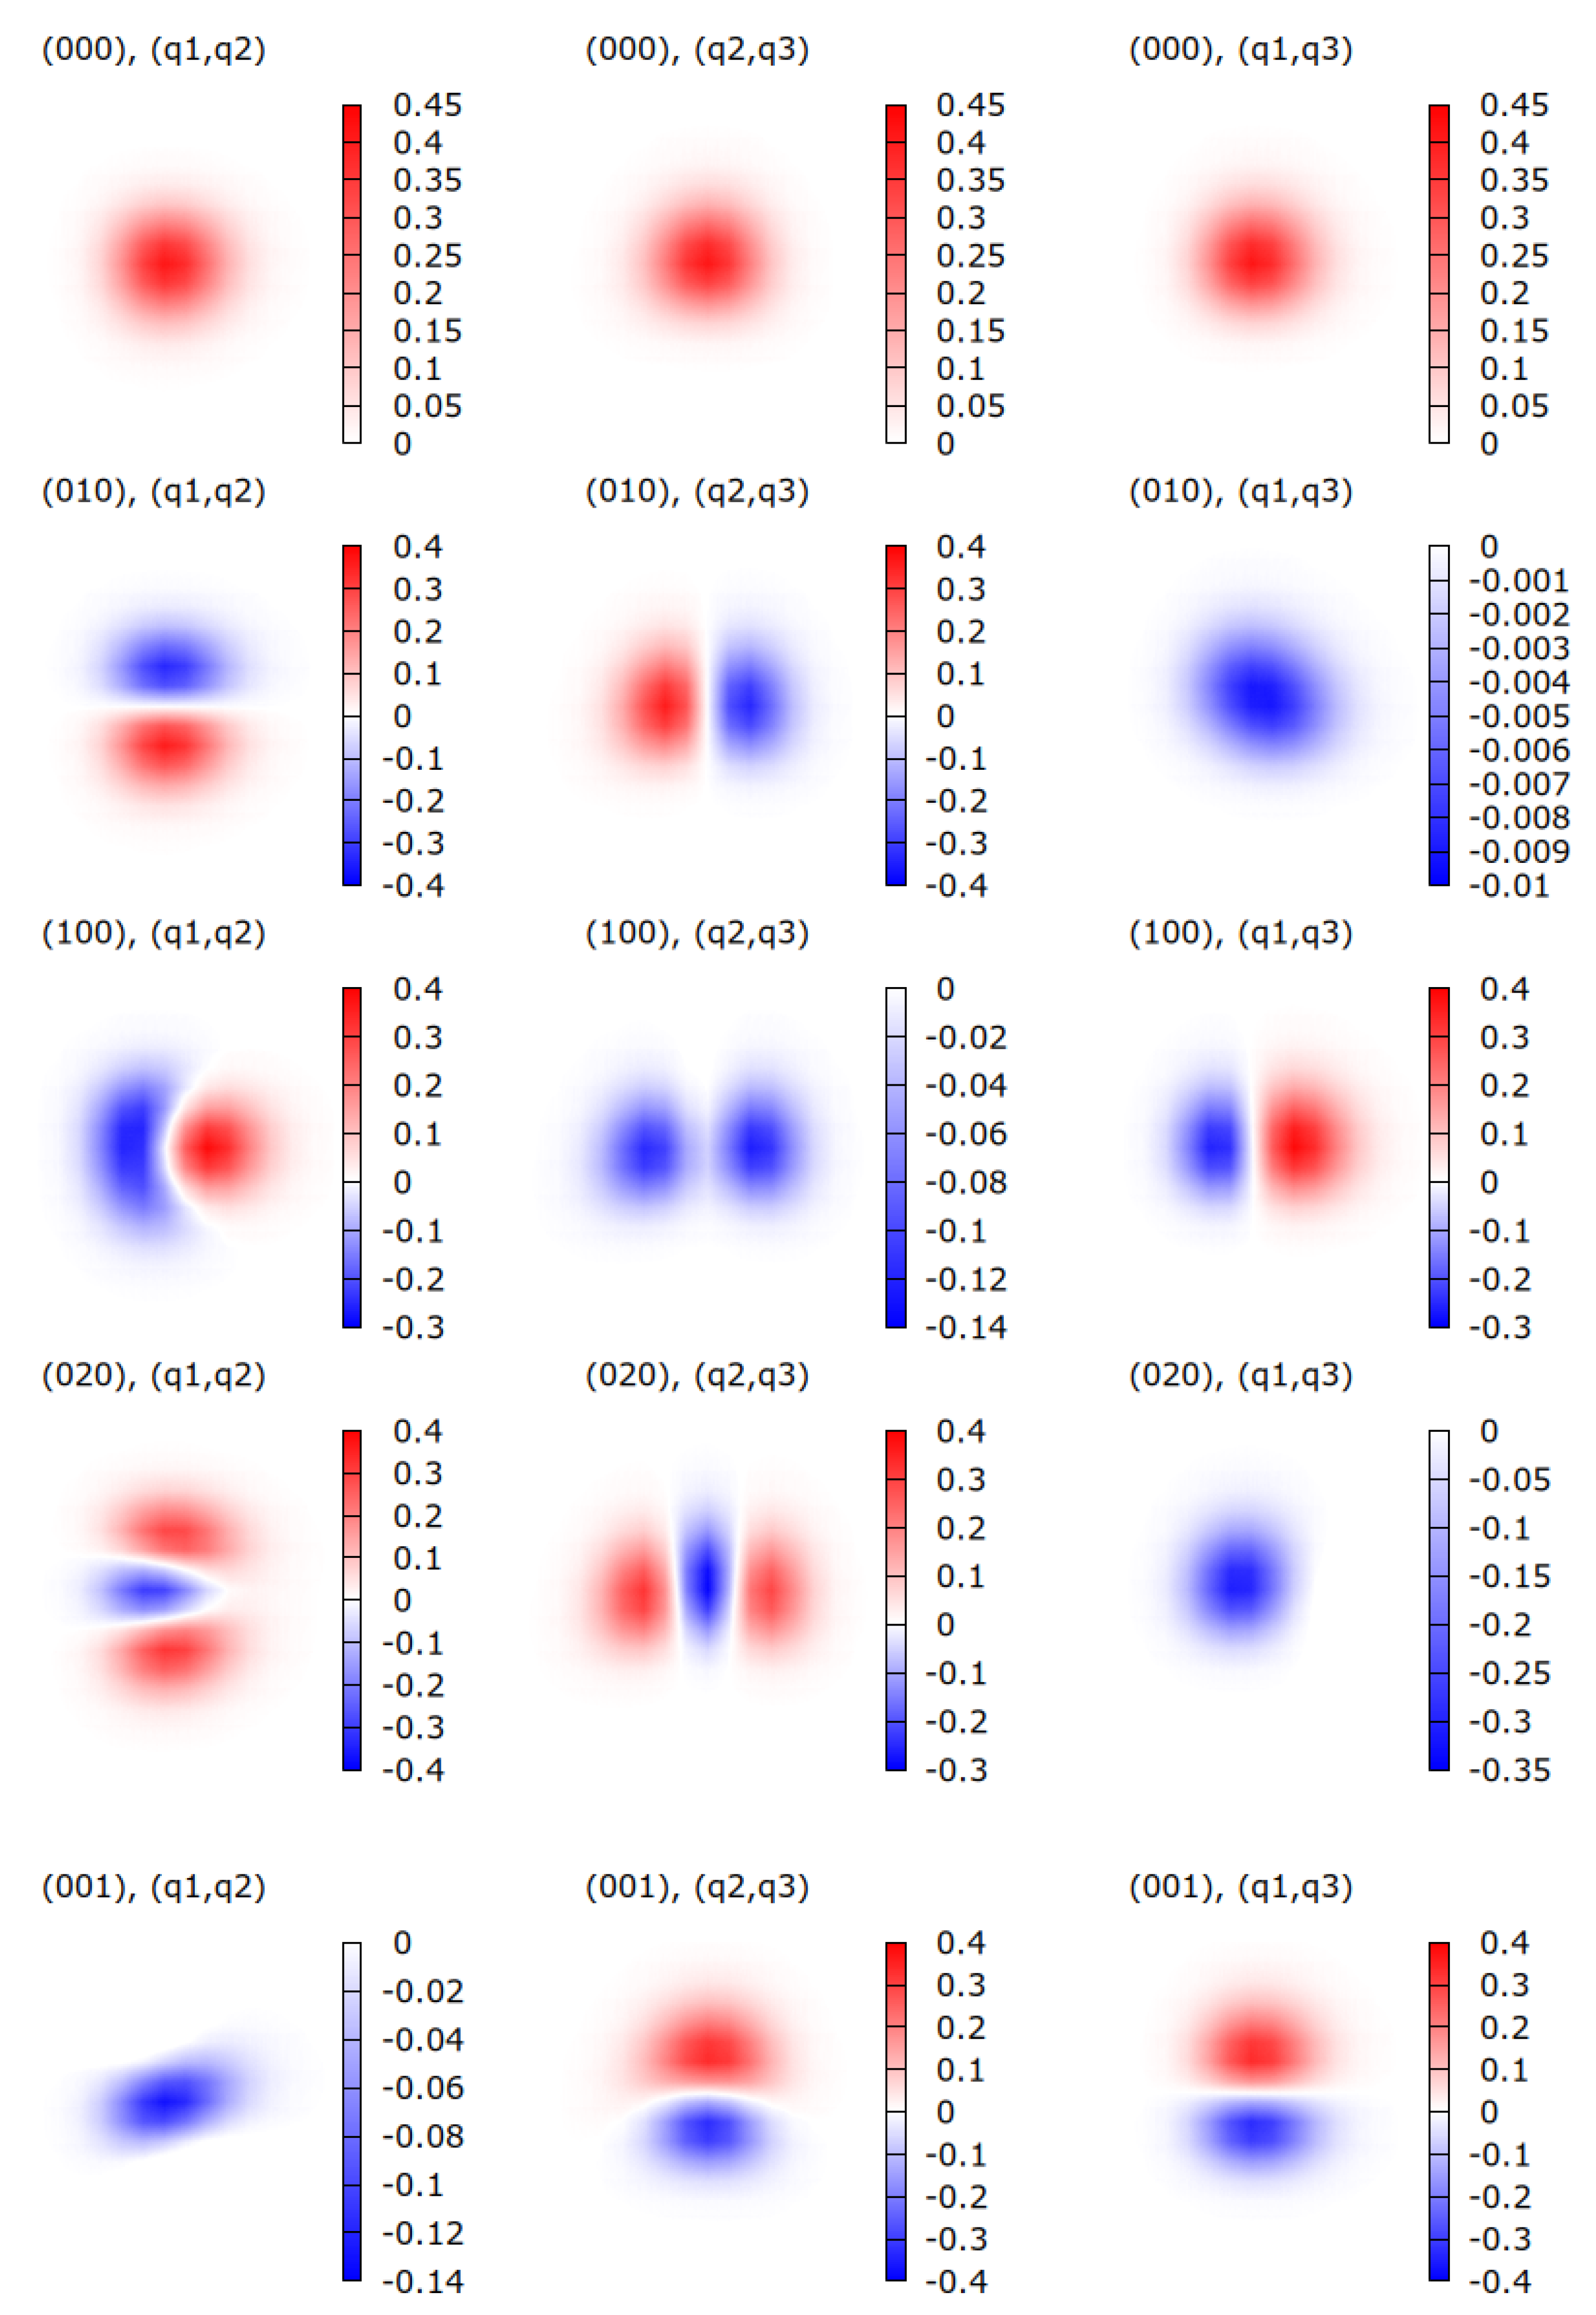
In order to perform the frame transformation procedure below and compute the cross sections further, the assignment, v = ( v 1 v 2 v 3 ) , of the low-lying vibrational levels of Table 2 are provided according to the largest square of projection v 1 , v 2 , v 3 | ψ v 2 of the wave function ψ v ( q ) , obtained numerically, on analytical normal mode states | v 1 , v 2 , v 3 (harmonic oscillator). Table 3 lists as a matrix the values of v 1 , v 2 , v 3 | ψ v 2 greater than 10 1 , i.e., ≥10%. The first row gives the assigned vibrational levels, while the first column stands for the analytical normal modes in the harmonic approximation, classified according to their energies as i = 1 3 ω i v i + 1 2 . The color scheme is used in the table: The green color denotes the largest element for which the assignment is performed, while the orange color represents the second largest value of v 1 , v 2 , v 3 | ψ v 2 .
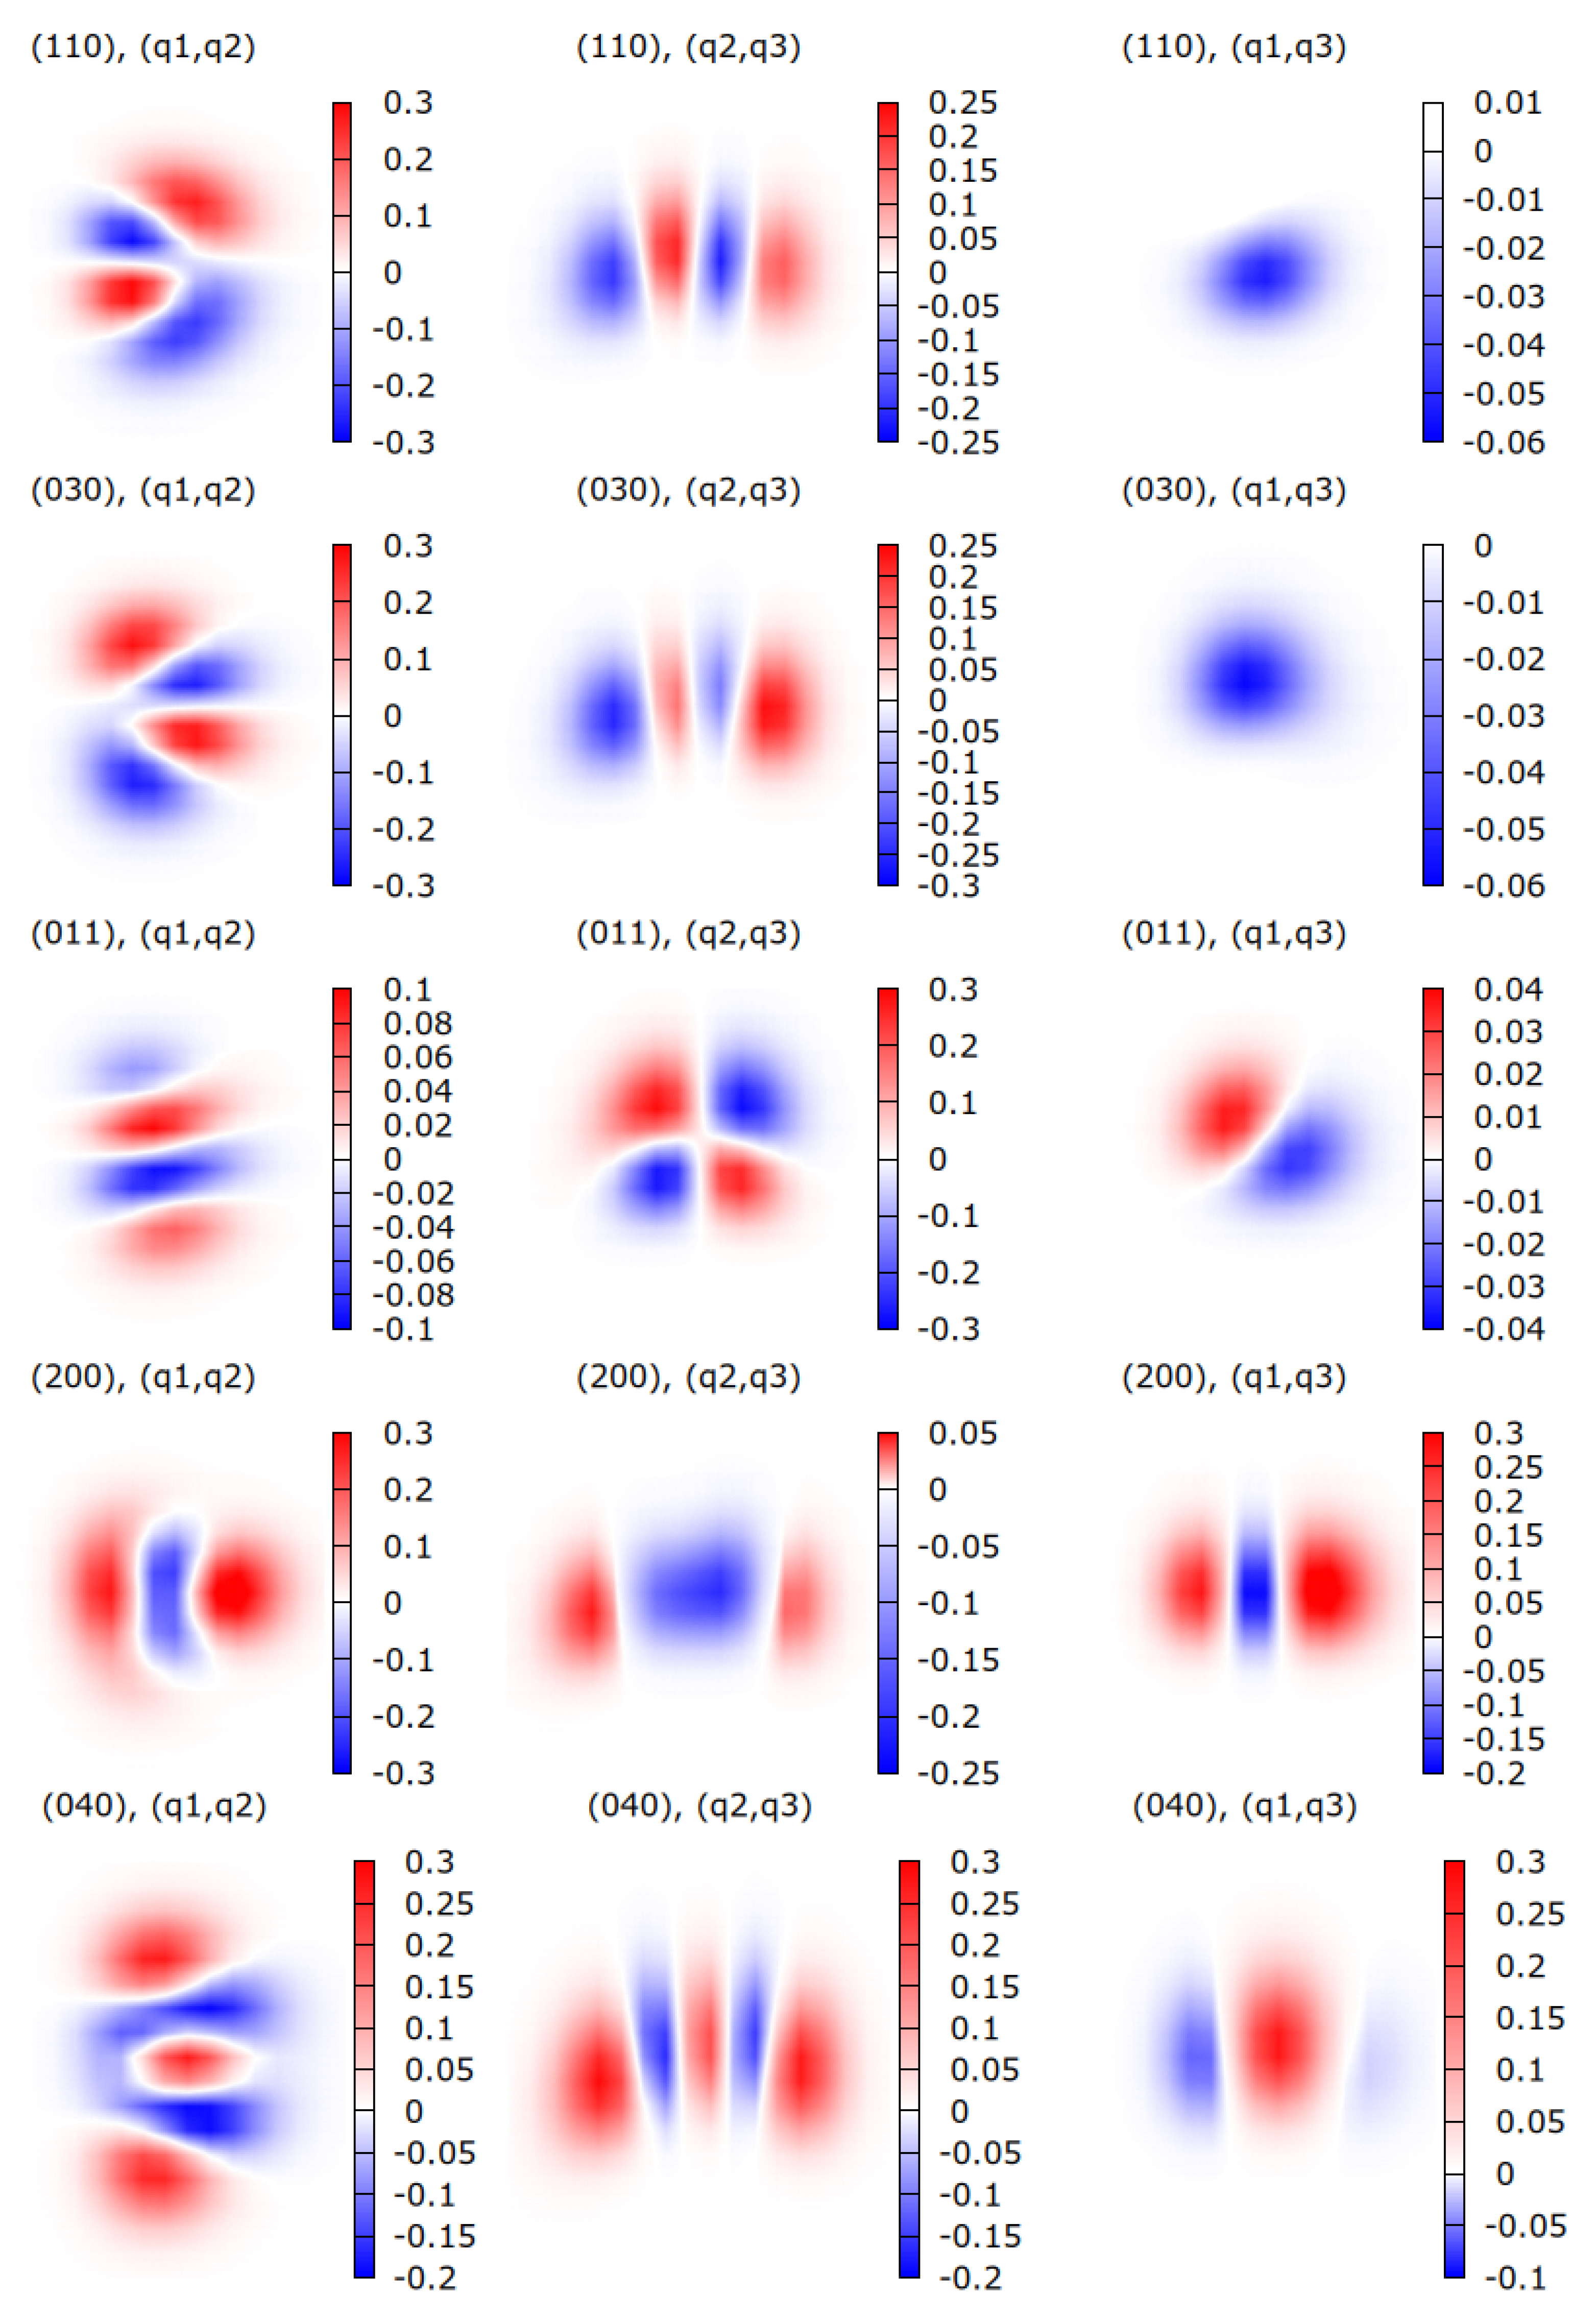
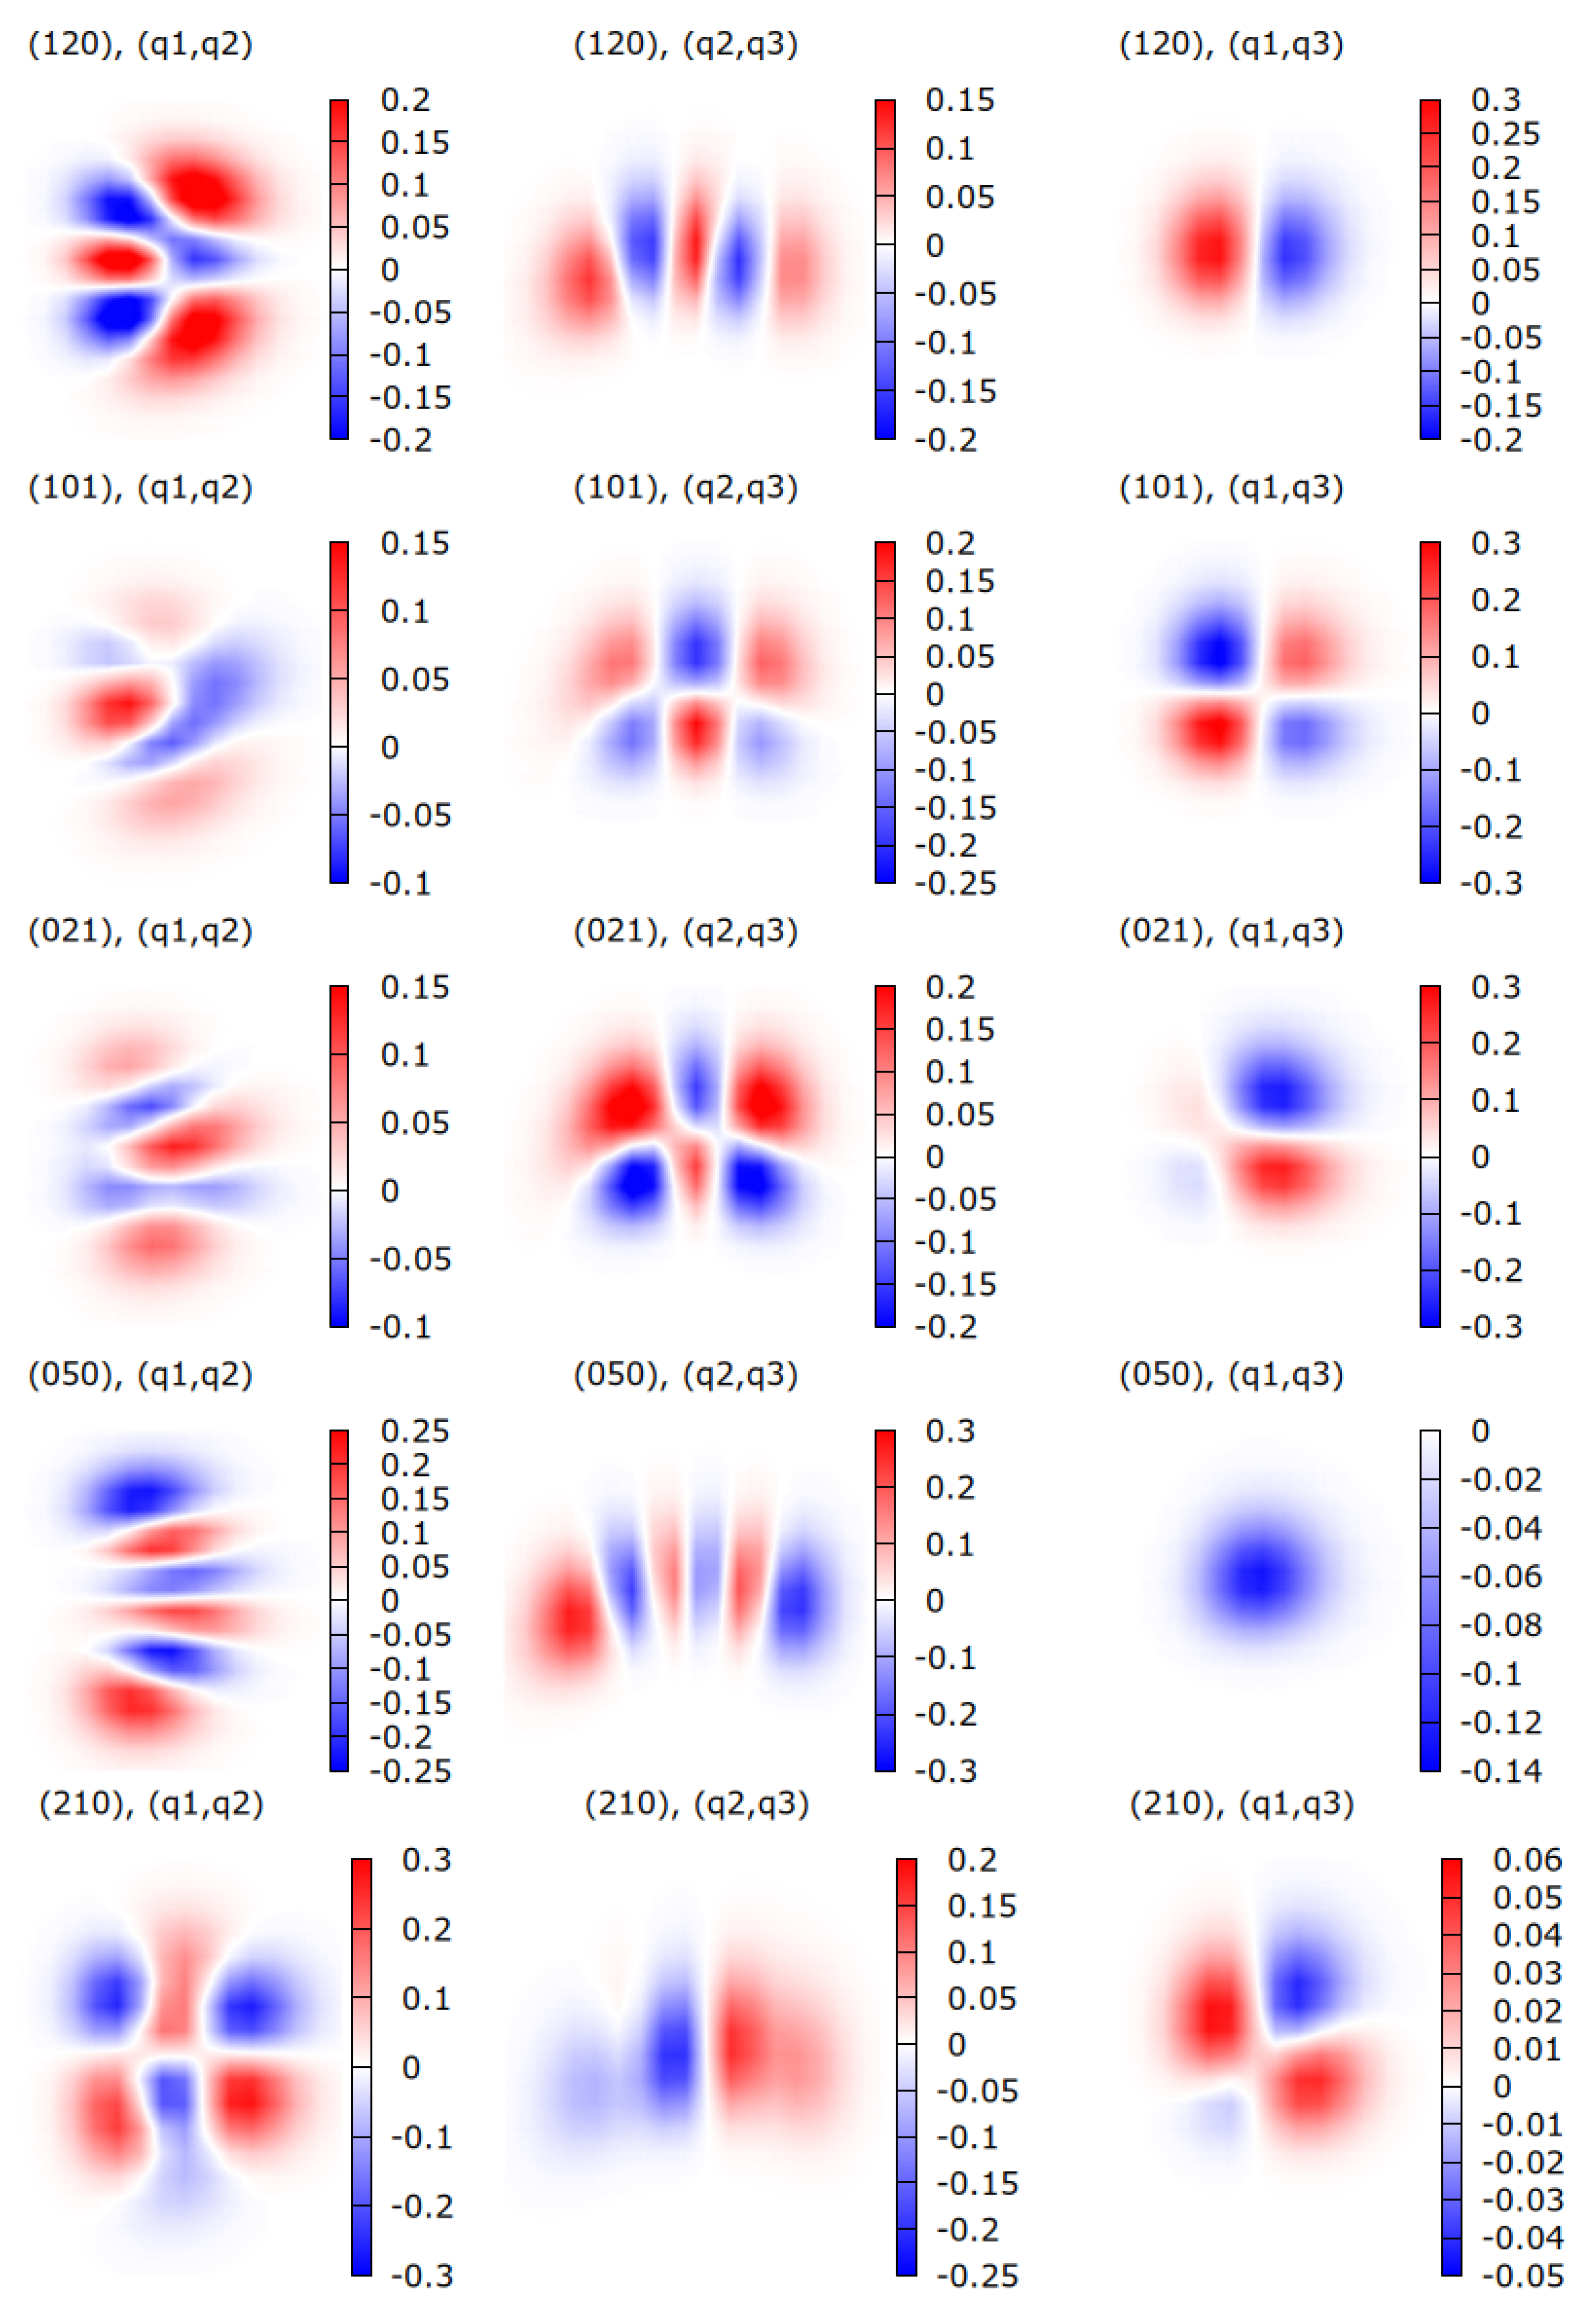
Table 3 shows that the wave functions of certain vibrational levels have a mixed character. For example, the wave functions of vibrational levels ( 110 ) and ( 030 ) seem somewhat similar due to the close coincidence between the ω 1 and 2 ω 2 harmonic frequencies giving almost the same energy for both levels. This result can be confirmed by analyzing the wave functions displayed in Figure 2, Figure 3 and Figure 4. As depicted in the first two rows of Figure 3, the wave functions of levels ( 110 ) and ( 030 ) are indeed similar. Analogously, the wave functions of levels ( 120 ) and ( 040 ) or ( 101 ) and ( 021 ) are similar to each other, yielding to large values of v 1 , v 2 , v 3 | ψ v 2 , as stated in orange in the table. This behavior of the wave functions could be attributed to the anharmonicity of the H2O PES [22] employed in this study.

2.4. The Scattering Matrix for an Electron Colliding with HDO

Using the vibrational wave functions and geometry-fixed S-matrix depending on the normal coordinates, the scattering matrix describing the process
e ( l λ ) + H D O ( v ) e ( l λ ) + H D O ( v ) ,
can be computed using
S l λ v , l λ v e x = ψ v ( q ) S l λ , l λ e x ( q ) ψ v ( q ) ,
where the above bra−kets imply an integration over the three normal coordinates q = q 1 , q 2 , q 3 . This integral is evaluated on DVR grid points with the geometry-fixed scattering matrix S l λ , l λ e x ( q ) obtained for each scattering energy E e l , using a methodology summarized in Table 4. This methodology includes seven steps in calculations, starting from the R-matrix calculations of the reactance matrix K ̲ ( q ) —performed on a few geometries (see Figure 1)—followed by the interpolation and extrapolation of the scattering matrix. These latter steps are performed on the scattering phaseshifts Δ ̲ ( q ) instead of S ̲ ( q ) due to its smooth behavior with respect to the normal coordinates q .

3. Results and Discussions

3.1. Cross Sections

Using the above scattering matrix, the cross section for the v v process is written as
σ v v E e l = π 2 2 m E e l l λ l λ | S l λ v , l λ v e x δ v , v δ l λ , l λ | 2 ,
where m and E e l are the mass of the electron and the scattering energy.
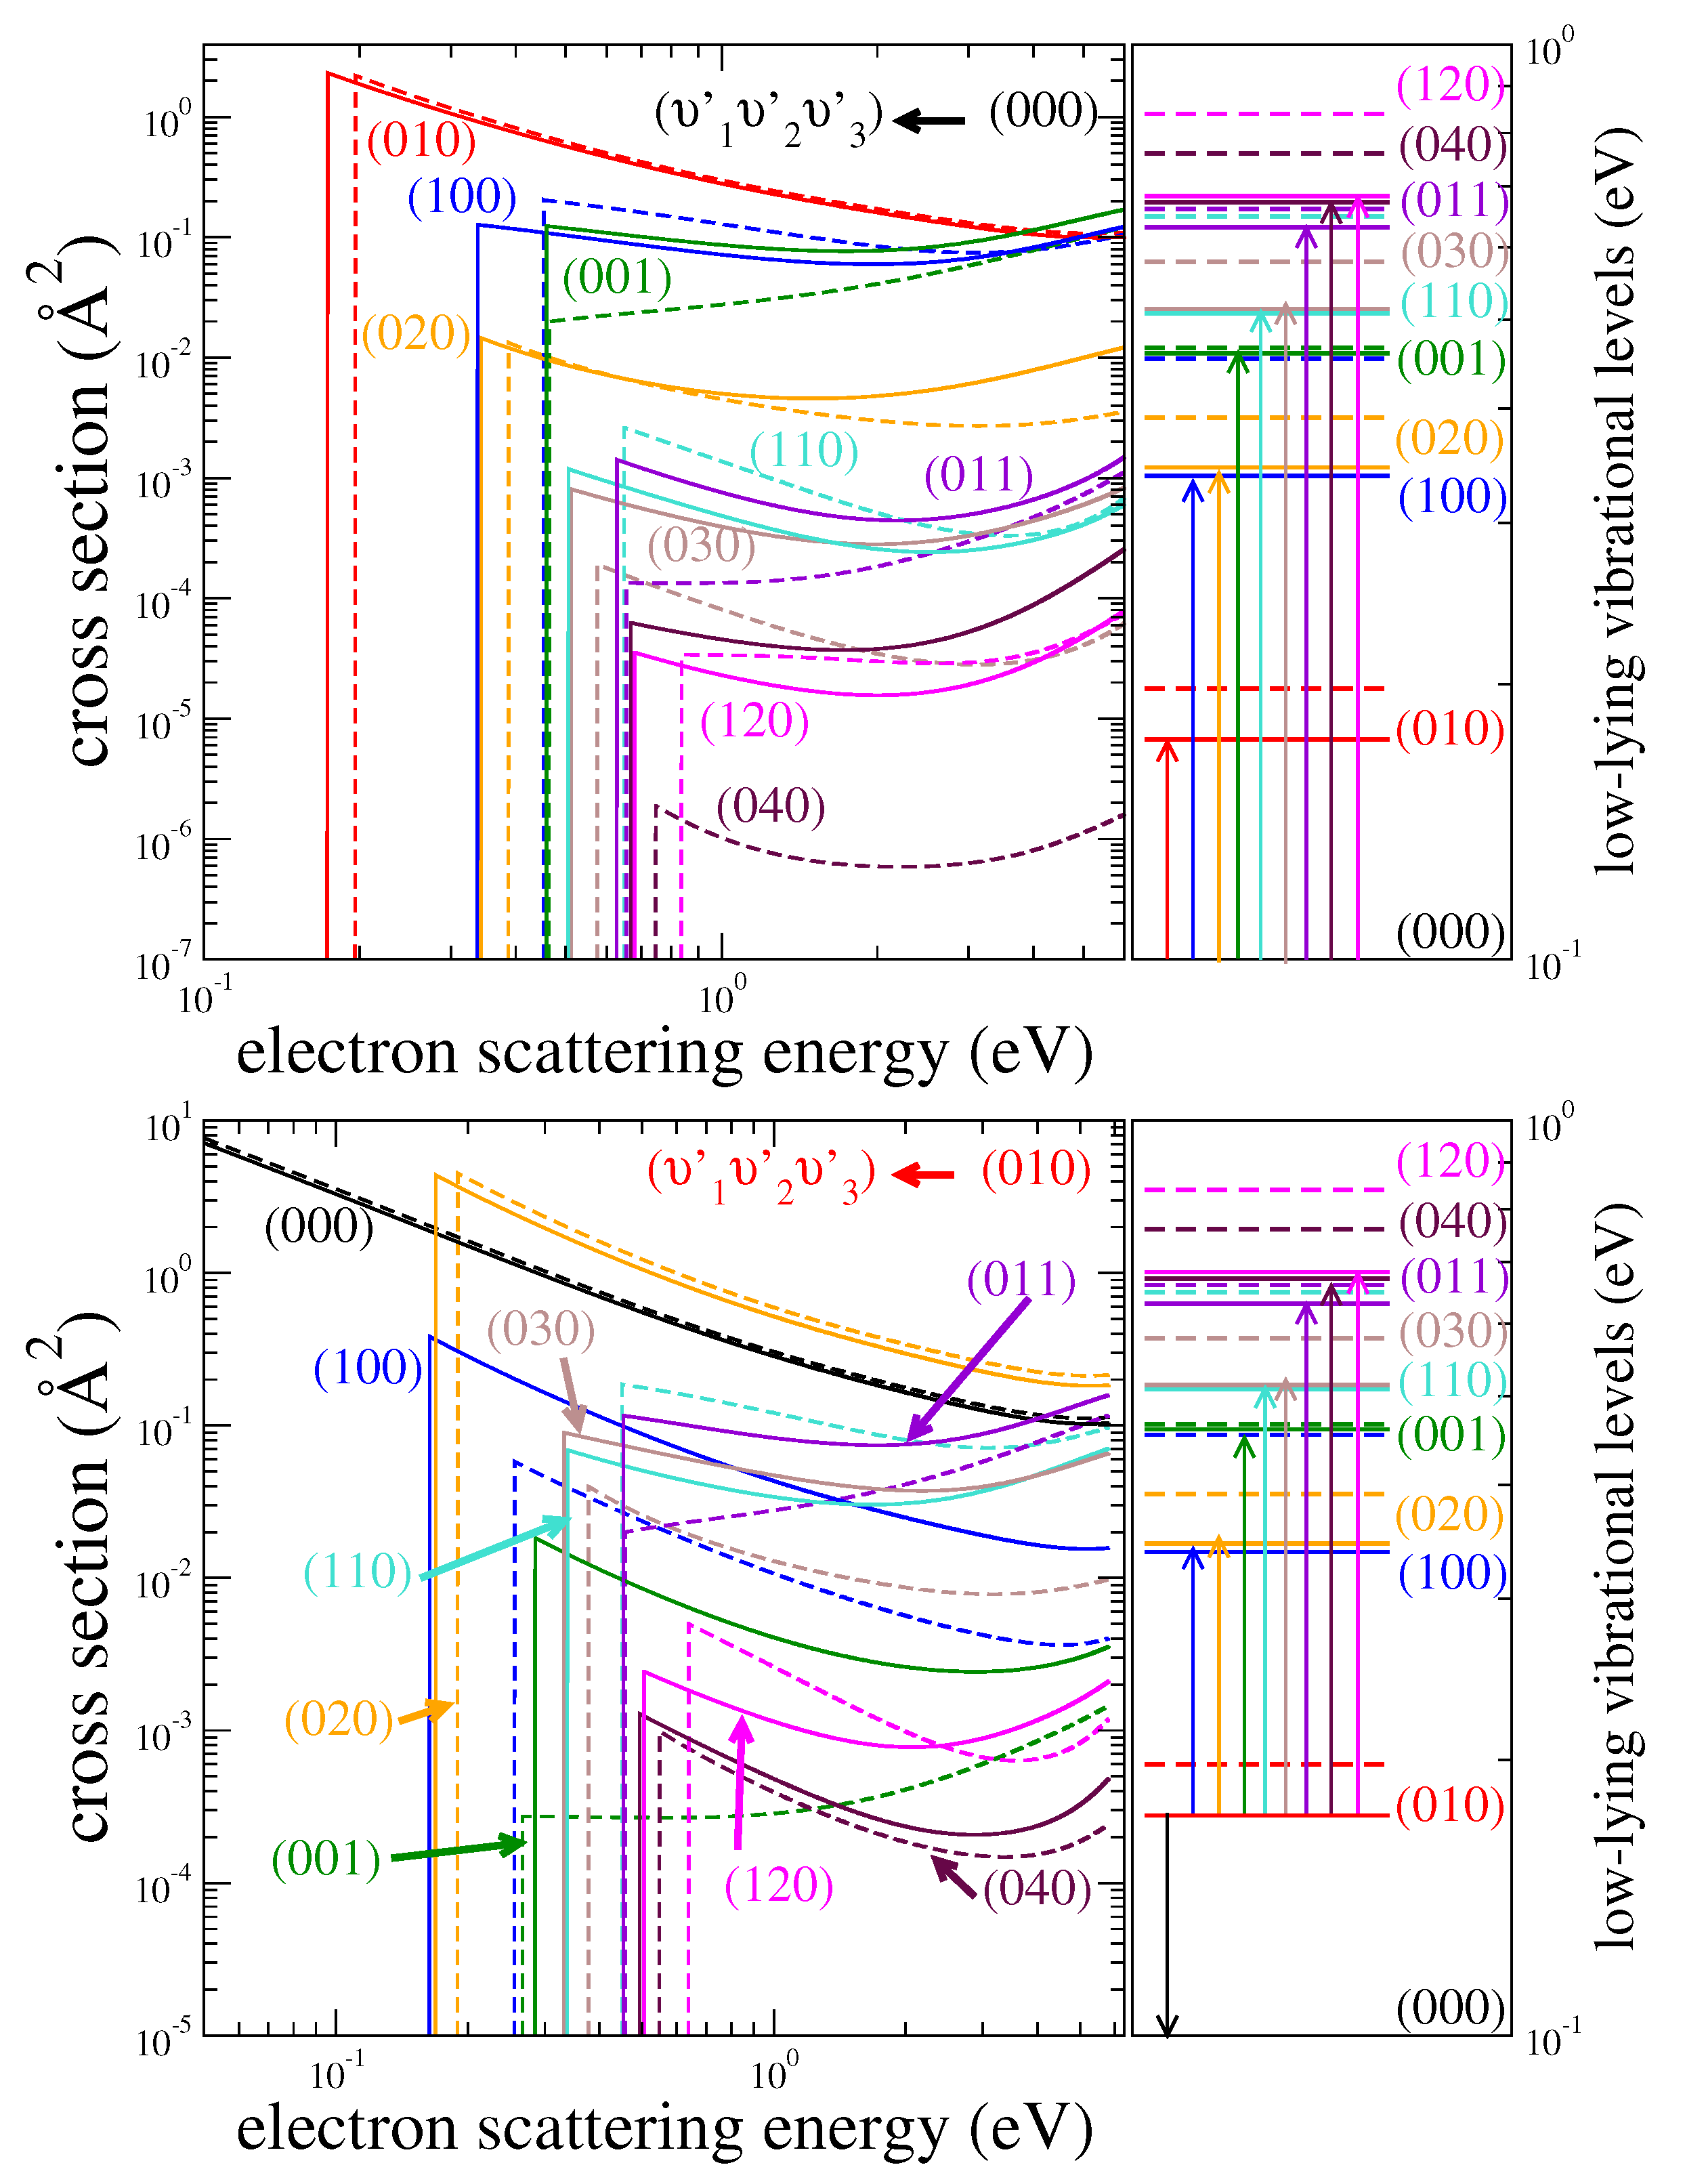
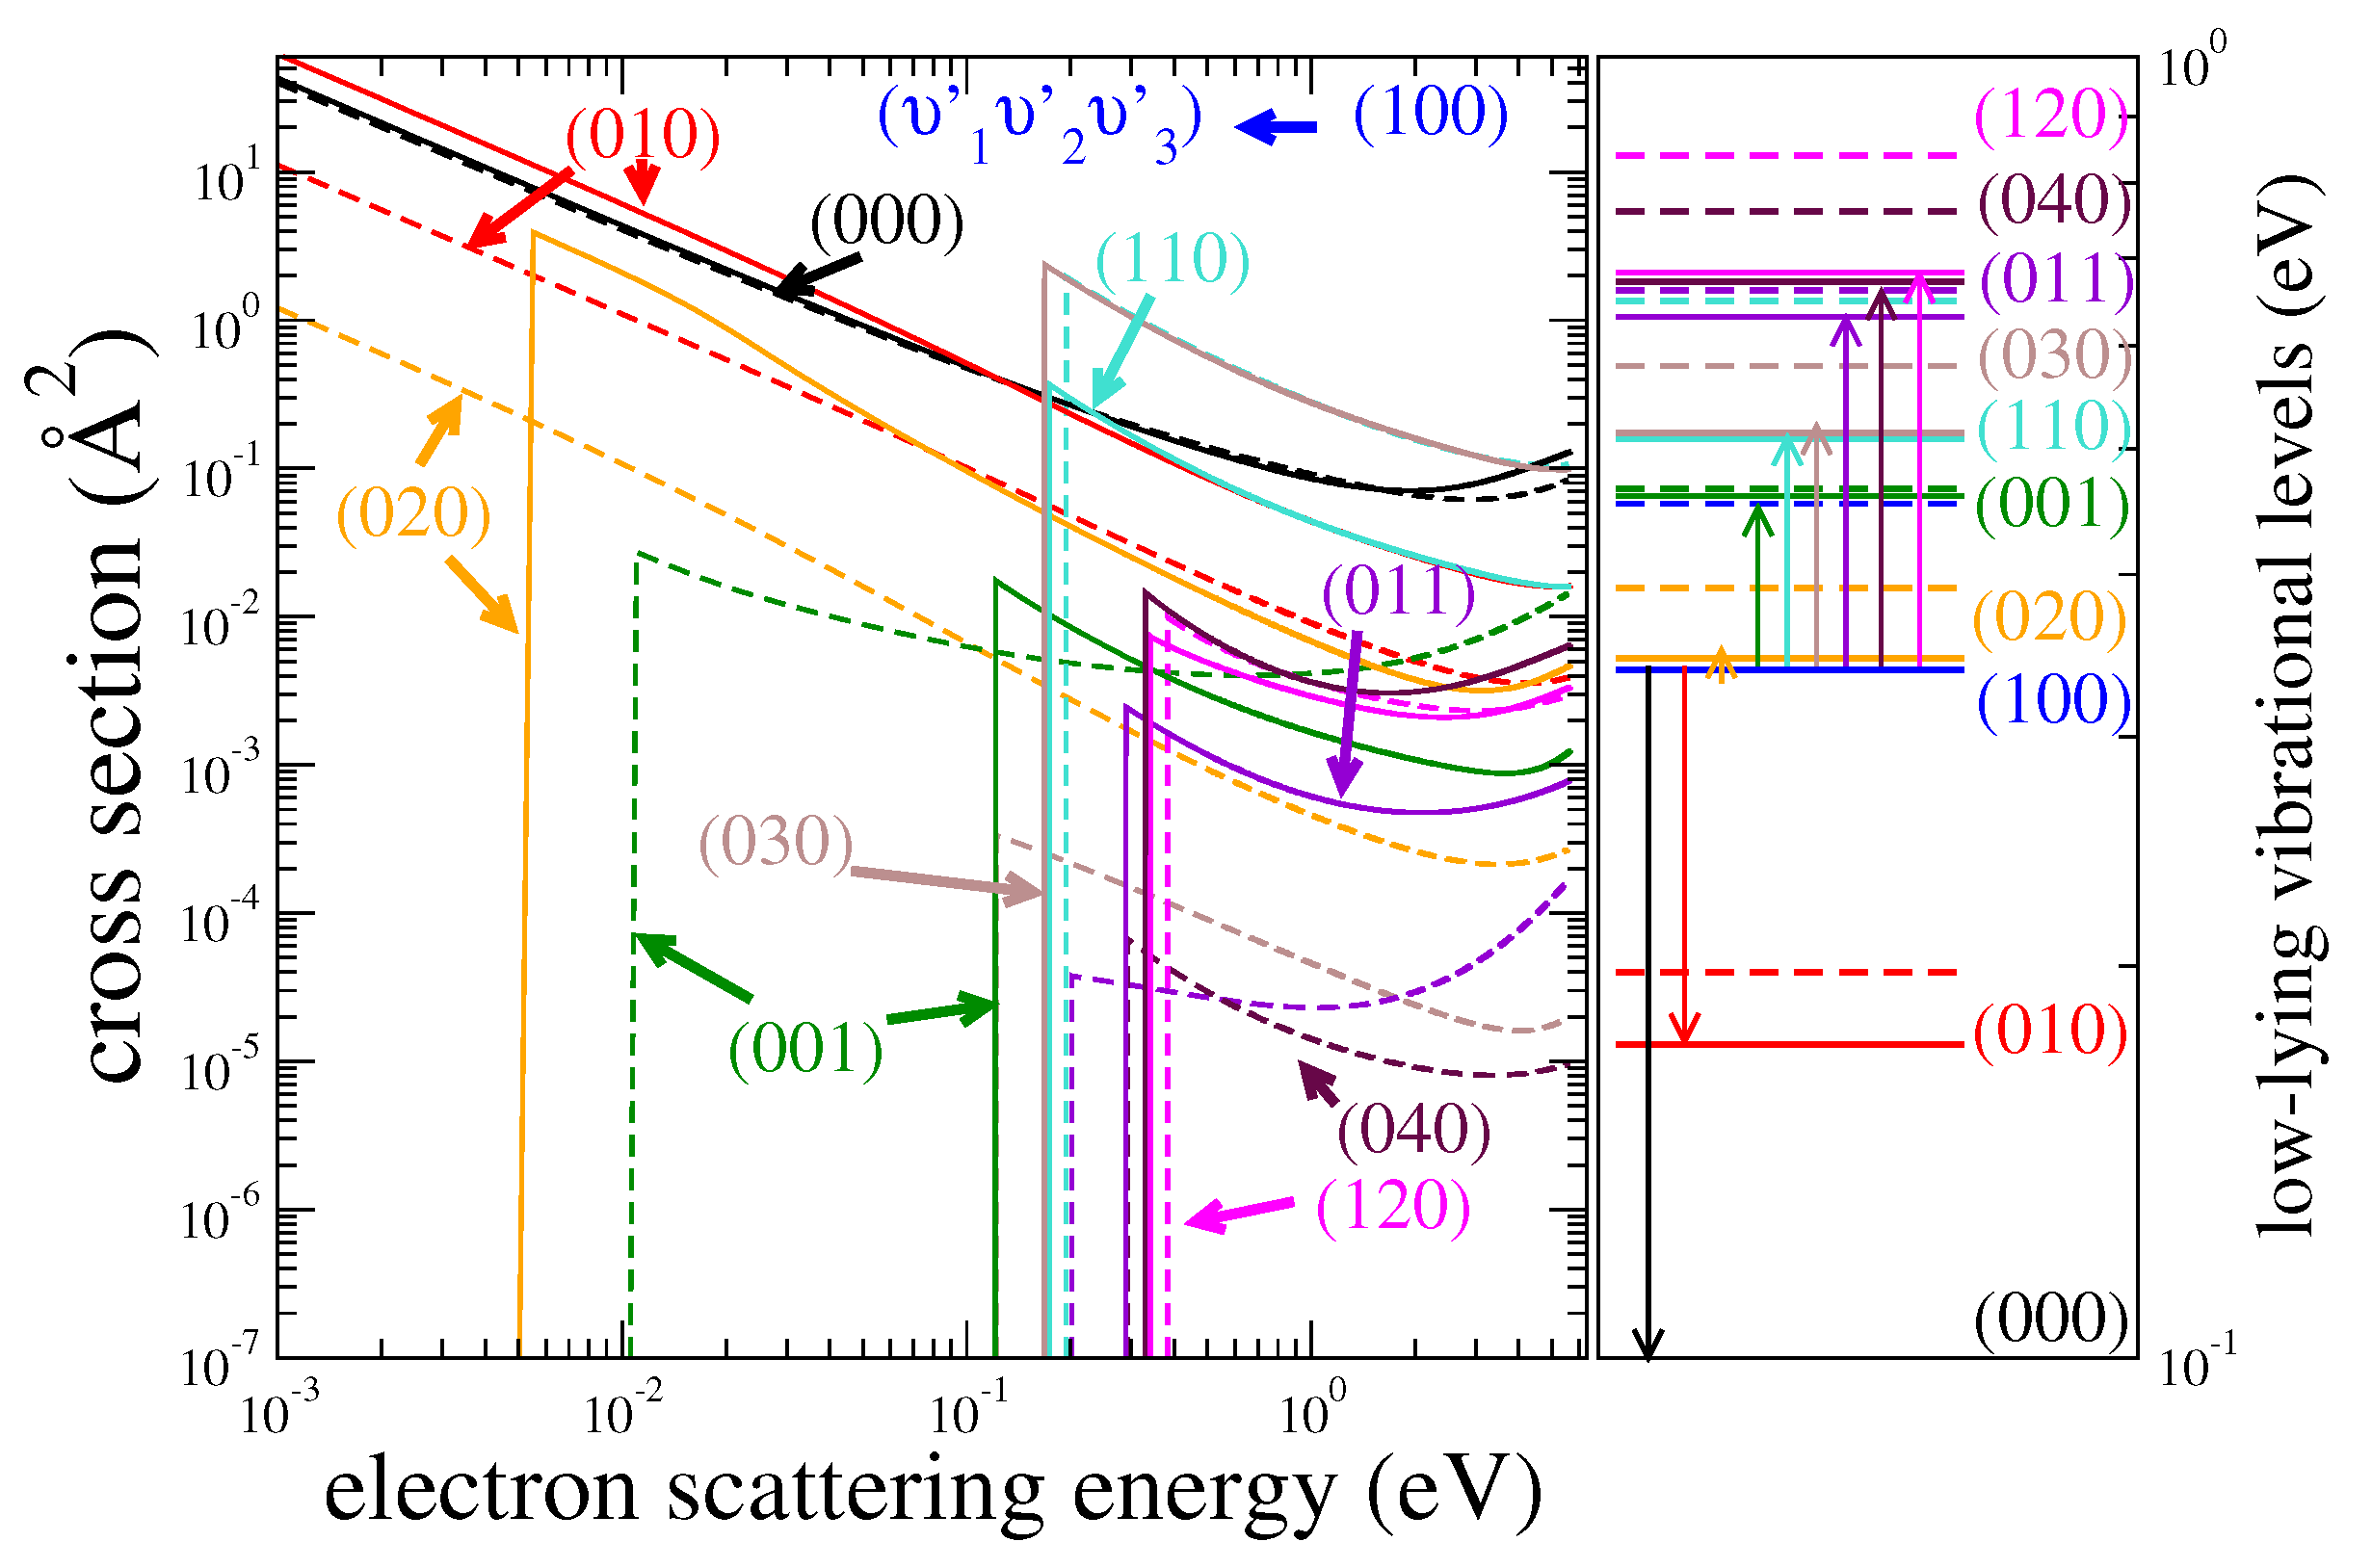
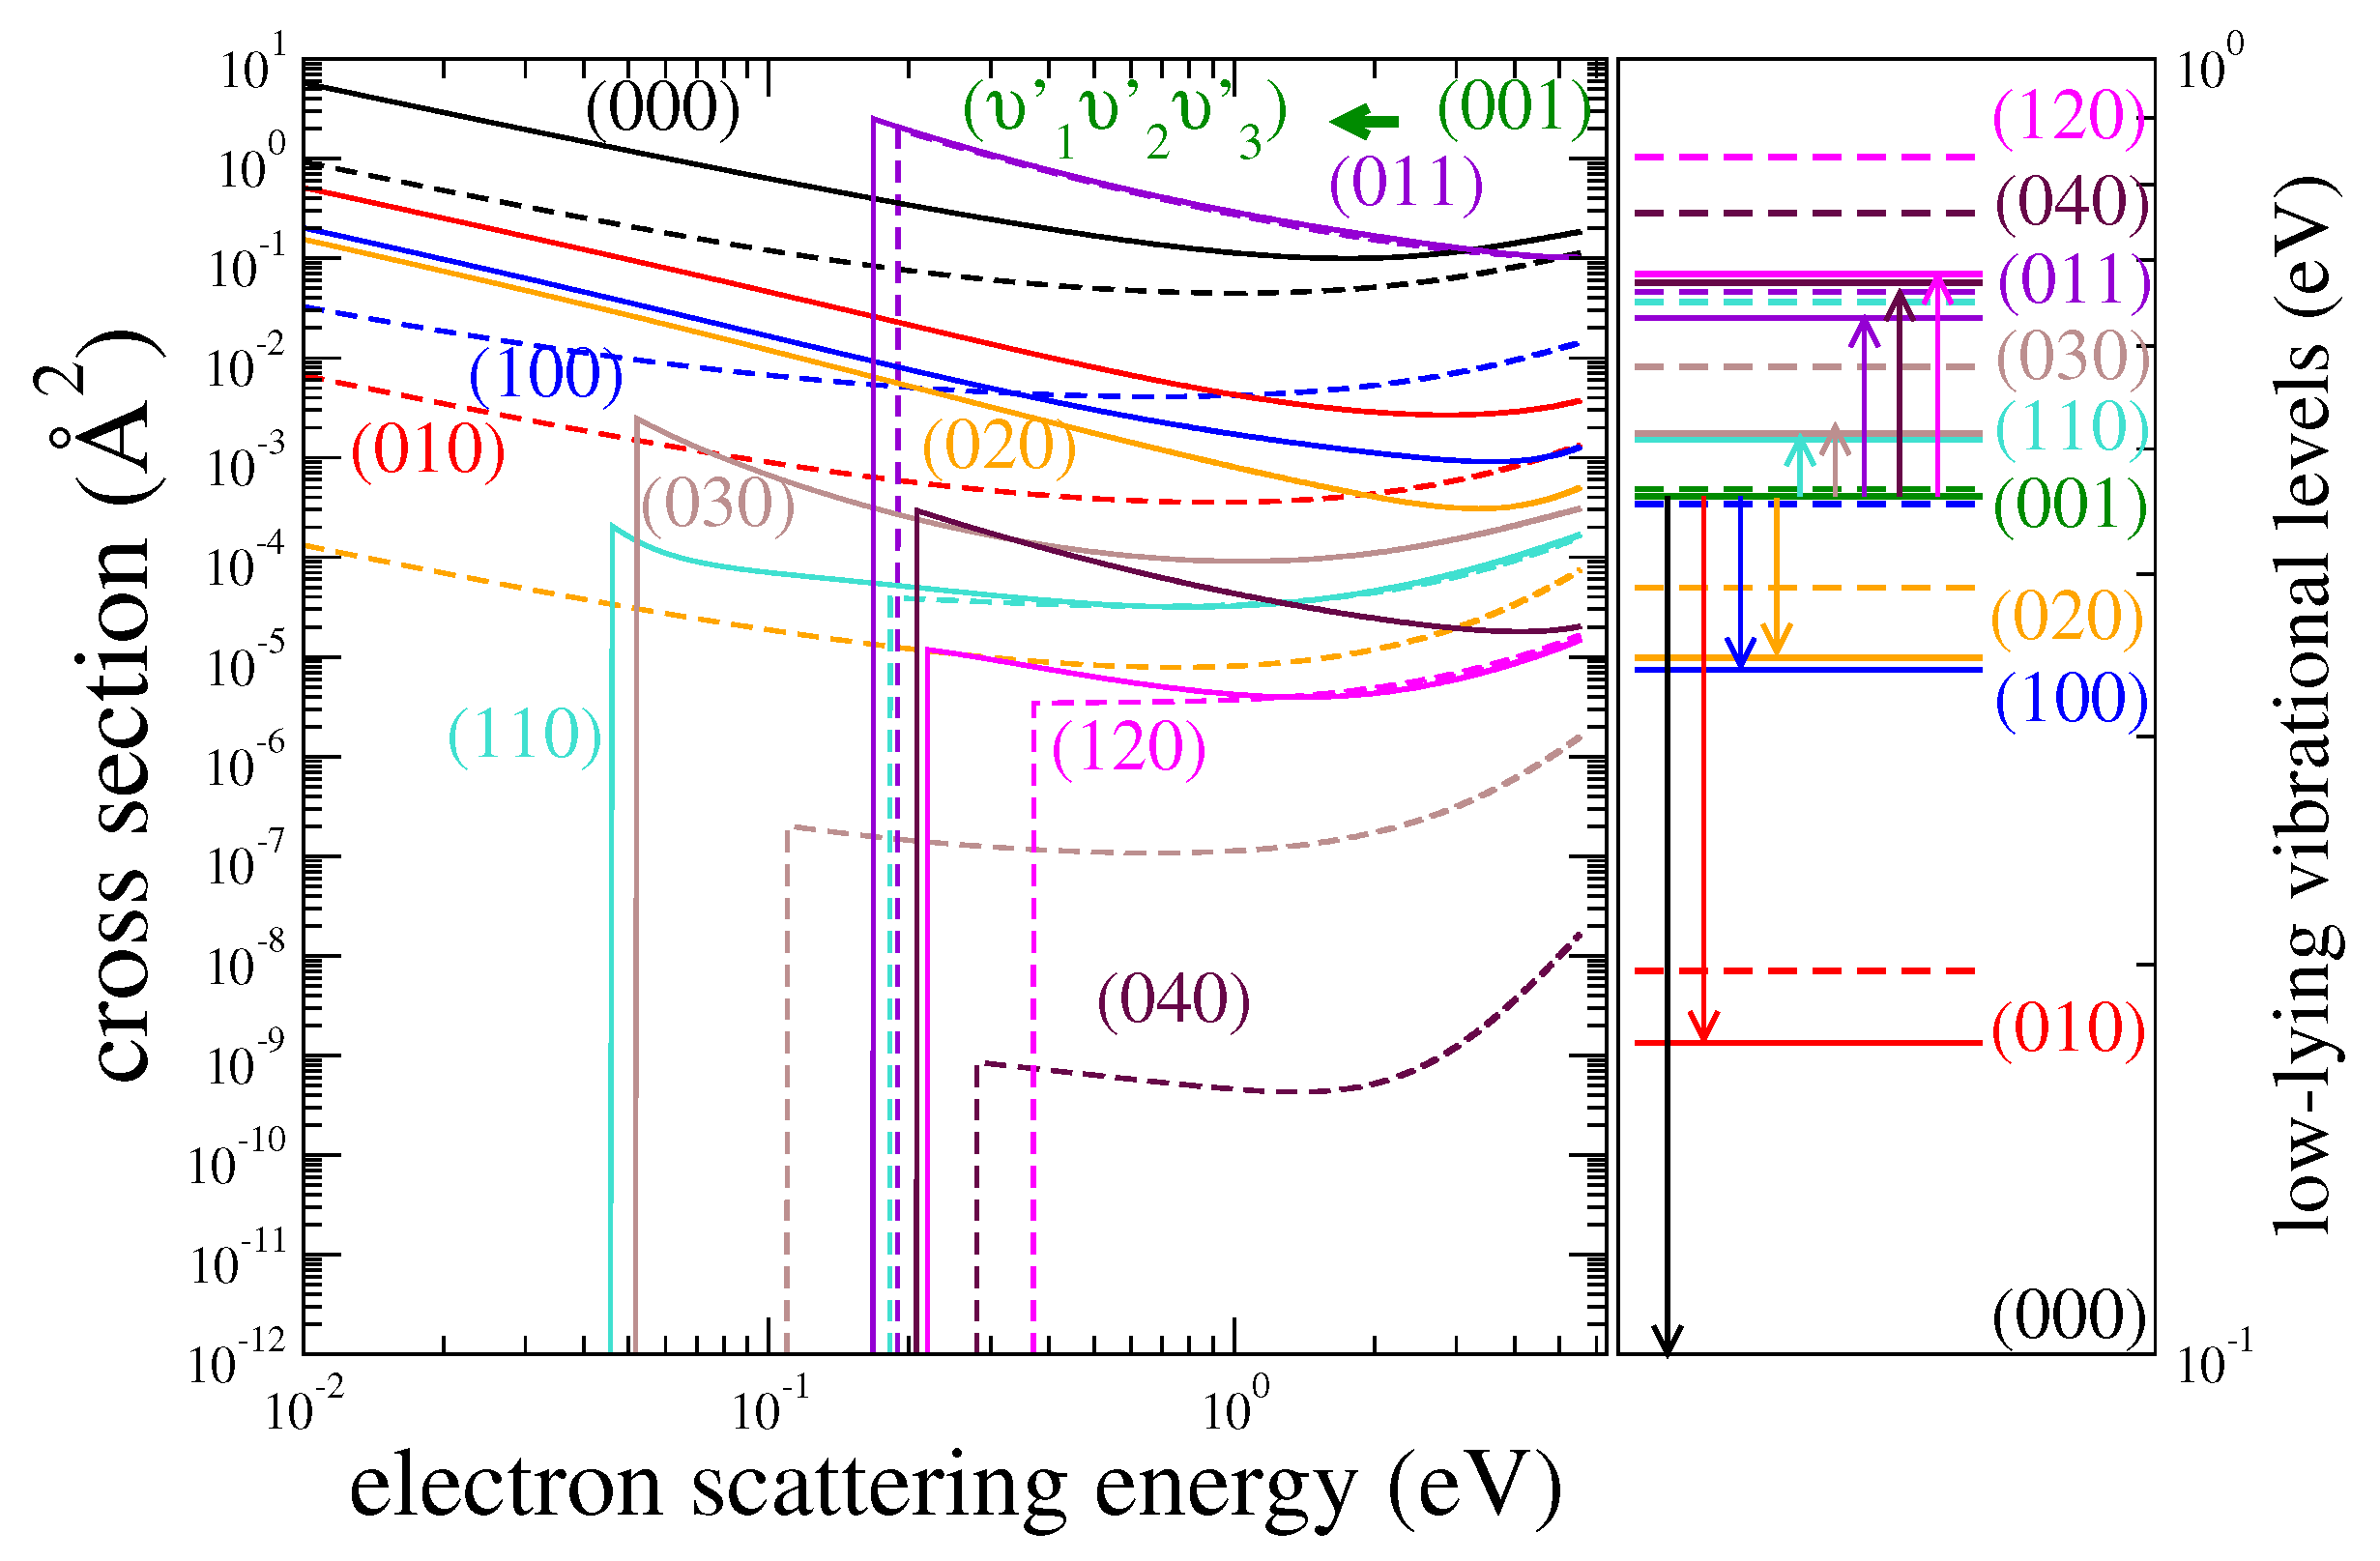
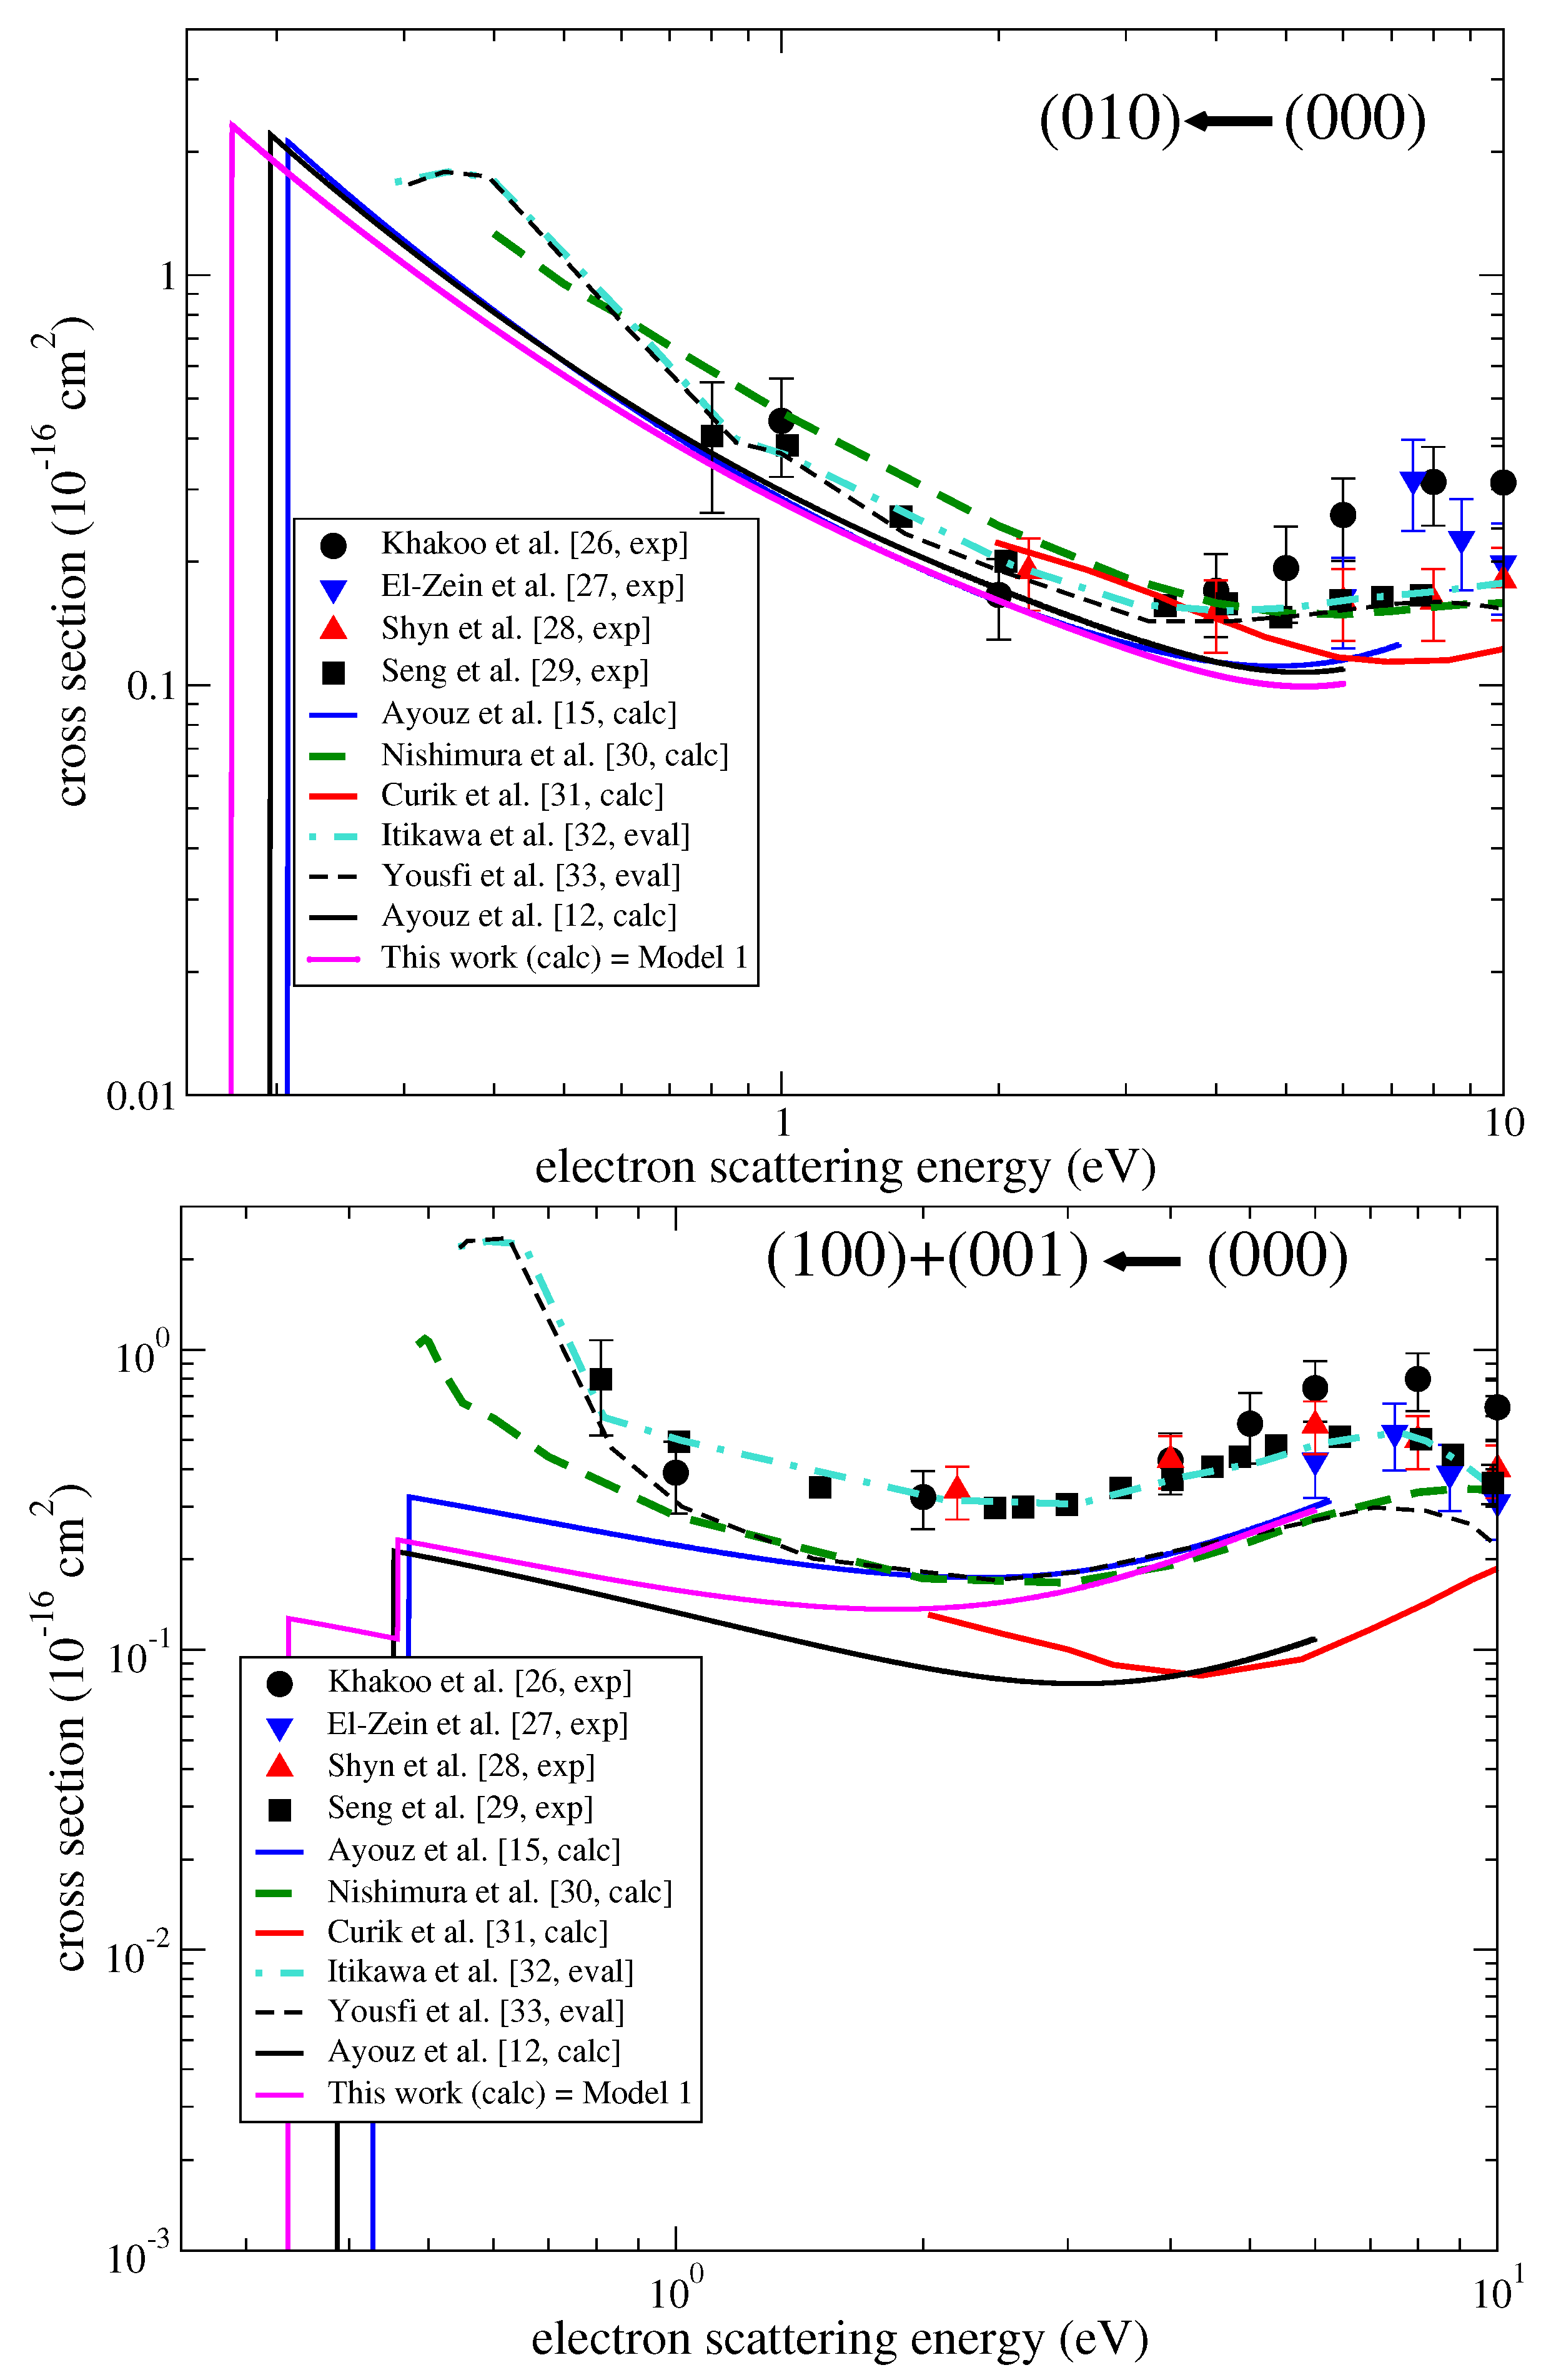
Figure 5 and Figure 6 show cross sections for the initial levels ( 000 ) , (010), ( 100 ) and ( 001 ) , in solid lines. The cross sections of e H2O, published in Ref. [12], are also shown in dashed lines. One can see that the largest cross sections are those for one-quantum (de-)excitation; however, inter-mode transitions are also significant. A comparison to available experimental data and previous calculations of H2O [16] is given in Figure 7. The cross sections of the HDO isotopologue are in general comparable to those of H2O, but differences larger than a factor of 3 are also observed, even for large cross sections such as ( 010 ) ( 100 ) or ( 000 ) ( 001 ) . In addition, some excitation transitions in HDO are (de-)excitation transitions in H2O due to the different level ordering (e.g., ( 020 ) ( 100 ) ). As a result, the D substitution has a significant effect on the vibrational excitation of H2O, and the cross sections for H2O cannot be used reliably for HDO, especially at low electron energy. We note that a similar conclusion was drawn for the rotational excitation of HDO by H2, see Ref. [9].
The earlier calculations [16] of excitation cross section in H2O calculations were performed using the normal-mode approximation representing the vibrational motion of the molecule. The normal-mode approximation for H2O is not particularly accurate. For example, the projection squared of the accurate state ( 100 ) having one quantum in the symmetric stretching mode on the normal-mode wave function is only about 83%, while for the state ( 200 ) , it is only 47%. Therefore, the uncertainty in the cross section calculations performed with the normal mode approximation is, at best, 20% for the ( 000 ) ( 100 ) transition and 50% for the ( 000 ) ( 200 ) transition. In the 2024 study [12], the vibrational wave functions were obtained solving the 3-dimensional vibrational Schrodinger equation numerically, i.e., the vibrational wave functions were much more accurate. Otherwise, the theoretical methods were the same in the two studies. Therefore, the results obtained in [12] are a priori more accurate. The cross section obtained in the 2024 study is lower than the experiment, especially for excitation of the stretching mode. The reason for the disagreement is not clear. One possibility is that it could be due to the rotational coupling, which is neglected in the theoretical approach.
Calculations for HDO were performed using accurate vibrational wave functions with the same method as it was used in the 2024 study of H2O. No experimental data exist on vibrational excitation of HDO. Assuming that the experimental data for H2O (not the theory) should be taken as a benchmark, and given that the theory agrees with the experiment for excitation of the bending mode, one can conclude that the theoretical cross section for the excitation of the bending mode in HDO is accurate, while the theoretical results for the stretching modes could be underestimated by a factor of 2–4.

3.2. Rate Coefficients

The thermally averaged rate coefficient α v v T is obtained as
α v v T = 8 π m ( k b T ) 3 0 σ v v ( E e l ) exp E e l k b T E e l d E e l ,
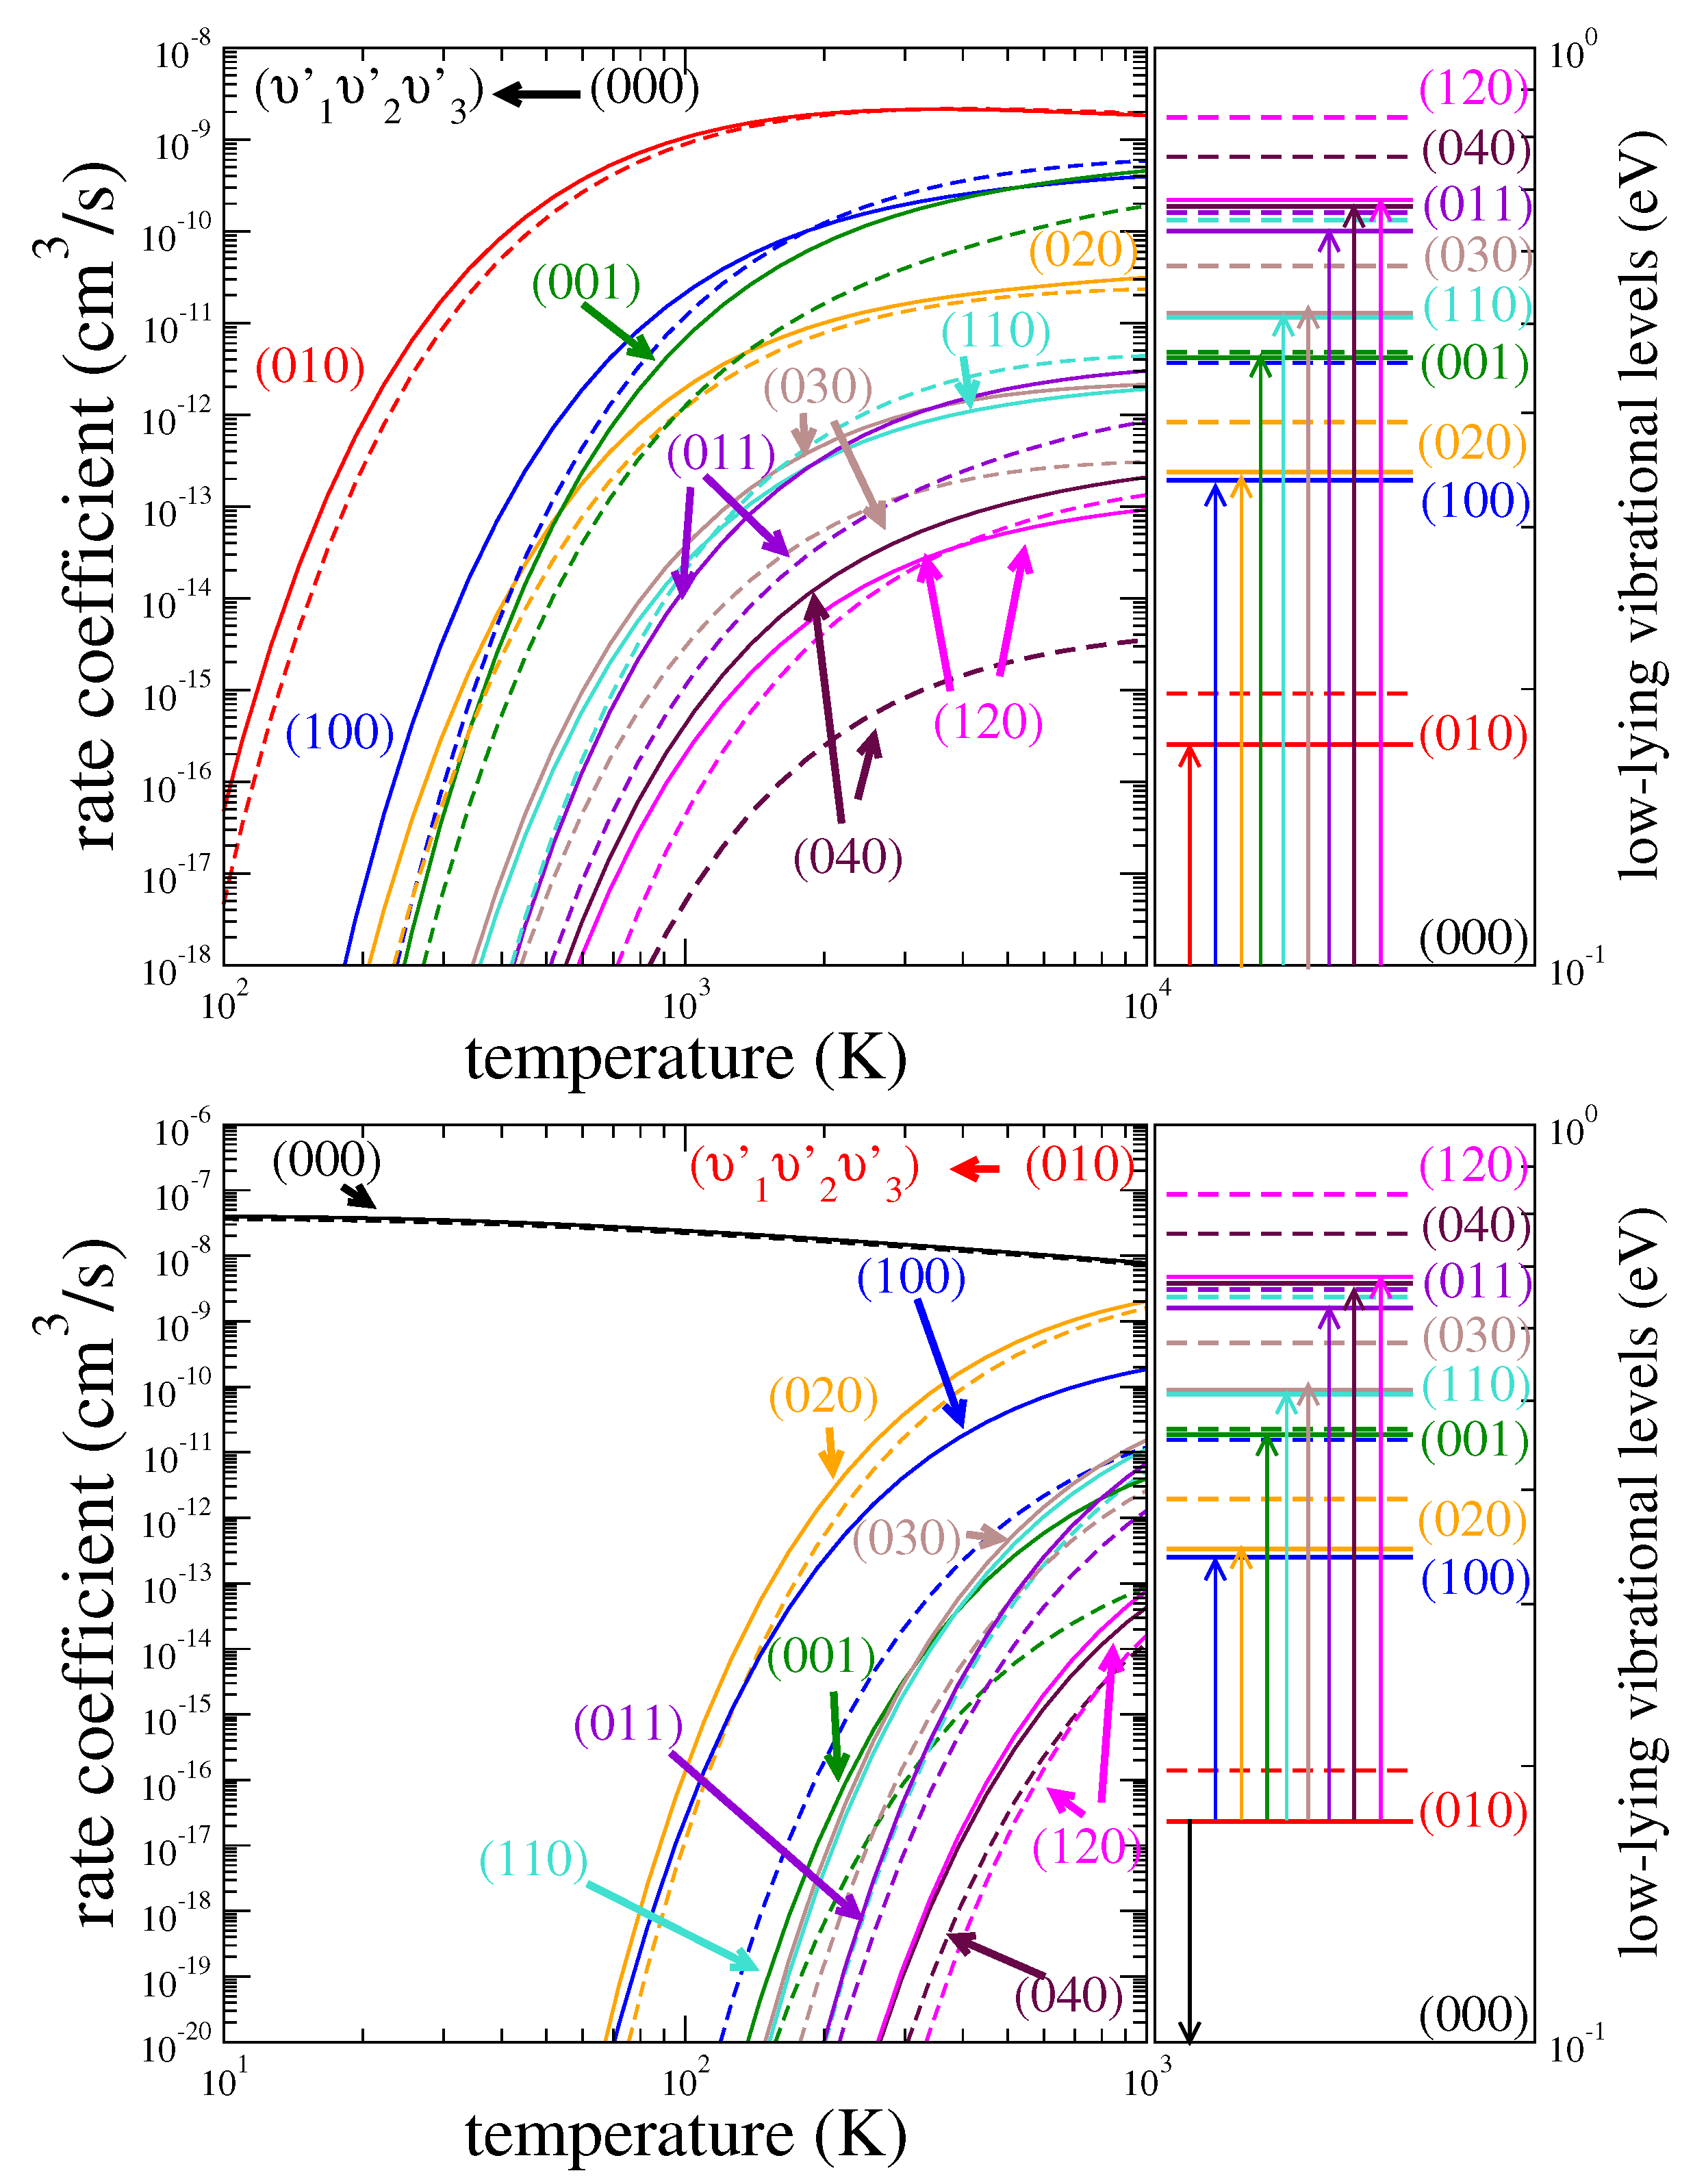
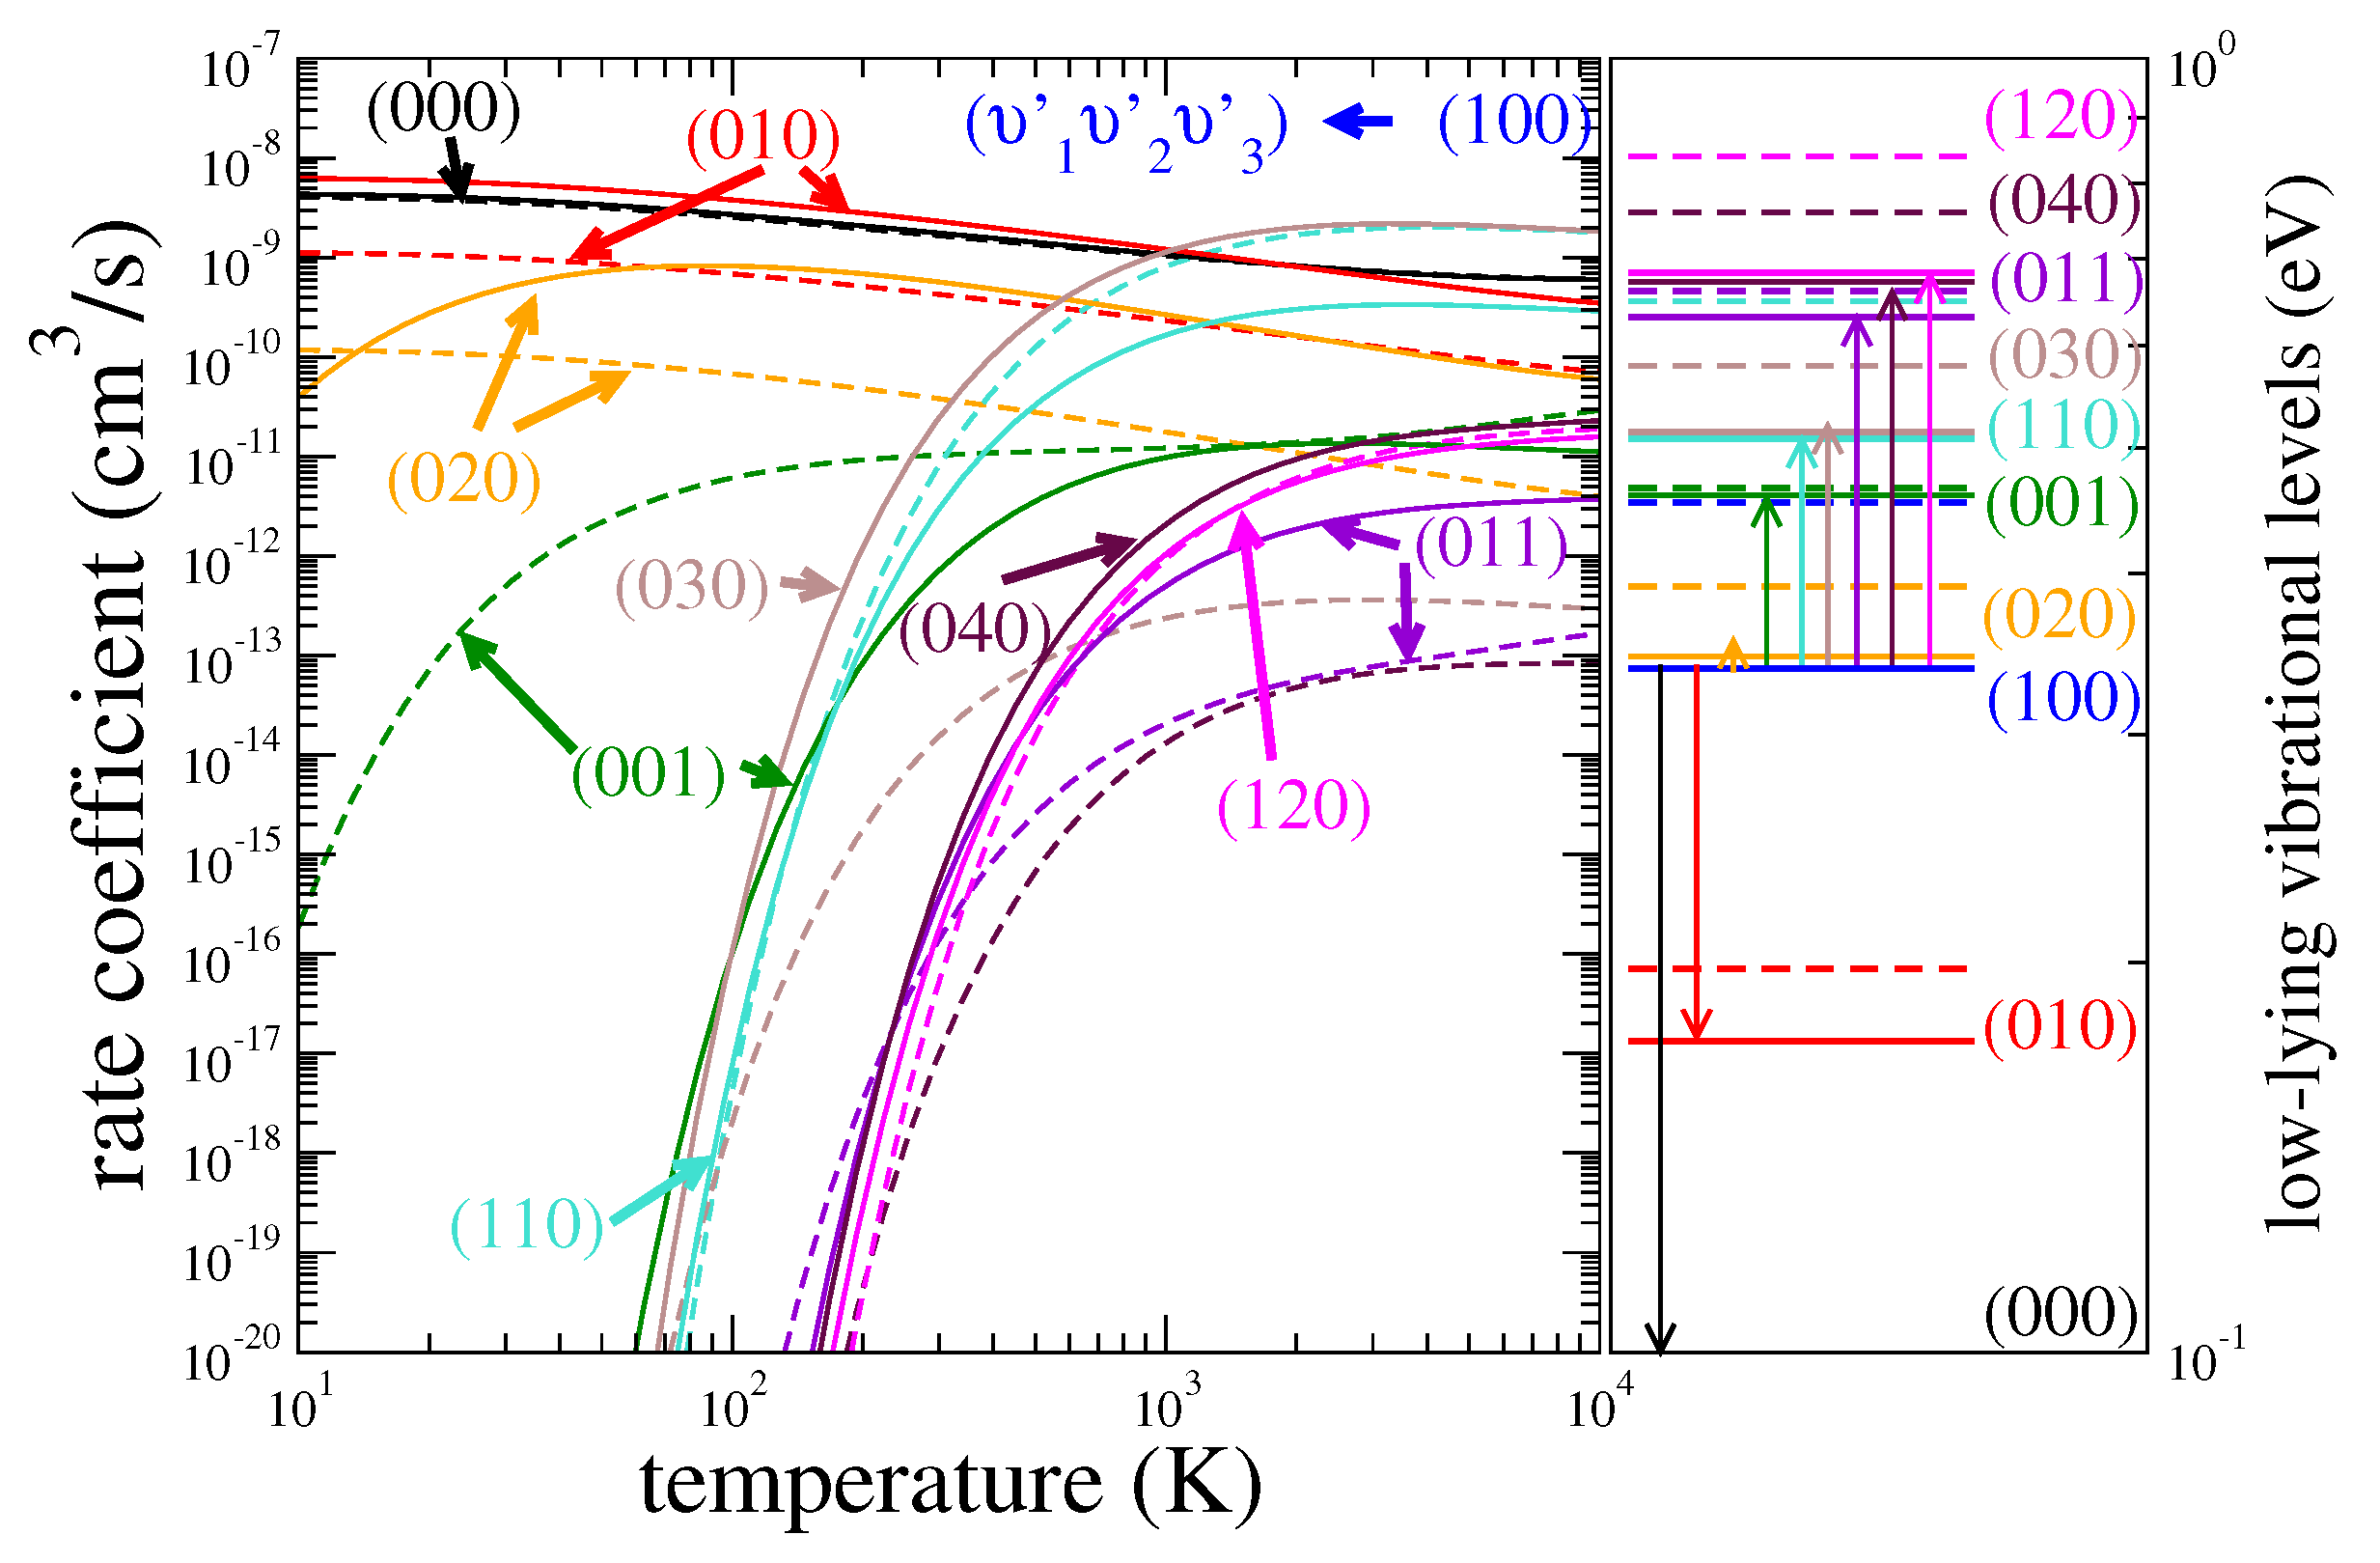
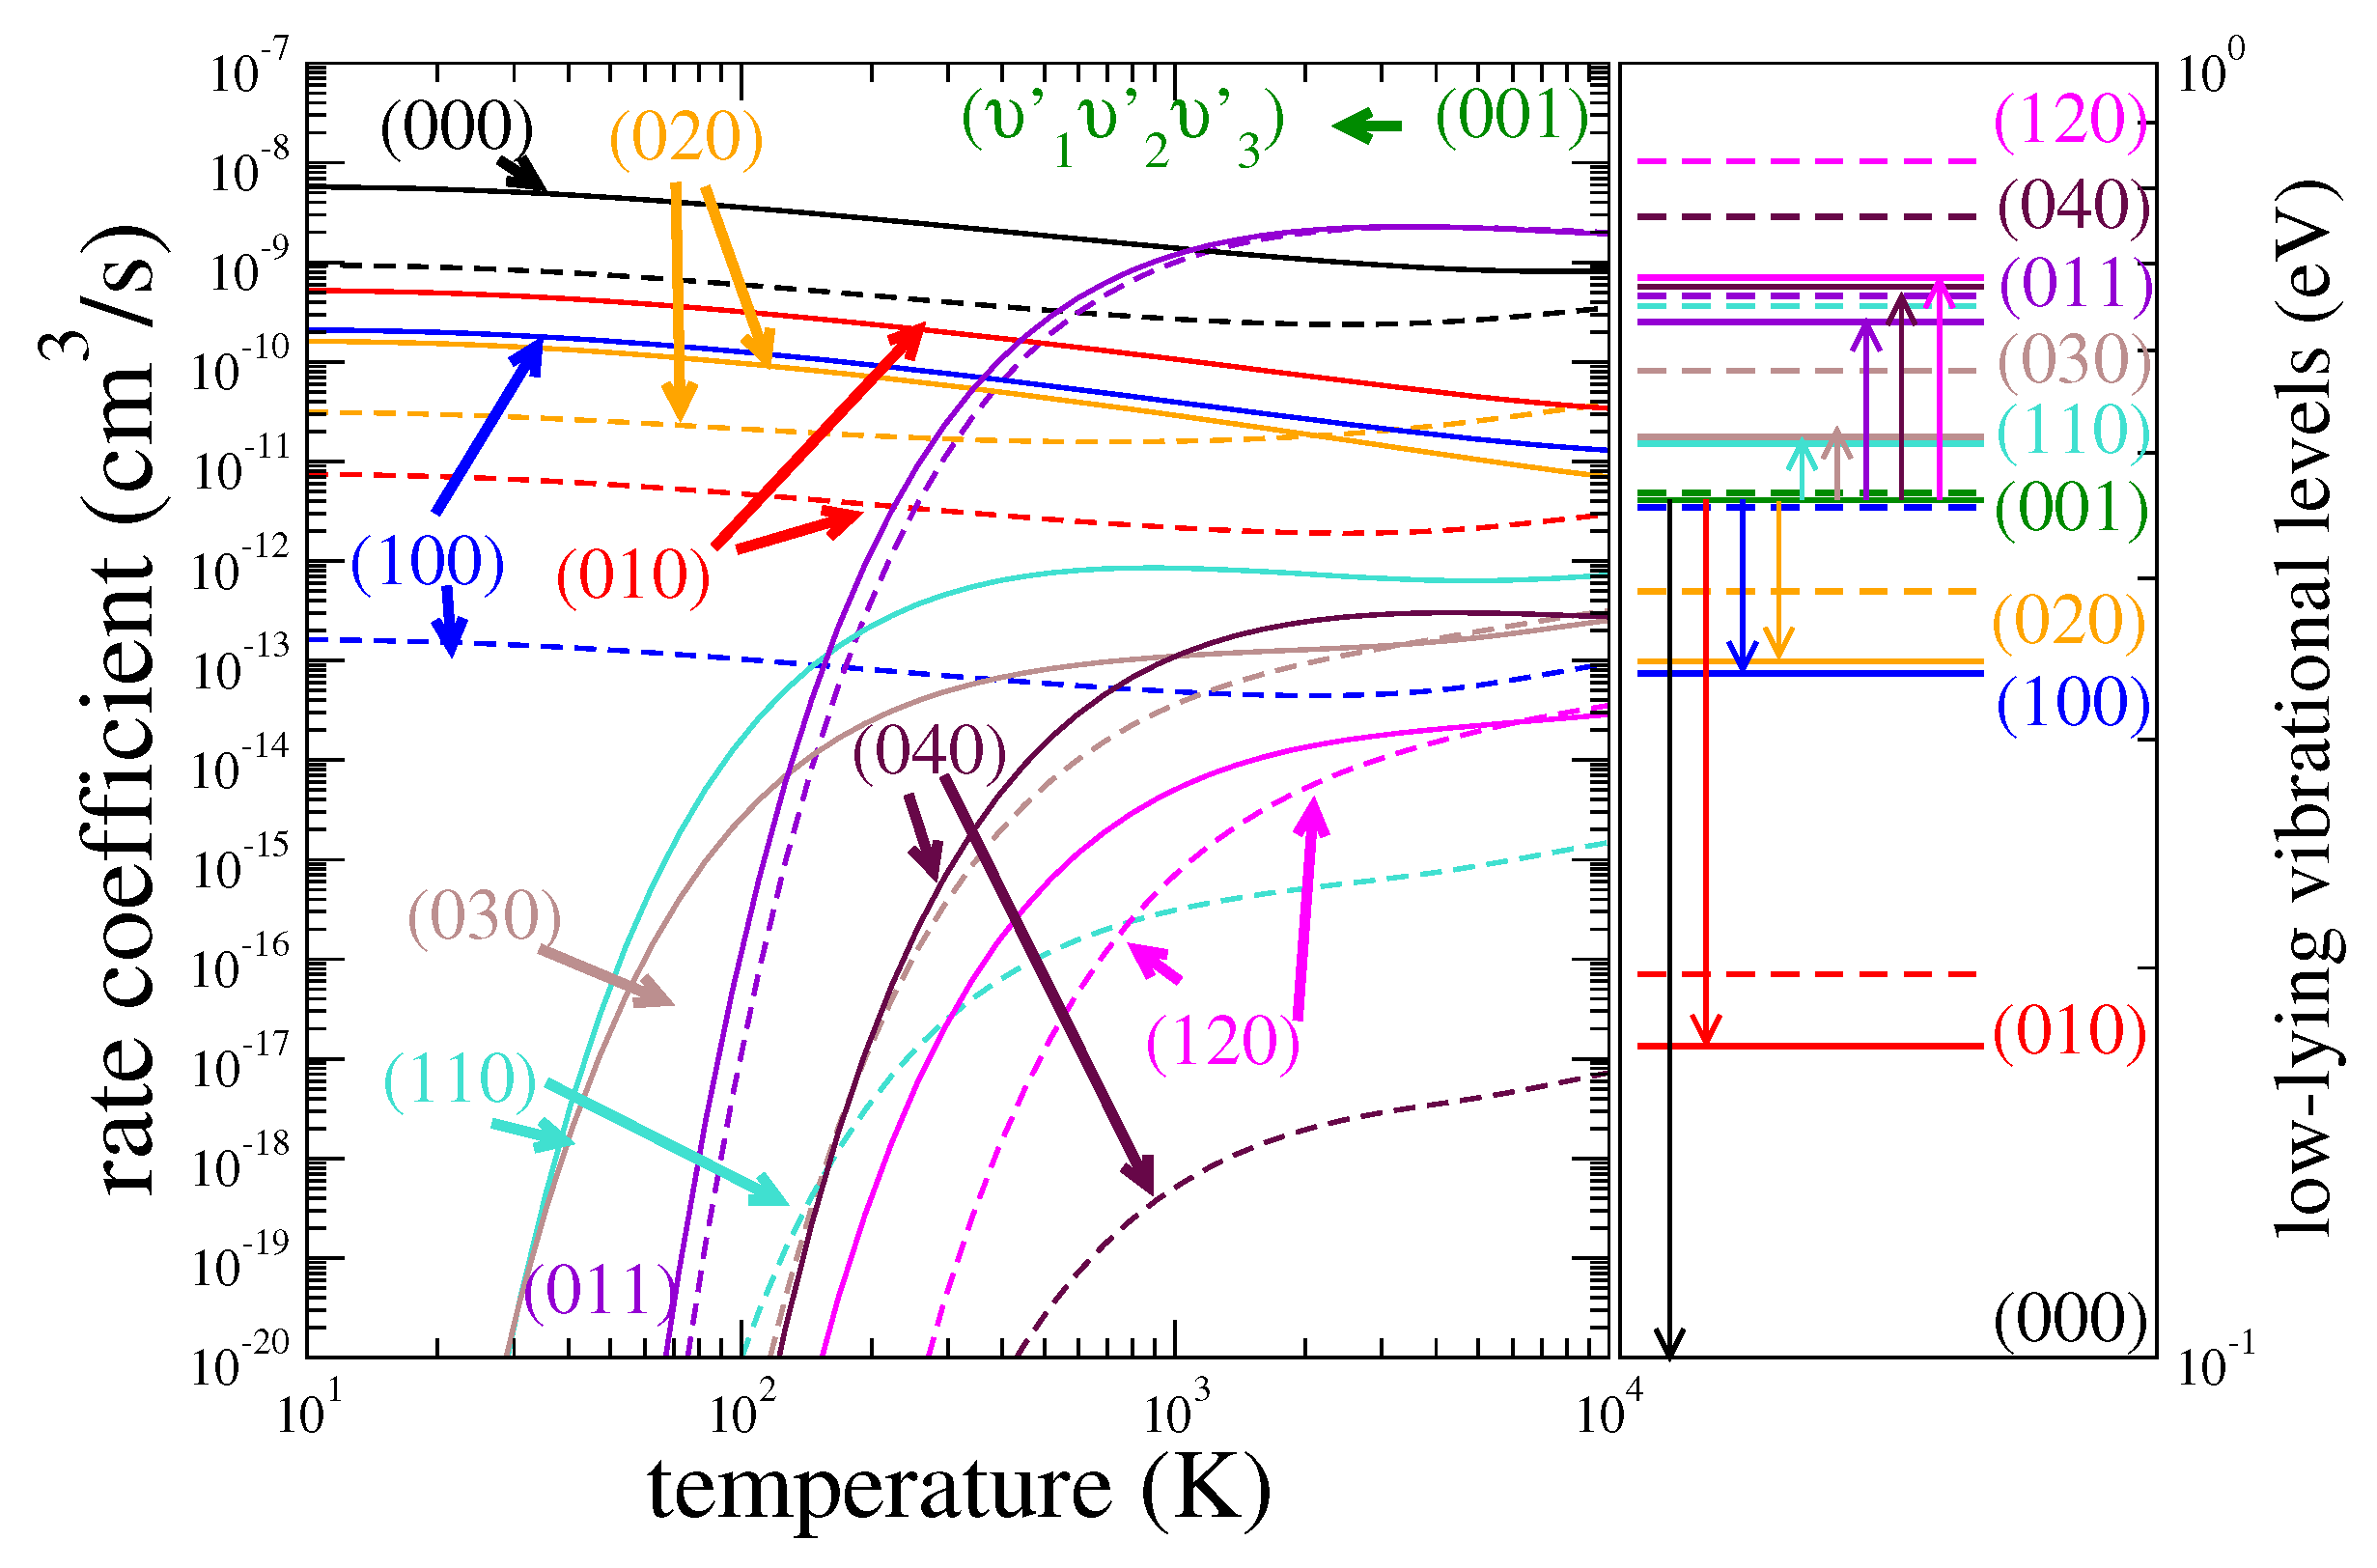
where k b and T are the Boltzmann coefficient and the temperature, respectively. Figure 8 and Figure 9 show examples of rate coefficients for initial levels (000), (010), (100), and (001). As for the cross sections, the largest rate coefficients are those for one-quantum (de-)excitations, and their differences with the H2O coefficients exceed a factor of 3 for some transitions.
Similar to previous studies [12,34] and for simplicity of use, we fitted the obtained rate coefficients to an analytical formula
α v v f i t T = 1 T exp Δ v , v T 10 P ( v v ) ,
where
P ( v v ) = a 0 + a 1 x + a 2 x 2 + a 3 x 3 ,
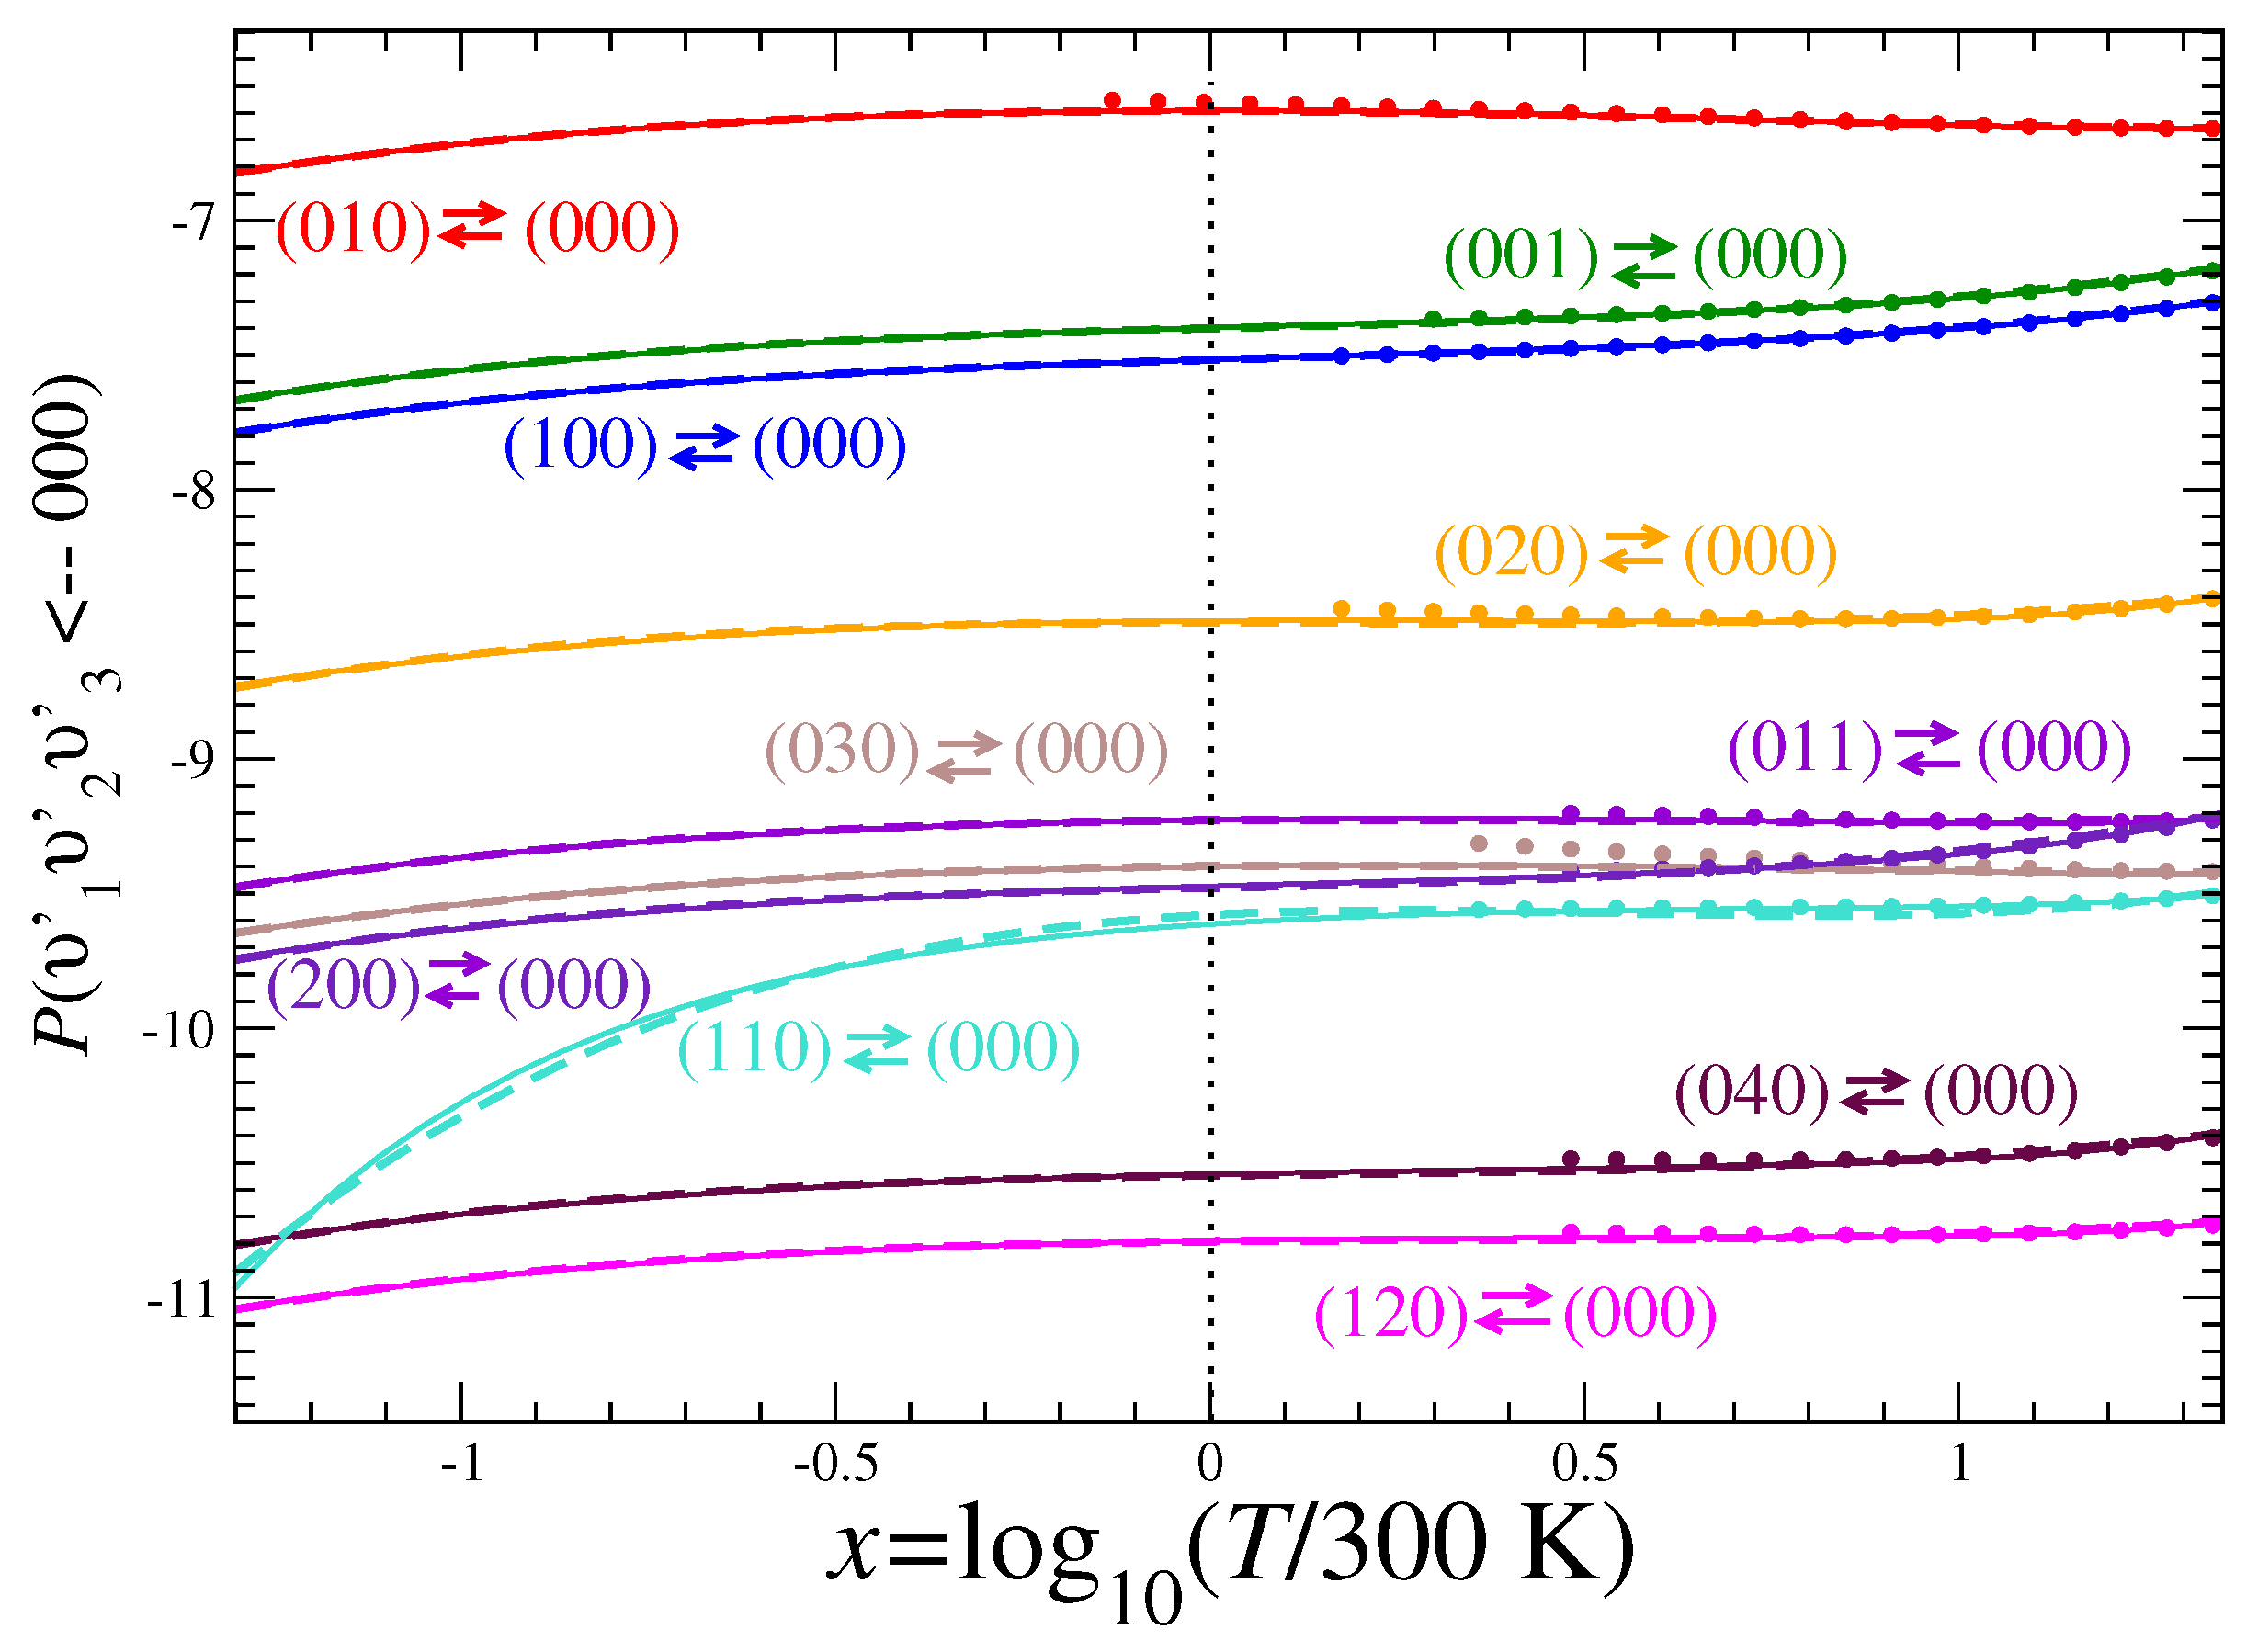
and the coefficients a i ( i = 0 , 1 , 2 , 3 ) are fitting parameters. The quantity 10 P ( v v ) is roughly the (de-)excitation probability for transition v v and P ( v v ) is a smooth function of temperature. Figure 10 shows P ( v v ) for a few transitions from the ground level v = ( 000 ) to several final v vibrational levels as a function of x = log 10 T / 300 K . In the above Equation (6), Δ v , v represents the threshold energy for the transition
Δ v , v = E v E v > 0 for excitation , 0 for de - excitation .
To employ Formula (6) with fitted parameters a i given in Appendix A Table A1, Table A2, Table A3, Table A4, Table A5, Table A6 for each pair of transitions v 1 v 2 v 3 v 1 v 2 v 3 , the temperature T should be in kelvins. For instance, at T = 300  K, the (de-)excitation probability reads as 10 a 0 , because x = 0 for T = 300 K (vertical dashed line in Figure 10).

3.3. Assessment of Uncertainties

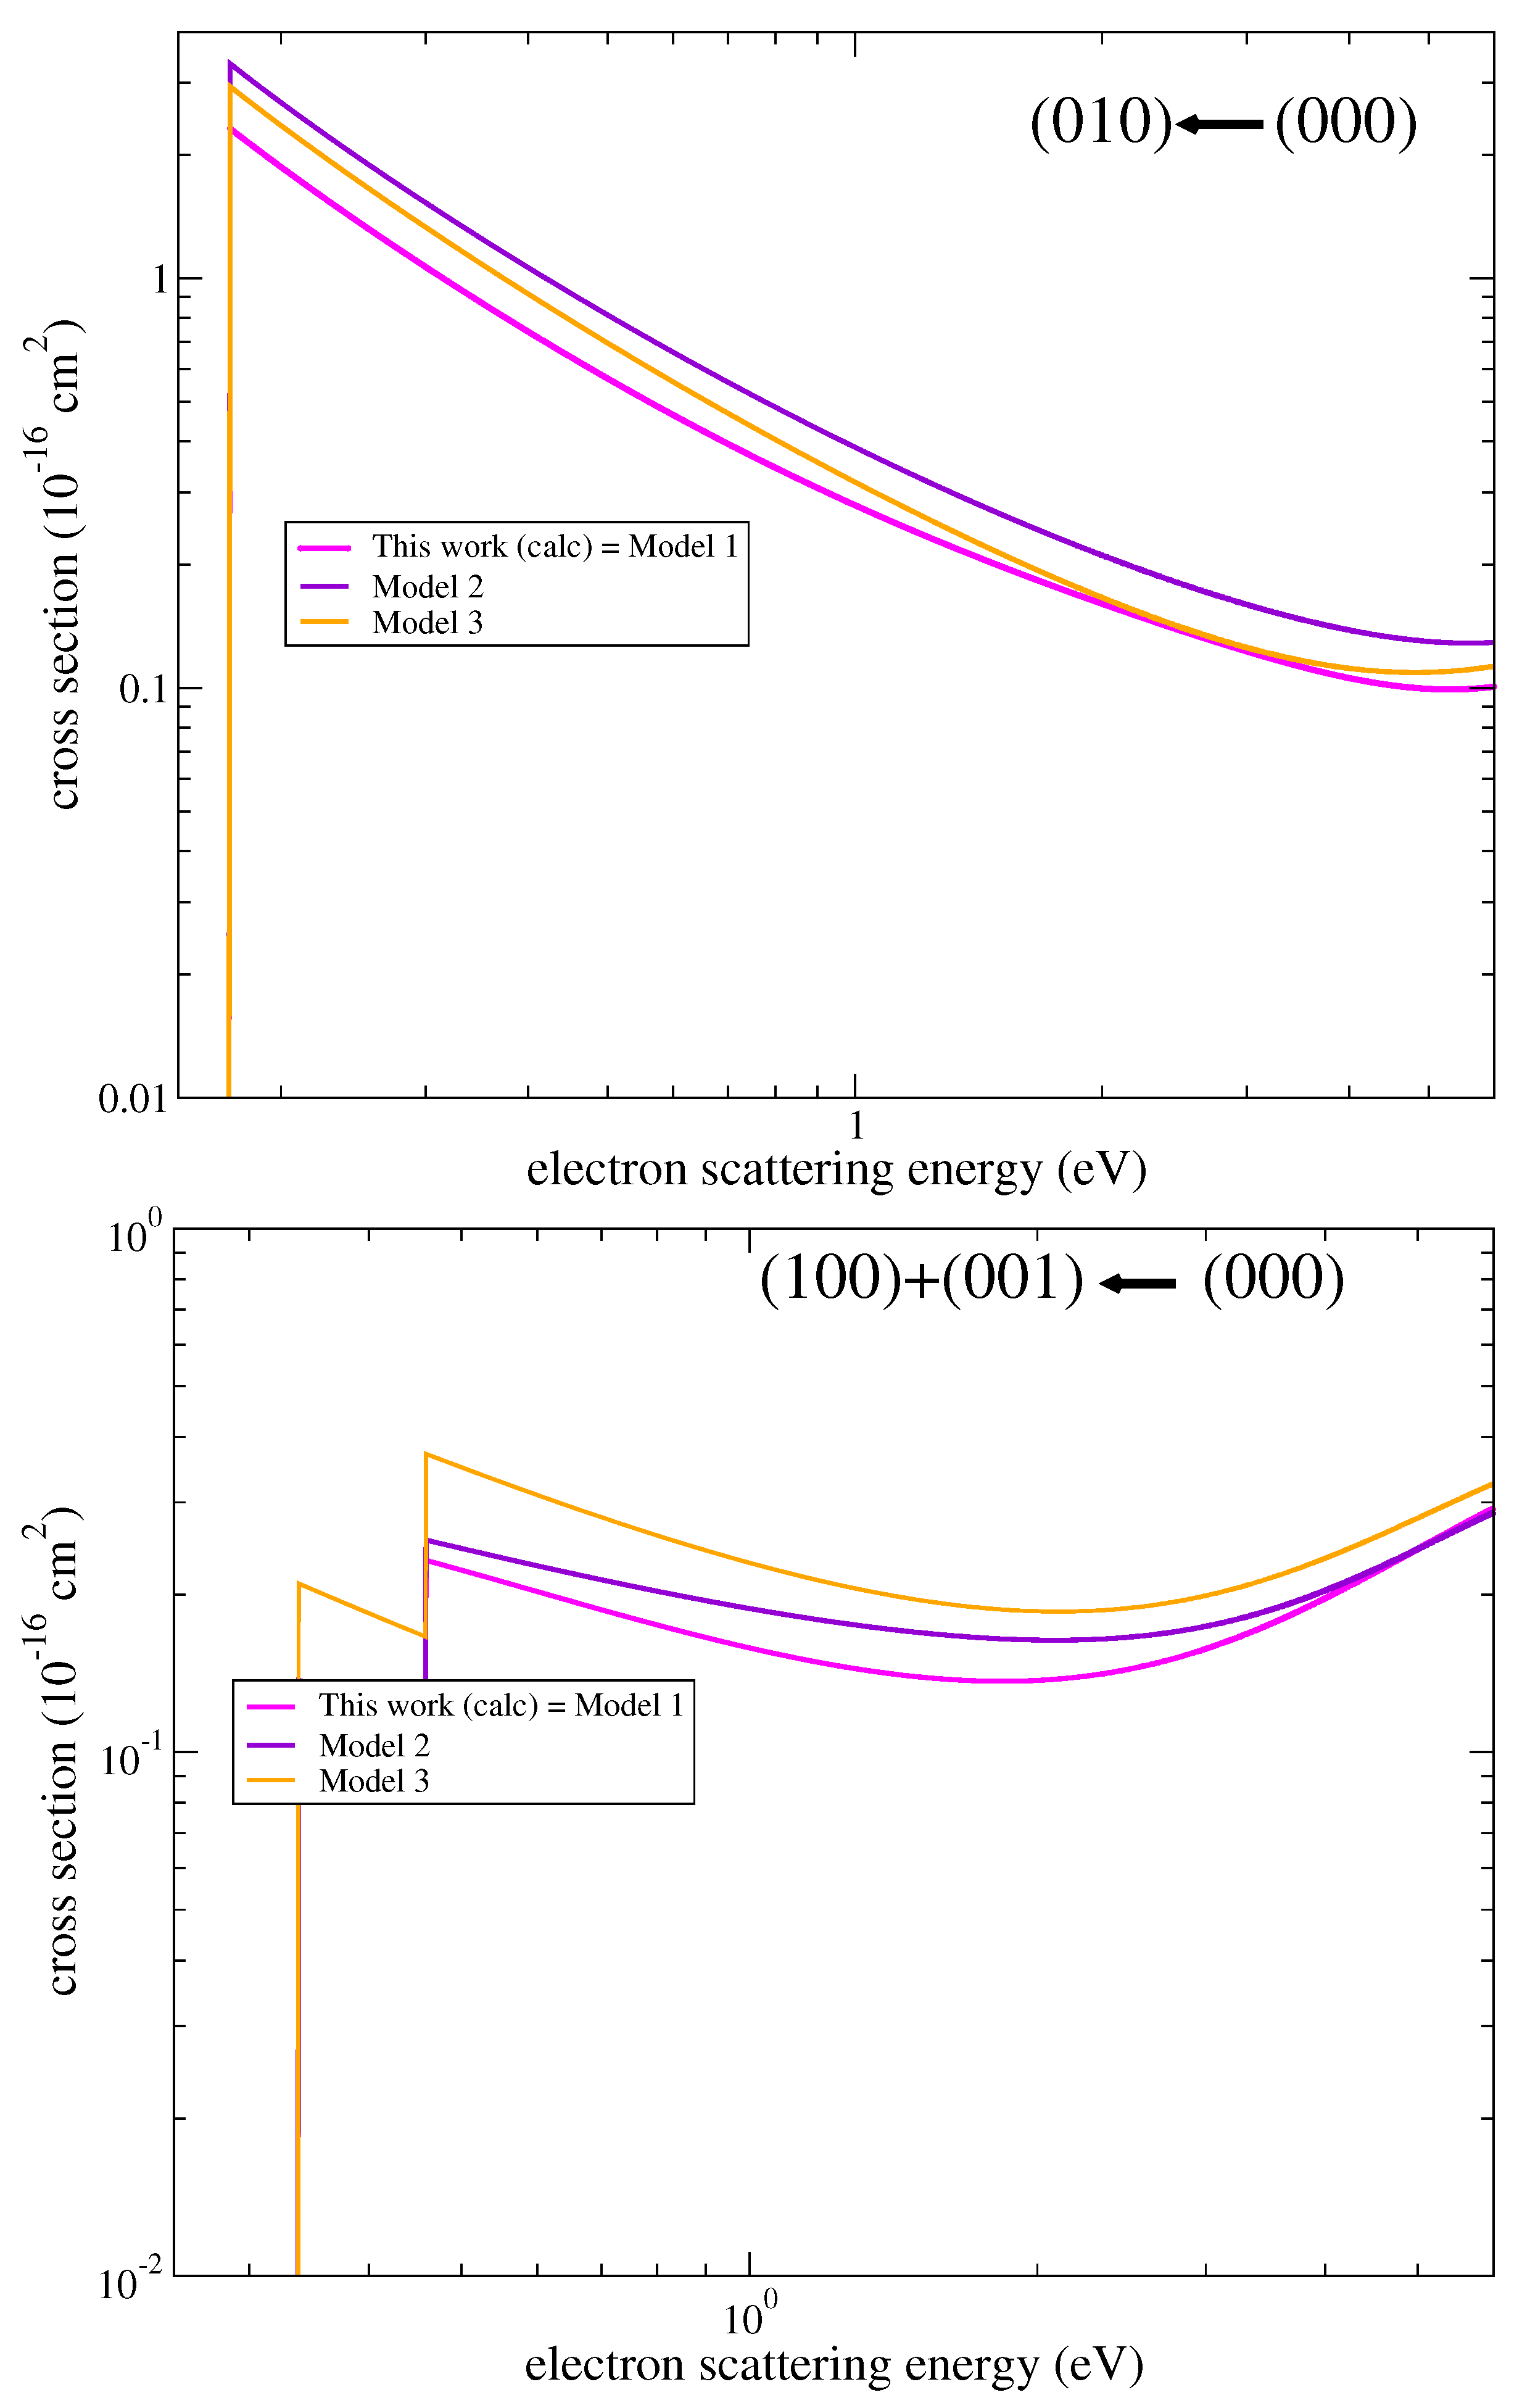
As in many similar theoretical studies, there are two types of uncertainties in the obtained results. One source is due to the approximations made in the theoretical approach, which employs the vibrational frame transformation and neglects the rotational structure and certain non-Born–Oppenheimer couplings in the electron-molecule interaction. The second source is due to the limitation of employed reduced basis sets in the representation of vibrational and electronic motion. We estimate that the major uncertainty of the present results is due to the limited accuracy of the e-HDO scattering calculations. To assess and demonstrate the uncertainty, vibrational excitation cross sections were computed using three different sets (Models 1–3) of electron-scattering parameters. Model 1 is the main set of parameters, discussed above. Model 2 uses a different basis set DZP, in Model 3 a smaller complete active space is employed, in which the 1 a , 2 a and 3 a orbitals were kept frozen. Figure 11 compares the cross sections obtained in Models 1–3. Comparing the results of Models 2 and 3 with Model 1, we note that the uncertainty of the bending-mode cross section is estimated to be about 30% at energies 0.2 eV and about 10% at and above 2 eV. Uncertainty of the cross sections for the stretching modes is larger, between 60% and 10% in the same energy interval.

4. Conclusions

Electron-impact excitation of the 16 low-lying vibrational levels of isotopologue HDO of the water molecule was modeled, and the corresponding cross sections were computed using a theoretical approach based on first principles only. The highest considered vibrational level is (130), situated at 6849 cm−1 above the ground level. Thermally averaged rate coefficients have been obtained for the 10–10,000 K interval of temperatures. Analytical fits for rate coefficients were provided for convenience of use. The H/D isotopic substitution was found to have a large impact in general, so the rate coefficients for H2O could not be used reliably for HDO. In order to employ these rate coefficients in modeling non-LTE spectra of HDO in various astrophysical environments, uncertainty estimations were performed. Having both studies on vibrational (de-)excitations of H2O and HDO, a model accounting for rotationally resolved vibrational rate coefficients is now being developed and data will be reported in future work. These findings could be incorporated into astrophysical models.

Author Contributions

Conceptualization, M.A.A., A.F. and V.K.; methodology, M.A.A. and V.K.; software, M.A.A.; validation, M.A.A., V.K., A.F., I.F.S. and J.Z.M.; formal analysis, M.A.A., A.F and V.K.; investigation, M.A.A.; resources, M.A.A.; data curation, M.A.A., A.F., I.F.S. and J.Z.M.; writing—original draft preparation, M.A.A.; writing—review and editing, M.A.A., V.K., A.F., I.F.S. and J.Z.M.; visualization, M.A.A.; supervision, M.A.A.; project administration, M.A.A.; funding acquisition, M.A.A., V.K., A.F., I.F.S. and J.Z.M. All authors have read and agreed to the published version of the manuscript.

Funding

This research was funded by the Transatlantic Mobility Program of the Office for Science and Technology of the Embassy of France in the United States, Programme National Physique et Chimie du Milieu Interstellaire (PCMI) of CNRS/INSU, the program “Accueil des chercheurs étranger” of CentraleSupélec and the National Science Foundation, Grant No. PHY-2409570. AF acknowledges support by the French Agence Nationale de la Recherche (ANR-Waterstars), grant number ANR-20-CE31-0011. IFS acknowledges support by the French ’Institut pour Energie, Propulsion et Environnement’ (IEPE). JZsM is grateful for financial support from the National Research, Development and Innovation Fund of Hungary, under the FK 19 funding schemes with Project Number FK 132989.

Data Availability Statement

Data are contained within the article.

Conflicts of Interest

The authors declare no conflicts of interest.

Appendix A. Fitting Parameters for the Calculated Rate Coefficients

We provide in the tables below the fitting parameters for the obtained rate coefficients.
Table A1. Parameters a 0 , a 1 , a 2 , and a 3 of the fitting polynomial P ( v v ) of Equations (6) and (7) for transitions to the ground vibrational level from the nine lowest vibrational levels of HDO. The second column gives energies Δ v , v (experimental energies) in Equation (8).
v 1 v 2 v 3 v 1 v 2 v 3 Δ v 1 v 2 v 3 , v 1 v 2 v 3 (K) a 0 a 1 a 2 a 3
000 010 0.0−6.59−4.74 × 10 3 −8.68 × 10 2 4.06 × 10 2
000 100 0.0−7.527.82 × 10 2 −1.95 × 10 2 6.13 × 10 2
000 020 0.0−8.491.52 × 10 3 −4.71 × 10 2 7.29 × 10 2
000 001 0.0−7.406.87 × 10 2 −1.79 × 10 2 6.69 × 10 2
000 030 0.0−9.402.68 × 10 2 −7.94 × 10 2 3.55 × 10 2
000 110 0.0−9.581.47 × 10 1 −3.72 × 10 1 2.30 × 10 1
000 011 0.0−9.232.28 × 10 2 −7.14 × 10 2 4.45 × 10 2
000 200 0.0−9.486.05 × 10 2 −5.46 × 10 3 8.16 × 10 2
000 040 0.0−10.503.78 × 10 2 −3.46 × 10 2 6.84 × 10 2
000 120 0.0−10.802.84 × 10 2 −5.52 × 10 2 5.54 × 10 2
000 021 0.0−10.107.55 × 10 2 −2.79 × 10 2 5.47 × 10 2
000 101 0.0−9.907.30 × 10 2 −4.94 × 10 2 3.72 × 10 2
000 050 0.0−13.706.45 × 10 2 −1.78 × 10 2 7.04 × 10 2
000 210 0.0−11.82.60 × 10 2 −1.37 × 10 2 9.12 × 10 2
000 130 0.0−12.401.09 × 10 2 −3.84 × 10 2 7.86 × 10 2
Table A2. Same as Table A1 for transitions to (010).
v 1 v 2 v 3 v 1 v 2 v 3 Δ v 1 v 2 v 3 , v 1 v 2 v 3 (K) a 0 a 1 a 2 a 3
010 000 2019.0−6.56−2.91 × 10 2 −1.10 × 10 1 5.97 × 10 2
010 100 0.0−7.40−5.67 × 10 3 −8.73 × 10 2 4.05 × 10 2
010 020 0.0−6.33−2.57 × 10 3 −8.64 × 10 2 4.01 × 10 2
010 001 0.0−8.479.79 × 10 3 −7.82 × 10 2 4.31 × 10 2
010 110 0.0−7.821.70 × 10 1 −3.38 × 10 1 2.46 × 10 1
010 030 0.0−7.687.07 × 10 2 −2.48 × 10 2 5.96 × 10 2
010 011 0.0−7.437.18 × 10 2 −1.52 × 10 2 6.76 × 10 2
010 200 0.0−9.753.28 × 10 2 −7.19 × 10 2 3.88 × 10 2
010 040 0.0−9.382.40 × 10 2 −8.60 × 10 2 3.10 × 10 2
010 120 0.0−9.082.86 × 10 2 −6.18 × 10 2 4.95 × 10 2
010 101 0.0−9.432.17 × 10 2 −7.89 × 10 2 3.87 × 10 2
010 021 0.0−9.112.60 × 10 2 −6.53 × 10 2 4.81 × 10 2
010 050 0.0−11.508.39 × 10 2 4.22 × 10 2 1.06 × 10 1
010 210 0.0−9.546.36 × 10 2 −1.14 × 10 3 8.38 × 10 2
010 130 0.0−10.103.34 × 10 2 −4.61 × 10 2 6.07 × 10 2
Table A3. Same as Table A1 for transitions to (100).
v 1 v 2 v 3 v 1 v 2 v 3 Δ v 1 v 2 v 3 , v 1 v 2 v 3 (K) a 0 a 1 a 2 a 3
100 000 3919.0−7.531.28 × 10 1 −9.39 × 10 2 9.00 × 10 2
100 010 1899.0−7.37−3.03 × 10 2 −1.11 × 10 1 6.00 × 10 2
100 020 0.0−7.97−1.50 × 10 1 −1.11 × 10 1 6.36 × 10 2
100 001 0.0−8.88−1.83 × 10 2 −7.66 × 10 2 5.29 × 10 2
100 110 0.0−7.411.10 × 10 1 −4.01 × 10 1 2.19 × 10 1
100 030 0.0−6.60−8.83 × 10 4 −8.57 × 10 2 4.01 × 10 2
100 011 0.0−9.343.48 × 10 3 −6.70 × 10 2 5.56 × 10 2
100 200 0.0−7.237.97 × 10 2 −1.82 × 10 2 6.16 × 10 2
100 040 0.0−8.52−1.68 × 10 2 −7.02 × 10 2 6.21 × 10 2
100 120 0.0−8.783.79 × 10 2 −4.66 × 10 2 5.58 × 10 2
100 101 0.0−7.726.64 × 10 2 −2.04 × 10 2 6.59 × 10 2
100 021 0.0−7.687.01 × 10 2 −1.68 × 10 2 6.71 × 10 2
100 050 0.0−9.732.40 × 10 2 −8.48 × 10 2 3.20 × 10 2
100 210 0.0−8.803.09 × 10 2 −6.23 × 10 2 4.80 × 10 2
100 130 0.0−10.903.15 × 10 2 −3.96 × 10 2 6.57 × 10 2
Table A4. Same as Table A1 for transitions to (020).
v 1 v 2 v 3 v 1 v 2 v 3 Δ v 1 v 2 v 3 , v 1 v 2 v 3 (K) a 0 a 1 a 2 a 3
020 000 4003.0−8.454.68 × 10 2 −2.45 × 10 1 1.75 × 10 1
020 010 1983.0−6.29−3.97 × 10 2 −9.80 × 10 2 5.55 × 10 2
020 100 84.0−7.93−2.87 × 10 1 2.26 × 10 1 −1.29 × 10 1
020 001 0.0−9.00−2.94 × 10 2 −1.04 × 10 1 3.46 × 10 2
020 110 0.0−6.381.17 × 10 1 −4.00 × 10 1 2.17 × 10 1
020 030 0.0−6.551.22 × 10 3 −8.55 × 10 2 3.94 × 10 2
020 011 0.0−8.231.51 × 10 2 −7.73 × 10 2 4.17 × 10 2
020 200 0.0−8.794.42 × 10 2 −3.51 × 10 2 6.36 × 10 2
020 040 0.0−7.724.65 × 10 2 −3.62 × 10 2 6.02 × 10 2
020 120 0.0−7.665.73 × 10 2 −2.10 × 10 2 6.92 × 10 2
020 101 0.0−7.707.25 × 10 2 −1.50 × 10 2 6.74 × 10 2
020 021 0.0−7.817.60 × 10 2 −1.13 × 10 2 6.88 × 10 2
020 050 0.0−9.212.12 × 10 2 −8.46 × 10 2 3.33 × 10 2
020 210 0.0−10.809.58 × 10 2 −1.28 × 10 2 5.91 × 10 2
020 130 0.0−8.912.92 × 10 2 −5.94 × 10 2 5.11 × 10 2
Table A5. Same as Table A1 for transitions to (001).
v 1 v 2 v 3 v 1 v 2 v 3 Δ v 1 v 2 v 3 , v 1 v 2 v 3 (K) a 0 a 1 a 2 a 3
001 000 5334.0−7.385.62 × 10 2 −4.76 × 10 2 8.40 × 10 2
001 010 3315.0−8.432.28 × 10 2 −1.76 × 10 1 9.42 × 10 2
001 100 1415.0−8.85−4.49 × 10 2 −1.04 × 10 1 7.68 × 10 2
001 020 1332.0−8.98−5.37 × 10 2 −1.06 × 10 1 4.13 × 10 2
001 110 0.0−10.30−5.07 × 10 2 −3.57 × 10 1 3.04 × 10 1
001 030 0.0−11.301.22 × 10 1 8.37 × 10 2 1.09 × 10 1
001 011 0.0−6.58−4.62 × 10 3 −8.67 × 10 2 4.07 × 10 2
001 200 0.0−9.981.89 × 10 2 −7.90 × 10 2 3.76 × 10 2
001 040 0.0−10.403.89 × 10 3 −8.60 × 10 2 3.83 × 10 2
001 120 0.0−11.705.61 × 10 2 −2.04 × 10 2 7.31 × 10 2
001 101 0.0−7.687.22 × 10 2 −1.80 × 10 2 6.52 × 10 2
001 021 0.0−7.876.83 × 10 2 −2.86 × 10 2 5.78 × 10 2
001 050 0.0−11.90−3.78 × 10 2 −5.58 × 10 2 8.42 × 10 2
001 210 0.0−10.406.45 × 10 2 −3.18 × 10 2 5.72 × 10 2
001 130 0.0−11.407.66 × 10 2 −2.23 × 10 2 5.96 × 10 2
Table A6. Same as Table A1 for transitions to (110).
v 1 v 2 v 3 v 1 v 2 v 3 Δ v 1 v 2 v 3 , v 1 v 2 v 3 (K) a 0 a 1 a 2 a 3
110 000 5899.0−9.622.54 × 10 1 −3.35 × 10 1 1.55 × 10 1
110 010 3880.0−7.811.31 × 10 1 −1.66 × 10 1 1.31 × 10 1
110 100 1980.0−7.428.23 × 10 2 −2.05 × 10 1 8.87 × 10 2
110 020 1896.0−6.399.84 × 10 2 −2.02 × 10 1 8.34 × 10 2
110 001 565.0−10.30−4.01 × 10 2 −2.91 × 10 1 2.50 × 10 1
110 030 0.0−7.46−1.49 × 10 1 −1.12 × 10 1 6.22 × 10 2
110 011 0.0−8.51−1.57 × 10 2 −9.79 × 10 2 3.51 × 10 2
110 200 0.0−9.684.65 × 10 2 −7.19 × 10 2 3.38 × 10 2
110 040 0.0−6.822.31 × 10 3 −8.55 × 10 2 3.88 × 10 2
110 120 0.0−6.23−3.01 × 10 4 −8.57 × 10 2 3.97 × 10 2
110 101 0.0−8.341.34 × 10 2 −7.43 × 10 2 4.50 × 10 2
110 021 0.0−8.943.21 × 10 2 −7.44 × 10 2 3.65 × 10 2
110 050 0.0−8.175.33 × 10 3 −6.08 × 10 2 5.84 × 10 2
110 210 0.0−7.608.32 × 10 2 −1.69 × 10 2 6.10 × 10 2
110 130 0.0−7.633.81 × 10 2 −2.79 × 10 2 7.21 × 10 2
Table A7. Same as Table A1 for transitions to (030).
v 1 v 2 v 3 v 1 v 2 v 3 Δ v 1 v 2 v 3 , v 1 v 2 v 3 (K) a 0 a 1 a 2 a 3
030 000 5964.0−9.29−4.45 × 10 2 −1.42 × 10 1 7.79 × 10 2
030 010 3945.0−7.55−1.49 × 10 1 9.67 × 10 2 3.73 × 10 2
030 100 2046.0−6.41−3.39 × 10 1 1.30 × 10 1 −6.23 × 10 3
030 020 1962.0−6.36−3.27 × 10 1 1.24 × 10 1 −6.26 × 10 3
030 001 630.0−11.10−3.49 × 10 1 4.98 × 10 1 −1.59 × 10 2
030 110 65.0−7.43−2.30 × 10 1 8.37 × 10 2 −4.92 × 10 2
030 011 0.0−9.71−1.19 × 10 1 −3.22 × 10 2 1.24 × 10 1
030 200 0.0−7.38−4.28 × 10 3 −8.74 × 10 2 4.00 × 10 2
030 040 0.0−6.133.15 × 10 4 −8.58 × 10 2 3.94 × 10 2
030 120 0.0−7.96−1.80 × 10 2 −8.68 × 10 2 4.60 × 10 2
030 101 0.0−10.207.22 × 10 2 −5.19 × 10 2 3.76 × 10 2
030 021 0.0−8.231.48 × 10 2 −7.25 × 10 2 4.60 × 10 2
030 050 0.0−7.612.58 × 10 2 −4.73 × 10 2 6.02 × 10 2
030 210 0.0−7.487.71 × 10 2 −1.82 × 10 2 6.29 × 10 2
030 130 0.0−8.248.01 × 10 2 −1.81 × 10 2 6.14 × 10 2
Table A8. Same as Table A1 for transitions to (011).
v 1 v 2 v 3 v 1 v 2 v 3 Δ v 1 v 2 v 3 , v 1 v 2 v 3 (K) a 0 a 1 a 2 a 3
011 000 7323.0−9.231.63 × 10 1 −2.99 × 10 1 1.33 × 10 1
011 010 5303.0−7.35−6.01 × 10 2 4.11 × 10 2 6.25 × 10 2
011 100 3404.0−9.291.76 × 10 2 −2.05 × 10 1 1.30 × 10 1
011 020 3320.0−8.181.14 × 10 2 −1.56 × 10 1 8.56 × 10 2
011 001 1988.0−6.47−1.74 × 10 1 −9.82 × 10 4 3.04 × 10 2
011 110 1424.0−8.41−2.02 × 10 1 2.70 × 10 2 5.97 × 10 3
011 030 1358.0−9.54−3.62 × 10 1 1.67 × 10 2 1.58 × 10 1
011 200 0.0−10.70−2.80 × 10 2 −4.06 × 10 2 8.75 × 10 2
011 040 0.0−10.101.32 × 10 2 −7.85 × 10 2 3.39 × 10 2
011 120 0.0−9.84−1.43 × 10 1 −4.28 × 10 2 1.20 × 10 1
011 101 0.0−6.84−3.66 × 10 3 -8.68 × 10 2 4.02 × 10 2
011 021 0.0−6.42−1.55 × 10 3 −8.57 × 10 2 4.02 × 10 2
011 050 0.0−9.77−8.72 × 10 3 −8.83 × 10 2 4.18 × 10 2
011 210 0.0−10.202.07 × 10 2 −7.99 × 10 2 3.60 × 10 2
011 130 0.0−11.307.89 × 10 2 −9.20 × 10 3 7.24 × 10 2
Table A9. Same as Table A1 for transitions to (200).
v 1 v 2 v 3 v 1 v 2 v 3 Δ v 1 v 2 v 3 , v 1 v 2 v 3 (K) a 0 a 1 a 2 a 3
200 000 7717.0−9.35-2.31 × 10 1 2.05 × 10 1 2.61 × 10 2
200 010 5698.0−9.771.65 × 10 1 −2.53 × 10 1 1.05 × 10 1
200 100 3799.0−7.183.36 × 10 2 −2.62 × 10 2 7.41 × 10 2
200 020 3715.0−8.765.81 × 10 2 −1.40 × 10 1 1.19 × 10 1
200 001 2383.0−9.95−1.88 × 10 3 −9.87 × 10 2 5.24 × 10 2
200 110 1818.0−9.663.91 × 10 2 −1.05 × 10 1 5.33 × 10 2
200 030 1753.0−7.33−7.90 × 10 2 −6.55 × 10 2 4.50 × 10 2
200 011 395.0−10.70−1.74 × 10 1 5.08 × 10 2 7.44 × 10 2
200 040 0.0−7.73−1.34 × 10 1 −1.07 × 10 1 6.04 × 10 2
200 120 0.0−9.39−7.53 × 10 2 −8.64 × 10 2 5.50 × 10 2
200 101 0.0−8.41−1.47 × 10 2 −8.63 × 10 2 4.43 × 10 2
200 021 0.0−9.04−2.09 × 10 2 −7.34 × 10 2 5.69 × 10 2
200 050 0.0−7.121.08 × 10 3 −8.57 × 10 2 3.93 × 10 2
200 210 0.0−6.67−5.60 × 10 3 −8.65 × 10 2 4.11 × 10 2
200 130 0.0−8.58−4.43 × 10 3 −8.58 × 10 2 4.14 × 10 2
Table A10. Same as Table A1 for transitions to (040).
v 1 v 2 v 3 v 1 v 2 v 3 Δ v 1 v 2 v 3 , v 1 v 2 v 3 (K) a 0 a 1 a 2 a 3
040 000 7798.0−10.40−9.53 × 10 2 −3.15 × 10 2 8.97 × 10 2
040 010 5779.0−9.358.33 × 10 2 −2.20 × 10 1 8.62 × 10 2
040 100 3879.0−8.44−2.06 × 10 2 −2.58 × 10 1 1.68 × 10 1
040 020 3796.0−7.62−9.95 × 10 2 2.05 × 10 2 5.92 × 10 2
040 001 2464.0−10.30−1.21 × 10 1 −4.51 × 10 2 4.22 × 10 2
040 110 1899.0−6.73−1.42 × 10 1 −1.12 × 10 2 2.91 × 10 2
040 030 1834.0−6.02−1.86 × 10 1 1.79 × 10 2 2.26 × 10 2
040 011 476.0−9.97−2.93 × 10 1 2.44 × 10 1 −8.37 × 10 2
040 200 81.0−7.65−3.84 × 10 1 5.15 × 10 1 −2.94 × 10 1
040 120 0.0−7.67−1.33 × 10 1 −1.08 × 10 1 5.73 × 10 2
040 101 0.0−9.82−1.20 × 10 1 −7.77 × 10 2 9.36 × 10 2
040 021 0.0−8.55−2.07 × 10 2 −9.83 × 10 2 3.68 × 10 2
040 050 0.0−5.962.88 × 10 3 −8.54 × 10 2 3.89 × 10 2
040 210 0.0−7.253.37 × 10 3 −8.49 × 10 2 3.89 × 10 2
040 130 0.0−9.24−4.27 × 10 2 −5.06 × 10 2 8.34 × 10 2
Table A11. Same as Table A1 for transitions to (120).
v 1 v 2 v 3 v 1 v 2 v 3 Δ v 1 v 2 v 3 , v 1 v 2 v 3 (K) a 0 a 1 a 2 a 3
120 000 7922.0−10.806.96 × 10 2 −1.87 × 10 1 1.13 × 10 1
120 010 5903.0−9.048.26 × 10 2 −2.27 × 10 1 1.24 × 10 1
120 100 4003.0-8.73−9.34 × 10 3 −7.01 × 10 2 7.80 × 10 2
120 020 3919.0−7.56−6.47 × 10 2 −1.50 × 10 2 9.16 × 10 2
120 001 2588.0−11.70−8.99 × 10 3 −1.11 × 10 1 1.41 × 10 1
120 110 2023.0−6.14−1.56 × 10 1 −6.57 × 10 3 2.98 × 10 2
120 030 1958.0−7.84−2.08 × 10 1 −3.95 × 10 3 4.28 × 10 2
120 011 599.0−9.66-4.69 × 10 1 1.24 × 10 1 1.05 × 10 1
120 200 205.0−9.32−2.67 × 10 1 1.66 × 10 1 −5.33 × 10 2
120 040 124.0−7.61−3.09 × 10 1 1.81 × 10 1 −8.37 × 10 2
120 101 0.0−8.53−2.02 × 10 2 −1.00 × 10 1 3.46 × 10 2
120 021 0.0−8.841.20 × 10 3 −8.83 × 10 2 3.64 × 10 2
120 050 0.0−7.579.46 × 10 3 −8.38 × 10 2 3.75 × 10 2
120 210 0.0−7.26−1.94 × 10 3 −8.69 × 10 2 3.94 × 10 2
120 130 0.0−6.128.98 × 10 4 −8.53 × 10 2 3.95 × 10 2
Table A12. Same as Table A1 for transitions to (101).
v 1 v 2 v 3 v 1 v 2 v 3 Δ v 1 v 2 v 3 , v 1 v 2 v 3 (K) a 0 a 1 a 2 a 3
101 000 9230.0−9.84−1.01 × 10 1 1.61 × 10 1 −4.73 × 10 2
101 010 7211.0−9.472.39 × 10 1 −3.53 × 10 1 1.37 × 10 1
101 100 5312.0−7.731.14 × 10 1 −9.55 × 10 2 9.54 × 10 2
101 020 5228.0−7.662.04 × 10 2 −1.11 × 10 2 7.45 × 10 2
101 001 3896.0−7.679.01 × 10 2 −8.64 × 10 2 9.79 × 10 2
101 110 3331.0−8.348.75 × 10 2 −2.17 × 10 1 1.08 × 10 1
101 030 3266.0−10.205.44 × 10 2 −5.29 × 10 2 3.84 × 10 2
101 011 1908.0−6.80−5.36 × 10 2 −8.89 × 10 2 5.31 × 10 2
101 200 1513.0−8.422.85 × 10 2 −1.58 × 10 1 7.71 × 10 2
101 040 1432.0−9.82−3.42 × 10 2 −3.10 × 10 1 2.17 × 10 1
101 120 1308.0−8.48−1.00 × 10 1 −5.44 × 10 2 2.67 × 10 2
101 021 0.0−7.58−1.76 × 10 1 −1.18 × 10 1 6.57 × 10 2
101 050 0.0−9.72−9.64 × 10 3 −8.63 × 10 2 3.76 × 10 2
101 210 0.0−10.30−2.39 × 10 1 −9.16 × 10 3 1.70 × 10 1
101 130 0.0−9.61−1.31 × 10 1 −6.50 × 10 2 9.83 × 10 2
Table A13. Same as Table A1 for transitions to (021).
v 1 v 2 v 3 v 1 v 2 v 3 Δ v 1 v 2 v 3 , v 1 v 2 v 3 (K) a 0 a 1 a 2 a 3
021 000 9283.0−9.88−3.79 × 10 1 3.64 × 10 1 −7.03 × 10 2
021 010 7264.0−9.02−2.36 × 10 3 −1.73 × 10 1 1.07 × 10 1
021 100 5364.0−7.53−1.91 × 10 1 1.22 × 10 1 4.36 × 10 2
021 020 5280.0−7.66−1.98 × 10 1 1.50 × 10 1 3.59 × 10 2
021 001 3949.0−7.74−1.49 × 10 1 8.54 × 10 2 3.92 × 10 2
021 110 3384.0−8.81−1.54 × 10 1 5.43 × 10 3 2.97 × 10 2
021 030 3318.0−8.08−1.74 × 10 1 −4.00 × 10 2 6.75 × 10 2
021 011 1960.0−6.24−3.24 × 10 1 1.17 × 10 1 −2.69 × 10 3
021 200 1565.0−8.84−3.78 × 10 1 1.36 × 10 1 1.98 × 10 2
021 040 1485.0−8.35−3.96 × 10 1 1.66 × 10 1 −2.91 × 10 2
021 120 1361.0−8.66−3.65 × 10 1 1.84 × 10 1 −3.57 × 10 2
021 101 52.0−7.52−3.40 × 10 1 2.83 × 10 1 −1.63 × 10 1
021 050 0.0−9.327.34 × 10 3 −8.42 × 10 2 3.38 × 10 2
021 210 0.0−10.10−1.62 × 10 1 2.11 × 10 2 1.68 × 10 1
021 130 0.0−9.99−1.10 × 10 1 −5.21 × 10 2 1.01 × 10 1
Table A14. Same as Table A1 for transitions to (021).
v 1 v 2 v 3 v 1 v 2 v 3 Δ v 1 v 2 v 3 , v 1 v 2 v 3 (K) a 0 a 1 a 2 a 3
050 000 9626.0−13.50−2.82 × 10 1 2.45 × 10 1 −8.39 × 10 3
050 010 7607.0−11.10−8.69 × 10 1 9.51 × 10 1 −1.87 × 10 1
050 100 5707.0−9.696.52 × 10 2 −2.09 × 10 1 8.55 × 10 2
050 020 5623.0−9.176.66 × 10 2 −2.13 × 10 1 8.89 × 10 2
050 001 4292.0−11.80−2.64 × 10 2 −3.28 × 10 1 2.36 × 10 1
050 110 3727.0−8.06−1.25 × 10 1 −6.63 × 10 2 8.97 × 10 2
050 030 3662.0−7.54−6.98 × 10 2 −4.73 × 10 2 8.08 × 10 2
050 011 2303.0−9.68−1.41 × 10 1 −4.94 × 10 2 4.96 × 10 2
050 200 1909.0−7.02−1.71 × 10 1 7.77 × 10 3 2.49 × 10 2
050 040 1828.0−5.86−1.67 × 10 1 8.27 × 10 3 2.38 × 10 2
050 120 1704.0−7.47−1.63 × 10 1 2.50 × 10 2 1.45 × 10 2
050 101 396.0−9.59−3.17 × 10 1 2.46 × 10 1 −8.56 × 10 2
050 021 343.0−9.23−2.50 × 10 1 2.13 × 10 1 −8.14 × 10 2
050 210 0.0−7.88−1.37 × 10 1 −1.10 × 10 1 5.80 × 10 2
050 130 0.0−8.09−1.13 × 10 1 −1.08 × 10 1 5.11 × 10 2
Table A15. Same as Table A1 for transitions to (210).
v 1 v 2 v 3 v 1 v 2 v 3 Δ v 1 v 2 v 3 , v 1 v 2 v 3 (K) a 0 a 1 a 2 a 3
210 000 9707.0−11.40−8.75 × 10 1 7.08 × 10 1 −1.09 × 10 1
210 010 7688.0−9.39−2.84 × 10 1 2.59 × 10 1 1.31 × 10 2
210 100 5789.0−8.766.86 × 10 2 −2.11 × 10 1 1.17 × 10 1
210 020 5705.0−10.70−2.56 × 10 2 6.10 × 10 2 3.88 × 10 2
210 001 4373.0−10.406.02 × 10 3 −4.26 × 10 2 7.32 × 10 2
210 110 3808.0−7.551.50 × 10 3 1.15 × 10 2 6.08 × 10 2
210 030 3743.0−7.41−2.19 × 10 2 3.35 × 10 3 7.07 × 10 2
210 011 2385.0−10.10−1.17 × 10 1 −9.40 × 10 3 2.53 × 10 2
210 200 1990.0−6.56−1.79 × 10 1 1.02 × 10 3 3.07 × 10 2
210 040 1909.0−7.15−1.70 × 10 1 1.17 × 10 2 2.29 × 10 2
210 120 1785.0−7.16−1.62 × 10 1 −5.08 × 10 3 2.90 × 10 2
210 101 477.0−10.20−4.19 × 10 1 1.95 × 10 2 2.04 × 10 1
210 021 424.0−9.97−4.69 × 10 1 2.04 × 10 1 1.40 × 10 1
210 050 81.0−7.84−2.68 × 10 1 2.08 × 10 1 −1.22 × 10 1
210 130 0.0−7.76−1.10 × 10 1 −9.94 × 10 2 5.51 × 10 2
Table A16. Same as Table A1 for transitions to (130).
v 1 v 2 v 3 v 1 v 2 v 3 Δ v 1 v 2 v 3 , v 1 v 2 v 3 (K) a 0 a 1 a 2 a 3
130 000 9854.0−12.20−4.74 × 10 1 2.44 × 10 1 2.25 × 10 2
130 010 7835.0−10.00−2.75 × 10 2 −1.05 × 10 1 9.97 × 10 2
130 100 5935.0−10.80−1.08 × 10 1 −3.92 × 10 2 9.31 × 10 2
130 020 5851.0−8.831.80 × 10 2 −1.83 × 10 1 1.17 × 10 1
130 001 4520.0−11.30−6.57 × 10 2 4.13 × 10 2 5.19 × 10 2
130 110 3955.0−7.54−5.39 × 10 2 −7.11 × 10 2 1.16 × 10 1
130 030 3890.0−8.13−9.82 × 10 2 7.36 × 10 2 4.69 × 10 2
130 011 2531.0−11.20−6.30 × 10 2 −1.97 × 10 2 1.12 × 10 1
130 200 2137.0−8.44−2.38 × 10 1 3.64 × 10 2 2.42 × 10 2
130 040 2056.0−9.08−2.68 × 10 1 −6.19 × 10 3 1.12 × 10 1
130 120 1932.0−5.98−2.39 × 10 1 5.88 × 10 2 1.16 × 10 2
130 101 624.0−9.47−3.87 × 10 1 6.80 × 10 2 8.65 × 10 2
130 021 571.0−9.80−4.89 × 10 1 2.15 × 10 1 3.94 × 10 2
130 050 228.0−7.97−4.10 × 10 1 2.55 × 10 1 −9.86 × 10 2
130 210 147.0−7.66−3.84 × 10 1 3.20 × 10 1 −1.42 × 10 1

References

  1. van Dishoeck, E.F.; Kristensen, L.E.; Mottram, J.C.; Benz, A.O.; Bergin, E.A.; Caselli, P.; Herpin, F.; Hogerheijde, M.R.; Johnstone, D.; Liseau, R.; et al. Water in star-forming regions: Physics and chemistry from clouds to disks as probed by Herschel spectroscopy. Astron. Astrophys. 2021, 648, A24. [Google Scholar] [CrossRef]
  2. Tobin, J.J.; van’t Hoff, M.L.R.; Leemker, M.; van Dishoeck, E.F.; Paneque-Carreño, T.; Furuya, K.; Harsono, D.; Persson, M.V.; Cleeves, L.I.; Sheehan, P.D.; et al. Deuterium-enriched water ties planet-forming disks to comets and protostars. Nature 2023, 615, 227–230. [Google Scholar] [CrossRef]
  3. Mahieux, A.; Viscardy, S.; Yelle, R.V.; Karyu, H.; Chamberlain, S.; Robert, S.; Piccialli, A.; Trompet, L.; Erwin, J.T.; Ubukata, S.; et al. Unexpected increase of the deuterium to hydrogen ratio in the Venus mesosphere. Proc. Natl. Acad. Sci. USA 2024, 121, e2401638121. [Google Scholar] [CrossRef] [PubMed]
  4. Tennyson, J.; Yurchenko, S.N.; Zhang, J.; Bowesman, C.A.; Brady, R.P.; Buldyreva, J.; Chubb, K.L.; Gamache, R.R.; Gorman, M.N.; Guest, E.R.; et al. The 2024 release of the ExoMol database: Molecular line lists for exoplanet and other hot atmospheres. J. Quant. Spectrosc. Radiat. Transfer 2024, 326, 109083. [Google Scholar] [CrossRef]
  5. Voronin, B.A.; Tennyson, J.; Tolchenov, R.N.; Lugovskoy, A.A.; Yurchenko, S.N. A high accuracy computed line list for the HDO molecule. Mon. Not. R. Astron. Soc. 2010, 402, 492–496. [Google Scholar] [CrossRef]
  6. Villanueva, G.L.; Mumma, M.J.; Bonev, B.P.; Novak, R.E.; Barber, R.J.; Disanti, M.A. Water in planetary and cometary atmospheres: H2O/HDO transmittance and fluorescence models. J. Quant. Spectrosc. Radiat. Transfer 2012, 113, 202–220. [Google Scholar] [CrossRef]
  7. García Muñoz, A.; Asensio Ramos, A.; Faure, A. NLTE modelling of water-rich exoplanet atmospheres. Cooling and heating rates. Icarus 2024, 415, 116080. [Google Scholar] [CrossRef]
  8. Faure, A.; Lique, F.; Loreau, J. The Effect of H2O and Electron Collisions on Rotational Populations of Cometary CO. In European Conference on Laboratory Astrophysics ECLA2020; The Interplay of Dust; Springer: Cham, Switzerland, 2023; pp. 281–286. [Google Scholar] [CrossRef]
  9. Faure, A.; Żółtowski, M.; Wiesenfeld, L.; Lique, F.; Bergeat, A. The rotational excitation of the water isotopologues by molecular hydrogen. Mon. Not. R. Astron. Soc. 2024, 527, 3087–3093. [Google Scholar] [CrossRef]
  10. Faure, A.; Gorfinkiel, J.D.; Tennyson, J. Electron-impact rotational excitation of water. Mon. Not. R. Astron. Soc. 2004, 347, 323–333. [Google Scholar] [CrossRef]
  11. García-Vázquez, R.M.; Bergeat, A.; Denis-Alpizar, O.; Faure, A.; Stoecklin, T.; Morales, S.B. Scattering resonances in the rotational excitation of HDO by Ne and normal-H2: Theory and experiment. Faraday Discuss. 2024, 251, 205–224. [Google Scholar] [CrossRef]
  12. Ayouz, M.; Faure, A.; Kokoouline, V. Theoretical study of the electron-induced vibrational excitation of H2O. Astron. Astrophys. 2024, 687, A3. [Google Scholar] [CrossRef]
  13. Song, M.Y.; Cho, H.; Karwasz, G.P.; Kokoouline, V.; Nakamura, Y.; Tennyson, J.; Faure, A.; Mason, N.J.; Itikawa, Y. Cross Sections for Electron Collisions with H2O. J. Phys. Chem. Ref. Data 2021, 50, 023103. [Google Scholar] [CrossRef]
  14. Werner, H.J.; Knowles, P.J.; Knizia, G.; Manby, F.R.; Schütz, M. Molpro: A general-purpose quantum chemistry program package. WIREs Comput. Mol. Sci. 2012, 2, 242–253. [Google Scholar] [CrossRef]
  15. Tennyson, J.; Brown, D.B.; Munro, J.J.; Rozum, I.; Varambhia, H.N.; Vinci, N. Quantemol-N: An expert system for performing electron molecule collision calculations using the R-matrix method. J. Phys. Conf. Ser. 2007, 86, 012001. [Google Scholar] [CrossRef]
  16. Ayouz, M.; Faure, A.; Tennyson, J.; Tudorovskaya, M.; Kokoouline, V. Cross sections and rate coefficients for vibrational excitation of H2O by electron impact. Atoms 2021, 9, 62. [Google Scholar] [CrossRef]
  17. Shimanouchi, T. Tables of Molecular Vibrational Frequencies: Part 6. J. Phys. Chem. Ref. Data 1973, 2, 121–162. [Google Scholar] [CrossRef]
  18. Császár, A.G.; Czakó, G.; Furtenbacher, T.; Tennyson, J.; Szalay, V.; Shirin, S.V.; Zobov, N.F.; Polyansky, O.L. On equilibrium structures of the water molecule. J. Chem. Phys. 2005, 122, 214305. [Google Scholar] [CrossRef]
  19. Tennyson, J. Electron–molecule collision calculations using the R-matrix method. Phys. Rep. 2010, 491, 29–76. [Google Scholar] [CrossRef]
  20. Carr, J.; Galiatsatos, P.; Gorfinkiel, J.; Harvey, A.; Lysaght, M.; Madden, D.; Mašín, Z.; Plummer, M.; Tennyson, J.; Varambhia, H. UKRmol: A low-energy electron- and positron-molecule scattering suite. Euro. Phys. J. D 2012, 66, 58. [Google Scholar] [CrossRef]
  21. Kokoouline, V.; Dulieu, O.; Kosloff, R.; Masnou-Seeuws, F. Mapped Fourier methods for long-range molecules: Application to perturbations in the Rb2 (0u+) photoassociation spectrum. J. Chem. Phys. 1999, 110, 9865. [Google Scholar] [CrossRef]
  22. Mizus, I.I.; Kyuberis, A.A.; Zobov, N.F.; Makhnev, V.Y.; Polyansky, O.L.; Tennyson, J. High-accuracy water potential energy surface for the calculation of infrared spectra. Philos. Trans. R. Soc. A 2018, 376. [Google Scholar] [CrossRef] [PubMed]
  23. Tennyson, J.; Bernath, P.F.; Brown, L.R.; Campargue, A.; Császár, A.G.; Daumont, L.; Gamache, R.R.; Hodges, J.T.; Naumenko, O.V.; Polyansky, O.L.; et al. IUPAC critical evaluation of the rotational—Vibrational spectra of water vapor. Part II: Energy levels and transition wavenumbers for HD16O, HD17O, and HD18O. J. Quant. Spectrosc. Radiat. Transfer 2010, 111, 2160–2184. [Google Scholar] [CrossRef]
  24. Zobov, N.F.; Koshelev, M.A.; Makarov, D.S.; Makhnev, V.Y.; Boyarkin, O.V.; Tyuterev, V.G.; Tennyson, J.; Polyansky, O.L. A global line list for HDO between 0 and 35000 cm−1 constructed using multiphoton spectra. J. Quant. Spectrosc. Radiat. Transfer 2021, 271, 107694. [Google Scholar] [CrossRef]
  25. Sironneau, V.T.; Hodges, J.T. Line shapes, positions and intensities of water transitions near 1.28 μm. J. Quant. Spectrosc. Radiat. Transfer 2015, 152, 1–15. [Google Scholar] [CrossRef]
  26. Khakoo, M.A.; Muse, J.; Campbell, C.; Lopes, M.C.A.; Silva, H.; Winstead, C.; McKoy, V. Low energy electron scattering from polyatomic targets. J. Phys. Conf. Ser. 2009, 194, 012027. [Google Scholar] [CrossRef]
  27. El-Zein, A.A.A.; Brunger, M.J.; Newell, W.R. Excitation of vibrational quanta in water by electron impact. J. Phys. B At. Mol. Opt. Phys. 2000, 33, 5033. [Google Scholar] [CrossRef]
  28. Shyn, T.W.; Cho, S.Y.; Cravens, T.E. Vibrational-excitation cross sections of water molecules by electron impact. Phys. Rev. A 1988, 38, 678–682. [Google Scholar] [CrossRef]
  29. Seng, G.; Linder, F. Vibrational excitation of polar molecules by electron impact. II. Direct and resonant excitation in H2O. J. Phys. B At. Mol. Phys. 1976, 9, 2539. [Google Scholar] [CrossRef]
  30. Nishimura, T.; Gianturco, F.A. Vibrational excitation of water by low-energy electron scattering: Calculations and experiments. Europhys. Lett. 2004, 65, 179–185. [Google Scholar] [CrossRef]
  31. Curà k, R.; Cársky, P. Vibrationally inelastic electron scattering on polyatomic molecules by the discrete momentum representation (DMR) method. J. Phys. B At. Mol. Opt. Phys. 2003, 36, 2165. [Google Scholar] [CrossRef]
  32. Itikawa, Y.; Mason, N. Rotational excitation of molecules by electron collisions. Phys. Rep. 2005, 414, 1. [Google Scholar] [CrossRef]
  33. Yousfi, M.; Benabdessadok, M.D. Boltzmann equation analysis of electron-molecule collision cross sections in water vapor and ammonia. J. Appl. Phys. 1996, 80, 6619–6630. [Google Scholar] [CrossRef]
  34. Ayouz, M.A.; Buch, A. Theoretical Study of the Dissociative Recombination and Vibrational (De-)Excitation of HCNH+ and Its Isomers by Electron Impact. Atoms 2024, 12, 64. [Google Scholar] [CrossRef]
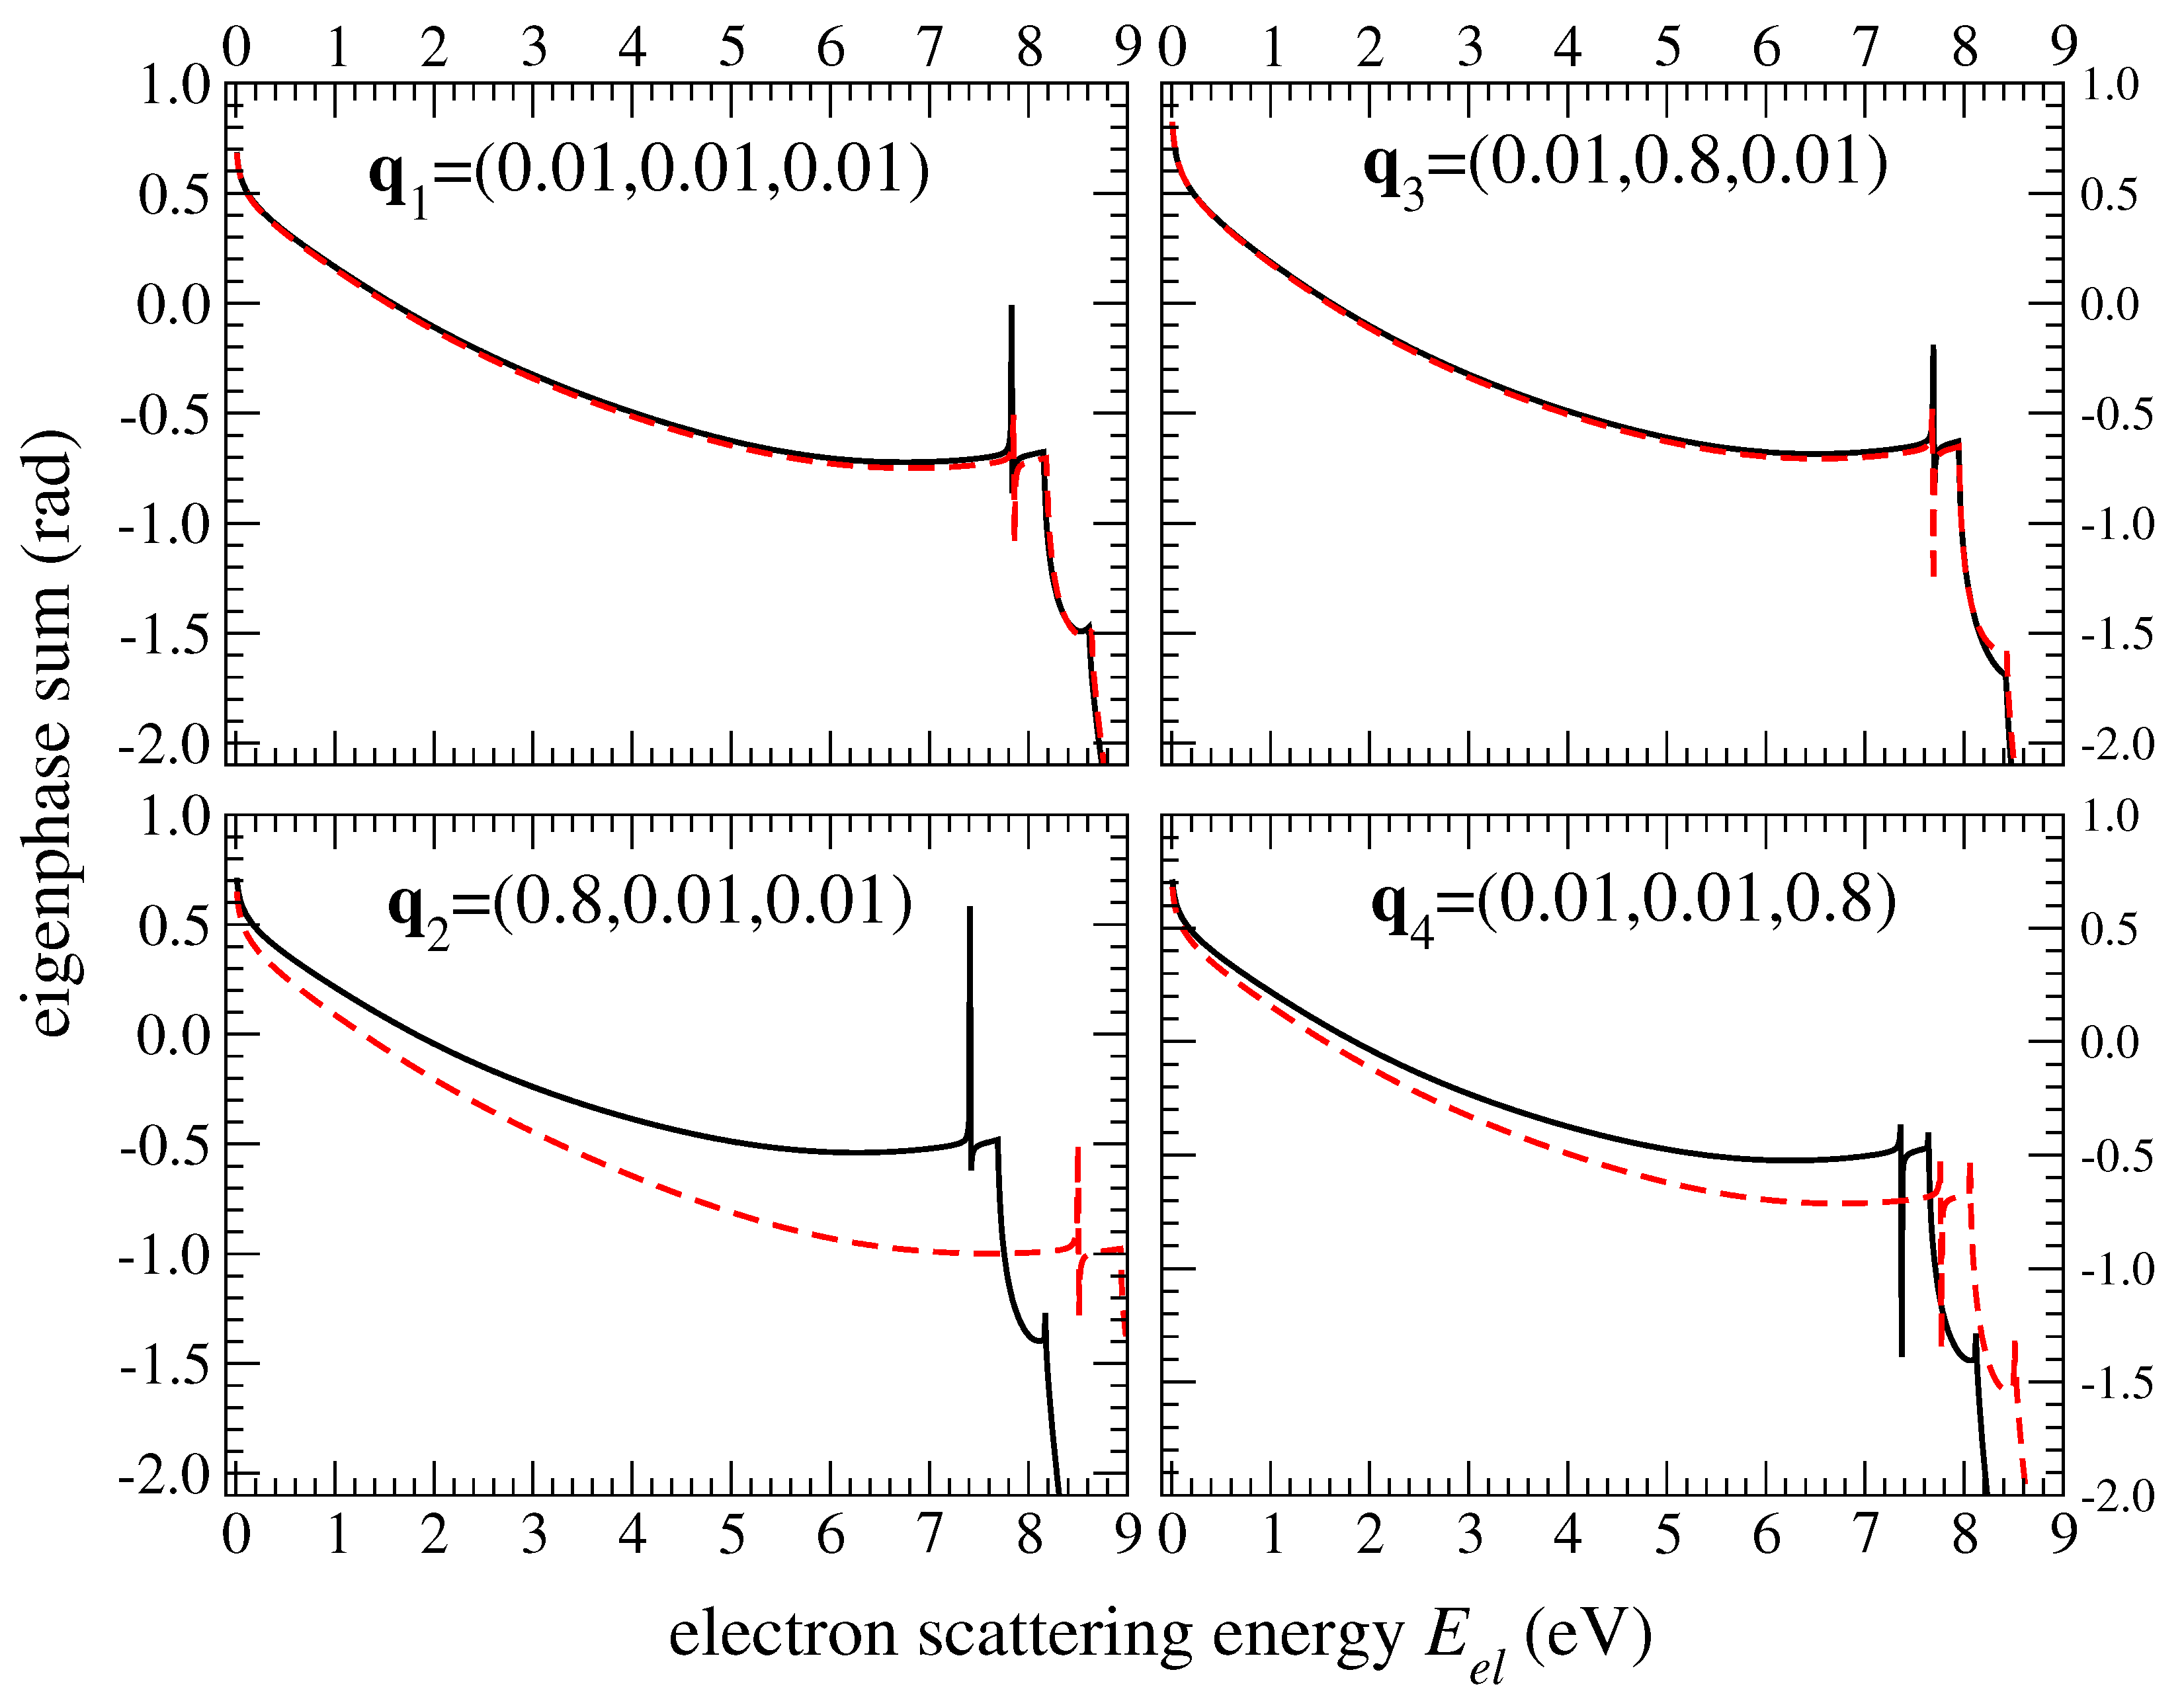
Figure 1. Eigenphase sum as a function of the electron scattering energy E e l for different geometry configurations q i = ( q 1 , q 2 , q 3 ) ( i = 1 , 2 , 3 , 4 ) of the HDO molecule (solid black lines) employed for the scattering calculations. For comparison, eigenphase sum for the same geometries are depicted for H2O (dashed red lines).
Atoms 13 00032 g001
Figure 2. Wave functions of vibrational states of HDO with energies < 7000 cm−1 of HDO, shown as intensity plots depending on two coordinates (indicated on the top of each plot), while the third coordinate is fixed at the equilibrium q i = 0 .
Atoms 13 00032 g002
Figure 3. Similar to Figure 2 for several other wave functions.
Atoms 13 00032 g003
Figure 4. Similar to Figure 2 for several other wave functions.
Atoms 13 00032 g004
Figure 5. Cross sections of vibrational (de-)excitation of HDO (solid lines) and H2O (dashed lines) from the vibrational level ( 000 ) (the upper panels) or ( 010 ) (the lower panels) to several other levels ( v 1 v 2 v 3 ) . The corresponding vibrational levels are depicted on the right panels with the same color code. Note that the level ( 200 ) is not displayed for clarity reasons.
Atoms 13 00032 g005
Figure 6. Cross sections of vibrational (de-)excitation of HDO (solid lines) and H2O (dashed lines) from the vibrational level ( 100 ) (the upper panels) or ( 001 ) (the lower panels) to several other levels ( v 1 v 2 v 3 ) . The corresponding vibrational levels are depicted on the right panel with the same color code. Note that the level ( 200 ) is not displayed for clarity.
Atoms 13 00032 g006aAtoms 13 00032 g006b
Figure 7. Comparison of cross sections available in the literature [26,27,28,29,30,31,32,33] for the excitation of the bending ( 010 ) ( 000 ) (top panels) and stretching ( 100 ) + ( 001 ) ( 000 ) (low panels) modes of H2O. The pink solid line is the theoretical result obtained in this work for HDO, while the black and blue lines are for H2O from previous studies [12,16].
Atoms 13 00032 g007
Figure 8. Rate coefficients for the excitation of vibrational (de-)excitation of HDO (solid lines) and H2O (dashed lines) from the vibrational level ( 000 ) (the upper panels) or ( 010 ) (the lower panels) to several other levels ( v 1 v 2 v 3 ) . The corresponding vibrational levels are depicted on the right panel with the same color code. Note that the level ( 200 ) is not displayed for clarity. The color code is the same as in Figure 5.
Atoms 13 00032 g008
Figure 9. Rate coefficients for the excitation of vibrational (de-)excitation of HDO (solid lines) and H2O (dashed lines) from the vibrational level ( 100 ) (the upper panel) or ( 001 ) (the lower panel) to several other levels ( v 1 v 2 v 3 ) . The corresponding vibrational levels are depicted on the right panel with the same color code. Note that the level ( 200 ) is not displayed for clarity. The color code is the same as in Figure 6.
Atoms 13 00032 g009aAtoms 13 00032 g009b
Figure 10. Quality of the fit of Equation (7) for (de-)excitation process of HDO. Numerical and fitted values are displayed by solid and dashed lines according to the color code of Figure 5 and Figure 6, respectively. Circles of the same color refer to the excitation process. For convenience, the vertical dashed line at x = 0 gives the coefficient value of a 0 at 300 K, evaluated by the analytical fit as 10 a 0 , see Equation (7).
Atoms 13 00032 g010
Figure 11. The figure compares the results obtained for the different models, Models 1–3, discussed in the text. It allows us to assess the uncertainty of the obtained theoretical cross sections with respect to the parameters of the calculations. Cross sections for the excitation of the bending mode (the upper panel) and the stretching modes (the lower panel) are shown.
Atoms 13 00032 g011
Table 1. HDO properties—equilibrium structure and vibrational frequencies of vibrational modes (in eV)—obtained in this study and compared with experimental data from Ref. [17], and to those of H2O. Normal modes of both molecules are depicted in each first column, where the arrows indicate the direction and magnitude of displacements for each mode. Ab initio models are slightly different in the present study and in Ref. [12].
HDOH2O
Mode (v)This StudyExp. [17]Mode (v)Calc. [12,16]Exp. [17,18]
Bending (010)
Atoms 13 00032 i001
0.1790.173Bending (010)
Atoms 13 00032 i002
0.2070.198
OD stretching (100)
Atoms 13 00032 i003
0.3490.338Symmetric stretching (100)
Atoms 13 00032 i004
0.4720.453
OH stretching (001)
Atoms 13 00032 i005
0.4820.458Asymmetric stretching (001)
Atoms 13 00032 i006
0.4880.466
Bond lengths r 1 = r O H , r 2 = r O D (Å)0.9580.956 r 1 = r O H , r 2 = r O H (Å)0.9580.958
Bond angle θ = ( r 1 , r 2 ) ^ (Degrees)104.36105.20 θ = ( r 1 , r 2 ) ^ (Degrees)104.44104.50
Table 2. Energies (in cm−1) of the lowest vibrational levels of HDO, obtained using the PES by Mizus et al. [22], compared with experimental data [23] and previous calculations [24]. The experimental energies are provided in cm−1 and in eV (in parentheses). Energies of the H2O vibrational states are also provided for comparison.
HDO H2O
( v )This WorkCalc. [24]Exp. [23]Rel. Deviation (%) Calc. [12]Exp. [25]
(000)000- 00
(010)1394.42491403.501403.4837 (0.1740)0.65 1582.10161594.7463
(100)2720.04652723.712723.6797 (0.3376)0.13 3656.74383657.0533
(020)2764.86482782.022782.0111 (0.3449)0.62 3124.30863151.6298
(001)3700.38183707.473707.4667 (0.4596)0.19 3742.81123755.9285
(110)4078.20124099.984099.9559 (0.5083)0.53 5223.03595234.9756
(030)4123.39984145.484145.4731 (0.5139)0.53 4638.22104666.7905
(011)5061.25515089.555089.5398 (0.6310)0.56 5281.11185331.2673
(200)5357.80415363.845363.8244 (0.6650)0.11 7195.49497201.5399
(040)5385.32035420.005420.0414 (0.6719)0.64 6015.09876134.0150
(120)5474.3136-5506.1868 (0.6826)0.58 6744.55806775.0935
(101)6387.24636415.486415.4606 (0.7954)0.44 7239.01237249.8169
(021)6420.48316451.916451.8998 (0.7999)0.49 6781.28696871.5202
(050)6645.55046690.426690.4132 (0.8295)0.67 7642.53337542.3725
(210)6721.32486746.926746.9082 (0.8365)0.38 8737.13998761.5816
(130)6805.1825-6849 (0.8491)0.64 8253.42188273.9757
Table 3. Assignment ( v ) of the lowest few vibrational levels. The levels, given in Table 1, are assigned according to the largest square of projection v 1 , v 2 , v 3 | ψ v 2 of the wave function ψ v on the analytical normal-mode states | v 1 , v 2 , v 3 . The green color denotes the largest element for which the assignment is performed, while the orange color represents the second largest value. Curved arrows give the reading direction for each vibrational level assignment.
Atoms 13 00032 i007
Table 4. Summary of the methodology for obtaining the scattering matrix S ̲ e x ( q ) of Equation (3). The procedure is performed for each scattering energy E e l and partial wave ( l λ , l λ ) .
StepInputDescriptionOutput
(1)Geometries q of Figure 1Calculate the reactance matrix K ̲ ( q )
(2) K ̲ ( q ) Diagonalize K ̲ ( q ) Eigenvalues k ( q ) = tan δ ( q )
and the eigenvectors matrix U ̲
(3) δ ̲ ( q ) , diagonal matrix of δ ( q ) Build the matrix of scattering phaseshifts Δ ̲ ( q ) = U ̲ δ ̲ ( q ) U ̲ 1
(4)Elements of Δ ̲ ( q ) Linear fit of Δ l λ , l λ ( q ) c 0 , c 1 , c 2 and c 3
using Δ l λ , l λ f i t ( q ) = c 0 + c 1 q 1 + c 2 q 2 + c 3 q 3 for each partial wave ( l λ , l λ )
(5) Δ l λ , l λ f i t ( q ) Extrapolate Δ l λ , l λ ( q ) Δ l λ , l λ e x ( q ) = c 0 + c 1 q 1 + c 2 q 2 + c 3 q 3
(6) Δ ̲ e x ( q ) Diagonalize Δ ̲ e x ( q ) Eigen phaseshifts δ e x ( q )
and eigenvectors matrix U ̲ e x
(7)Diagonal matrix δ ̲ e x ( q ) from δ e x ( q ) Build S ̲ e x ( q ) S ̲ e x ( q ) = U ̲ e x exp 2 i δ ̲ e x ( q ) ( U ̲ e x ) 1
Disclaimer/Publisher’s Note: The statements, opinions and data contained in all publications are solely those of the individual author(s) and contributor(s) and not of MDPI and/or the editor(s). MDPI and/or the editor(s) disclaim responsibility for any injury to people or property resulting from any ideas, methods, instructions or products referred to in the content.