Abstract
We present a study of Doppler-sensitive light-pulse atom interferometers operating within optical dipole potentials, where atomic trajectories are manipulated using momentum transfer from light pulses and optical forces from the trap. Efficient methods are introduced to minimize the inhomogeneous broadening of oscillation frequencies in atoms confined within a three-dimensional optical lattice trap. These techniques enable the preparation of various quantum states, including vacuum, thermal, and squeezed states, for atom interferometry. Additionally, we demonstrate a two-dimensional atom interferometer using a single optical dipole trap, where transverse motion is activated by offsetting the trap position. Our work provides insights into controlling the mechanical motion of neutral atoms in optical harmonic potentials and contributes to advancing applications in quantum sensing and quantum computing.
1. Introduction
Atoms confined in conservative potentials have become a cornerstone of the ultra-cold atoms community. In ultra-cold quantum gases, evaporative cooling relies on such potentials to facilitate the thermalization of atoms [1]. In quantum simulation, the ability to manipulate the potential of an optical lattice has enabled the observation of phase transitions, such as the transition from a superfluid state to a Mott insulator state [2]. Furthermore, the isolated lattice sites in these systems allow for precise control of atoms’ internal states, a key feature for optical lattice clocks [3]. In quantum computing, individual lattice sites with atoms act as localized quantum registers, paving the way for advanced computational tasks [4].
In atom interferometric sensing, atoms in separated arms of the interferometer undergoing Bloch oscillations within optical lattices can enhance the space–time enclosed area of the interferometer [5]. A two-dimensional interferometer has been demonstrated using a single optical dipole trap [6], where the motion along the trap axis is controlled by interferometer pulses, and the transverse motion is actuated by adiabatically shifting the trap’s position. Additionally, Bose–Einstein condensates guided within circular magnetic traps have been employed to create Sagnac interferometers [7]. Furthermore, it has been proposed and experimentally demonstrated that single trapped ions can construct multi-dimensional atom interferometers, utilizing the restoring force of the electric potential to reverse the interferometer trajectories [8,9].
In this work, we experimentally demonstrate a forced interferometer using an ensemble of neutral atoms trapped in optical potentials. By employing optical lattices and single optical dipole potentials, we approximate quadratic potentials. To mitigate the effects of anharmonicity arising from the Gaussian profile of the laser beams forming the optical potential, we develop strategic and efficient methods to concentrate atoms at the center of the trap. This minimizes inhomogeneous broadening of the atomic oscillation frequencies and cools the atoms to the ground states of the potential. We demonstrate interferometers operating with vacuum, squeezed, and thermal states, and realize a forced two-dimensional interferometer within a single dipole trap.
2. Results
2.1. Three-Dimensional Optical Lattice Beams Alignment and Lamb–Dicke Spectroscopy
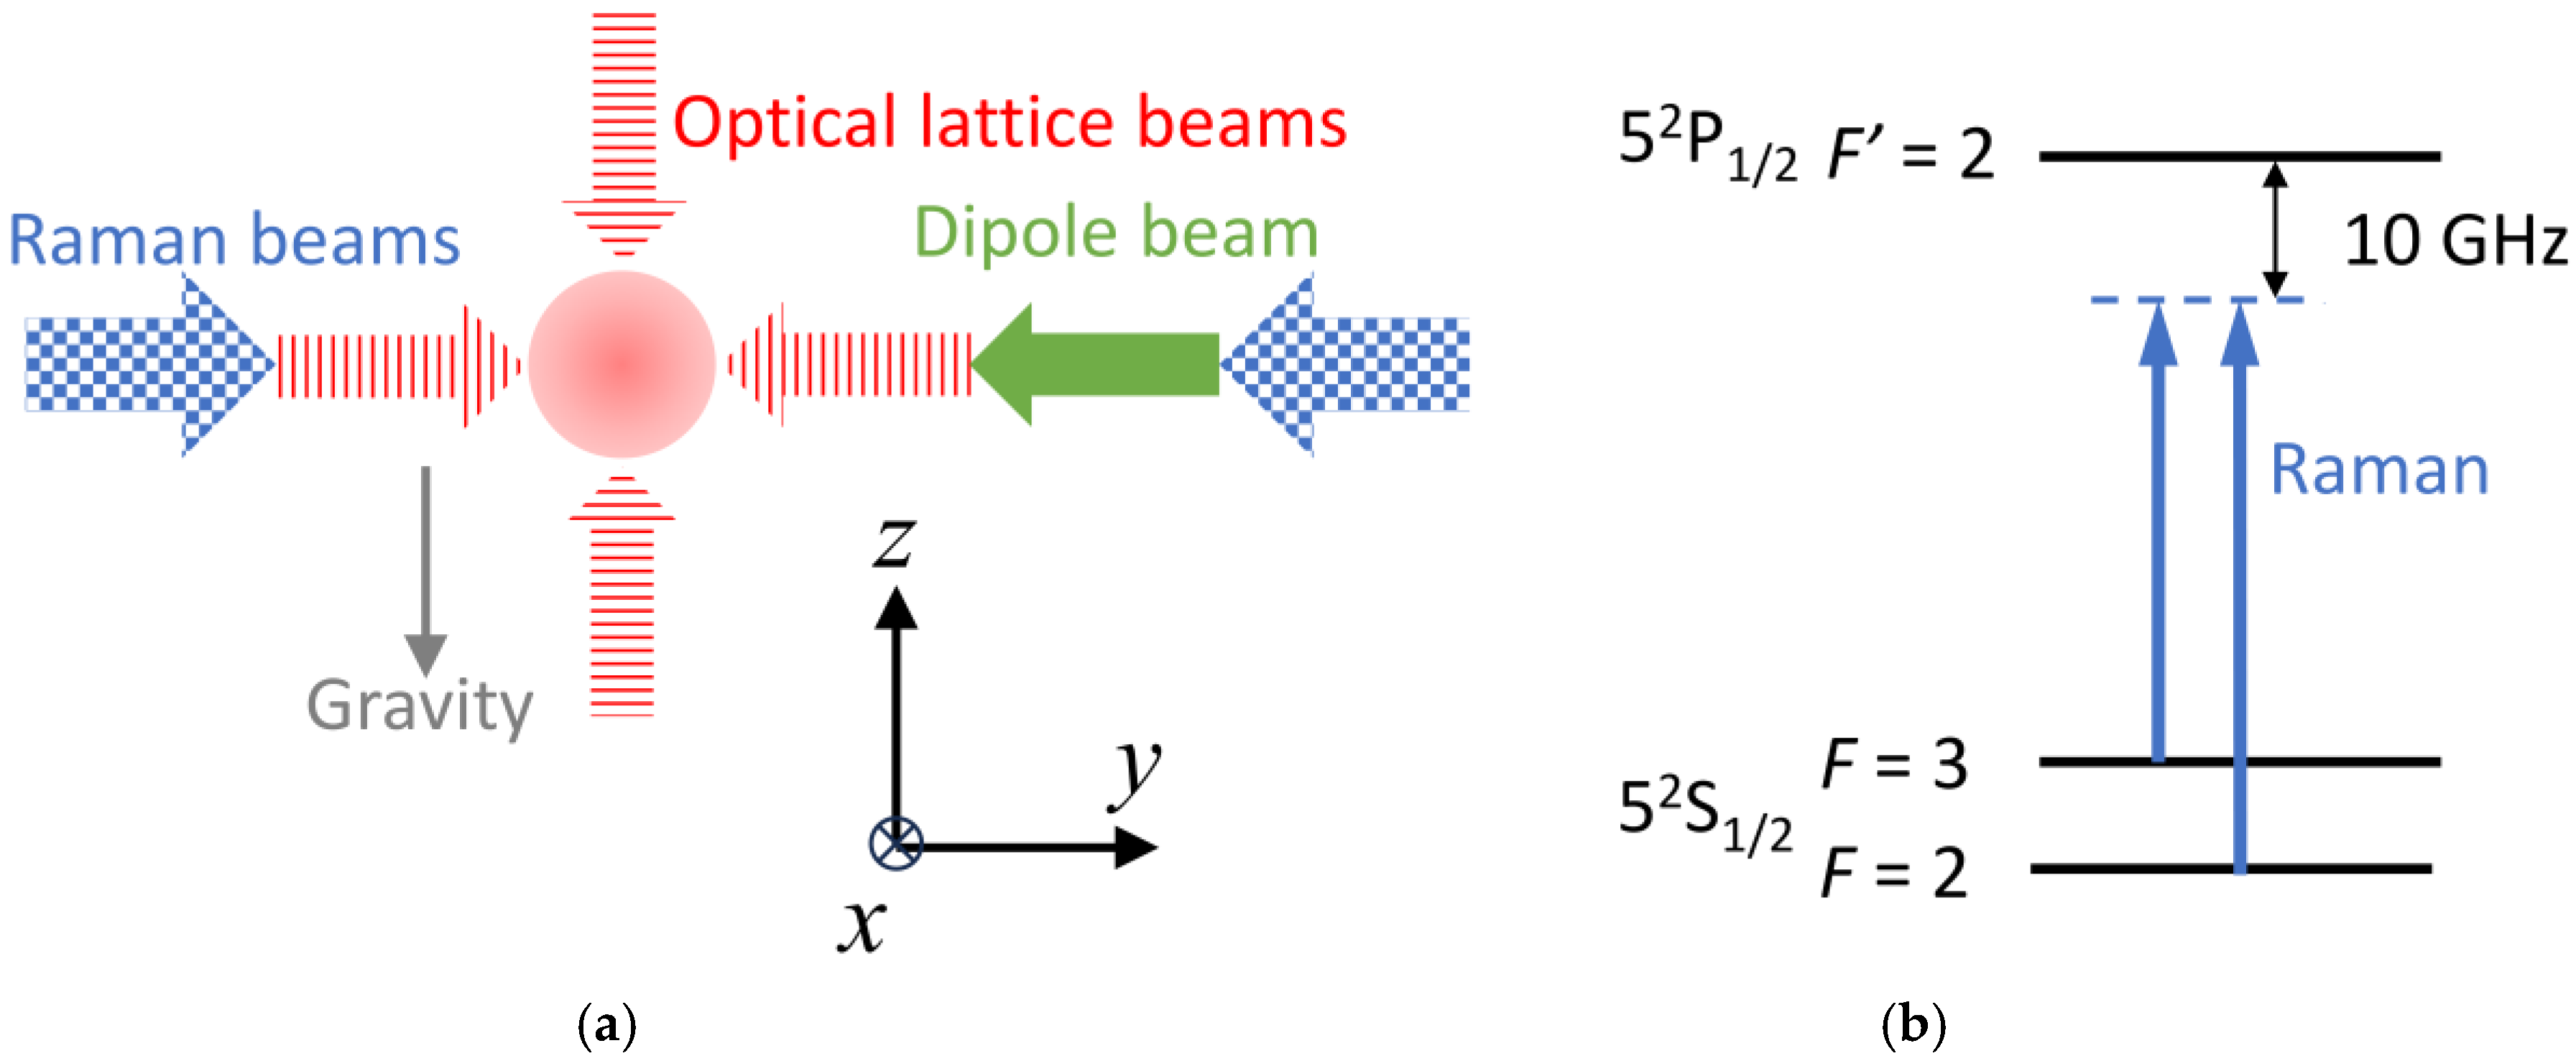
The measured collective coherence of the generated quantum states in each optical lattice site is determined by the trap homogeneity. A key requirement for achieving homogeneous oscillation frequencies across the atomic ensemble is the precise overlap of the three-dimensional (3D) optical lattice beams at their beam waists. The x- and z-lattice beams are derived from a 1064 nm solid-state laser with a beam waist of 60 μm, corresponding to a Rayleigh length of 21.2 mm. Their frequencies are off by 160 MHz via acousto-optical modulators to avoid interference. The y-lattice beam, formed by an 803 nm laser, has a larger beam waist of 130 μm and a Rayleigh length of 368 mm. All beams are retro-reflected using plane mirrors. Here, the gravity is along the z-direction. Figure 1 shows the optical layout of the 3D optical lattice beams, optical dipole beam, and Raman beams.

Figure 1.
(a) Optical layout of the optical lattice beams (red stripes), dipole beam (green solid), and Raman beams (blue chess board). The gravity is pointing to the −z direction. (b) The relevant energy levels and frequency configuration for the two-photon Raman transition.
Due to its larger dimensions, the y-lattice beam serves as the reference for aligning the smaller x- and z-lattice beams. For coarse alignment, the x- and y-lattices are first aligned parallel to the optical table using iris diaphragms (<1 mm aperture) over distances of approximately 75 cm and 100 cm, respectively, ensuring a beam tilt of ≲1 mrad relative to the table surface. The initial beam heights of the x- and y-lattice beams are also adjusted to within 1 mm using the same diaphragms.
The retro-reflection of the y-lattice beam is optimized by maximizing back-coupling into an optical fiber. The alignment of the x-lattice beam with the y-lattice is fine-tuned using two mirrors to control its two-dimensional position and direction, while a translational stage along the x-axis ensures proper alignment of the beam waist.
To verify the overlap of the x- and y-lattice beams, we first transfer cold atoms from a magneto-optical trap (MOT) into the y-lattice while keeping the x- and z-lattice beams off. After a wait time of 20 ms, atoms that are not trapped in the y-lattice fall out of the region of interest, leaving only those confined within the y-lattice. Next, we switch on the x-lattice and turn off the y-lattice, allowing another 20 ms for any atoms not trapped by the x-lattice to exit the trapping region. Finally, we reactivate the y-lattice and measure the number of atoms remaining in the two-dimensional lattice.
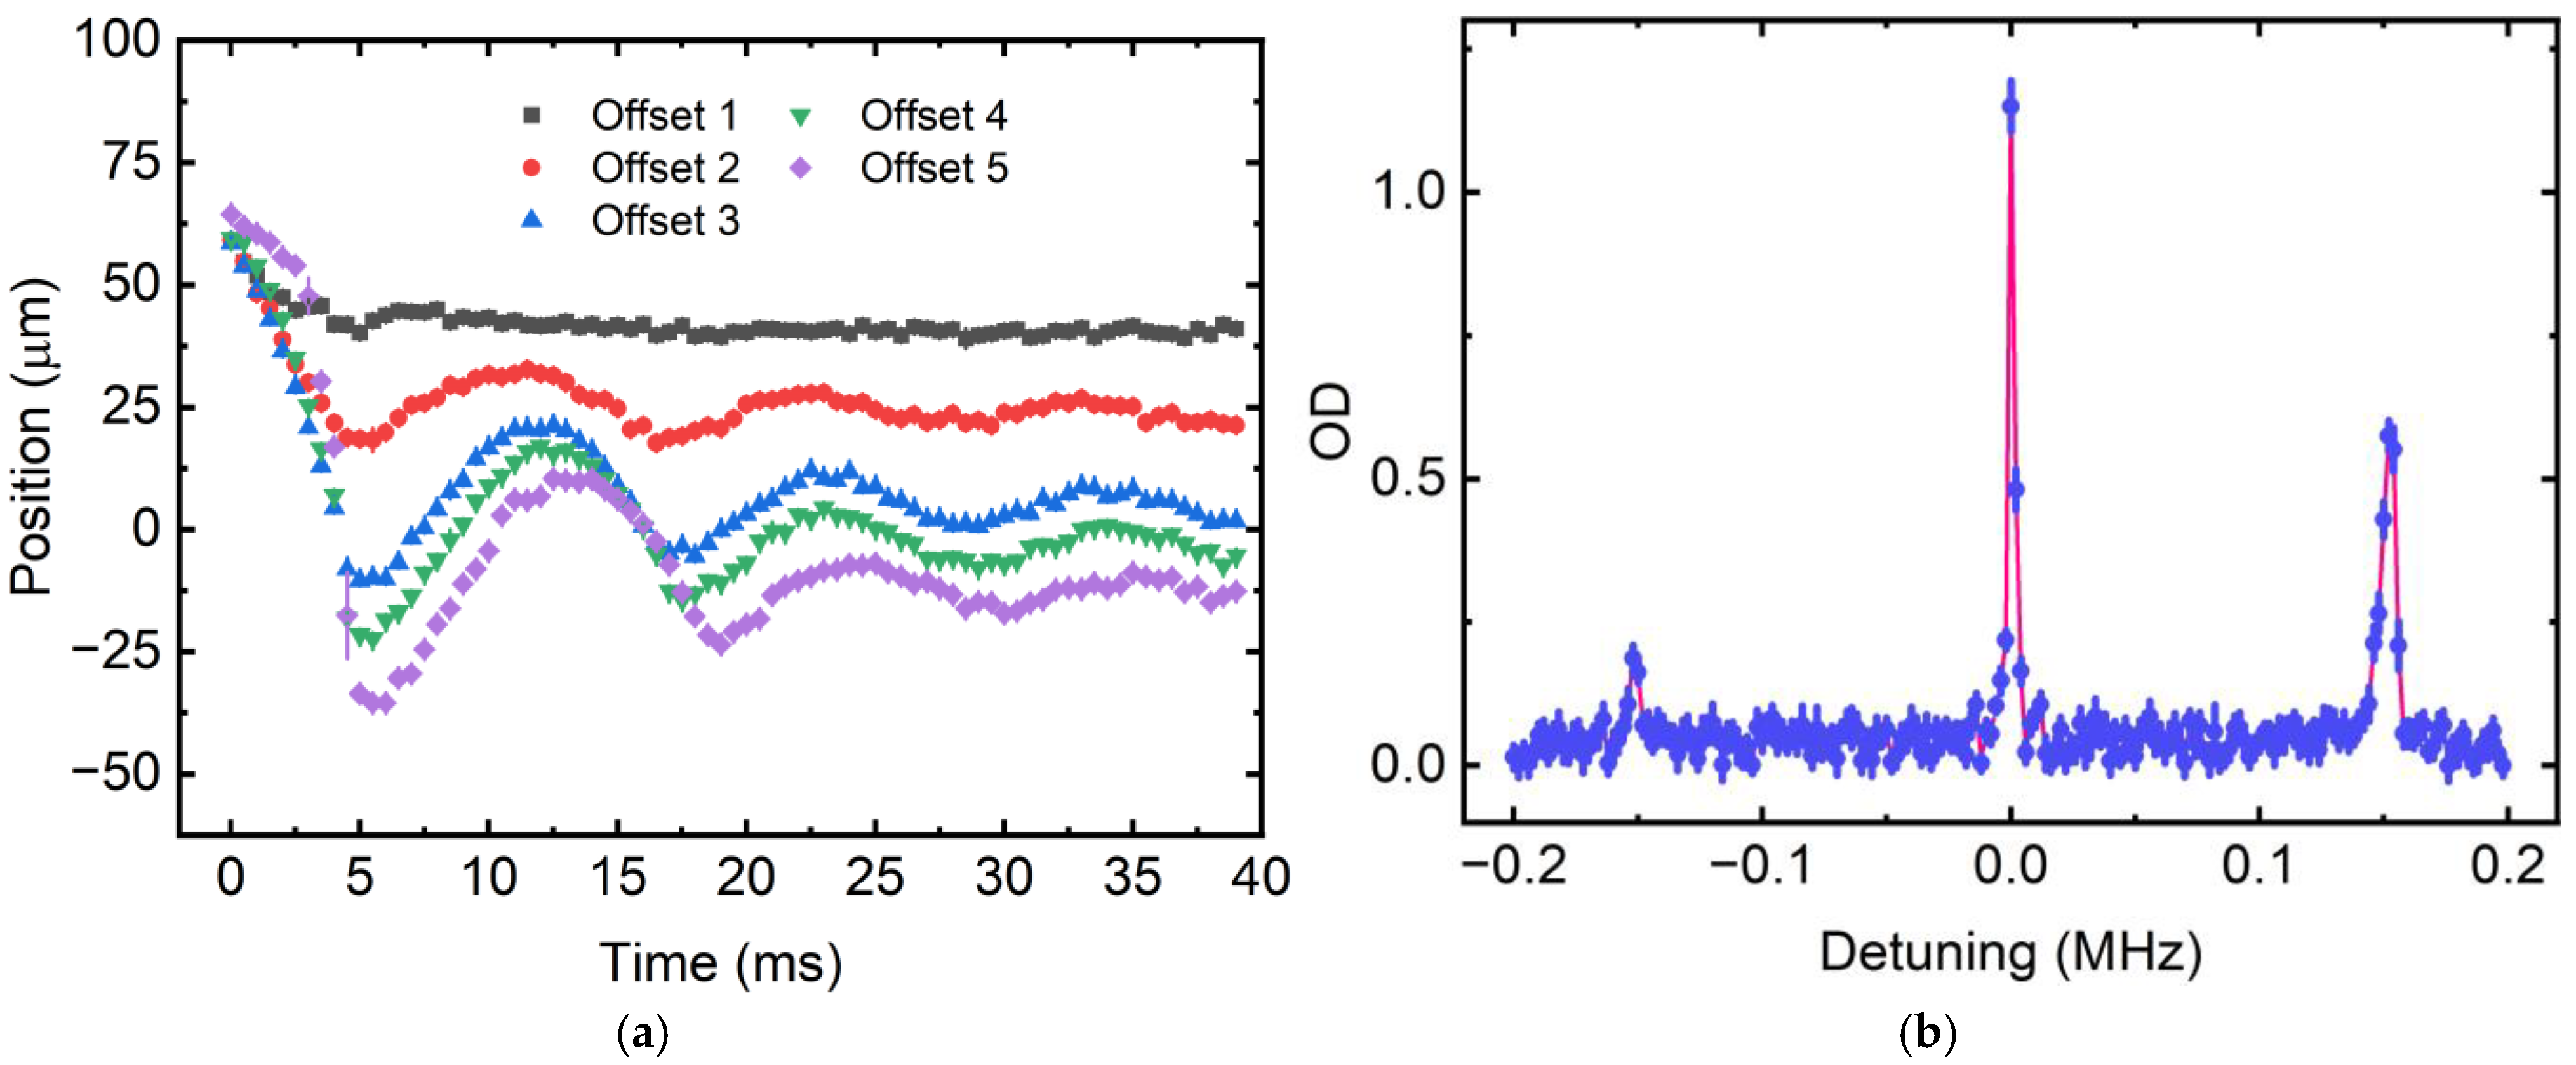
If the x- and y-lattice beams are not well-aligned, atoms oscillate radially in one lattice when the other lattice is turned off. This radial oscillation is captured using absorption imaging of the atomic cloud, and the position is determined through Gaussian function fitting on a CCD camera. Figure 1a shows an example of collective oscillations of atoms in the radial direction of the y-lattice with different offsets from the lattice center.
We repeat this procedure to optimize atom numbers—and hence the overlap of the lattice beams—by adjusting the alignment mirrors and the translational stage. The amplitude of the oscillation is minimized to the resolution of our imaging system, which is 5.5 μm. The same process is applied to the z- and y-lattice pair. Lastly, the x- and z-lattice pair alignment is used to cross-check the overall 3D alignment. Once aligned, we cool atoms to the ground state of the 3D lattice using electromagnetically induced transparency (EIT) cooling [10,11]. The z-axis lattice was then turned off, where the atomic cloud was out of thermal equilibrium, causing its width along the z-direction to oscillate at twice the trap frequency. After allowing the system to evolve for a quarter of the trapping period, the atoms naturally converged toward the centers of the one-dimensional (1D) tubes. At this point, the z-lattice was reactivated to confine the atoms in a three-dimensional (3D) lattice. This was followed by another cycle of EIT cooling. Subsequently, the x and y lattices were turned off for a quarter of the oscillation period, guiding the atoms toward the centers of the two-dimensional (2D) lattice planes. This sequence resulted in grouping atoms at the center of the 3D lattice [11].
We investigated the distribution of oscillation frequencies across lattice sites by performing Lamb–Dicke spectroscopy. This was achieved by coherently coupling the 85Rb F = 2, m = 0 and F = 3, m = 0 ground states to an excited state using a pair of counter-propagating Raman beams, where m denotes a Zeeman substate and the Zeeman degeneracy is lifted by applying a magnetic field of 1 G. By scanning the relative frequency of the two beams, atoms are excited to a different internal state when the energy difference between the beams matches the sum of an integer multiple of the vibrational energy and the hyperfine energy [10]. The population of atoms in the F = 3, m = 0 state is determined by measuring the optical density (OD) through the absorption of a probe beam.
In earlier experiments without compression in one- and two-dimensional optical lattices, the quality factor of the spectrum—defined as the vibrational frequency divided by the width of the first red sideband—was approximately 3–5 [12,13]. The primary broadening mechanism was the Gaussian intensity distribution of the laser beams. After compression, the quality factor improved significantly to around 15, as shown in Figure 2b. The Lamb–Dicke spectroscopy profile was fitted to a theoretical model for further analysis [11].
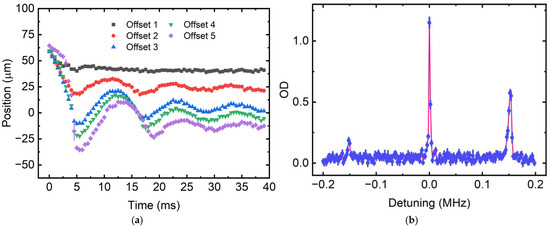
Figure 2.
(a) The position of the atomic cloud on the CCD camera as a function of waiting time. Different offsets are introduced by laterally adjusting the alignment of the laser beam. The equilibrium positions, relative to Offset 1, indicate the offset distances of the laser beam. The error bars represent the standard error of the mean for four experimental runs. (b) Lamb–Dicke spectroscopy of atoms in an optical lattice. The red curve represents a theoretical fit to the experimental data. The error bars represent the standard error of the mean for four experimental runs.
2.2. Atom Interferometers in the 3D Optical Lattice
The optical lattice potential can be approximated as quadratic, enabling the preparation of various initial states for atom interferometry. In our system, the typical vibrational frequency, ω, ranges from 100 to 150 kHz, corresponding to 250 to 350 μK trap depth. We demonstrate interferometers within the optical lattice using vacuum, squeezed, and thermal states. The thermal state is prepared by directly loading atoms from the magneto-optical trap into the optical lattice, resulting in a typical mean vibrational quantum number of three. To prepare the vacuum state, we cool atoms to the vibrational ground state of the lattice using resolved Raman sideband cooling. Additionally, an optical pumping beam accumulates the atoms in the ∣↓⟩ = |F = 2, m = 0⟩ state, eliminating decoherence from the first-order Zeeman shift [12]. We typically achieve a mean vibrational number of 0.2 after the ground cooling.
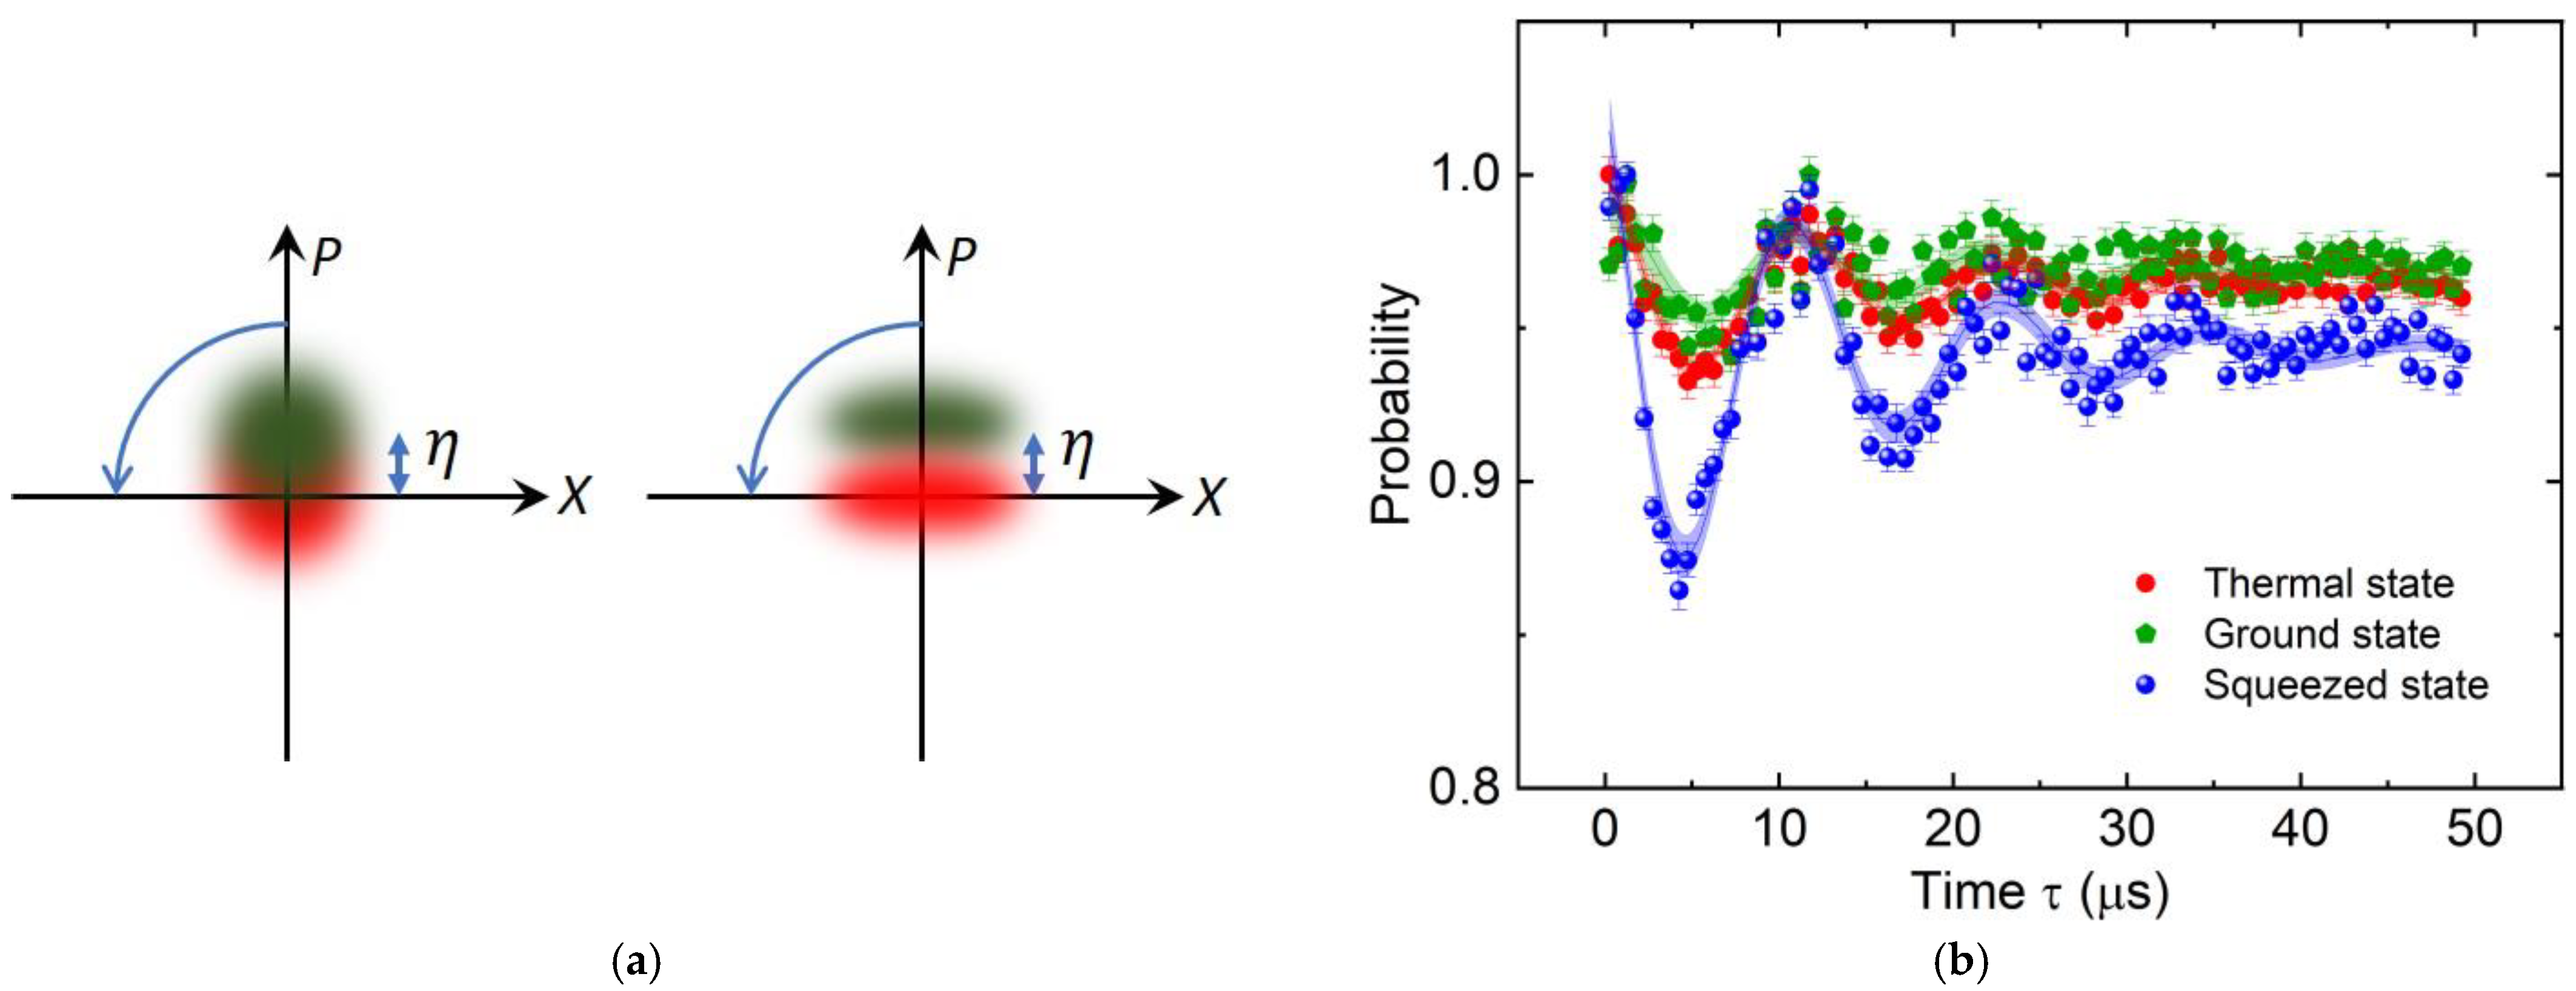
The squeezed state is generated by applying sudden changes to the potential’s amplitude, achieving 7 dB of squeezing in the position quadrature [14]. A Ramsey interferometer is formed using two beam splitter pulses separated by a free evolution time τ. Each pulse employs a Doppler-sensitive two-photon Raman process to couple ∣↓⟩ and ∣↑⟩ = ∣F = 3, m = 0⟩, with an accompanying momentum transfer. When the laser pulses are much shorter than the oscillation period, the atomic motion is effectively frozen, and the system operates in the Kapitza–Dirac regime [15,16]. In this regime, the output states can be expressed as:
where is the Bessel function of order n, θ is the pulse strength, ϕ is the laser phase, D is the coherent state displacement operator, is the Lamb–Dicke parameter, and σx is the Pauli spin operator. Figure 3a shows one of the output states for illustration purposes.

Figure 3.
Atom interferometer in a 3D optical lattice. (a) Phase space representation (normalized coordinates X and P) of a coherent superposition state after the first beam splitter. The two states are separated by a normalized momentum η and are distinguished by their spin states, represented by different colors. Left: vacuum state. Right: momentum-squeezed state. Only one momentum state is shown for simplification. (b) Interference fringes of Ramsey interferometers with different initial states. The probability is calculated by normalizing the population of atoms in ∣↓⟩ at τ = 0. The shaded band indicates curve fitting uncertainty and the error bars represent the standard error of the mean for five experimental runs.
The output states are distributed according to the Bessel function Jn(θ), and any two neighboring states are separated in phase space by a normalized momentum , where is the momentum transfer imparted by the Raman beams, and m is the mass of the atoms. After a free evolution time τ within the trap, the same beam splitter pulse is applied to interfere with the wave packets.
In this experiment, the pulse strength is kept weak, such that the interferometer states predominantly remain in J0 with only a small population in J±1. The interference fringes are measured by detecting atoms in the |↓˃ state with different τ. When τ corresponds to an integer multiple of the oscillation period, the atomic wave packets return to their initial positions in phase space and interfere constructively. Figure 3b shows the interference fringes with different initial states. The data are fitted with an exponentially decaying sinusoidal function.
The interferometer with the squeezed state exhibits higher contrast due to the 30% reduction in momentum uncertainty compared to the ground state. This reduced uncertainty results in greater separation of the wave packets in phase space during the free evolution. The fitted coherence decay times are 12(1) μs, 14(1) μs, and 20(6) μs for the squeezed, thermal, and ground states, respectively. In general, the decoherence observed for the three different initial states arises from inhomogeneous broadening caused by variations in vibrational frequencies across different lattice sites. The slightly longer coherence time for the ground state is attributed to its relative immunity to the anharmonicity of the trap.
2.3. Two-Dimensional Atom Interferometer in an Optical Dipole Trap
Alternatively, an ensemble of atoms in a large trap potential can mitigate dephasing caused by inhomogeneous oscillation frequencies. However, increasing the trap size typically results in a shallow potential due to limited optical power, requiring alternative strategies to efficiently prepare atoms in the ground state of the potential. Recent advancements have demonstrated the formation of a quantum gas within just 10 ms after sub-Doppler cooling in an optical lattice using EIT cooling and adiabatic expansion [11].
Following this approach, we cool atoms to quantum degeneracy in a single optical dipole trap along the y-direction formed by a 1064 nm laser with a beam waist of 130 μm. After concentrating the atoms at the center of the 3D optical lattice to achieve high density, we apply EIT cooling once more to bring the atoms back to their motional ground state. The optical lattice depth is then adiabatically reduced, which increases the atomic phase-space density to near unity. Simultaneously, a single dipole trap along the y-axis is switched on, initiating the controlled collapse of the atomic ensemble. After the collapse, the remaining 85Rb atoms are held in the trap for 30 ms, allowing thermal atoms to escape along the axial direction. The residual atoms reach an effective temperature of 30 nK.
To construct a two-dimensional interferometer, atoms are initially displaced along the radial direction of this y-trap, followed by a double diffraction beam splitter pulse applied along the y-trap axial direction [17]. As the atoms descend to the bottom of the potential, a mirror pulse at the trap center reverses their axial velocity. They then interfere on the opposite side of the trap upon the application of a second beam splitter pulse, completing the two-dimensional interferometer, as shown in Figure 4.
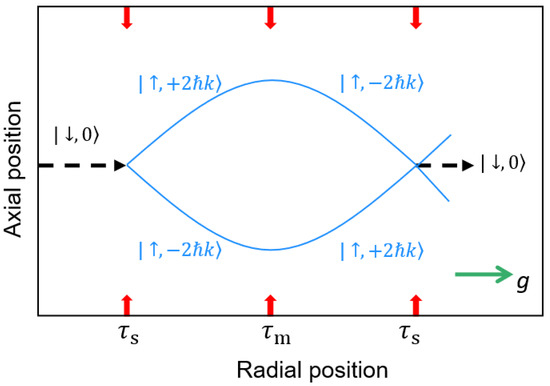
Figure 4.
Schematic of a two-dimensional atom interferometer within a single dipole beam. The red arrows represent the interferometer pulses. Gravity g acts along the radial direction. Parasitic interferometer arms are omitted for clarity.
We begin by examining the trajectory of atoms displaced from the center of the trap without applying any interferometer sequence. This motion is modeled as a damped harmonic oscillator subjected to a constant driving force due to gravity, described as:
where g denotes the gravitational acceleration. For an anharmonic oscillator, the amplitude-dependent oscillation frequency effectively leads to inhomogeneous broadening when considering an ensemble of atoms with a distribution of amplitudes. To account for this effect empirically, we incorporate the influence of anharmonicity into the system’s dynamics through the damping constant γ. For an initial offset position x0, the solution to Equation (2) in the underdamped regime is given by:
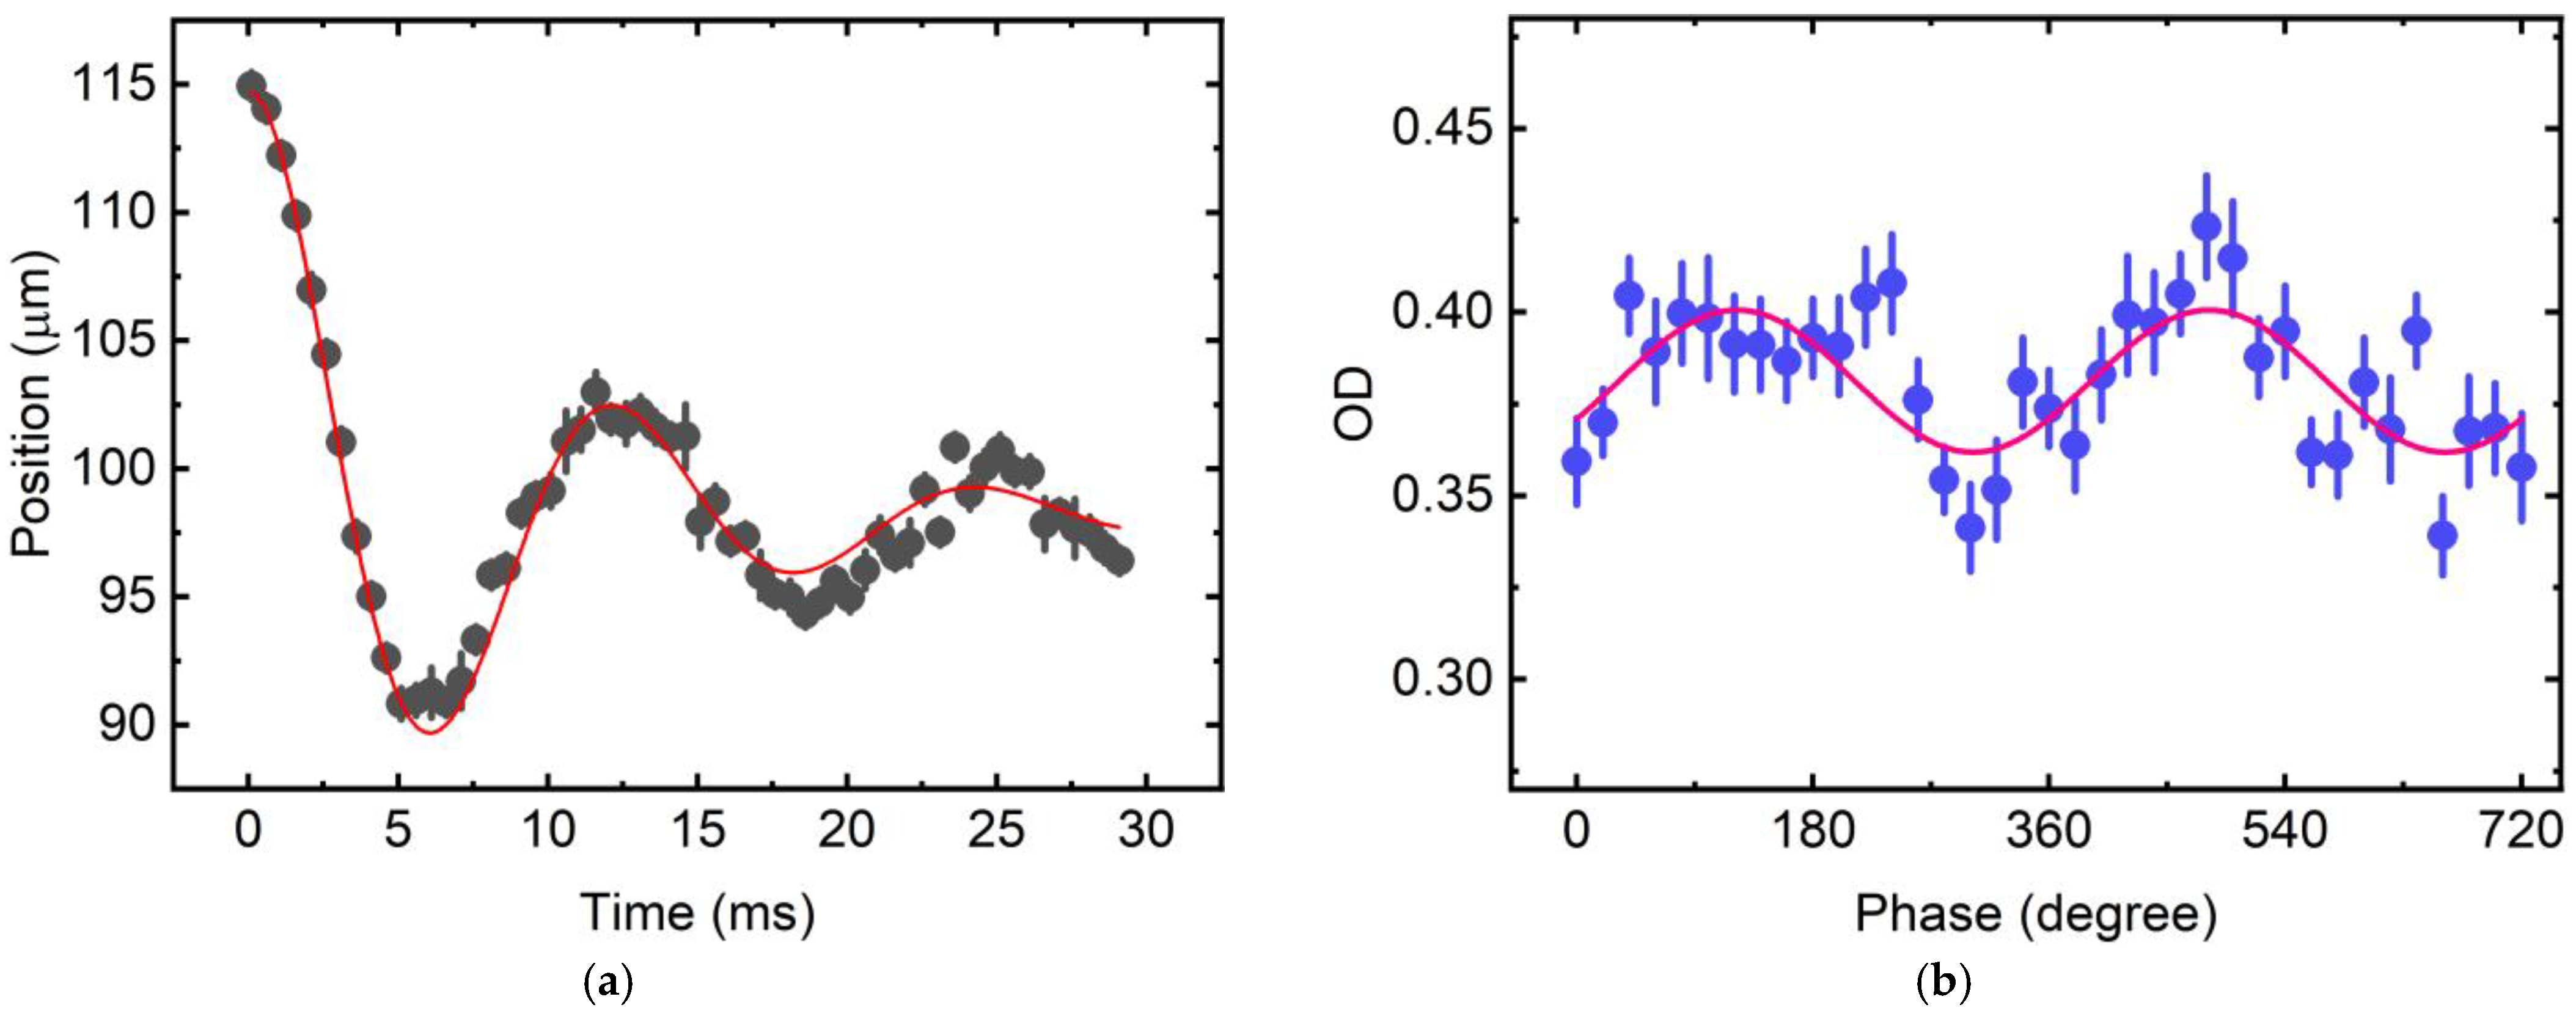
where ωd = (ω2 − γ2)1/2 is the damped angular frequency, and xe is the equilibrium position, shifted from the trap center due to gravitational sag. Figure 5a shows the position of the atoms, measured using absorption imaging on a CCD camera, as a function of oscillation time. The data are fitted to Equation (3), yielding γ = 0.11 ms−1, ωd = 520 rad/s, and xe = 98.1(1) μm. From these parameters, we derive ω0 = 532 rad/s. Using g = 9.78 m/s2, the equilibrium position shift g/ω02 gives a displacement of 34.6 μm for the atoms from the center of the dipole trap.
d2x/dt2 + 2γ(dx/dt) + ω2x = g,
x(t) = e−γt{(x0 − xe)cos(ωdt) + [γ(x0 − xe)/ωd]sin(ωdt)} + xe,
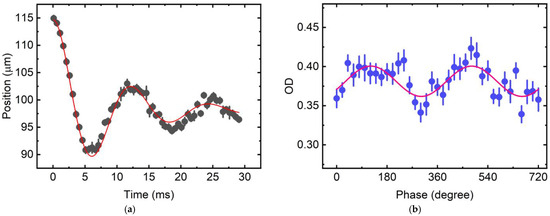
Figure 5.
Experimental realization of a two-dimensional atom interferometer in an optical dipole trap. (a) Oscillation of the atomic cloud along the radial direction of the optical dipole trap. Each data point represents the average of four experimental runs. The position of the atomic cloud is determined by fitting each image captured on a CCD camera with a Gaussian function to extract its center. The red curve represents a fit using Equation (3). The error bars represent the standard error of the mean for four experimental runs. (b) Interference fringes of a double-diffraction Mach–Zehnder atom interferometer obtained by scanning the laser phase of the final beam splitter pulse. The pulse separation time, T = 3.2 ms, is set to match a quarter of the oscillation period. Each data point represents the average of 10 experimental runs. The red curve is a sinusoidal fit to the data. The error bars represent the standard error of the mean for 10 experimental runs.
Two-photon Raman transition beam splitter pulses are applied along the axial direction to form a Mach–Zehnder interferometer configuration. Since EIT cooling encompasses all Zeeman degenerate states, the two Raman beams selectively couple the F = 2, m = 0 and F = 3, m = 0 states, with the aid of an external magnetic field of 1 G to lift the degeneracy.
For the initially motionless atoms, the duration of the first pulse, τs = 45 μs, is chosen to split the atomic wave packet into momentum states ±2ħk [18,19], where ħ is the reduced Planck constant and k is the effective wave number. After a free evolution time T, a mirror pulse with duration τm = 90 μs is applied to reverse the atoms’ momentum, and a final beam splitter pulse completes the interferometer.
Throughout the entire sequence, the atoms remain in the same internal state, effectively suppressing noise from the trap and magnetic field. The transverse motion of the atoms is introduced by offsetting their position in the trap, achieved by adjusting the vertical alignment of the trapping potential.
We detect the population of atoms in the F = 3 state using absorption imaging and calculate OD, which is proportional to the atom number. Figure 5b shows an interference fringe as a function of the phase of the final interferometer pulse, with T = 3.2 ms. The poor fit of the data is due to the decoherence of the radial motion. The Raman beams are generated by a pair of phase-locked distributed Bragg reflector (DBR) lasers at 795 nm. These lasers operate in a free-running mode and are tuned 20 GHz detuned from the 85Rb D1 transition. The beams co-propagate with the same polarization and are retro-reflected through a quarter-wave plate, ensuring that only counter-propagating pairs with orthogonal polarization excite the two-photon Raman transitions. Under these conditions, the effective two-dimensional area enclosed by the interferometer is kinematically determined to be 1396 μm2.
3. Discussion and Conclusions
The quantum control of neutral atoms in optical potentials, modeled as quantum harmonic oscillators, offers a significant advantage over charged particles by enabling the simultaneous trapping of a large number of atoms. However, the inherent anharmonicity of optical traps limits coherence and constrains the number of accessible vibrational states. One potential solution involves modulating the position and amplitude of the optical beams at a frequency faster than the trapping frequency, effectively “painting” a quadratic potential. This approach could be implemented by using acousto-optic modulators to dynamically scan the lateral position of Gaussian beams. Alternatively, stationary quadratic potentials can be implemented using spatial light modulators, which do not depend on the temporal dynamics of the trap. In optical lattices, the cosine-squared potential formed by counter-propagating beams can also be modulated by varying the relative phase between the two beams.
To achieve an ideal two-arm atom interferometer in the Lamb–Dicke regime, ultra-fast pulse trains have been successfully implemented in trapped ion systems [9,16]. These pulse trains act as beam splitter operators, transferring momentum and inducing spin flips to a single state with high fidelity. For this to work, the pulse bandwidth must exceed the energy separation between the two interferometer states, and the pulse train duration must be significantly shorter than the trapping period. For alkali atoms with typical hyperfine qubit energy gaps in the GHz range, sub-nanosecond pulses are required. Such pulses can be generated using electro-optic modulators.
Compared to charged particles, the control of the mechanical motion of neutral atoms in optical harmonic potentials remains relatively underexplored. The studies presented here provide complementary insights into existing research, offering a foundation for advancing applications in quantum sensing and quantum computing. By exploring these control techniques, we aim to open new directions for enhancing coherence and expanding the functionality of neutral atom-based quantum systems.
Author Contributions
Conceptualization, M.X., W.S.L., Z.C. and S.-Y.L.; methodology, M.X., W.S.L., Z.C. and S.-Y.L.; investigation, M.X., W.S.L., Z.C. and S.-Y.L.; data curation, M.X. and W.S.L. writing—original draft preparation, S.-Y.L.; writing—review and editing, M.X., W.S.L., Z.C. and S.-Y.L.; funding acquisition, S.-Y.L. All authors have read and agreed to the published version of the manuscript.
Funding
This research was funded by the Singapore National Research Foundation (Grant No. NRF2021-QEP2-03-P01), the 2030 Cross-Generation Young Scholars Program of the National Science and Technology Council of Taiwan (Grant No. 112-2628-M-002-013-), the Yushan Fellow Program of the Ministry of Education of Taiwan (Grant No. NTU-113V1028-2), and the National Taiwan University Higher Education Sprout Project (Grant Nos. NTU-114L791001 and 113L7865).
Data Availability Statement
The data supporting the findings of this study are not publicly available at this time, but can be obtained from the authors upon reasonable request.
Conflicts of Interest
The authors declare no conflicts of interest.
References
- Anderson, M.H.; Ensher, J.R.; Matthews, M.R.; Wieman, C.E.; Cornell, E.A. Observation of Bose-Einstein condensation in a dilute atomic vapor. Science 1995, 269, 198–201. [Google Scholar] [PubMed]
- Greiner, M.; Mandel, O.; Esslinger, T.; Hänsch, T.W.; Bloch, I. Quantum phase transition from a superfluid to a Mott insulator in a gas of ultracold atoms. Nature 2002, 415, 39–44. [Google Scholar] [PubMed]
- Ye, J.; Kimble, H.J.; Katori, H. Quantum State Engineering and Precision Metrology Using State-Insensitive Light Traps. Science 2008, 320, 1734–1738. [Google Scholar] [CrossRef] [PubMed]
- Saffman, M.; Walker, T.G.; Mølmer, K. Quantum information with Rydberg atoms. Rev. Mod. Phys. 2010, 82, 2313. [Google Scholar] [CrossRef]
- Panda, C.D.; Matthew, T.; Egelhoff, J.; Ceja, M.; Xu, V.; Müller, H. Coherence limits in lattice atom interferometry at the one-minute scale. Nat. Phys. 2024, 20, 1234–1239. [Google Scholar]
- Krzyzanowska, K.A.; Ferreas, J.; Ryu, C.; Samson, E.C.; Boshier, M.G. Matter-wave analog of a fiber-optic gyroscope. Phys. Rev. A 2023, 108, 043305. [Google Scholar] [CrossRef]
- Moan, E.R.; Horne, R.A.; Arpornthip, T.; Luo, Z.; Fallon, A.J.; Berl, S.J.; Sackett, C.A. Quantum Rotation Sensing with Dual Sagnac Interferometers in an Atom-Optical Waveguide. Phys. Rev. Lett. 2020, 124, 120403. [Google Scholar] [PubMed]
- Campbell, W.C.; Hamilton, P. Rotation sensing with trapped ions. J. Phys. B 2017, 50, 064002. [Google Scholar] [CrossRef]
- Shinjo, A.; Baba, M.; Higashiyama, K.; Saito, R.; Mukaiyama, T. Three-Dimensional Matter-Wave Interferometry of a Trapped Single Ion. Phys. Rev. Lett. 2021, 126, 153604. [Google Scholar] [CrossRef] [PubMed]
- Huang, C.; Chai, S.; Lan, S.-Y. Dark-state sideband cooling in an atomic ensemble. Phys. Rev. A 2021, 103, 013305. [Google Scholar]
- Xin, M.; Leong, W.S.; Chen, Z.; Wang, Y.; Lan, S.-Y. Fast quantum gas formation via electromagnetically induced transparency cooling. Nat. Phys. 2025, 21, 63–69. [Google Scholar] [CrossRef]
- Leong, W.S.; Xin, M.; Chen, Z.; Chai, S.; Wang, Y.; Lan, S.-Y. Large array of Schrödinger cat states facilitated by an optical waveguide. Nat. Commun. 2020, 11, 5295. [Google Scholar] [PubMed]
- Leong, W.S.; Xin, M.; Chen, Z.; Wang, Y.; Lan, S.-Y. Creation of Two-Mode Squeezed States in Atomic Mechanical Oscillators. Phys. Rev. Lett. 2023, 131, 193601. [Google Scholar] [CrossRef] [PubMed]
- Xin, M.; Leong, W.S.; Chen, Z.; Wang, Y.; Lan, S.-Y. Rapid quantum squeezing by jumping the harmonic oscillator frequency. Phys. Rev. Lett. 2021, 127, 183602. [Google Scholar] [CrossRef] [PubMed]
- Sapiro, R.E.; Zhang, R.; Raithel, G. Atom interferometry using Kapitza-Dirac scattering in a magnetic trap. Phys. Rev. A 2009, 79, 043630. [Google Scholar]
- Mizrahi, J.; Senko, C.; Neyenhuis, B.; Johnson, K.G.; Campbell, W.C.; Conover, C.W.S.; Monroe, C. Ultrafast Spin-Motion Entanglement and Interferometry with a Single Atom. Phys. Rev. Lett. 2013, 110, 203001. [Google Scholar] [CrossRef] [PubMed]
- Burke, J.H.T.; Sackett, C.A. Scalable Bose-Einstein-condensate Sagnac interferometer in a linear trap. Phys. Rev. A 2009, 80, 061603(R). [Google Scholar]
- Lévèque, T.; Gauguet, A.; Michaud, F.; Pereira Dos Santos, F.; Landragin, A. Enhancing the Area of a Raman Atom Interferometer Using a Versatile Double-Diffraction Technique. Phys. Rev. Lett. 2009, 103, 080405. [Google Scholar] [PubMed]
- Malossi, N.; Bodart, Q.; Merlet, S.; Lévèque, T.; Landragin, A.; Pereira Dos Santos, F. Double diffraction in an atomic gravimeter. Phys. Rev. A 2010, 81, 013617. [Google Scholar]

Disclaimer/Publisher’s Note: The statements, opinions and data contained in all publications are solely those of the individual author(s) and contributor(s) and not of MDPI and/or the editor(s). MDPI and/or the editor(s) disclaim responsibility for any injury to people or property resulting from any ideas, methods, instructions or products referred to in the content. |
© 2025 by the authors. Licensee MDPI, Basel, Switzerland. This article is an open access article distributed under the terms and conditions of the Creative Commons Attribution (CC BY) license (https://creativecommons.org/licenses/by/4.0/).