Article

Evaluation of Spatial Profile of Local Emissions from W17+–W23+ Unresolved Transition Array Spectra

1
Department of Quantum Science and Energy Engineering, Tohoku University, Sendai 980-8579, Japan
2
National Institute for Fusion Science, National Institutes of Natural Sciences, Toki 509-5292, Japan
3
The Graduate University for Advanced Studies, SOKENDAI, Toki 509-5292, Japan
4
Interdisciplinary Graduate School of Engineering Sciences, Kyusyu University, Kasuga 816-8580, Japan
5
Institute of Liberal Arts and Sciences, University of Toyama, Toyama 930-8555, Japan
6
Institute of Space and Plasma Sciences, National Cheng Kung University, Tainan 70101, Taiwan
*
Author to whom correspondence should be addressed.
Atoms 2025, 13(2), 21; https://doi.org/10.3390/atoms13020021
Submission received: 26 December 2024 / Revised: 10 February 2025 / Accepted: 12 February 2025 / Published: 18 February 2025
(This article belongs to the Section Atomic, Molecular and Nuclear Spectroscopy and Collisions)

Abstract

:
Tungsten (W) spectroscopy has attracted significant attention because W is one of the major impurities in ITER and future DEMO reactors. W22+–W33+ spectra at 15–45 Å have been useful for impurity diagnostics. Unresolved Transition Array (UTA) spectra around 200 Å, which contain W17+–W23+, have potential for diagnostics tungsten ions in even lower charge states. Because multiple charge states overlap with very similar wavelengths, it is challenging to evaluate impurity spatial profiles from UTA spectra around 200 Å. In this study, we conducted tungsten pellet injection experiments in Large Helical Device (LHD) and attempted to evaluate the spatial profiles of UTA spectra around 200 Å, observed at 0.3–0.8 keV of central electron temperature. The results indicated that tungsten ions around W20+ were locally profiled in a radial region, reff = 0.38 m, where the local electron temperature decreases by 30% to 40% with respect to more central and outer temperatures. These results suggested that the UTA spectrum around 200 Å would be useful for diagnostics of tungsten impurities in lower charge states than the charge states contained in UTA spectra around 15–45 Å.

1. Introduction

Tungsten (W) is planned for use as a plasma-facing component in the divertor and first wall of ITER [1] and future demonstration (DEMO) [2] reactors. Tungsten, one of the major impurity species released from metal surfaces, can penetrate high-temperature plasma. In such cases, a large amount of plasma-stored energy is lost through ionization, excitation, and radiation. Thus, it is essential to measure tungsten impurities for steady-state operation without impurity accumulation.
Tungsten impurities are distributed as charged ions in fusion plasma with extremely low charge states in the divertor, low-to-intermediate charge states in the edge plasma, and highly charged states in the core plasma.
Spectroscopic measurements are useful for determining the ionization balance and spatial profiles of W impurities. Emission lines from tungsten impurities have been observed in tokamaks [3,4,5,6,7,8], and also in stellarators [9,10,11]. These studies have contributed to our understanding of the behavior of tungsten impurities in magnetically confined plasma.
However, tungsten spectral data remain limited, especially for W8+–W26+ in the Atomic Spectra Database of the National Institute of Standards and Technology (NIST-ASD) [12,13]. In order to accumulate tungsten spectral data, Electron Beam Ion Trap (EBIT) measurements were conducted [14,15,16]. The spectra of ions in specifically charged states were observed in the EBIT device. In addition, collisional-radiative modeling (CRM) was carried out [17,18]. By comparing the results of EBIT and CRM, atomic processes such as the transition, collisional strengths, electron impact (de)excitation, ionization, and recombination can be identified. In recent years, spectroscopic studies on tungsten ions in low-to-intermediate charge states have attracted significant attention. For example, Pm-like W13+ [19], In-like W25+, and Sn-like W24+ [20] have been successfully identified. In our previous study, an Unresolved Transition Array [21,22,23] (UTA) spectrum from W17+–W25+ around 200 Å was observed in the Large Helical Device (LHD) and Compact EBIT (CoBIT) device [24], and identified using CRM on Flexible Atomic Code (FAC) [25], as well as a UTA spectrum around 300 Å [26,27]. It is very important to experimentally evaluate the spatial profile of tungsten ions around W20+, because it allows us to verify the radiation power distribution, and impurity transport, such as the tungsten screening effect, in the edge plasma. The purpose of this study is to describe a method for experimentally evaluating the impurity spatial profile, and to evaluate the spatial profile of tungsten ions around W20+ from UTA spectrum around 200 Å. This is expected to be useful for diagnosing ions in low-to-intermediate charge states that are difficult to measure because of the lack of spectral data.

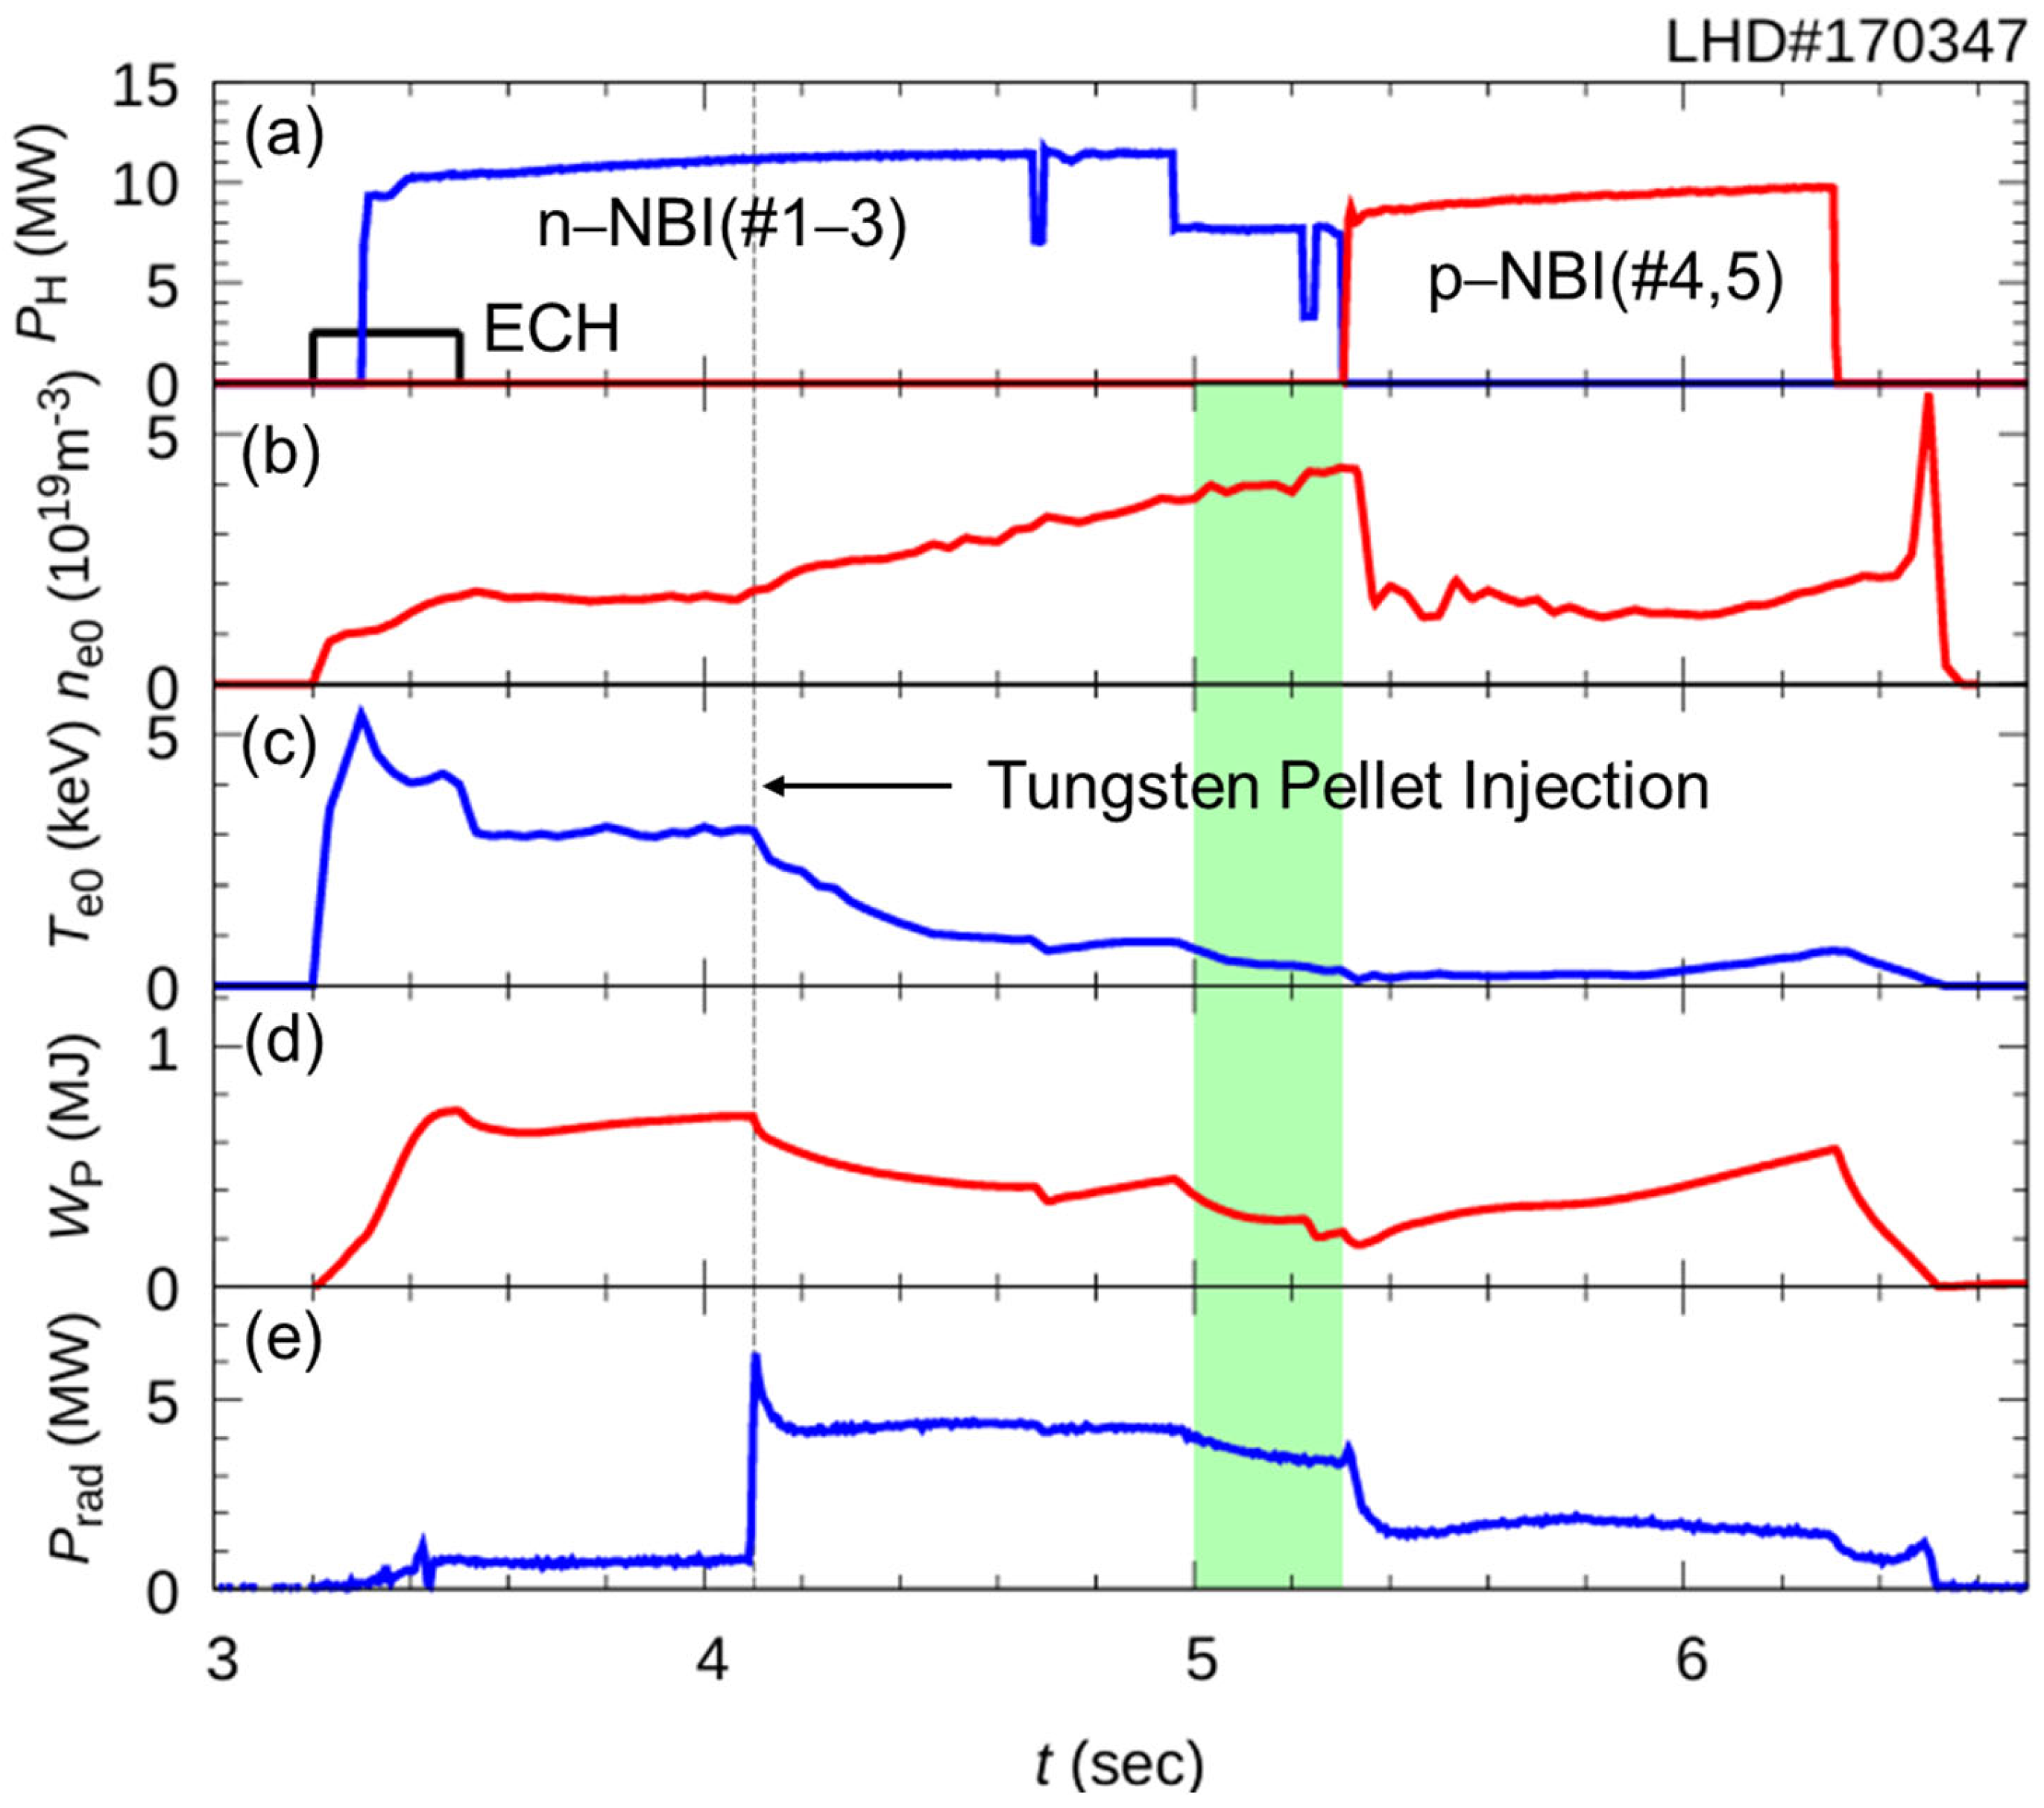
2. Experimental Setup

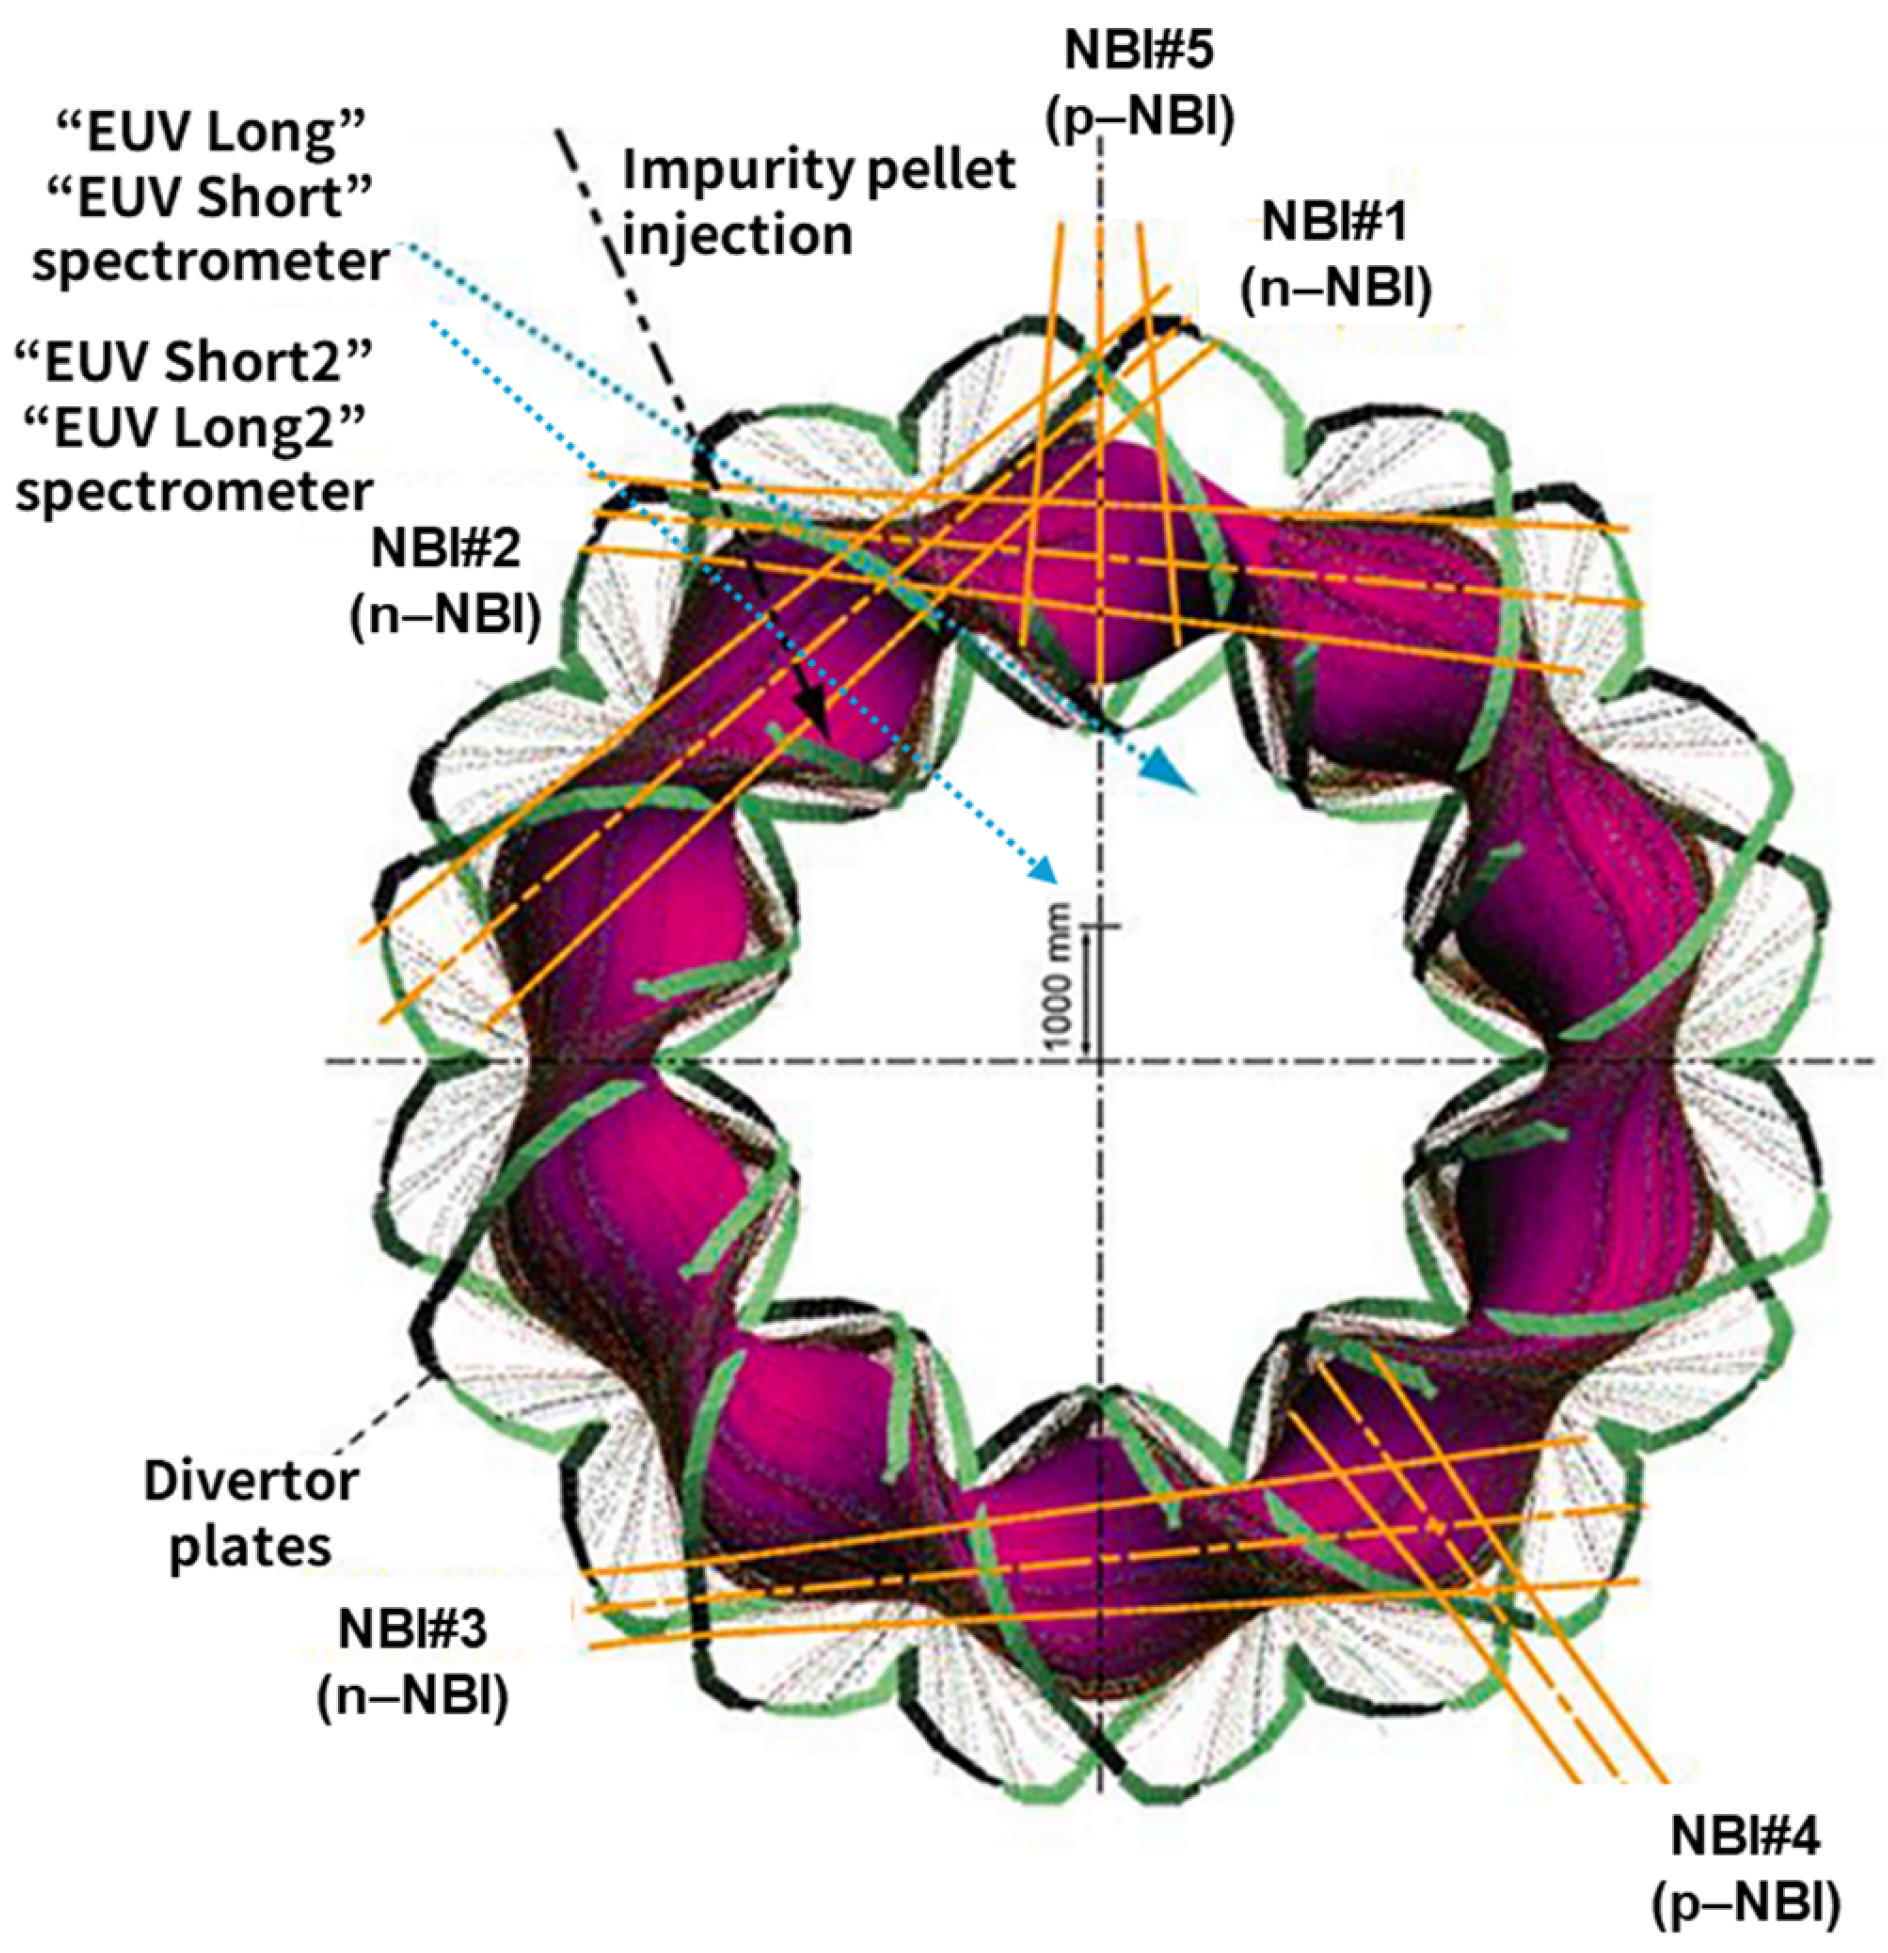
2.1. Large Helical Device and Measurement System

The tungsten pellet injection experiments were conducted in LHD [28]. The experimental scheme is shown in Figure 1. Five Neutral Beam Injection (NBI) systems were used to heat the plasma.
In Figure 1, n-NBI(#1–3) and p-NBI(#4,5) represent the negative and positive ion source NBI, respectively. A tungsten pellet was injected at t = 4.1 s. Figure 2a–e show the discharge waveforms of the plasma heating power PH, central electron density ne0, central electron temperature Te0, plasma stored energy WP, and radiation power Prad, respectively, where ne0 and Te0 were measured using the Thomson scattering system [29], and Prad was measured using a bolometer [30].
Plasma was initiated by Electron Cyclotron Heating (ECH) and maintained at ne0 = 2 × 10¹⁹ m−3 and Te0 = 3 keV by n-NBI heating. A tungsten pellet was injected at t = 4.1 s. Prad abruptly increased, and then stabilized at a high level because of the radiation of tungsten impurities, whereas Wp gradually decreased. The parameter ne0 increased from 2 × 10¹⁹ m−3 to 4 × 10¹⁹ m−3, whereas Te0 decreased from 3 keV to a few hundred eV at t = 4.1–5.3 s. In the tungsten pellet injection experiments, emissions from highly charged tungsten ions were first observed, followed by emissions from lower-charged states as the electron temperature decreased. Emissions from W17+–W25+ were observed at t = 5.00–5.30 s, where Te0 was 0.8–0.3 keV.

2.2. Space-Resolved Spectroscopic System in EUV Wavelength

Two space-resolved spectrometers, called “EUV Short2” and “EUV Long2” [31,32] were used to evaluate the spatial profile of tungsten impurities. Both spectrometers had an entrance slit, spatial-resolution slot, varied-line-spacing holographic grating, and CCD detector with 1024 × 255 pixels and a pixel size 26 × 26 μm2. In fact, the pixels of the CCD were binned, and 204 × 128 channels (CHs) were available along the space and wavelength directions. The groove densities of the varied-line-spacing holographic gratings for the EUV Short2 and EUV Long2 spectrometers were 2400 and 1200 grooves/mm, respectively. The observable wavelength ranges of EUV Short2 and EUV Long2 were 5–130 and 30–650 Å, respectively. In this study, the wavelength ranges were set to 24.2–37.8 and 183.7–234.3 Å. The interval time for obtaining the spectra was 100 ms, of which approximately 61.21 ms was allocated for exposure and the rest for data processing.
In this study, the magnetic axis and toroidal magnetic field strength were set at a major radius of R = 3.6 m and Bt = 2.75 T (clockwise in the top view). The spatial profile of the effective minor radius reff and line of sight of EUV Short2 and EUV Long2 are shown in Figure 3. Here, reff is defined by an equation, S = πreff2, where S is the averaged area of the poloidal cross-section along the toroidal angle.

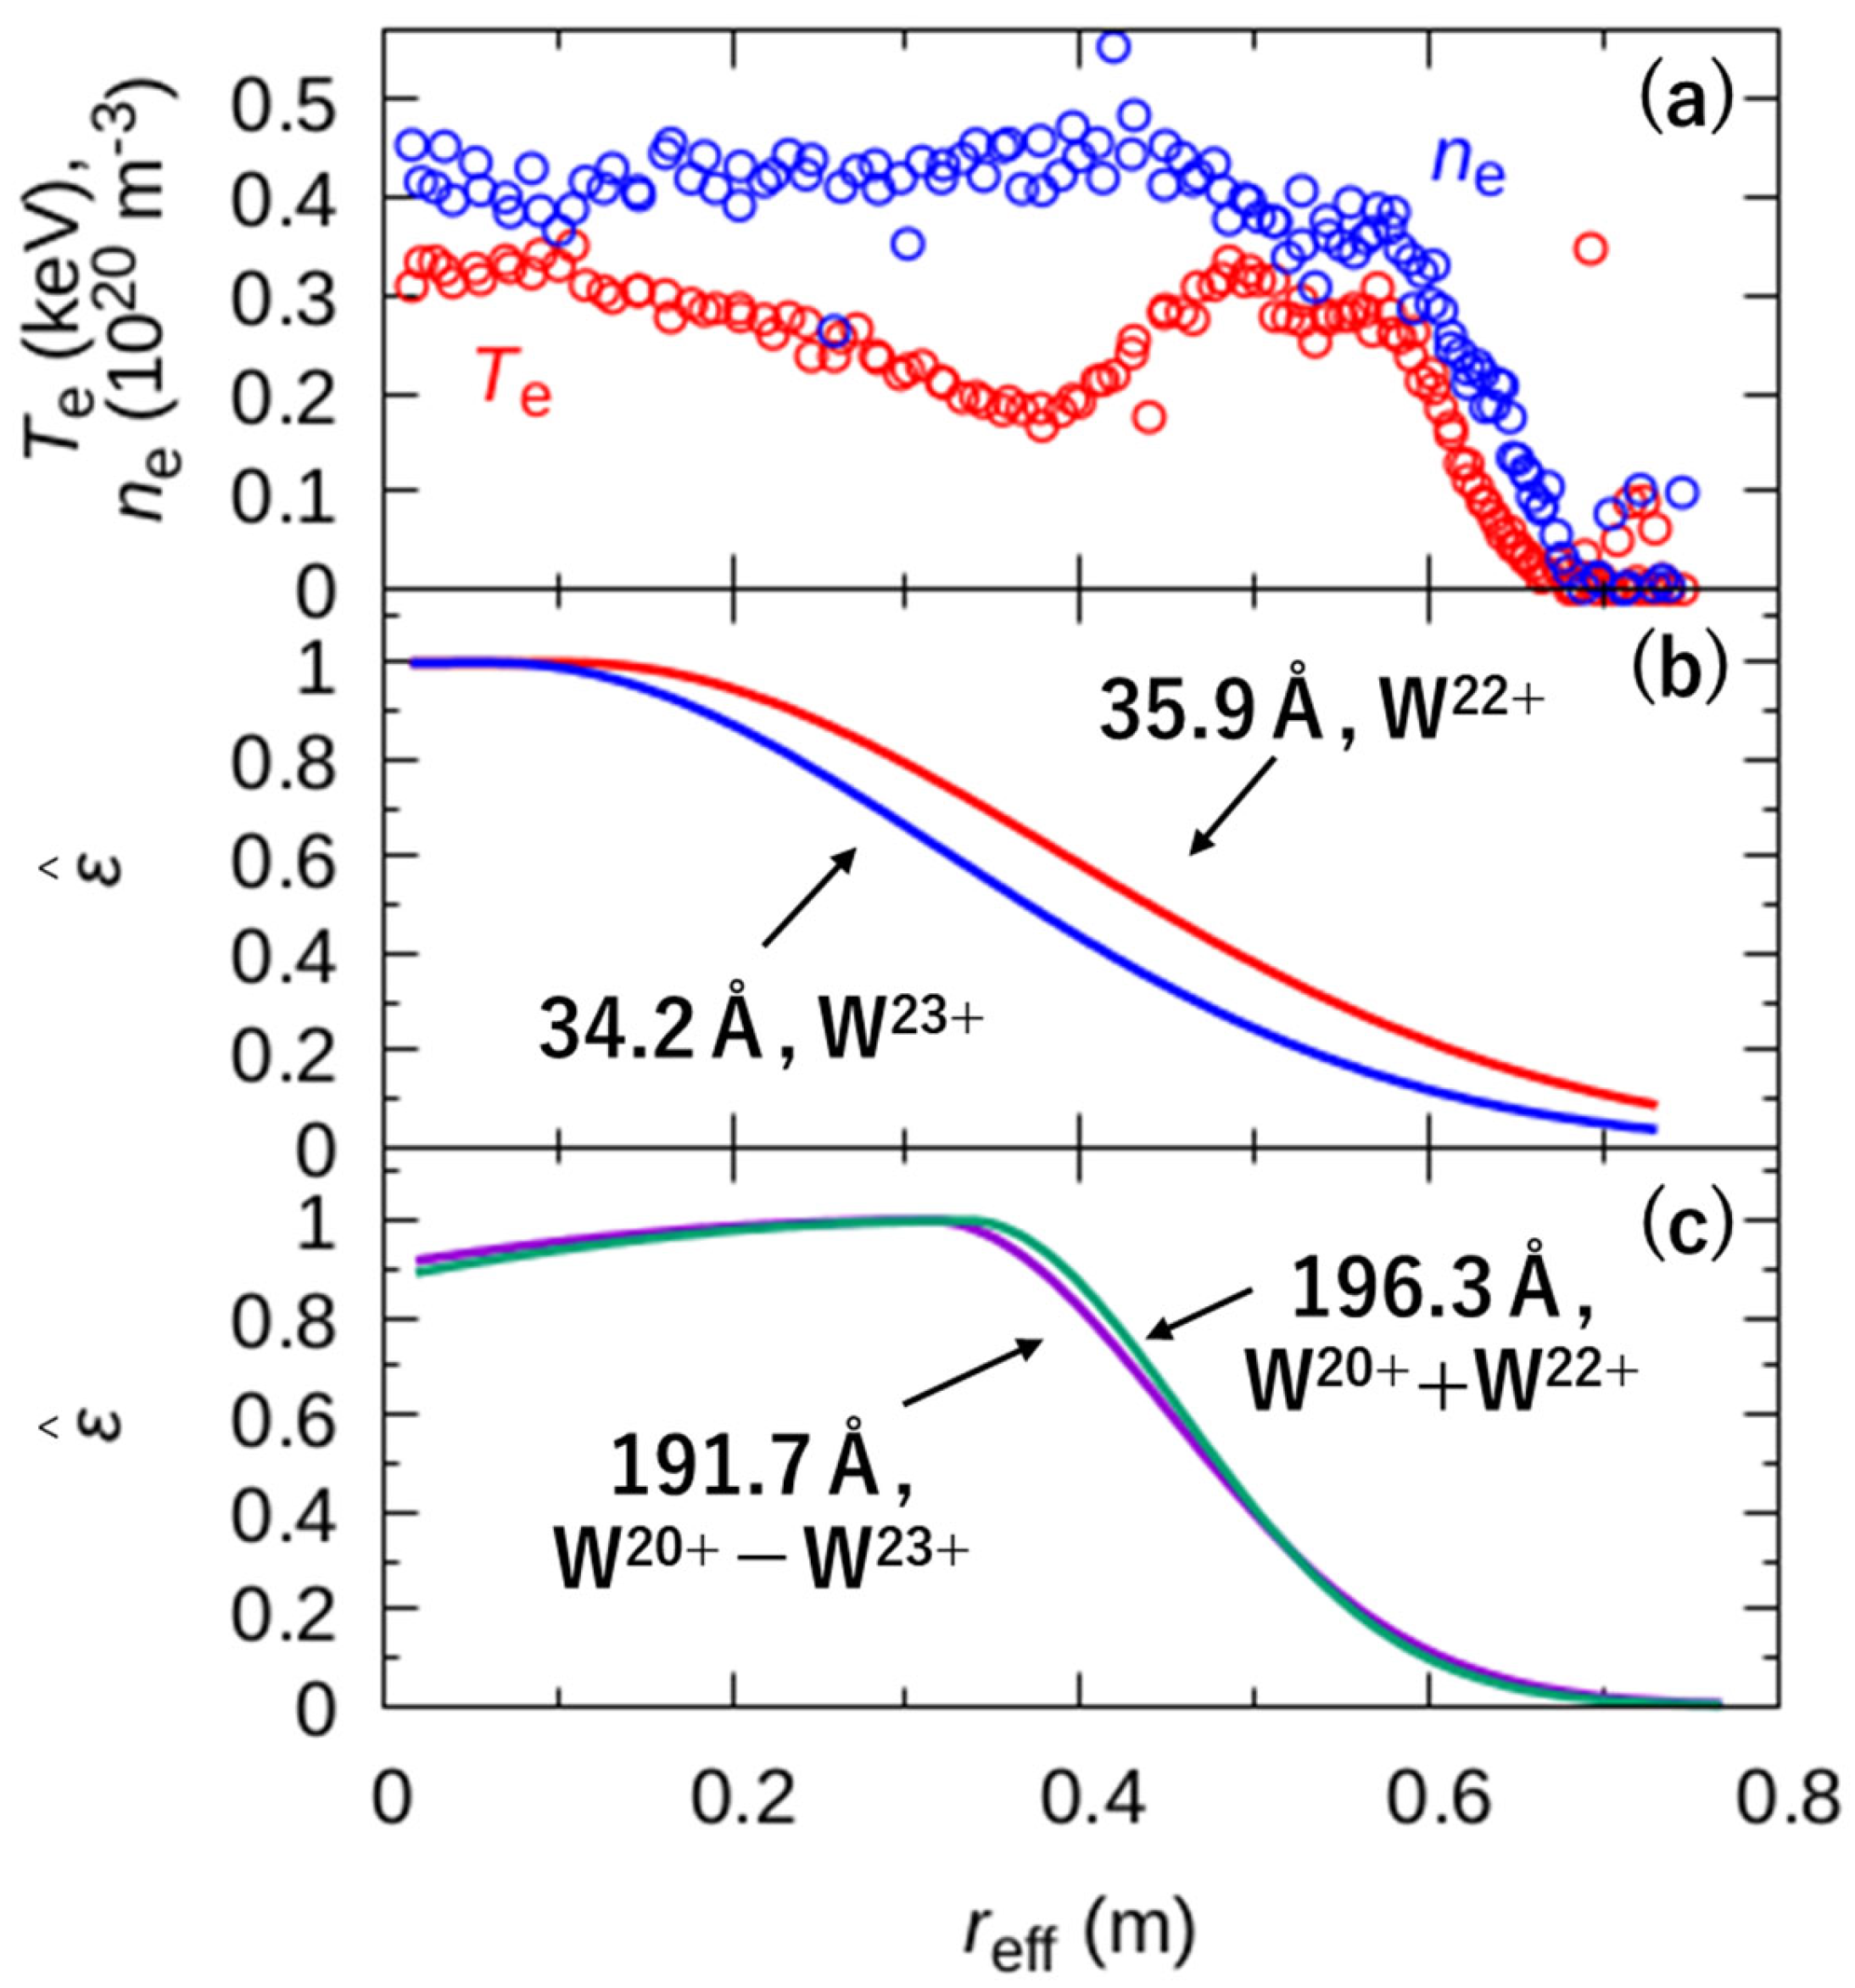
2.3. Method to Evaluate Impurity Spatial Profile

A space-resolved spectrometer was used to observe the line-integrated intensity along the line of sight. The spatial profile of the local emissivity for tungsten was obtained using a line-integrated intensity profile. An inverse Abel transform [33,34,35] has been used to obtain the local emissivity from the line-integrated intensity. However, as the inverse Abel transform typically assumes axisymmetry, it is unsuitable for the non-axisymmetric geometry of LHD. This section describes the method for evaluation of the local emissivity profile of LHD.
Generally, the local ionic state strongly depends on the electron temperature Te and electron density ne, and it is assumed that the local emissivity is a function of Te and ne. This implies that the local emissivity can be defined on a magnetic surface with the same Te and ne. The principle for evaluation of the local emissivity is shown in Figure 4.
Here, I j and ε k are the line-integrated intensity along the line of sight # j   ( j = 1 204 ) and local emissivity on the magnetic surface   # k   ( k = 1 204 ) , respectively. And L j k is the length along which line of sight # j passed the magnetic surface # k . For j = k , L j k is the length of the dark arrow in Figure 4. On the other hand, for j k , L j k is expressed as
L j k = L j k + L j k         j k .
In many cases, the values of L j k and L j k are different, because of the Shafranov shift. Therefore, L j k was obtained by numerical calculations using the measurements shown in Figure 3. Then, I j is expressed as
I = L ε               I 1 I 2 I 3 I N = L 11 0 0 0 L 21 L 22 0 0 L 31 L 32 L 33 0 0 L N 1 L N 2 L N 3 L N N × ε 1 ε 2 ε 3 ε N .
The component of matrix L, Ljk, is shown in Figure 5.
A line of sight passes along the length of a specific magnetic surface. Thus, the local emissivity of a specific magnetic surface can be evaluated.
Typically, Gaussian distribution is used to determine the functional shape of a local emissivity profile [36,37]. In addition, Demura et al. reported that the fractional abundance would be Gaussian for high-Z elements, such as tungsten, in Te < 10 keV [38]. On the other hand, it is suggested that the functional shape is a non-symmetric Gaussian from a spatial profile of W24+ of 32.28–32.39 Å [39]. Thus, a non-symmetric Gaussian distribution was used in this study. The non-symmetric Gaussian distribution is expressed as
ε ( r e f f ) = exp r e f f r c Δ r i n 2 ,           f o r   r e f f < r c exp r e f f r c Δ r o t 2 ,         f o r   r e f f r c
where rc, Δrin, and Δrot are the profile center and function broadenings for inner and outer rc, respectively. The parameters rc, Δrin, and Δrot were determined using numerical calculations so that the cross-correlation coefficient, α , between observed line-integrated intensity and calculated line-integrated intensity is greater than 99.5%. The typical results of the calculated local emissivity, experimentally observed line-integrated intensity, and evaluated line-integrated intensity profiles are shown in Figure 6a,b.
In Figure 6b, there is a region around reff = 0.6 m where the measured profile cannot be reproduced. This may be due to the tungsten ions localized in the edge plasma. Although a tiny signal was observed at reff = 0.5–0.6 m, it was difficult to determine whether the signal was from the emission of tungsten or other signals, such as bremsstrahlung, or emissions from other impurities. However, this was neglected in this study because the emission intensity was relatively low compared to the intensity of reff < 0.5 m.

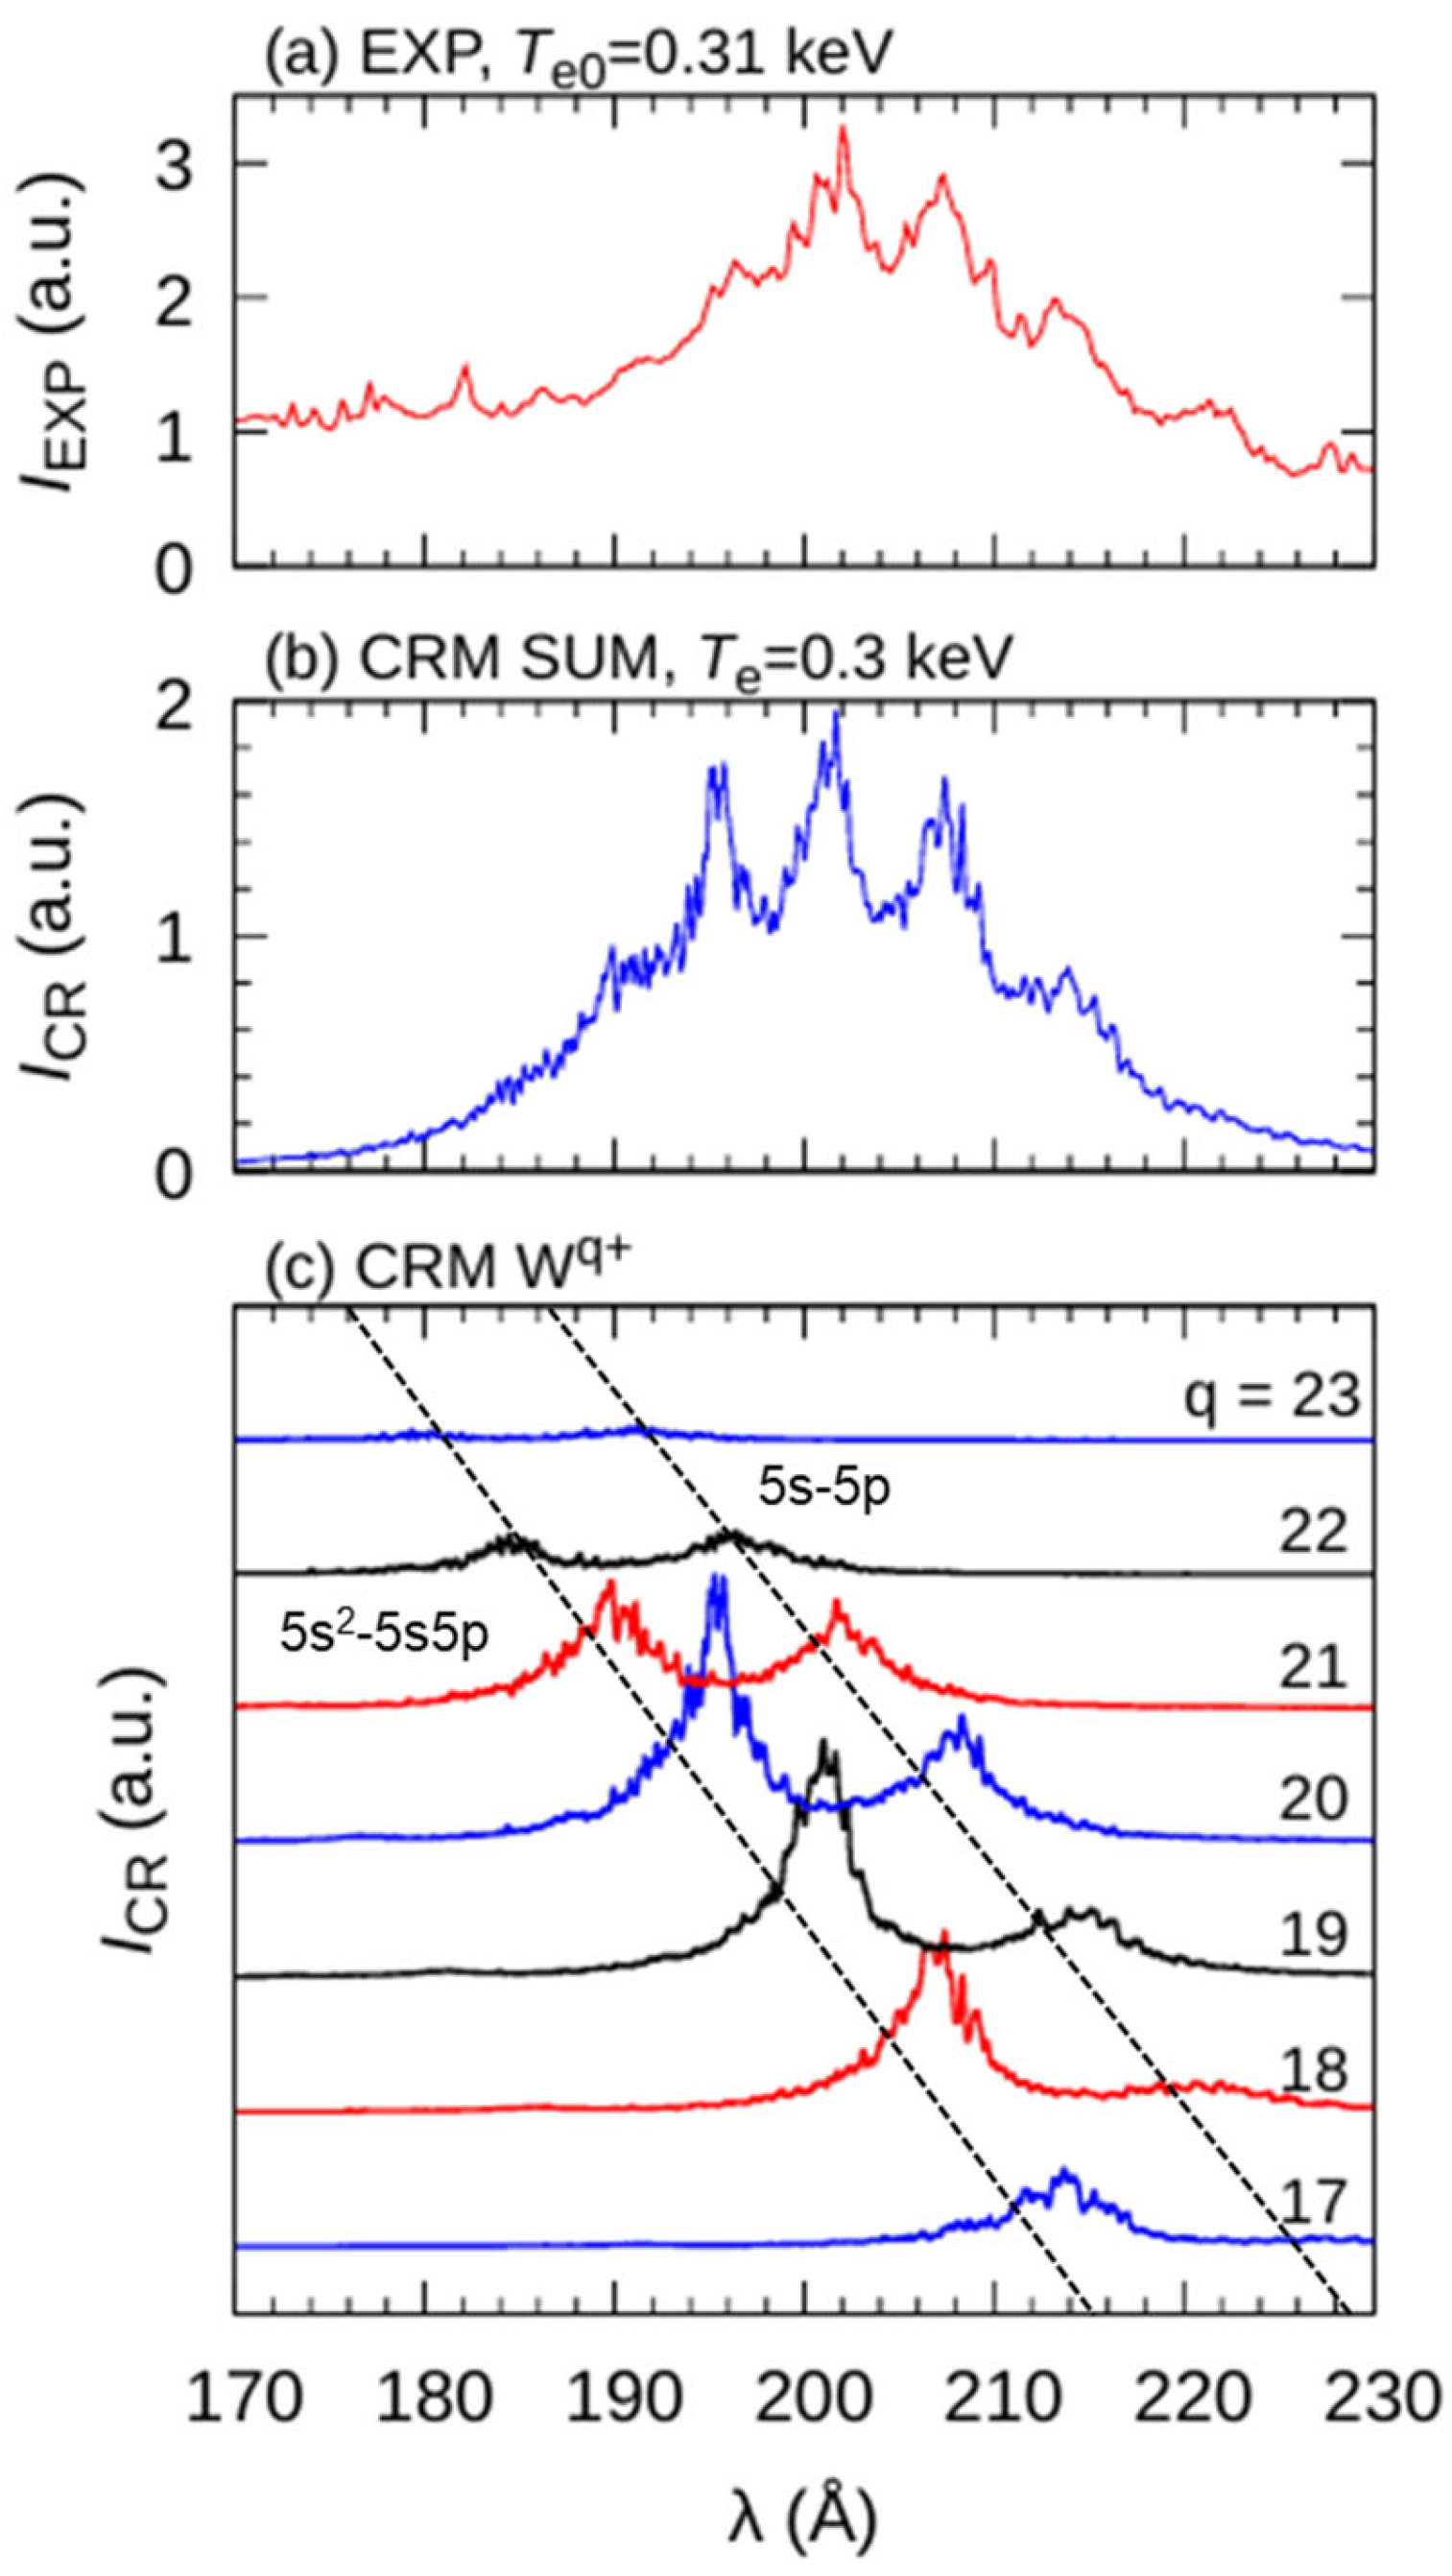
3. Results and Discussion

The UTA spectrum around 200 Å contains line emissions from multiple states with very similar wavelengths. The structure of the UTA spectrum around 200 Å is shown in Figure 7a–c.
Here, the detector readout noise was subtracted in Figure 7a. The bremsstrahlung component was included in the observed EUV spectrum. Although the intensity of Bremsstrahlung depends on the wavelength, the level is much smaller than the intensity of tungsten ions. Therefore, the effect of bremsstrahlung on the analysis of the tungsten spatial profile was neglected. The spectra shown in Figure 7b,c were calculated using FAC [25], including electron collision excitation, de-excitation, and ionization between the 4fm (m = 11–5), 4fm−1 5l (l = 0–3), 4d9 4fm 5s, 4d9 4fm+1, 4fm−2 5s2/5s5p/5p2/5s5d, and 4fm−1 configurations. Quasi-continuum peaks around 192, 197, 201, 207, 213, and 221 Å contain 5s-5p and 5s2-5s5p emissions from several charge states. The transition wavelengths of 5s-5p and 5s2-5s5p shift towards longer wavelengths with decreasing charge states. It is necessary to verify whether the spatial distribution of tungsten ions can be evaluated from the UTA spectra of such complex structures.
The measured space-resolved spectra of 23.6–38.0 Å and 183.7–234.3 Å are shown in Figure 8a,b.
Here, the horizontal label, ZR3600, in Figure 8a,b, means the vertical location of the observation chord at the major radius of 3600 mm. Emissions from W22+ at 35.9 Å (4f-5g), W23+ at 34.2 Å (4f-5g), and W24+ at 32.6 Å (4f-5g) were observed using the EUV Short2 spectrometer. No clear emission lines from ions below W22+ were observed at λ = 23.8–38.0 Å. Emissions from W20+–W23+ (W20+(5s2-5s5p)+W21+(5s-5p, 5s2-5s5p)+ W22+(5s-5p, 5s2-5s5p)+W23+(5s-5p)), W20+(5s2-5s5p)+W22+(5s-5p), W19+(5s2-5s5p)+W21+(5s-5p), W18+(5s2-5s5p)+W20+(5s-5p), W17+(5s2-5s5p)+W19+(5s-5p), and W16+(5s2-5s5p)+W18+(5s-5p) were observed at λ = 191.7, 196.3, 201.0, 207.3, 213.3, and 221.4 Å, respectively, using the EUV Long2 spectrometer. A quasi-continuum peak included in the UTA spectrum around 200 Å consists of emission lines from 5s-5p and its satellite line from 5s2-5s5p of different charge states, in addition to 5p-5d transitions [26]. Emissions from the 5s-5p and 5p-5d transitions have been experimentally observed in EBIT device [24]. The intensity from 5p-5d was relatively small. For the spectrum around 200 Å, emission lines from 5s25s5p have not yet been directly observed in plasma and EBIT devices. The transition wavelengths of 5s-5p and 5s2-5s5p lines are very close. In plasma, because multiple charge states are included, it may be difficult to separate the 5s-5p and 5s2-5s5p lines. This means that it would be difficult to obtain a spatial profile of tungsten ions in separated charge states from a 200 Å spectrum. Therefore, the effect of the 5s2-5s5p line on the tungsten spatial profile must be revealed. For that purpose, W22+ and W23+ spectra at 34.2 and 35.9 Å are useful, because the spatial profiles of separated charge states can be evaluated from these spectra. By comparing the spatial profiles of two UTA spectra around 15–45 and 200 Å, the difference in peak position and broadening of the profiles will be revealed. The UTA spectrum around 15–45 Å would include ions in lower charge states than W22+ [15,18]. However, no peaks were observed in LHD because of very low intensity and overlap with C and O lines. We first evaluated the spatial profiles of the 34.2 and 35.9 Å lines and the 191.7, 196.3 Å lines. Figure 9 shows the electron temperature and electron density profile measured by Thomson scattering and the evaluated local emissivity of 34.2, 35.9 Å lines, and the 191.7, 196.3 Å lines. The local emissivity profiles were normalized such that a maximum value of 1 was achieved.
The local emissivity profiles of W22+ and W23+ evaluated from Figure 8a peak at the plasma center, with W22+ slightly distributed on the outer side. However, the local emissivity profiles of W20++W22+ and W20+–W23+ peak around reff = 0.35 m, and are more widely distributed in the plasma than the profiles at 34.2 and 35.9 Å. This means that the peak position and broadening of 196.3 and 191.7 Å profiles are thought to have shifted toward reff = 0.4 m, where the electron temperature locally decreased, due to the inclusion of multiple charged states with very close wavelengths.
Finally, the local emissivity profiles of 191.7 (W20+–W23+), 196.3 (W20++W22+), 201.0 (W19++W21+), 207.3 (W18++W20+), 213.3 (W17++W19+), and 221.4 (W16++W18+) Å are summarized in Figure 10.
The spatial profiles of 207.3 (W18++W20+), 213.3 (W17++W19+), and 221.4 (W16++W18+) Å are localized around reff = 0.35 m, where the electron temperature is locally lower, while the 191.7 (W20+–W23+), 196.3 (W20++W22+), and 201.0 (W19++W21+) Å profiles are broadly distributed at reff = 0–0.35 m. This suggests that the tungsten impurity density is relatively high, at approximately reff = 0.35 m. The local emissivity profiles of 191.7 (W20+–W23+), 196.3 (W20++W22+), 201.0 (W19++W21+), 207.3 (W18++W20+), 213.3 (W17++W19+), and 221.4 (W16++W18+) Å have similar functional shapes, but the spatial broadening of emission lines on the short wavelength side tend to be slightly larger. The profiles of 207.3 (W18++W20+), 213.3 (W17++W19+), and 221.4 (W16++W18+) Å are consistent with the electron temperature profile, which has obvious dips at reff = 0.38 m. Although the UTA spectrum around 200 Å contains multiple charged states with very close wavelengths, we obtained W17+–W23+ profiles with different peak positions and broadenings. Furthermore, the profiles of W17+–W23+ and the observed electron temperature profile are consistent. This means that the UTA spectrum around 200 Å would be useful for diagnostics of tungsten impurities in lower charge states than the charge states contained in UTA spectra around 15–45 Å.
In this study, we evaluated the local emissivity profiles of W17+–W23+. If the charge exchange processes could have been negligible, the ion density profile would be evaluated using reliable Photon Emissivity Coefficient, PEC, as
ε = P E C e x n e n W f q + P E C r e c n e n W f q + 1 .
where P E C e x , P E C r e c , n W , and f q are the PEC of electron collision excitation, recombination, total tungsten density, and fractional abundance. Fractional abundance is determined by the balance of ionization and recombination [40]. Currently, only PECex is still evaluated in the CR model [26,27]. The evaluation of a reliable PEC is a kye issue in ion density diagnostics, n W f q . In addition to PEC, the evaluation of n W is one of the most important issues. For a long time, it has been established that the spatial profile of heavy impurities, such as tungsten, is determined by ionization equilibrium within the existing uncertainties in rate coefficients of ionization and dielectronic recombination [41]. The ratio of ionization rates to recombination rates is the parameter of the ion density profile [42]. In tungsten-contaminated plasma of LHD, n W has been evaluated using visible M1 lines from W26+ and W27+ [37]. The radial profile was evaluated using the STRAHL code [43], a standard diffusive-convective transport model for many impurities, and compared with ionization equilibrium. The two profiles were well matched. In addition, Fujii et al. reported that the fractional abundance ratios evaluated using STRAHL are consistent with the standard diffusive-convection model without transport [36]. Pütterich et al. evaluated the tungsten ionization balance based on ionization equilibrium [44]. These reports assist that the tungsten ions are in ionization equilibrium. On the other hand, Shurygin recently proposed an impurity transport model as an alternative model to the standard diffusive-convective transport model [45]. The Markov Chain Monte Carlo method was applied to source/sink term of ionization and recombination, which is incompatible with the radial dynamics and charge kinetic analysis of impurities. Therefore, the obtained profiles are different from standard diffusive-convective models. These efforts have contributed to the understanding of impurity transport processes. From an experimental standpoint, it is essential to expand the tungsten spectral database to make it useful for diagnostics and to align it with modeling.

4. Conclusions

In this study, tungsten pellet injection experiments were conducted in LHD. Two spatial profiles of UTA spectra around 15–45 Å and 200 Å, which contained W22+–W24+, and W17+–W23+, respectively, were compared. The local emissivity profiles of W22+ and W23+, evaluated from 35.9 and 34.2 Å, had a peak position at the plasma center, reff = 0 m. On the other hand, local emissivity profiles of W16++W18+, W17++W19+, W18++W20+, W19++W21+, W20++W22+, and W20+–W18+, evaluated at 221.4, 213.3, 207.3, 201.0, 196.3, and 191.7 Å, had a peak position at reff = 0.38 m, where the local electron temperature decreases by 30% to 40% with respect to more central and outer temperatures. Furthermore, the profiles of W17+–W23+ and the observed electron temperature profile are consistent. These results suggest that the UTA spectrum around 200 Å would be useful for diagnostics of tungsten impurities in lower charge states than the charge states contained in UTA spectra around 15–45 Å. The impurity spatial profile analysis method and spectral data for tungsten ions in low-to-intermediate charge states described in this paper could assist in future impurity diagnostics and transport modeling. For future work, an evaluation of a reliable PEC database and total tungsten density, n W , will be required. By accomplishing these tasks, we will contribute to the understanding of the impurity transport processes.

Author Contributions

Conceptualization: R.N. and T.O.; methodology: R.N. and T.O.; software: R.N., T.O., S.G. and H.O. Validation: R.N. and T.O.; formal analysis: R.N. and T.O.; investigation: R.N., T.O., I.M., D.K., H.A.S., H.O., S.G., C.S., M.G., Y.K., T.K., H.T. and K.T.; resources: R.N. and T.O.; data curation: R.N. and T.O. Writing—original draft preparation, R.N.; writing—review and editing, T.O.; visualization, R.N. Supervision: T.O.; project administration: T.O.; funding acquisition: R.N., T.O. and I.M. All authors have read and agreed to the published version of the manuscript.

Funding

This work was partially supported by JSPS KAKENHI (Grant Numbers JP20K03896 and JP21H04460), the NIFS Collaboration Research Program (Grant Numbers NIFS23KIPP031, NIFS23KIIP021, and NIFS23KIPF007), and JST, the establishment of university fellowships for the creation of science technology innovation (Grant Number JPMJFS2102).

Data Availability Statement

The raw data supporting the findings of this study are available in the LHD experimental data repository at https://doi.org/10.57451/lhd.analyzed-data (accessed on 1 November 2024). The spectral data supporting the conclusions of this study will be made available by the authors upon request.

Acknowledgments

The authors thank all members, including the technical staff, for their efforts in supporting the LHD experiment.

Conflicts of Interest

The authors declare no conflicts of interest. The funders had no role in the design of the study; in the collection, analyses, or interpretation of data; in the writing of the manuscript; or in the decision to publish the results.

References

  1. Loarte, A.; Lipschultz, B.; Kukushkin, A.S.; Matthews, G.F.; Stangeby, P.C.; Asakura, N.; Counsell, G.F.; Federici, G.; Kallenbach, A.; Krieger, K.; et al. Chapter 4: Power and particle control. Nucl. Fusion 2007, 47, S203–S263. [Google Scholar] [CrossRef]
  2. Grammers, T.; Emmerich, T.; Qu, D.; Heinze, O.; Vaβen, R.; Aktaa, J. Functionally graded tungsten/EUROFER coating for DEMO first wall: From laboratory to industrial production. Fusion Eng. Des. 2023, 188, 113430. [Google Scholar]
  3. Asmussen, K.; Fournier, K.B.; Laming, J.M.; Neu, R.; Seely, J.F.; Dux, R.; Engelhardt, J.C.; ASDEX Upgrade Teem. Spectroscopic investigations of tungsten in the EUV region and the determination of its concentration in tokamaks. Nucl. Fusion 1998, 38, 967. [Google Scholar] [CrossRef]
  4. Nakano, T. The JT-60 Team. Tungsten transport and accumulation in JT-60U. J. Nucl. Mater. 2011, 415, S327–S333. [Google Scholar] [CrossRef]
  5. Van Rooij, G.J.; Coenen, J.W.; Aho-Mantila, L.; Brezinsek, S.; Clever, M.; Dux, R.; Groth, M.; Krieger, K.; Marsen, S.; Matthews, G.F.; et al. Tungsten divertor erosion in all metal devices: Lessons from the ITER like wall of JET. J. Nucl. Mater. 2013, 438, S42–S47. [Google Scholar] [CrossRef]
  6. Zhang, L.; Morita, S.; Wu, Z.; Xu, Z.; Yang, X.; Cheng, Y.; Zang, Q.; Liu, H.; Liu, Y.; Zhang, H.; et al. A space-resolved extreme ultraviolet spectrometer for radial profile measurement of tungsten ions in the Experimental Advanced Superconducting Tokamak. Nucl. Inst. Methods Phys. Res. A 2019, 916, 169–178. [Google Scholar] [CrossRef]
  7. Dong, C.F.; Morita, S.; Cui, Z.Y.; Sun, P.; Zhang, K.; Murakami, I.; Zhang, B.Y.; Yang, Z.C.; Feng, L.; Li, Y.; et al. Evaluation of tungsten influx rate and study of edge tungsten behavior based on the observation of EUV line emissions from W6+ ions in HL-2A. Nucl. Fusion 2019, 59, 016020. [Google Scholar] [CrossRef]
  8. Guirlet, R.; Desgranges, C.; Schwob, J.L.; Mandelbaum, P.; Boumendjel, M.Y. The WEST Team. Extreme UV spectroscopy measurements and analysis for tungsten density studies in the WEST tokamak. Plasma Phys. Control. Fusion 2022, 64, 105024. [Google Scholar] [CrossRef]
  9. Zurro, B.; Hollmann, E.M.; Baciero, A.; Ochando, M.A.; McCarthy, K.J.; Medina, F.; Velasco, J.L.; Pastor, I.; Baião, D.; de la Cal, E.; et al. Studying the impurity charge and main ion mass dependence of impurity confinement in ECR-heated TJ-II stellarator. Plasma Phys. Control. Fusion 2014, 56, 124007. [Google Scholar] [CrossRef]
  10. McCarthy, K.J.; Zurro, B.; Hollmann, E.M.; Hernández Sánchez, J. The TJ-II Team. A spectral line survey from 17.6–250 nm of plasmas created in a magnetic confinement device. Phys. Scr. 2016, 91, 115601. [Google Scholar] [CrossRef]
  11. Oishi, T.; Morita, S.; Kato, D.; Murakami, I.; Sakaue, H.A.; Goto, M.; Kawamoto, Y.; Kawate, T.; Nishimura, R.; Takahashi, H.; et al. Observation of tungsten spectra up to W46+ ions in the Large Helical Device and contribution to the study of high-Z impurity transport in fusion plasmas. Nucl. Fusion 2024, 64, 106011. [Google Scholar] [CrossRef]
  12. Kramida, A.; Ralchenko, Y.; Reader, J.; NIST ASD Team. NIST Atomic Spectra Database (Version 5.11). 2023. Available online: https://physics.nist.gov/asd (accessed on 1 November 2024).
  13. Ralchenko, Y. Collisional-Radiative Modeling for Highly-Charged Ions of Tungsten. Plasma Fusion Res. 2013, 8, 2503024. [Google Scholar] [CrossRef]
  14. Li, W.; Shi, Z.; Yang, Y.; Xiao, J.; Brage, T.; Hutton, R.; Zou, Y. Tungsten spectroscopy in the EUV range observed at a high-temperature superconducting electron-beam ion trap. Phys. Rev. A 2015, 91, 062501. [Google Scholar] [CrossRef]
  15. Sakaue, H.A.; Kato, D.; Yamamoto, N.; Nakamura, N.; Murakami, I. Spectra of W19+–W23+ observed in the EUV region between 15 and 55 Å with an electron-beam ion trap. Phys. Rev. A 2015, 92, 012504. [Google Scholar] [CrossRef]
  16. Liang, S.; Lu, Q.; Wang, X.; Yang, Y.; Yao, K.; Shen, Y.; Wei, B.; Xiao, J.; Chen, S.; Zhou, P.; et al. A low-energy compact Shanghai-Wuhan electron beam ion trap for extraction of highly charged ions. Rev. Sci. Instrum. 2019, 90, 093301. [Google Scholar] [CrossRef]
  17. Pütterich, T.; Jonauskas, V.; Nue, R.; Dux, R. ASDEX Upgrade Team. The Extreme Ultraviolet Emissions of W23+ (4f5). AIP Conf. Ser. 2013, 1545, 132–142. [Google Scholar]
  18. Murakami, I.; Kato, D.; Oishi, T.; Goto, M.; Kawamoto, Y.; Suzuki, C.; Sakaue, H.A.; Morita, S. LHD Experiment Group. Progress of tungsten spectral modeling for ITER edge plasma diagnostics based on tungsten spectroscopy in LHD. Nucl. Mater. Energy 2021, 26, 100923. [Google Scholar]
  19. Priti; Inadome, K.; Funabashi, M.; Nakamura, N.; Sakaue, H.A.; Murakami, I.; Kato, D. Identification of Visible Lines in Pm-like W13+. Atoms 2023, 11, 57. [Google Scholar] [CrossRef]
  20. Murata, S.; Safronova, M.S.; Safronova, U.I.; Nakamura, N. Visible spectra of heavy ions with an open 4f shell. X-Ray Spectrom. 2020, 49, 200–203. [Google Scholar] [CrossRef]
  21. Bauche, J.; Bauche-Arnoult, C. Unresolved Transition Arrays. Phys. Scr. 1998, 37, 659–663. [Google Scholar] [CrossRef]
  22. Churilov, S.S.; Kildiyarova, R.R.; Ryabtsev, A.N.; Sadosky, S.V. EUV spectra of Gd and Tb ions excited in laser-produced and vacuum spark plasmas. Phys. Scr. 2009, 80, 045303. [Google Scholar] [CrossRef]
  23. Demura, A.V.; Leontyev, D.S.; Lisitsa, V.S.; Shurygin, V.A. Statistical Model for Quasicontinuum of Heavy Ions in Hot Plasma. Plasma Phys. Rep. 2020, 46, 241–251. [Google Scholar] [CrossRef]
  24. Nishimura, R.; Oishi, T.; Murakami, I.; Kato, D.; Sakaue, H.A.; Gupta, S.; Ohashi, H.; Goto, M.; Kawamoto, Y.; Kawate, T.; et al. Observation and Identification of W19+-W23+ Spectra in the EUV Wavelength Region in the Vicinity of 200 Å. Plasma Fusion Res. 2024, 19, 1402022. [Google Scholar] [CrossRef]
  25. Gu, M.F. Indirect X-Ray Line-Formation Processes in Iron L-Shell Ions. Astrophys. J. 2003, 582, 1241. [Google Scholar] [CrossRef]
  26. Nishimura, R.; Oishi, T.; Murakami, I.; Kato, D.; Sakaue, H.A.; Gupta, S.; Ohashi, H.; Goto, M.; Kawamoto, Y.; Kawate, T.; et al. Collisional-Radiative modeling of unresolved transition array spectra near 200 Å from W17+–W25+ emissions for diagnostics of ITER edge plasma. Nucl. Mater. Energy 2024, 41, 101740. [Google Scholar] [CrossRef]
  27. Nishimura, R.; Oishi, T.; Murakami, I.; Kato, D.; Sakaue, H.A.; Gupta, S.; Ohashi, H.; Goto, M.; Kawamoto, Y.; Kawate, T.; et al. Investigation of Tungsten Unresolved Transition Array Spectrum around 300 Å for Fusion Plasma Diagnostics. Plasma Fusion Res. 2025, 20, 2402005. [Google Scholar] [CrossRef]
  28. Takeiri, Y.; Morisaki, T.; Osakabe, M.; Yokoyama, M.; Sakakibara, S.; Takahashi, H.; Nakamura, Y.; Oishi, T.; Motojima, G.; Murakami, S.; et al. Extension of the operational regime of the LHD towards a deuterium experiment. Nucl. Fusion 2017, 57, 102023. [Google Scholar] [CrossRef]
  29. Narihara, R.; Yamada, I.; Hayashi, H.; Yamauchi, K. Design and performance of the Thomson scattering diagnostics on LHD. Rev. Sci. Instrum. 2001, 72, 1122–1125. [Google Scholar] [CrossRef]
  30. Peterson, B.J.; Yoshimura, S.; Drapiko, E.A.; Seo, D.C.; Ashikawa, N.; Miyazawa, J. Bolometer diagnostics on LHD. Fusion Sci. Technol. 2010, 58, 412–417. [Google Scholar] [CrossRef]
  31. Huang, X.; Morita, S.; Oishi, T.; Goto, M.; Dong, C. Space-resolved ultraviolet spectroscopy free of high-energy neutral particle noise in wavelength range of 10–130 Å on the large helical device. Rev. Sci. Instrum. 2014, 85, 043511. [Google Scholar] [CrossRef]
  32. Dong, C.; Morita, S.; Goto, M.; Zhou, H. Space-resolved ultraviolet spectrometer for impurity emission profile measurement in Large Helical Device. Rev. Sci. Instrum. 2010, 81, 033107. [Google Scholar] [CrossRef]
  33. Laviron, C.; Donné, A.J.H.; Manso, M.E.; Sanchez, J. Reflectometry techniques for density profile measurements on fusion plasmas. Plasma Phys. Control. Fusion 1996, 38, 905–936. [Google Scholar] [CrossRef]
  34. Smith, M.L.; Dennis, R.K.; Sudharsanan, S.I. Abel inversion using transform techniques. J. Quant. Spectrosc. Radiat. Transf. 1998, 39, 367–373. [Google Scholar] [CrossRef]
  35. Ingesson, L.C.; Alper, B.; Peterson, B.J.; Vallet, J.-C. Chapter 7: Tomography Diagnostics: Bolometry and Soft-X-Ray Detection. Fusion Sci. Technol. 2007, 53, 528–576. [Google Scholar] [CrossRef]
  36. Fujii, K.; Kato, D.; Nakamura, N.; Goto, M.; Morita, S.; Hasuo, M. Experimental evaluation of fractional abundance data for W23+–W28+. J. Phys. B At. Mol. Opt. Phys. 2017, 50, 055004. [Google Scholar] [CrossRef]
  37. Kato, D.; Sakaue, H.A.; Murakami, I.; Goto, M.; Oishi, T.; Tamura, N.; Funaba, H.; Morita, S. Assessment of W density in LHD core plasmas using visible forbidden lines of highly charged W ions. Nucl. Fusion 2021, 61, 116008. [Google Scholar] [CrossRef]
  38. Demura, A.V.; Kadomtsev, M.B.; Lisitsa, V.S.; Shurygin, V.A. Tungsten Ions in Plasmas: Statistical Theory of Radiative-Collisional Processes. Atoms 2015, 3, 162–181. [Google Scholar] [CrossRef]
  39. Liu, Y.; Morita, S.; Huang, X.; Oishi, T.; Goto, M.; Zhang, H. Component investigation of ionization stages on tungsten unresolved transition array spectra for plasma diagnostics based on space-resolved extreme ultra-violet spectroscopy in large helical device. J. Appl. Phys. 2017, 122, 233301. [Google Scholar] [CrossRef]
  40. Boumendjel, M.Y.; Desgranges, C.; Guirlet, R.; Peyrusse, O.; West Team. Collisional-radiative modeling and radiative emission of tungsten in tokamak plasmas in the temperature range (800–5000) eV. Phys. Plasmas 2023, 30, 093302. [Google Scholar] [CrossRef]
  41. TFR Group. Are Heavy Impurities in TFR Tokamak Plasmas at Iozination Equilibrium? Plasma Phys. 1980, 22, 851. [Google Scholar]
  42. Breton, C.; Compant la Fontaine, A.; Michelis, C.D.; Hecq, W.; Lasalle, J.; Leocoustey, P.; Mattioli, M.; Mazzitelli, G.; Platz, P.; Ramette, J. Relevance of heavy-impurity transport simulations if TFR Tokamak plasmas to ionization equilibrium evaluations. J. Phys. B At. Mol. Phys. 1983, 16, 2627–2646. [Google Scholar] [CrossRef]
  43. Berhinger, K. Description of the Impurity Transport Code STRAHL; JET Joint Undertaking: Abingdon, UK, 1987; p. 87. [Google Scholar]
  44. Pütterich, T.; Neu, R.; Dux, R.; Whiteford, A.D.; O’Mullane, M.G.; The ASDEX Upgrade Team. Modeling of measured tungsten spectra from ASDEX Upgrade and predictions for ITER. Plasma Phys. Control. Fusion 2008, 50, 085016. [Google Scholar] [CrossRef]
  45. Shurygin, V.A. Diffusive-Convective Model of Impurity Transport in Quasi-Stationary Plasma: Criticism and Alternative. Plasma Phys. Rep. 2024, 50, 911–930. [Google Scholar] [CrossRef]
Figure 1. Experimental scheme of the Large Helical Device.
Atoms 13 00021 g001
Figure 2. Discharge waveforms of (a) plasma heating power, PH, (b) central electron density, ne0, (c) central electron temperature, Te0, (d) plasma stored energy, WP, and (e) radiation power, Prad.
Atoms 13 00021 g002
Figure 3. Spatial profiles of the effective minor radius, reff, and line of sight of the EUV Short2 and EUV Long2 spectrometers on the poloidal cross-section at t = 5.30 s for the discharge LHD#170347. The dark arrows show the observation range.
Atoms 13 00021 g003
Figure 4. Principle for evaluation of the local emissivity.
Atoms 13 00021 g004
Figure 5. Component of matrix L. The number of each label means the serial number of the line of sight ( j ).
Atoms 13 00021 g005
Figure 6. Typical results of (a) the evaluated local emissivity profile and (b) the observed line-integrated intensity and calculated line-integrated intensity of W17++W19+ (213.3 Å). The spectrum was taken at t = 5.20–5.30 s, Te0 = 0.31 keV, and ne0 = 4.3 × 10¹⁹ m−3. The black line is the average, where α > 99.5%.
Atoms 13 00021 g006
Figure 7. (a) Experimentally observed EUV spectrum at Te0 = 0.31 keV, (b) synthesized spectrum of W17+–W23+ by CR model at Te = 0.3 keV and ne = 1019 m−3, and (c) synthesized spectra of each ion state.
Atoms 13 00021 g007
Figure 8. The measured space-resolved EUV spectra for (a) 23.6–38.0 Å and (b) 183.7–234.3 Å captured using the EUV Short2 and EUV Long2 spectrometers. The blue vertical spectra represent the binned spectra along the spatial direction.
Atoms 13 00021 g008
Figure 9. Spatial profiles of (a) electron temperature and electron density measured at 5.30 s, and local emissivity of (b) 35.9, 34.2 Å and (c) 196.3, 191.7 Å. The local emissivity profiles are normalized such that the maximum value is 1. The error bars in the electron temperature profile are typically approximately ±0.01 keV.
Atoms 13 00021 g009
Figure 10. Normalized local emissivity profiles of 191.7 (W20+–W23+), 196.3 (W20++W22+), 201.0 (W19++W21+), 207.3 (W18++W20+), 213.3 (W17++W19+), and 221.4 (W16++W18+) Å.
Atoms 13 00021 g010
Disclaimer/Publisher’s Note: The statements, opinions and data contained in all publications are solely those of the individual author(s) and contributor(s) and not of MDPI and/or the editor(s). MDPI and/or the editor(s) disclaim responsibility for any injury to people or property resulting from any ideas, methods, instructions or products referred to in the content.

