1. Introduction
At the 2018 International Conference on the Physics of Highly Charged Ions (HCI 2018) and in a follow-up paper, Sakaue et al. [
1] presented the first observation of electric octupole (E3) transitions in Ag-like W ions. The discovery and the accompanying theoretical explanation revealed a unique scenario in Ag-like ions that accounts for a substantial population of the 5s
first excited level in tungsten and in a narrow range of neighboring elements. Since the 5s
level can only decay to one of the 4f
ground state levels, due to the selection rules, these transitions take place via electric octupole (E3) decays.
The theoretical explanation that these E3 transitions appear relatively strong requires detailed understanding of the atomic structure of Ag-like ions in this Z atomic number region and the collisional–radiative (CR) population of the energy levels in these systems. The unique condition that ultimately creates a buildup of the population of the 5s state is a level crossing that occurs between the 4d5d levels and the core excited 4d4f levels in Ag-like ions. Because of the many possible states of the same angular momentum (J = 3/2 or 5/2) of the 4d4f configuration, the level-crossing conditions are also present not only in tungsten, but in a narrow Z range of neighboring Ag-like ions.
In a historical perspective, the investigation of heavy Ag-like ions was intensified in the 1970s when controlled thermonuclear fusion-motivated experiments with tokamak-type plasma devices led to the observation of soft X-ray and extreme-ultraviolet spectra of highly charged states of tungsten [
2]. The analysis of these spectra and a series of further measurements at the National Bureau of Standards (the predecessor of the National Institute of Standards and Technology, NIST) allowed the identification of the main features of the tokamak spectra [
3,
4].
An interesting consequence of the identification of Ag-like W lines in fusion research tokamak devices was the realization that the temperatures of the plasma were considerably lower than previously thought because of the lower-than-expected charge states appearing in the spectra [
3]. An additional discovery, with the identification and careful measurement of the wavelengths of transitions along the Ag-like isoelectronic sequence, was the realization of the presence of level-crossings in the upper half of the periodic table.
The theoretical investigation of Cheng and Kim [
5] showed that the crossing of levels is mainly due to the strong variation of the energy of the 4f level with the nuclear charge of Ag-like ions. In neutral Ag and in low-ionized Ag-like ions, the 5s level is the ground state of the system in which there is a single electron outside of the 4d
core. The 5s ground state configuration is due to the strong correlation between the single valence and the core electrons. With increasing Z, however, the energy of the 4f level is rapidly dropping toward the natural hydrogen-like ordering of the energy levels in asymptotically high nuclear charges.
The crossing of the 4f state and the different n = 5 principal quantum number states take place at different Z locations along the isoelectronic sequence. This can lead to strong configuration mixing of the crossing levels if the total angular momenta and the parity of the states match. The crossing can strongly affect the term structure of the levels in these Z regions and the transition probabilities that involve these states [
5].
Apart from the 4f level, as pointed out by Cheng and Kim [
5], the 4d
4f
core excited levels of Ag-like also undergo a similar strong variation in binding energy and resulting level-crossings along the isoelectronic sequence.
Figure 1, based on data from [
5], shows this behavior and indicates the crossing of the 5s and 4f levels around Z = 60 and the 4d
5d and 4d
4f
levels at around Z = 70. More recently, Safronova et al. [
6] carried out third-order relativistic many-body calculations that show the singular behavior of transitions and the strong oppression or enhancement of the transition rates near the level crossings as a result of strong configuration mixing.
Especially interesting in connection with the population buildup on the 5s
state in tungsten is the crossing of the 4d
5d and 4d
4f
levels.
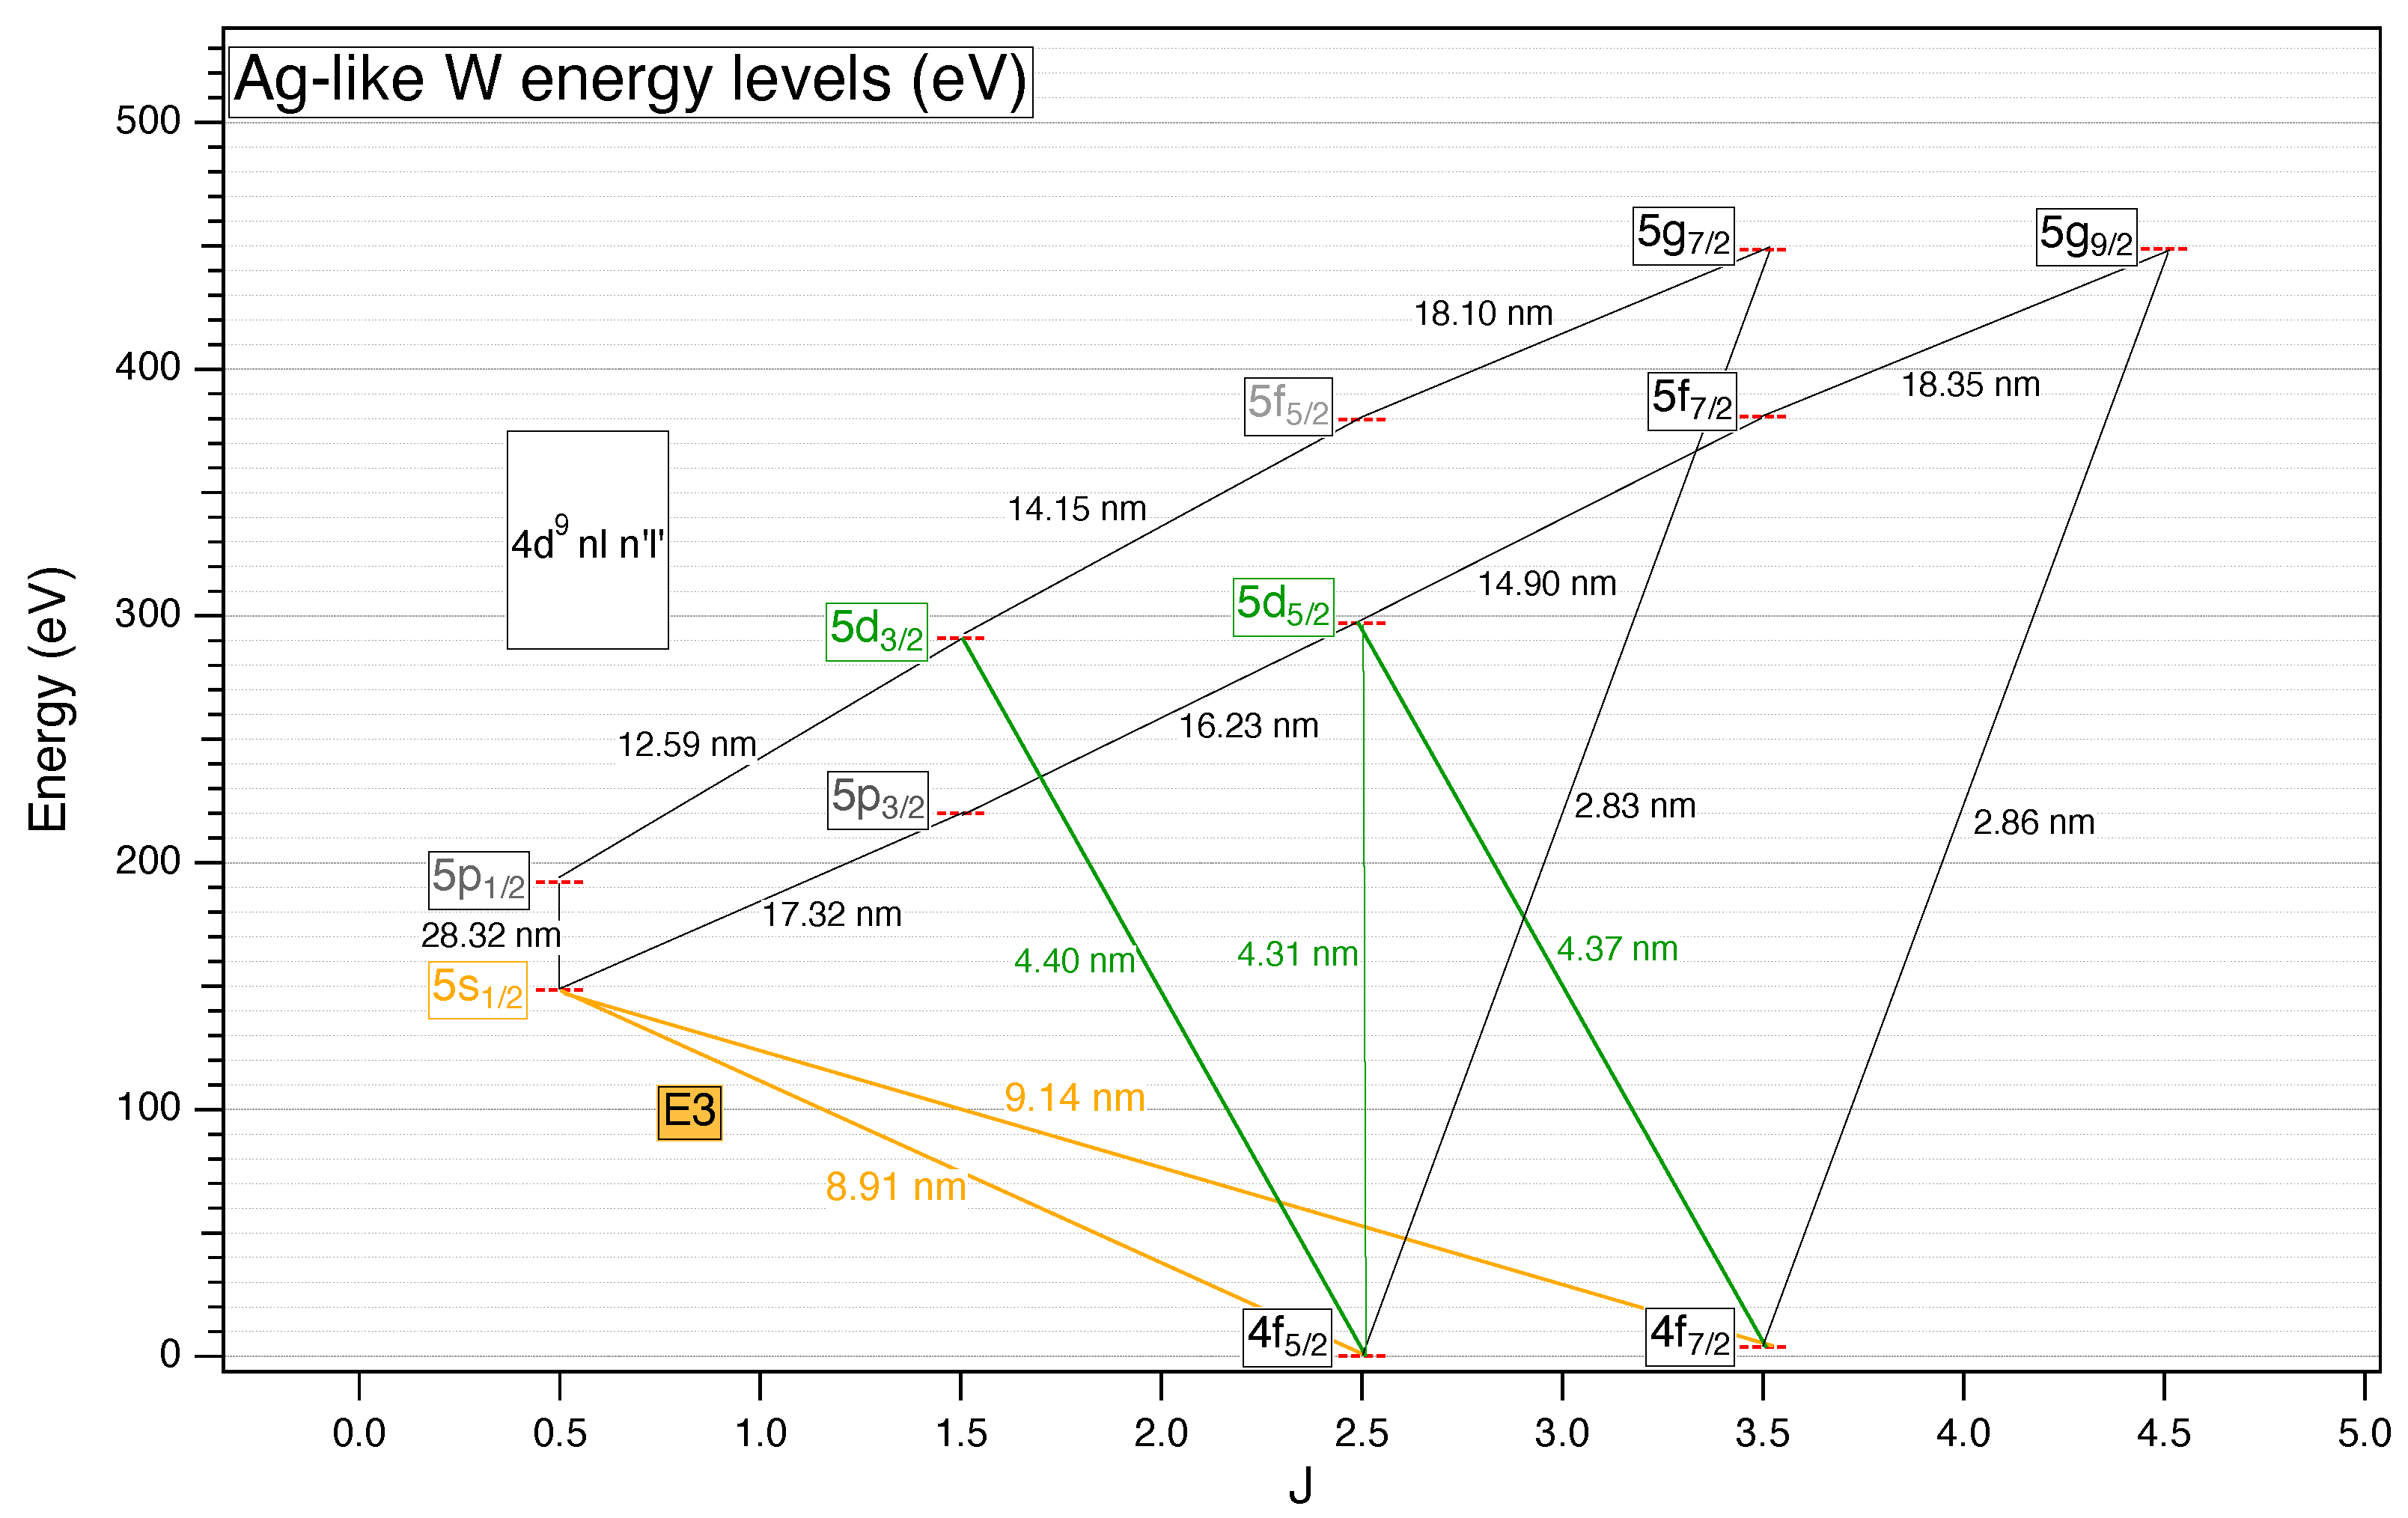
Figure 2 shows the energy level structure of Ag-like tungsten and the main transitions and their wavelengths between these levels. In general, cascades from upper levels channel through either the 4d
5d
or the 4d
5d
levels that can directly decay by allowed electric dipole (E1) transitions to the 4d
4f
or 4d
4f
ground state. In the case of configuration mixing between the 4d
5d and 4d
4f
levels, the electronic states involved can be expressed as a linear combination of the corresponding states, e.g.,
With this, the transition rates to the 4f ground state levels are related to the matrix element
If the two terms on the right-hand side of this equation are comparable in magnitude but are of different signs, the transition probability to the ground state could be strongly reduced. The indirect consequence of this is that E1 transitions to 5p levels in
Figure 2 become the preferred decay route of the 5d levels. The 5p levels in turn directly feed our 5s state of interest. The situation that
is large with respect to
can occur because of the small energy separation of the 4d
5d and 4d
4f
levels, another consequence of the level crossing.
The goal of the current investigation is to confirm the previous observation of the presence of E3 transitions in Ag-like W by Sakuae et al. [
1] in a device with different plasma and trapping conditions. We performed energy level structure calculations with the relativistic FAC [
7] and the GRASP2K [
8] packages. We also used FAC to calculate transition probabilities, excitation, and recombination rates. These atomic data were fed into the non-Maxwellian collisional–radiative package NOMAD [
9] to predict charge state distributions and line intensities similar to our previous works in the EUV region (e.g., [
10,
11]). Confirming the theoretical predictions of [
1], we also found theoretically that the E3 transitions should appear with potentially measurable intensities in neighboring elements. Therefore, we also set out to identify the 5s-4f E3 transitions in Ag-like Re and Ir. Our results are summarized below and in upcoming publications.
2. Experimental Method
EUV spectra from Ag-like W, Re, and Ir were recorded by the flat-field grazing incidence grating ultrahigh-vacuum spectrometer [
12] attached to the electron beam ion trap (EBIT, [
13]) of NIST. Ag-like ions were created at beam energies that are slightly below their ionization potentials to optimize their abundance in the trap.
The EBIT operates with a LHe cooled superconducting magnet (SCM) at 2.7 T magnetic field that compresses the electron beam to around 10
electron/cm
densities. These values are considerably higher (by about an order of magnitude) than the magnetic field and electron density in the device where the original E3 observations were reported by Sakaue et al. [
1]. To explore spectra at lower electron densities, some measurements were taken at lower magnetic fields; however, the stable operation of the instrument does not allow the exploration of magnetic fields below 1T.
W, Re, and Ir metal ions were injected from a metal vapor vacuum arc (MEVVA) ion source [
14] located on the top of the vertically oriented EBIT. Singly ionized ions were created by a triggered spark. Applied electric fields directed the ions toward the center of the trap along the magnetic field lines of the SCM. Ions were captured by the potentials of the three-element drift tube structure synchronized with the MEVVA trigger signal. Axial trapping was provided by the drift tube electrodes, and radial trapping was created by the electron beam and the SCM.
Spectra were collected for several hours for each element and the EBIT setting to collect reasonable photon count statistics on the Ag-like lines. Allowed electric dipole (E1) transitions were identified and used for optimizing the emission from the Ag-like charge state.
3. Theoretical Calculations
The Flexible Atomic Code (FAC), based on the relativistic model potential method [
7], was used to calculate the energy levels, transition probabilities, excitation, ionization, and recombination cross sections in Ag-like and neighboring charge states. The calculation included more than 36,000 levels that, in the Ag-like charge state, included the 4d
4f, (4s4p4d)
4f
, (4s4p4d)
4f
, 4d
5l, 4d
f5l, 4d
6l, and 4d
4f6l configurations.
To provide precise wavelengths for the E3 transitions, the multi-configuration Dirac–Fock GRASP2K software package was used [
8]. These calculations included single and double excitations from n = 4 up to n = 7 and altogether more than 100,000 levels.
Line identification was aided by non-Maxwellian collisional–radiative model calculations using the NOMAD code [
9]. NOMAD uses atomic data from FAC, except the charge exchange rate estimate with neutral atoms, and calculates energy-level populations and line intensities. The model has been tested on many different systems in the NIST EBIT and has been used to compare line intensity ratios with experimental data to help line identification (e.g., [
10,
11]).
Figure 3 shows a series of synthetic spectra of Ag-like Re at different electron beam densities calculated using the NOMAD code. The dependence of the relative line intensities with the electron beam density can be clearly seen.
4. Discussion
Aided by the theoretical calculations of the transition wavelength, and the predicted intensity ratios of the collisional–radiative model, we were able to observe the 5s
-4f
and the 5s
-4f
electric octupole transitions in W, Re, and Ir. In W and Re, the E3 lines are prominent; however, in Ir, the lines are rather weak. Visually comparing the Ag-like W spectra of [
1] with our observations, it is clear that some of the spectral features are different. This is likely due to the density dependence of the spectra (
Figure 3) and the very different electron beam densities in the two measurements.
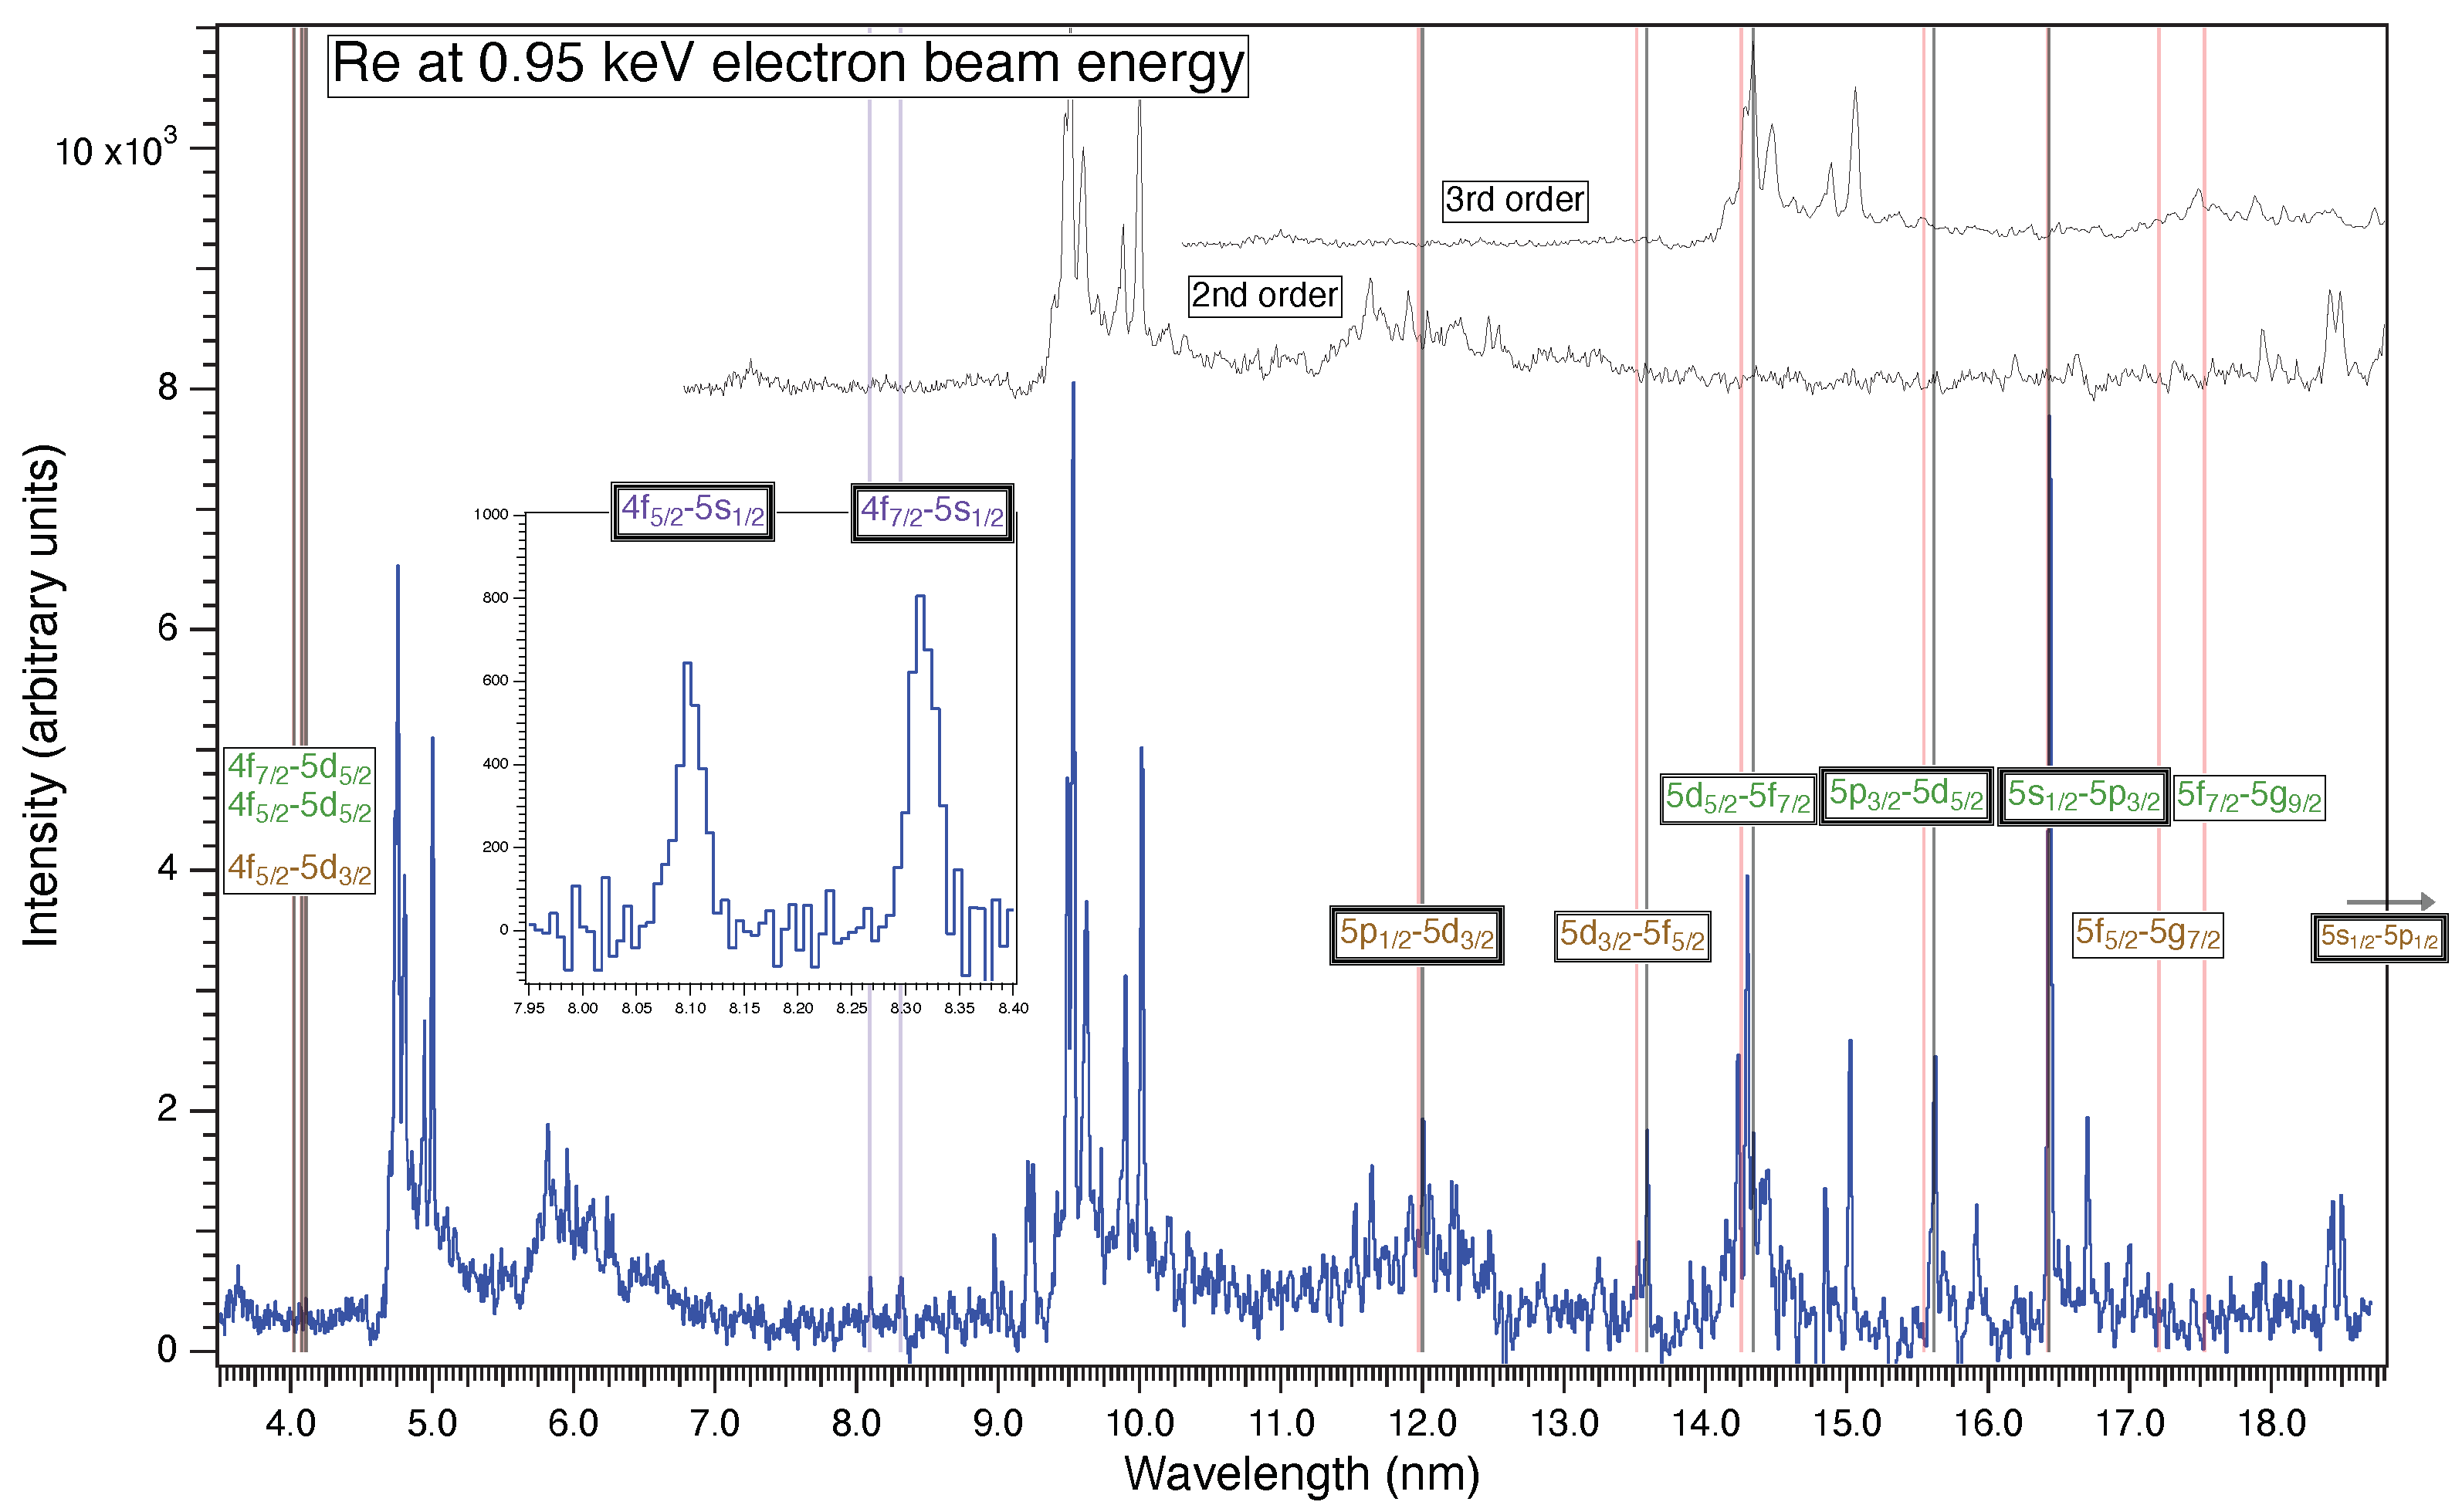
Figure 4 shows the experimental spectrum of Ag-like Re, taken at 1.5 keV electron beam energy. The insert shows the E3 lines identified. Vertical lines on
Figure 4 indicate the positions of spectral lines by transitions between the lowest excitation levels of
Figure 1. Red lines show the wavelengths calculated by the FAC code, and gray lines depict the experimental wavelengths. Apart from the identification of the E3 transitions (purple vertical lines and the magnified region in the insert with the background transitions removed), one can also see that the positions of some of the E1 transitions show a disagreement between theory and experiment, especially for the transitions where the 5d levels are involved. This may correspond to the above-described level crossings between the 4d
5d and 4d
4f
levels and the shortcoming of our FAC calculations to fully account for the configuration mixing between these.
As we pointed out in the Introduction, the strong configuration mixing between the 4d5d states and the core excited 4d4f states is responsible for the buildup of the population of the 5s level and results in the appearance of the E3 lines. The strong configuration mixing also affects the energy levels involved, and it appears that our FAC calculations are not able to fully account for their extent. Detailed analysis of the effect is underway and will be presented in a separate publication.


