Article

Domainal Investigation of a Quartz-Fluorite Composite Using Spectroscopic Techniques

1
Department of Physics, University of Allahabad, Prayagraj 211002, India
2
Department of Earth and Planetary Sciences, Nehru Science Centre, University of Allahabad, Prayagraj 211002, India
3
National Centre of Experimental Mineralogy and Petrology, 14 Chatham Lines, University of Allahabad, Prayagraj 211002, India
4
Department of Physics, CMP Degree College, University of Allahabad, Prayagraj 211002, India
*
Author to whom correspondence should be addressed.
Atoms 2022, 10(4), 133; https://doi.org/10.3390/atoms10040133
Submission received: 25 August 2022 / Revised: 21 October 2022 / Accepted: 1 November 2022 / Published: 4 November 2022
(This article belongs to the Section Atomic, Molecular and Nuclear Spectroscopy and Collisions)

Abstract

:
The analysis of geological samples that have several chemically diffused zones which formed under certain physico-chemical condition is difficult to achieve. The quantitative estimations of the minerals in such samples are tedious. The present work demonstrates the application of LIBS for qualitative and quantitative analyses of a quartz-fluorite composite which was procured from an amygdaloidal basalt from Deccan Traps, India. The presence of weak emission lines of F in the spectral range of 200–900 nm makes it challenging to quantify the fluorine. This study has addressed a promising alternative to quantify the fluorine using electronic bands of CaF molecules observed in the Laser-induced Breakdown Spectroscopy (LIBS) spectrum. In addition to this spectroscopic technique, the authors also have used Photoacoustic Spectroscopy (PAS) and UV-VIS spectroscopy technique to obtain molecular information from the geological sample. Principal Component Analysis (PCA) was applied to a truncated spectral region of the CaF molecule, and it showed 99% variance. Further, the obtained results with these spectroscopic techniques were compared with the results that were obtained from X-ray diffraction and Electron Probe Micro Analyzer, and they show good agreement. Thus, the LIBS technique can be promising for in situ profile section (varies from few microns to centimeters size) studies without the sample’s destruction using the point detection capability of LIBS.

1. Introduction

Crystalline and non-crystalline forms of silica make up the ~12.6 wt.% of the Earth’s crust [1]. The physical and chemical properties of quartz enhance its value in industrial and commercial applications. Natural crystals of quartz, Si ore, and bulk products (quartzite and quartz sand) are used as gemstones in electronic and glass industries. Quartz has a stable mineral phase over a broad range of temperatures and pressures with several polymorphs (α-quartz, β-quartz, α-Tridymite, and β-Tridymite, etc.), and it is formed under different natural conditions where magmatic, metamorphic, and hydrothermal conditions operate.
Quartz has several colored varieties, mainly due to the presence of chromophores, stress, lattice defects, and the presence of colored centers [2]. Furthermore, mineral inclusions or fluid inclusions can also impart color to the quartz [3,4,5,6,7,8]. Quartz may also occur in association with various minerals like feldspar, mica, rutile, zircon, pyrite, cassiterite, wolframite, magnetite, ilmenite, hypersthene, aegirine, amphibole, biotite, tourmaline, calcite, apatite, and fluorite [9,10]. Fluorite, also known as fluorspar, usually coexists with quartz, calcite, or other silicate minerals [11] and occurs in dominantly magmatic rocks as a secondary phase. It is mainly used to produce hydrofluoric acid and aluminum fluoride in iron and steel casting industries, and also, in the manufacturing of high-quality optical instruments [12]. Fluorite became a rage for LIBS study after its first detection on the planet Mars by the ChemCam on the curiosity rover [13].
The detection of fluorine by the LIBS technique is challenging due to its low excitation efficiency, and its intense emission lines lie in the vacuum ultraviolet (VUV) spectral range (below 200 nm). Only weak emission lines are observed in the typical spectral range of 200–900 nm (UV-VIS). Several strategies have been made to improve the detection of trace amounts of fluorine. The molecular emission of CaF has been used in previous studies to improve the methods of fluorine detection [14,15,16]. Alvarez-Llamas et al. [15] determined the concentration of fluorine using the CaF molecular bands and reported an improved limit of detection when they were compared to the atomic lines of fluorine. Vogt et al. [16] also investigated the CaF molecular emission bands in LIBS spectral data to detect fluorine in Martian conditions.
Several techniques have been used to study/characterize quartz and fluorite and their association [17,18,19,20]. Similarly, fluorite deposits from Anatolia, Turkey, have been studied by investigating rare earth element geochemistry and micro-thermometric characteristics [20].
Although the study of quartz and fluorite has a long history, the association of quartz and fluorite is far from being answered by a single analytical technique. Laser-induced Breakdown Spectroscopy (LIBS) has the potential to investigate, simultaneously, quartz and fluorite as well as the compositionally diffused zone between these two minerals. Because LIBS has the point detection capability, it requires no sample preparation, which makes it appropriate for studying quartz and fluorite associations without any sample destruction occurring [21,22,23,24,25,26].
Photoacoustic spectroscopy (PAS) is an analytical technique that is used to identify the molecules/compound present in any type of sample. It is based on the photoacoustic phenomenon, in which heat energy is produced as a result of the non-radiative transitions that take place when the optical energy from incident electromagnetic radiations is absorbed by the material. PAS depends on the heat that is produced in the sample by the nonradiative relaxation process, so it becomes more favorable than conventional spectroscopy does in the case of solid samples [27,28,29,30,31].
In the present study, a geological sample of quartz and fluorite aggregate has been successfully investigated using Laser-induced Breakdown Spectroscopy (LIBS), X-ray Diffraction (XRD), and Electron Probe Microanalysis (EPMA) analyses for its elemental identification and quantification. PAS was applied to obtain the molecular information from the quartz-fluorite composite. The absorbance of the same sample was recorded in the UV-Vis region to confirm the molecular signatures. PCA was applied to LIBS spectral data to study variation in the spectral data of the sample.

2. Results and Discussion

2.1. X-ray Diffraction Analysis

X-ray diffraction studies were performed on the powdered sample of all three (white, pale green and green) zones of the sample. The study reveals the presence of diffraction peaks of quartz in the white and pale green zones (Figure 1) based on the prominent d-spacings of the quartz at 4.18 Å (2θ = 21.26°), 3.33 Å (2θ = 26.80°), and 1.80 Å (2θ = 50.58°). The presence of fluorite is confirmed based on d-spacings that can be observed at 3.13 Å (2θ = 28.52°), 1.92 Å (2θ = 47.21°), and 1.64 Å (2θ = 55.97°).
The fluorite presence can be noticed in the green zone of the sample, whereas the diffusion zone (pale green) consists of both quartz and fluorite (Figure 1). Thus, the XRD results suggest the presence of crystalline quartz, fluorite and quartz-fluorite in the white, green and pale green (diffusion) zones, respectively.

2.2. Electron Probe Microanalysis

To determine the concentrations of certain elements in the sample, EPMA was used, and the results are summarized in Table 1. The concentration list in the table is averaged for the three-spot analyses of the white and green zones of the sample. The error in the concentration in each zone is the standard deviation of the three values that were obtained from EPMA analysis. The total of the major oxides in the white and green zones of the sample are 98% and 82%, respectively. The result reveals that the white zone of the sample is mainly made of quartz mineral, and it shows approximately 98 wt.% of SiO2. It also exhibits a CaO and a F (0.01 and 0.39 wt.%, respectively) presence in small amounts. The EPMA data of the green zone show significant concentrations of CaO (55.41 wt.%) and F (45.62 wt.%). However, a trace amount of SiO2 is present in the green zone of the sample (0.16 wt.%), suggesting the minor incorporation of Si in the fluorite lattice.

2.3. LIBS Analysis

2.3.1. Characterization of Quartz and Fluorite Using Atomic Lines of the Elements Observed in the LIBS Spectra

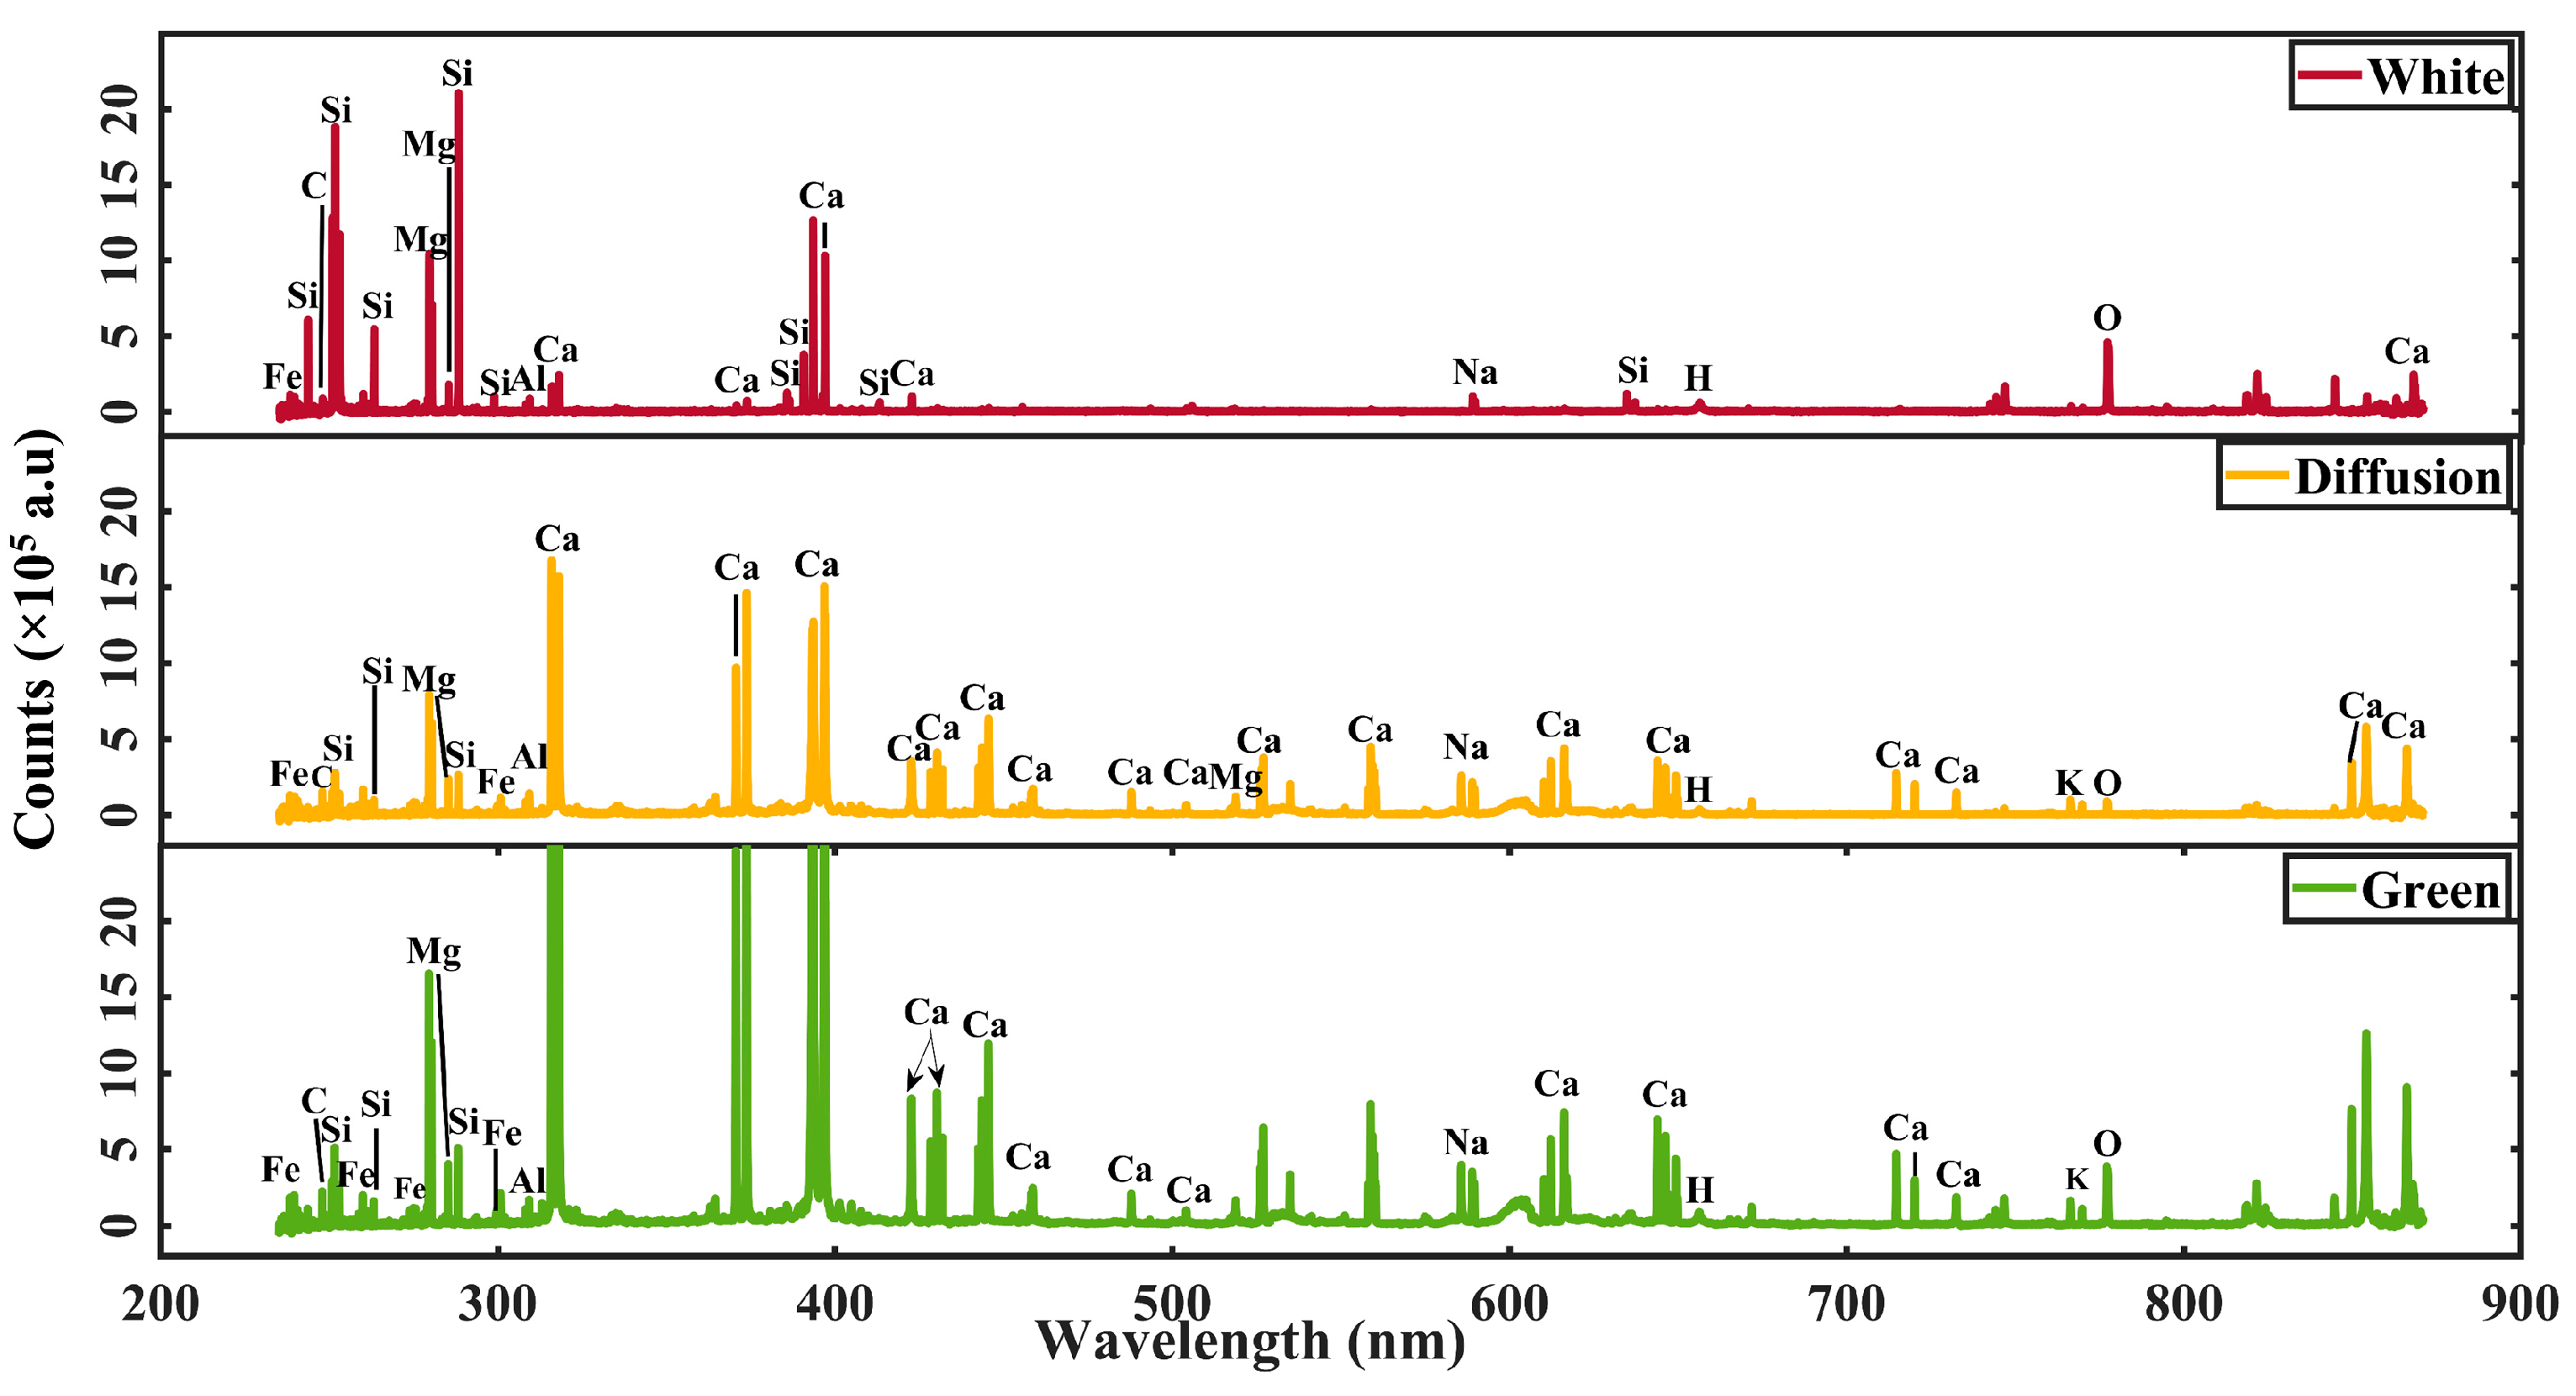
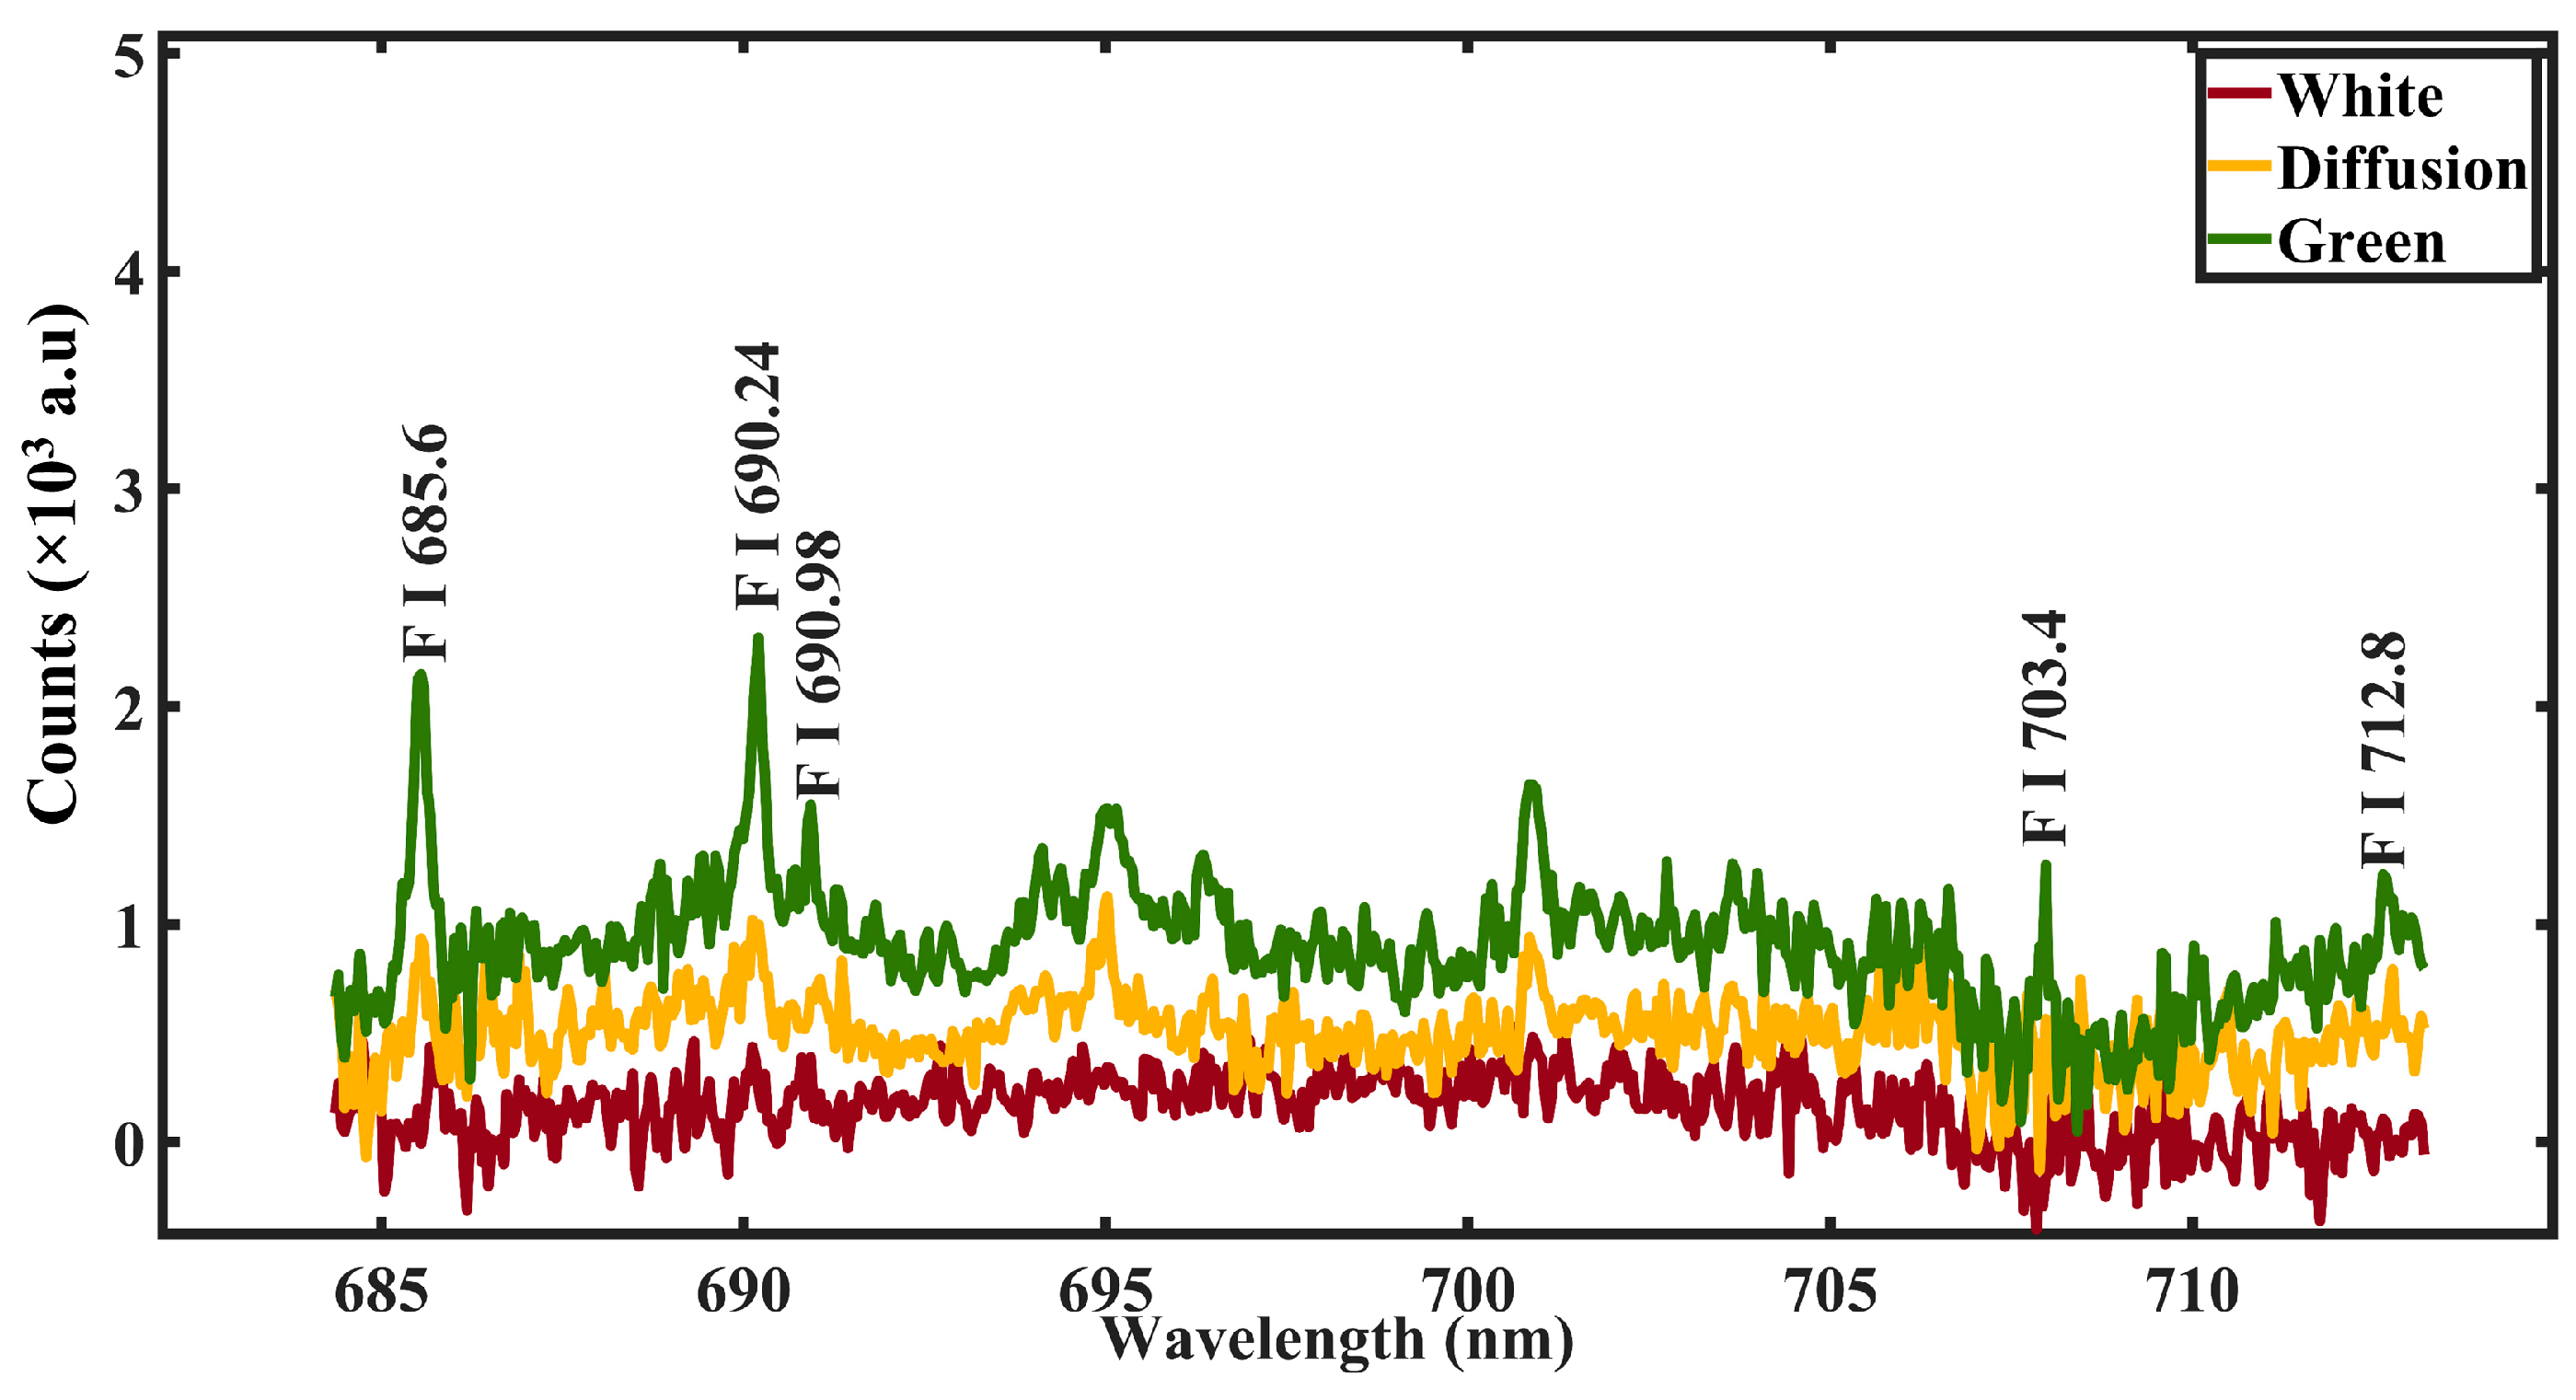
The LIBS spectra of three different regions, i.e., the white, diffusion, and green zones of the sample, are shown in Figure 2. One hundred single laser shots at different locations were accumulated to produce one spectrum. Ten such spectra at different positions in each zone (white, green, and diffusion) were recorded. An average of these ten spectra from each zone/region is represented, here. Figure 2 shows the spectrum of the white zone in the 230–850 nm wavelength region. In this zone, several persistent lines of Si (I) and Si (II) can be observed. The atomic and ionic transitions of other elements such as calcium (Ca), magnesium (Mg), aluminum (Al), and sodium (Na) have also been identified and labelled in Figure 2 (white) using the NIST atomic spectroscopy database [32]. Table 2 lists various atomic and ionic peaks that can be identified in the LIBS spectra in three parts of the sample. The spectral signature of the elements in three zones, i.e., white, pale green, and green, are the same, but their intensities are entirely different. For example, the intensity of the spectral lines of Si is at its maximum in the white zone and at its minimum in the green zone, whereas the intensity of the spectral lines of Ca is at its maximum in the green and at its minimum in the white zone. In addition to this, a few weak spectral lines of fluorine at 685.5 nm, 690.2 nm, 690.9 nm, 703.7 nm, and 712.8 nm appear in the green and pale green zones, which are absent in the white zone. Additionally, the intensity of the spectral lines of F is stronger in the green zone in comparison to the pale green zone.
Along with the appearance of the spectral lines of Si and Ca and F, there is also the participation of spectral lines of Mg (I, II), Al (I), Fe (I, II), and Na (I) in the LIBS spectra of these zones. Strong spectral lines of O (I) at 777.1, 777.4, and 777.6 nm appear in all of the three zones, but the intensity of the atomic transition of O appears to be stronger in the white zone in comparison to the spectra of the other two zones. The presence of stronger spectral lines of Si and O in the white region indicates that the white zone is dominated by SiO2, i.e., quartz.
Sometimes, it is challenging to detect some elements by their appearance as spectral lines in the LIBS spectra due to their weaker intensity in the spectral range that was examined, i.e., the UV-VIS region. For example, the strongest lines of F are in the VUV spectral range, i.e., 60.7 nm (F II) and 95.5 nm (F I). Fluorine does not exhibit atomic and ionic spectral lines of sufficient intensity in the spectral range (200–800 nm) which makes it difficult to identify it by the LIBS spectra [14]. Figure 3 represents the comparative LIBS spectra of different zones in the wavelength range of 680–720 nm. It is clear from Figure 3 that the spectral lines of F at 685.5 nm, 690.2 nm, 690.9 nm, 703.7 nm, and 712.8 nm are observed in the LIBS spectra of the green and pale green zones, whereas these spectral lines are not observed in the LIBS spectra of the white zone. Initially, it was supposed that the sample is a colored variety of quartz, changing color from top to bottom due to some mineral inclusion [17]. However, the LIBS study reveals that the white zone may correspond to quartz, but the green and the pale green zone is not same as white (quartz) zone. The presence of fluorine in the green and pale green zones indicates that these zones may correspond to the fluorite (CaF2) mineral. To ensure this result, we focused our study on the presence of molecular emissions.

2.3.2. Characterization of Quartz and Fluorite Zones Using Electronic Bands of Diatomic Molecules of CaF Observed in LIBS Spectra

The identification of the spectral lines of F in the LIBS spectra which lie in the UV-Visible region was difficult as the spectral lines of F are very weak in this region. Therefore, to identify F, the electronic bands of the CaF molecules present in the LIBS spectra were used. It is also reported that molecular emission is more suitable than atomic/ionic emissions are for the characterization of certain elements [14,15]. The appearance of molecular bands in the LIBS spectra is closely related to the dissociation energy (energy that is required to separate both the atoms from the molecule’s ground state) of the molecular species. The molecules with a high dissociation energy are the most stable ones, e.g., CO, CN, C2, N2, etc., thus, the presence of these molecules can also be seen in highly ionized plasma. Many studies have demonstrated that these molecules form at the early stages of the plasma, where the plasma temperature and the electron densities were high [33]. Molecules such as CaF have a moderate value of dissociation energy. Thus, these molecules can be observed at sufficiently low temperatures or at later stages of the plasma expansion [34].
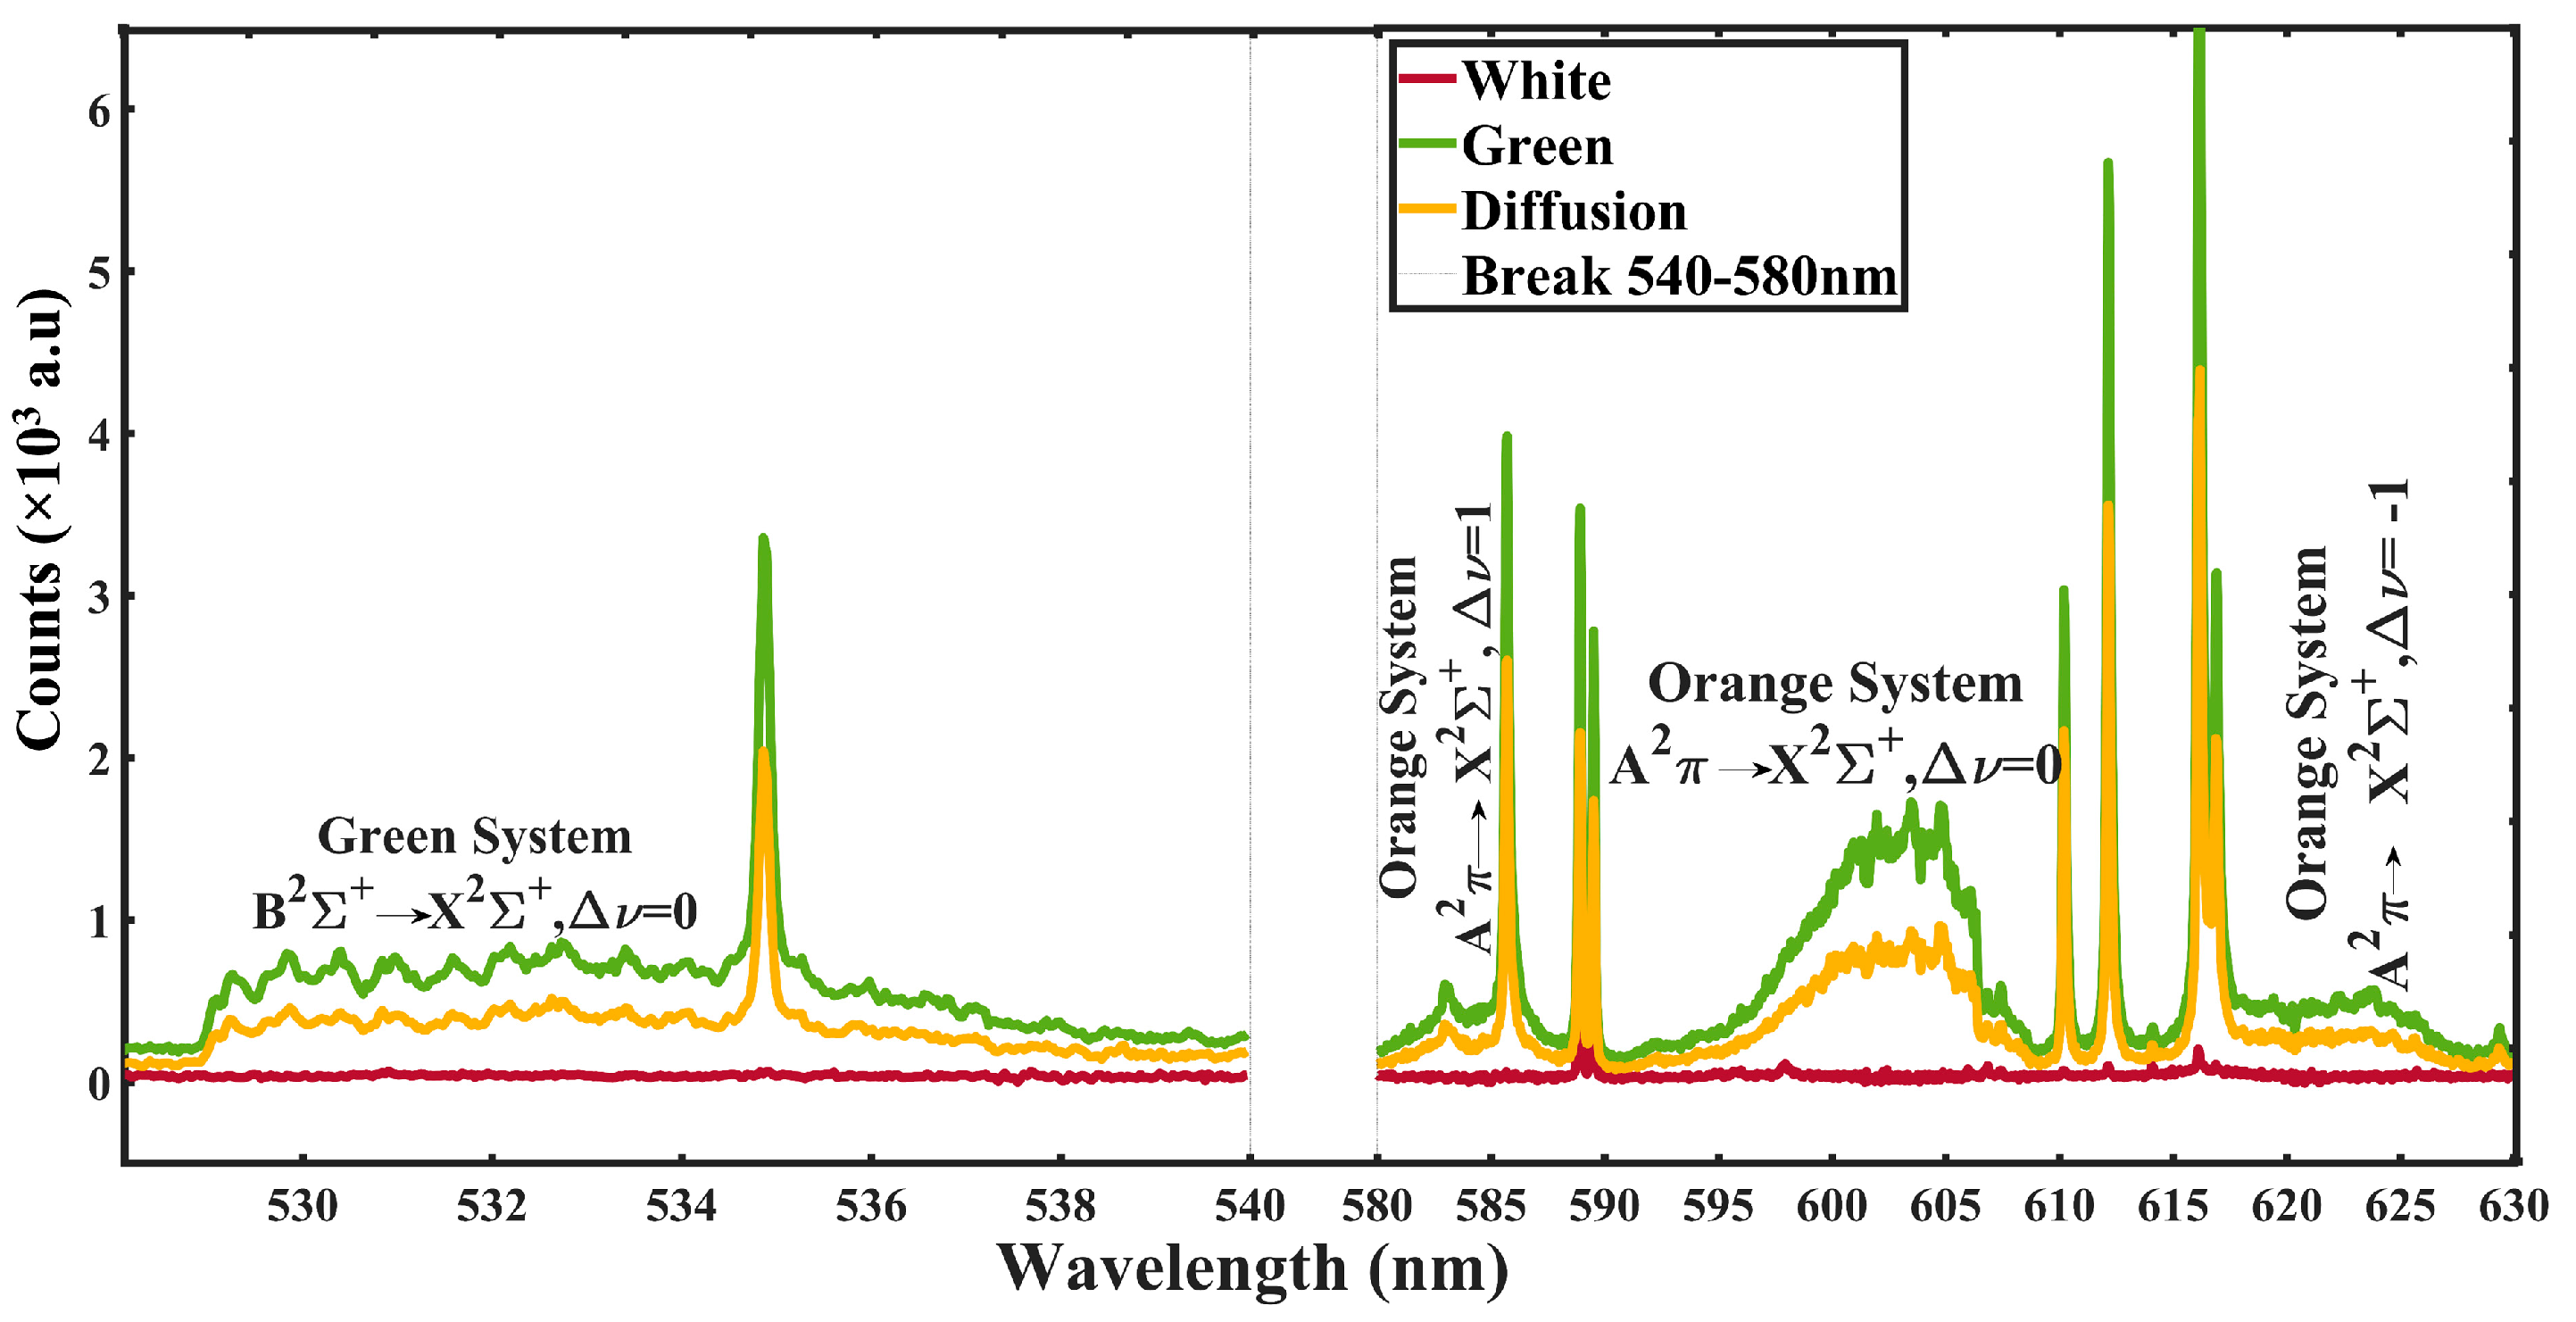
Since calcium has a high degree of molecular adhesion to non-metallic elements like F, the electronic bands of CaF molecules could be used to analyze F in the sample. It is reported that the higher concentrations of Ca, F, and O may result in the formation of molecular bands of CaF and CaO, thus, at an appropriate gate delay, the molecular signature of these molecules was observed in the LIBS spectra [35]. Figure 4 compares the molecular bands observed in three zones of the sample in the wavelength range of 528–630 nm. The presence of the molecular bands of CaF in the green and diffusion zones are also in accordance with the result of the previous section, i.e., the spectral lines of F at 685.5 nm, 690.2 nm, 690.9 nm, 703.7 nm, and 712.7 nm were observed in the LIBS spectra of green and diffusion zones, but not in the white zone. The CaF molecular bands of the sequence Δν = 0 are observed at 602.4–608.6 nm. These are the strongest bands of the CaF orange system A2Π–X2Σ. The strongest bands of the CaF green system, B2Σ–X2Σ of the sequence Δν = 0, are found in the spectral range between 529.1 nm and 542.2 nm [36]. It is clear from Figure 4 that the molecular bands of CaF were observed in the green and diffusion zones of the sample only, and the intensity of the bands of CaF is larger in the green region when it is compared to that in the diffusion region.
Table 3 lists the most intense band heads of the green and the orange systems of the CaF molecules observed in the present work. The electronic bands of the CaO molecules can be observed in the wavelength range of 600–610 nm (orange band system). As the dissociation energy of CaF (5.48 eV) is more than the dissociation energy of the CaO band is (4.7 eV), the formation of CaF is much more likely. No other molecular signatures were observed in the LIBS spectra of the sample.
The qualitative analysis using the spectral and molecular signatures reveals that the green zone is made up of calcium fluoride, whereas the white zone is made up of quartz, and the pale green zone is formed due to diffusion of quartz and fluorite minerals. This result supports the X-ray diffraction result that the white zone of the sample mainly consists of mineral quartz and the green zone consists of the mineral fluorite.

2.3.3. Time Evolution of CaF Molecular Band

The appearance of the electronic bands of the diatomic molecules in the LIBS spectra of the materials predominately depends on the gate delay of the detector concerning the plasma initiation [34]. Generally, in the LIBS spectra, the molecular bands are observed at a higher gate delay in comparison to the spectral lines of the elements. Although it completely depends on the constituent of the sample, roughly at a very short gate delay, the emission from the plasma is dominated by a strong continuum due to its high electron density, accessibility, and very high plasma temperature [37]. After that (at a slightly higher gate delay), as a consequence of the plasma expansion and the recombination process electron density decreases, and the emission lines started to rise. At this delay, the electron density is still high, and only the emission lines corresponding to ions or atomic transition with high energy-excited levels appeared in the LIBS spectra. Molecular band emissions occur approximately after 1 microsecond [37]. The molecular band emission that was measured at later times is from the recombination of species in the plasma.
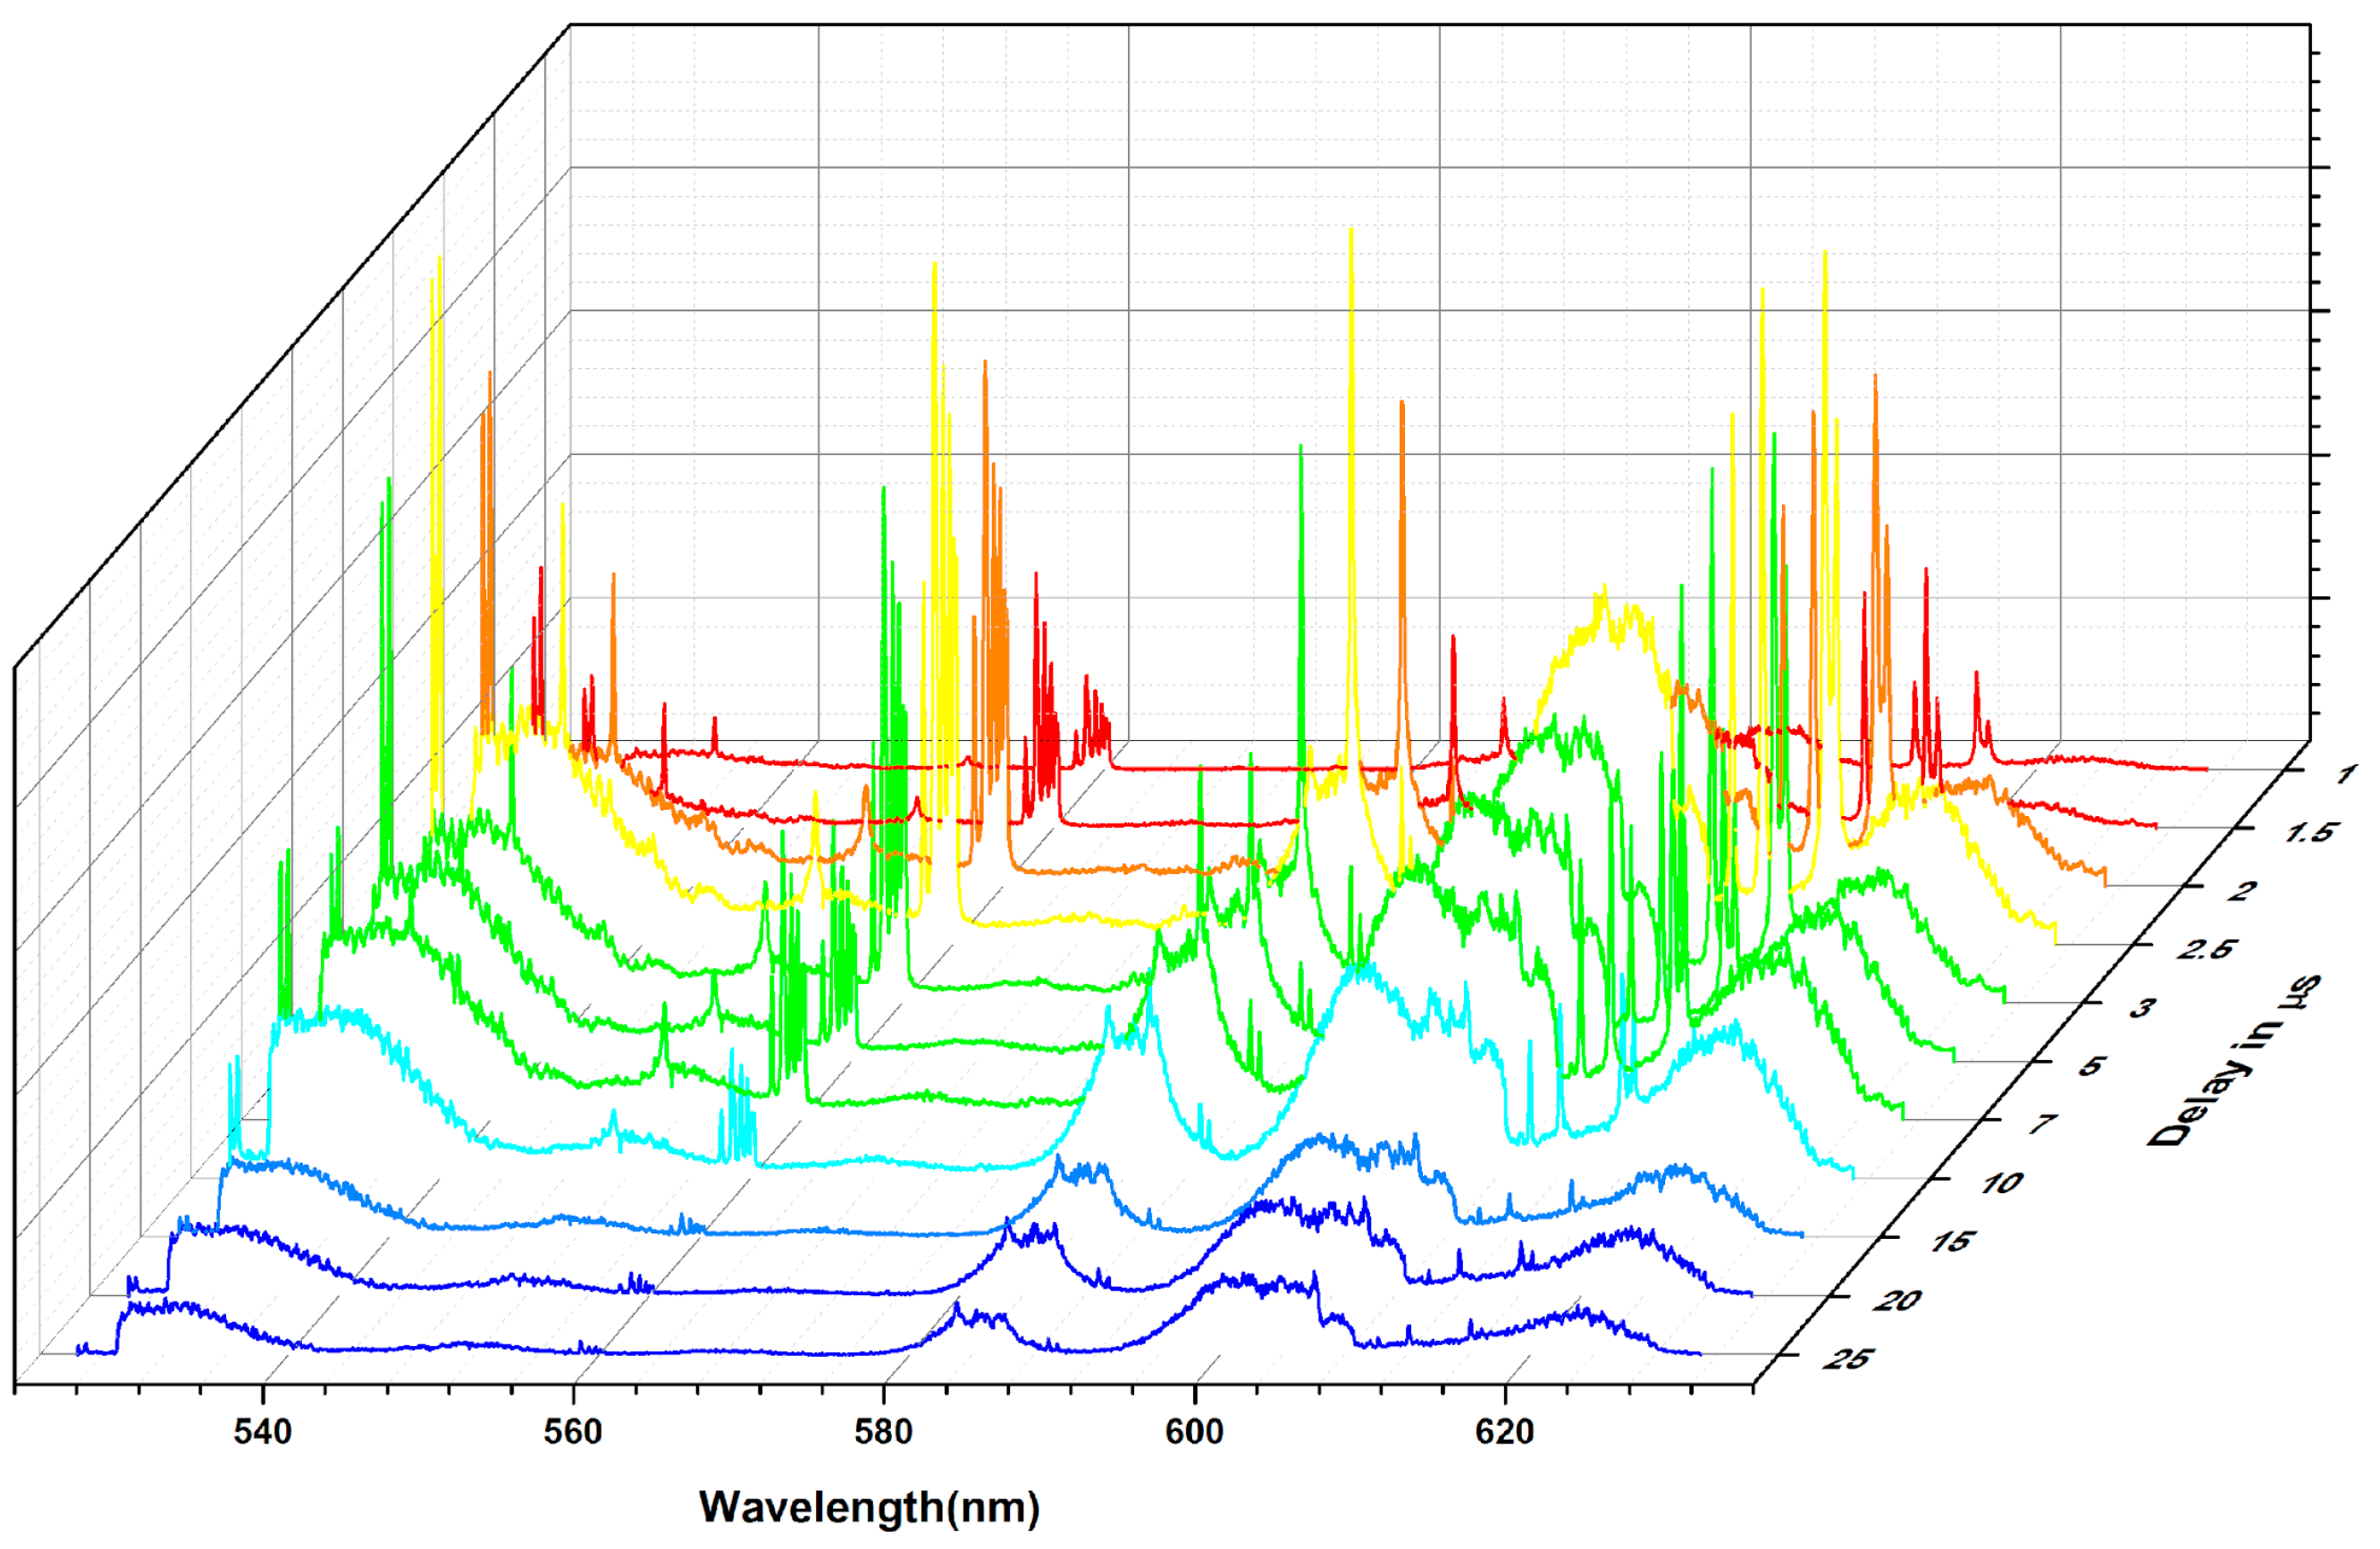
Therefore, the time evolution of the plasma emission has been analyzed to obtain a better intensity of the electronic bands of the CaF molecule in LIBS spectra of the fluorite (Green) zone of the sample. The LIBS spectra have been recorded at different gate delays and a constant gate width of 5 µs. The expanded view of the spectra in the wavelength range of 528–630 nm is shown in Figure 5. It is comprised of a range of CaF molecular bands and some atomic and ionic transitions of Na and Ca. The variation of the intensity of spectral lines of Na (588.9 nm and 589 nm) and Ca (558.8 nm, 559.0 nm, 559.5 nm, 559.9 nm, 610.2 nm, 612.2 nm, and 616.2 nm) at different gate delays is shown in this Figure 5.
To better understand the appearance of the atomic and ionic spectral lines and the molecular bands with an appreciable intensity in the LIBS spectra, we have measured the integrated intensity (Lorentzian fit) of the spectral lines of the ionic and atomic species and the molecular bands at different gate delays (shown in Figure 6). The interference-free atomic line of Ca at 612.2 nm, the ionic line of Ca at 373.7 nm, and the most intense band of CaF at 535.0 nm were chosen for the comparison. Figure 6 depicts that the intensity of the atomic line of Ca increased up to 2.5 µs, and then, it started decreasing, whereas the ionic lines of calcium at 373.7 nm showed a maximum intensity at 2 µs, and then, they decreased fast and vanished after 5 µs. Only the atomic lines and molecular bands dominate in the LIBS spectra after the 3 µs gate delay (Figure 6). The atomic line of Ca decreased slowly when it was compared to the ionic line of Ca. After 7 µs of the gate delay, the atomic line of calcium at 612.2 nm became very weak, and after 15 µs, it disappeared. When they were compared to the ionic and atomic lines, temporally broader molecular emissions of CaF have been observed. A CaF molecular emission appeared at a gate delay of 1 μs, and an intense band can be observed from 2.5 μs to 7 μs. After 10 μs, the CaF molecular band became very weak, and it decreased slowly after the gate delay of 15 µs. At the initial stage, a plasma molecular signature may appear in the LIBS spectra from the outer part of the plasma since the outer part of the plasma comparatively had a low temperature. As the gate delay increased, the plasma also cooled down, and thus, the intensity of the molecular emission increased. This is the reason that the molecular signature started appearing at 1 μs and stayed for a longer gate delay (up to 15 μs).

2.3.4. Evolution of Plasma Temperature and Plasma Density over Time

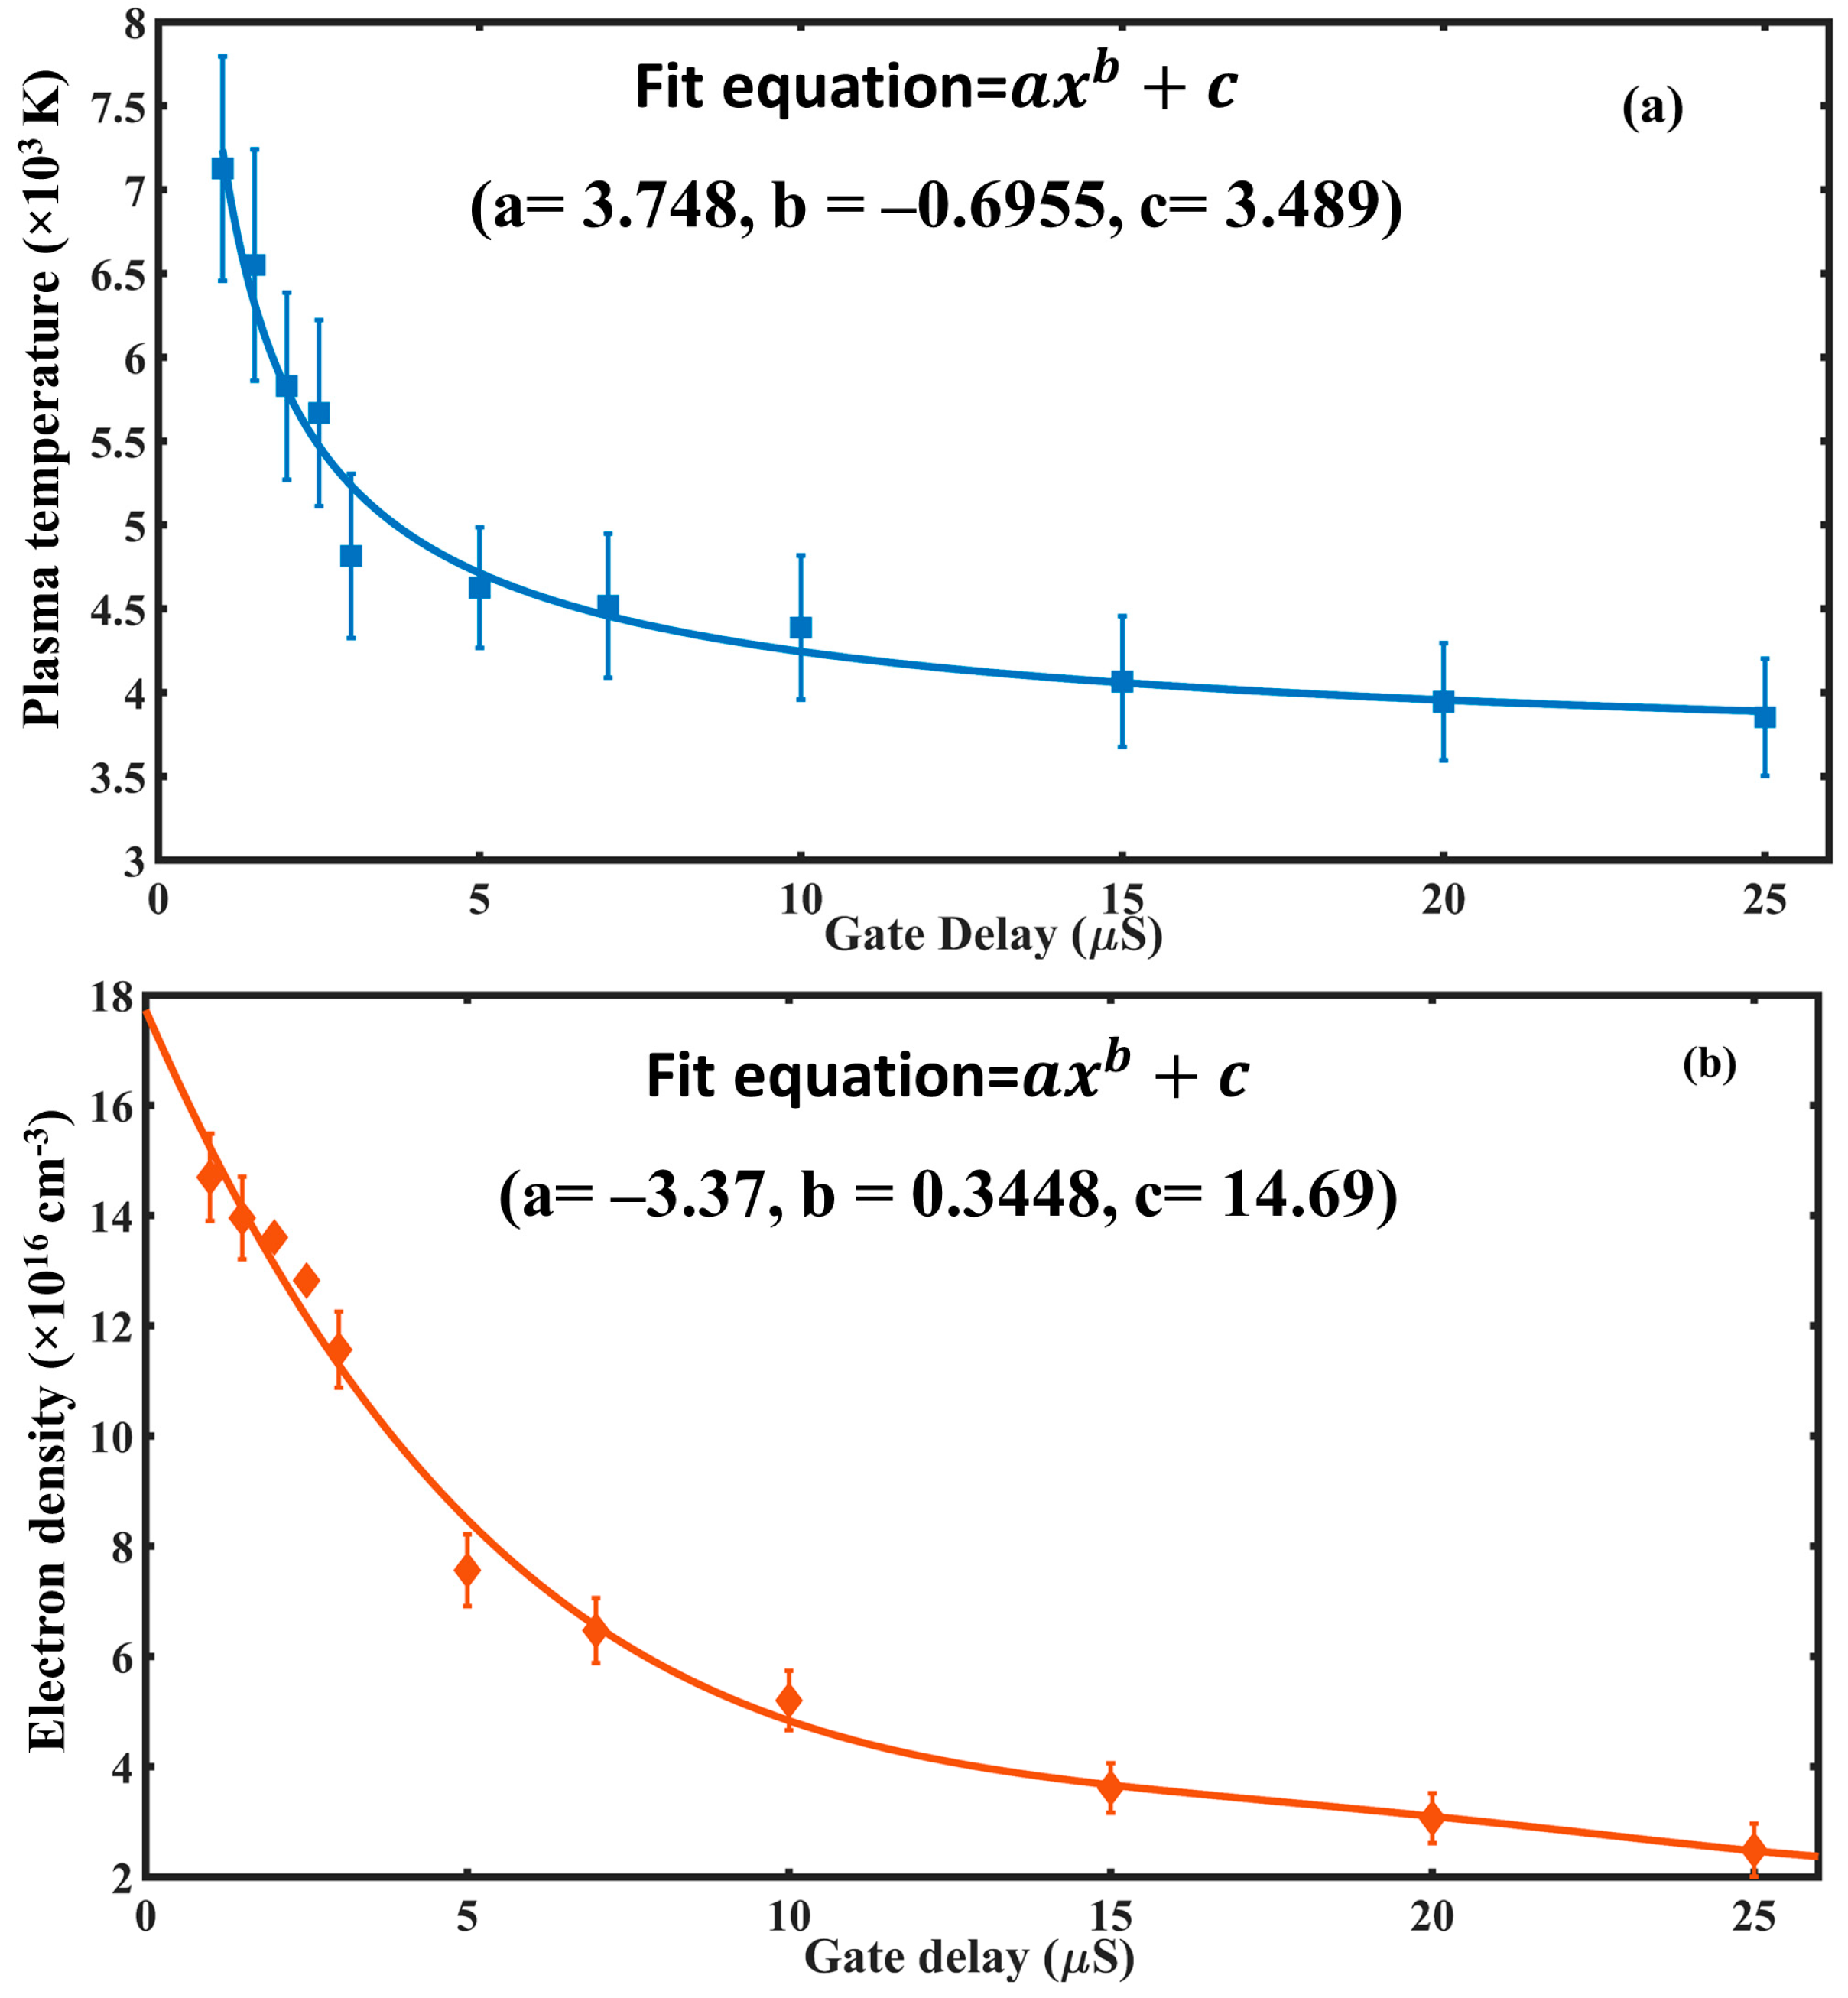
The plasma temperature and the plasma density are important parameters that can characterize the laser-induced plasma and estimate the influence of the matrix effect on the measurement [38,39]. In this work, the plasma temperature and the electron density have been calculated to understand the temporal behavior of the plasma and the molecular band intensity of the CaF. The electronic transitions follow Boltzmann’s relation, and using the Boltzmann plot, the plasma temperature was calculated. The procedure has been explained, elsewhere [24]. The Boltzmann plot was plotted using different spectral lines of one spectrum at a particular gate delay. The atomic transitions of calcium at 442.4, 443.5, 610.2, 612.2, 643.8, 644.8, 646.2, and 647.1 nm were used to draw the Boltzmann plot. The calculated plasma temperature at different gate delays is shown in Figure 7a.
Electron density is another essential plasma parameter that is used to describe the plasma environment, and it is also important for establishing thermodynamic equilibrium. Using the McWhirter criteria, the electron number density was calculated. The procedure is explained in other works [40]. A starkly broadened line profile of an atomic transition of Ca (442.5 nm) was used to measure the electron density. The stark broadening is especially strong for the Hα and Hβ spectral lines [41,42]. In this work, the spectral signatures of these lines are not significant enough at the increasing gate delays, making them less suitable for the analysis. So, the spectral emission of Ca I at 442.5 nm was selected to estimate the electron density. The electron density at different gate delays was calculated and plotted against different gate delays, as can be seen in Figure 7b. In Figure 7, the dots represent the experimental data points, and the solid line represents the fitted curve. The data points are fitted with a POWER2 fitting in the MATLAB, R2017a program, and the constants are provided in the figure. The uncertainties shown in Figure 7a,b were calculated from the standard deviation of ten measurements per sample from the Boltzmann plot in the case of temperature, and similarly, for the electron density. It is observed from Figure 7a that the plasma temperature decreased with an increase in the time delay.
At the 1 µs gate delay, the temperature was >7000 K, and then, it started decreasing slowly. After 15 µs, it decreased rapidly and reached a comparatively lower temperature of about 3000 K. A similar variation is shown in Figure 7b, which shows the evolution of the electron density with varying time delays. The electron density was high at 1 µs of the gate delay, and it decreased slowly up to 2.5 µs. After 15 µs, it decreased rapidly and reached a very low value at 30 µs. In the laser-induced plasma, the plasma evolved to be in a state of equilibrium with the external ambient environment by transferring the energy to the surrounding after importing/delivering the nanosecond laser pulse. As a consequence of this, the plasma temperature and the electron density decreased with time [37]. In the present work, the electron number density and the plasma temperature decreased with the time delay (Figure 7b), which supports the above statement. Diatomic molecules CN, C2, CO, and N2 are more stable when they are compared to CaF molecules. These molecules have a high dissociation energy when they are compared to CaF (CO-11.2 eV, N2-9.8 eV, CN-7.8 eV, C2-6.2 eV, and CaF-5.5 eV), so these molecular transitions are observed at the early stages of the plasma [36,37], whereas the dissociation energy of the CaF molecular band is low, and this might be because the intense bands of the CaF molecule were observed at the later stages of the plasma where the plasma temperature and electron density were moderate. Vogt et al. [16] calculated the excitation temperature and electron density at different laser pulse energy values and found that these parameters stayed nearly constant with the variation of the pulse energy. When one is keeping this in mind, only the influence of time evolution on the plasma parameters has been demonstrated.

2.4. Analysis of Compounds Present in the Quartz-Fluorite Composite Using PAS and UV-VIS Spectroscopy

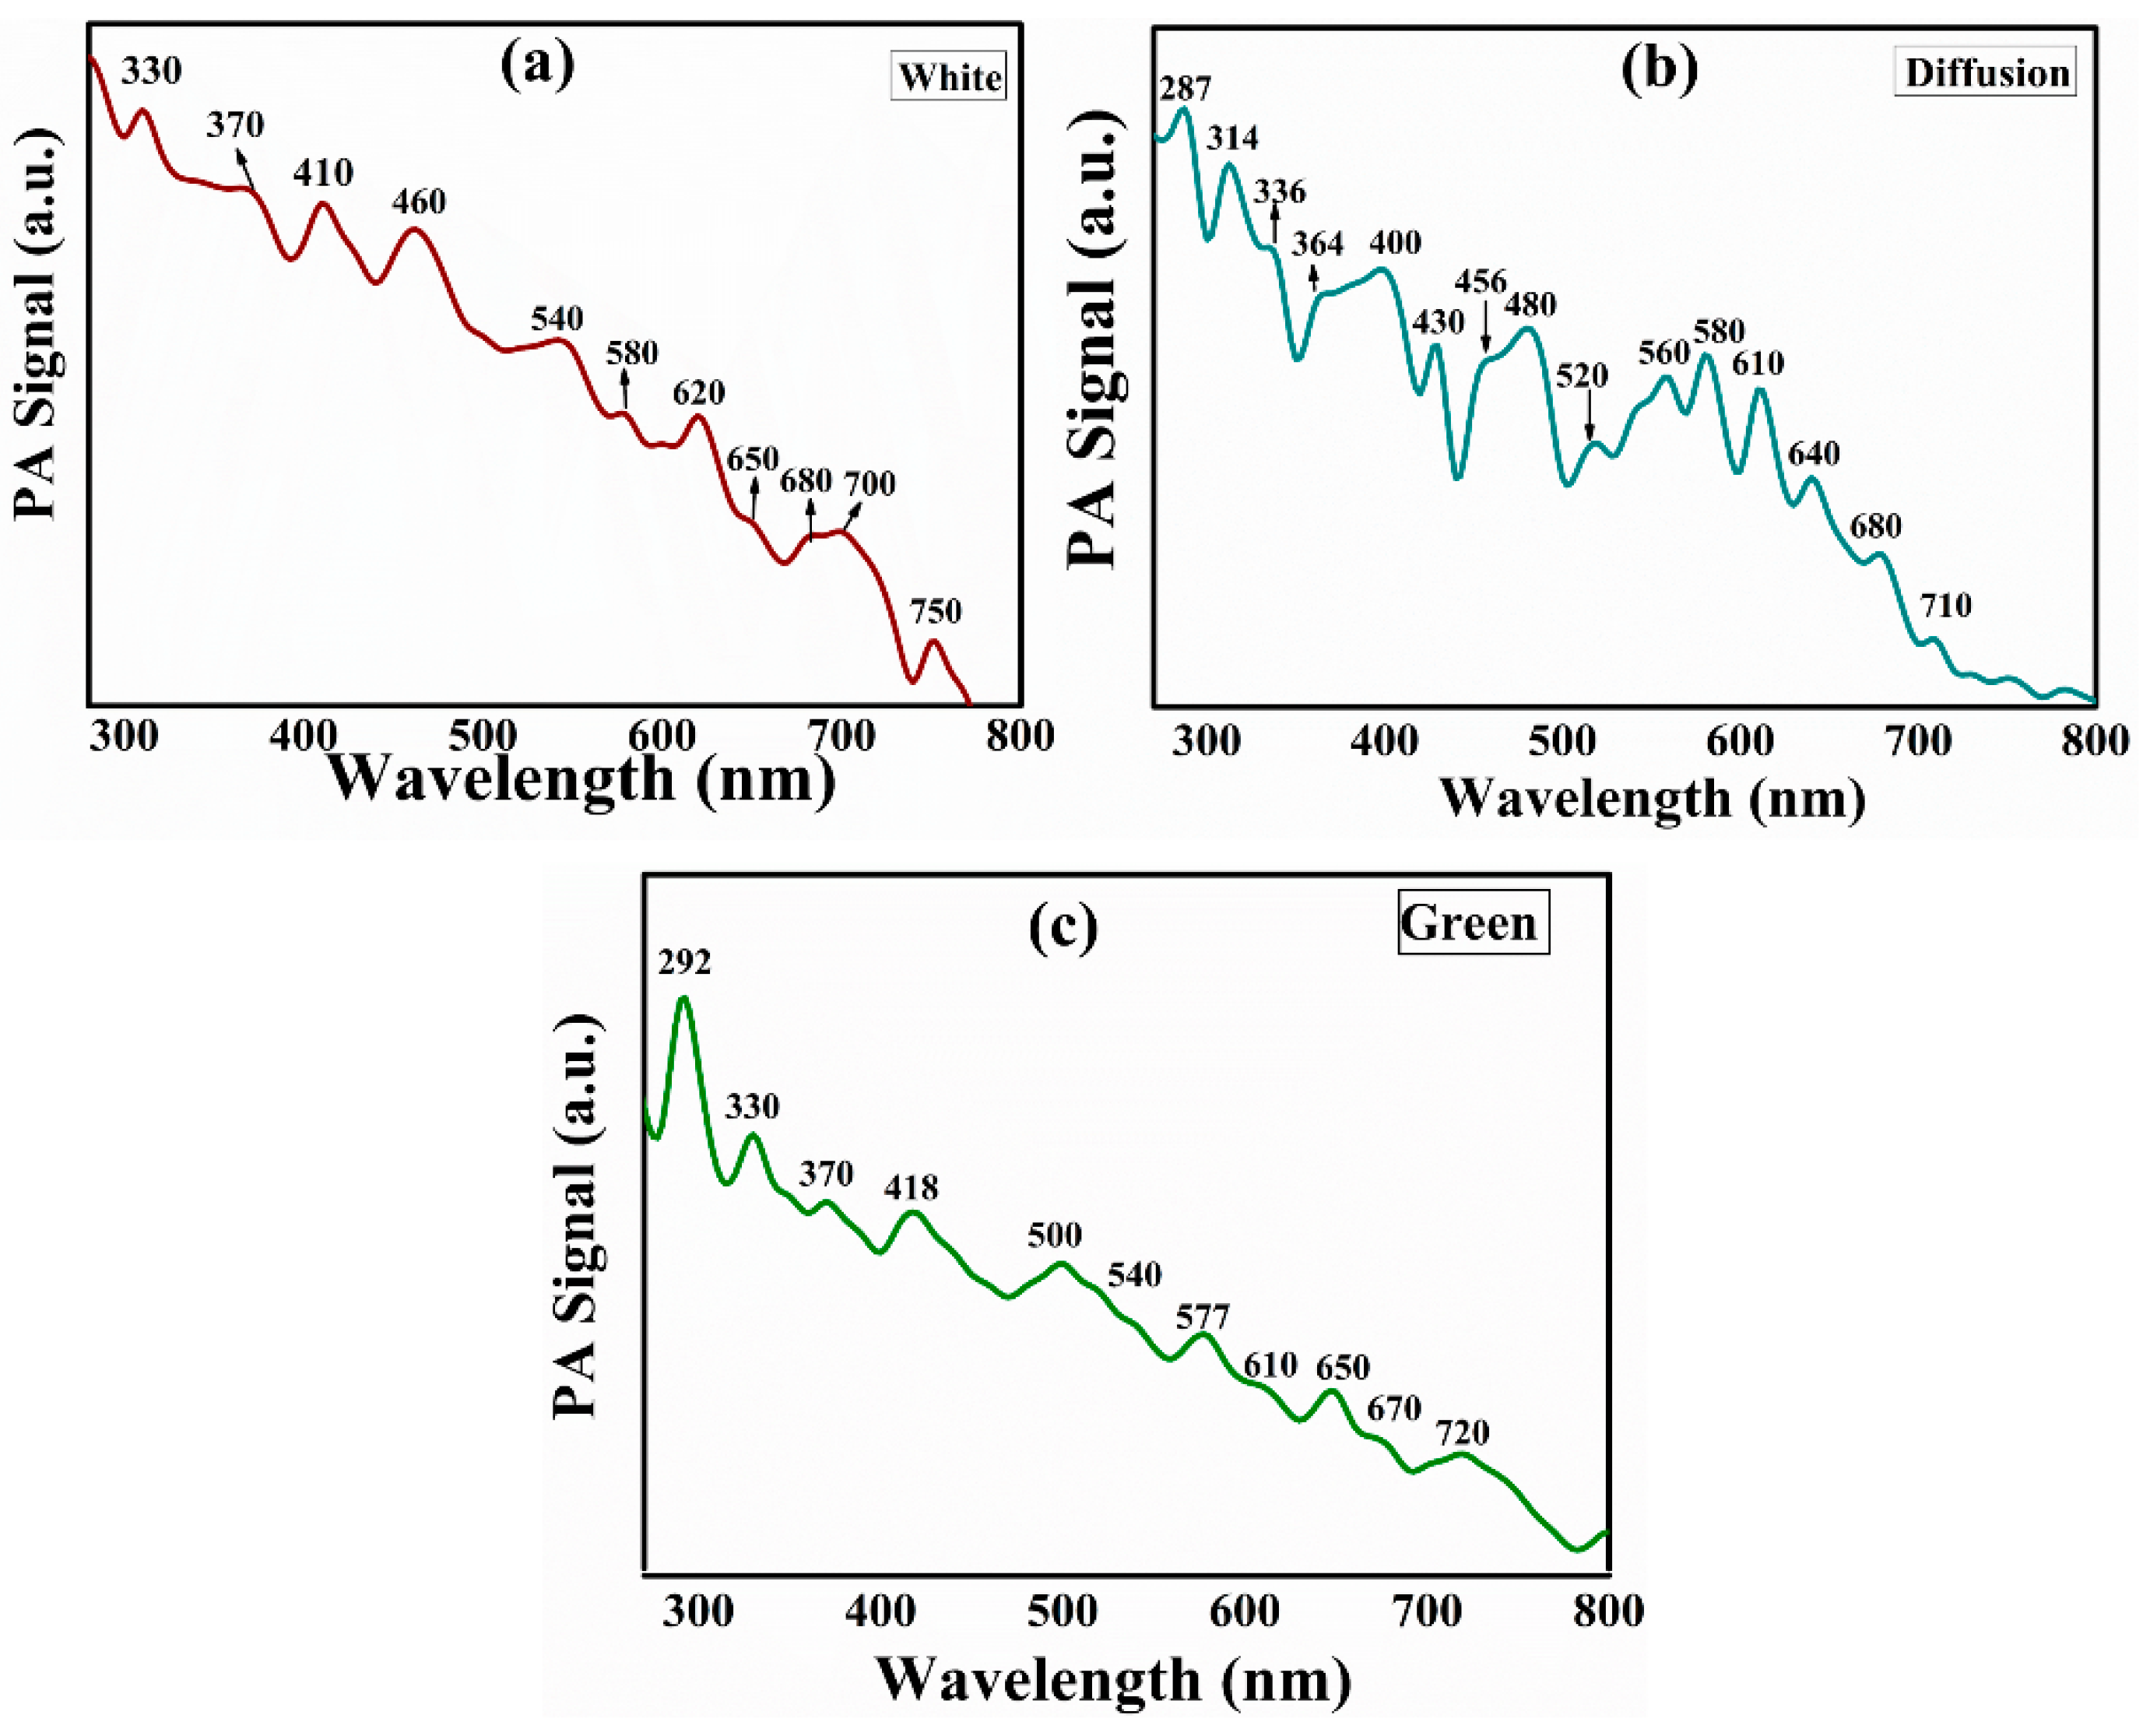
Since in the LIBS spectra the electronic bands of CaF molecule were only observed in the green zone and the diffusion zone of the sample, it is essential to obtain information about the presence of the molecular compounds in the different zones of the sample. In the present manuscript, Photoacoustic Spectroscopy (PAS) and UV-VIS spectroscopy have been used for the molecular analysis of the different zones of the sample. Three replicate PAS spectra were used to obtain one spectrum, and the process was repeated for each zone of the sample. The PAS spectra for each part of the samples are shown in Figure 8. The PA spectra of the white zone (Figure 8a) shows peaks at 330, 370, 410, 460, 540, 580, 620, 650, 680, 700, and 750 nm, while the PA spectra of the green zone (Figure 8b) shows peaks at 292, 330, 370, 418, 500, 540, 577, 610, 650, 670, and 720 nm. The diffusion zone (Figure 8c) contains PA peaks at 287, 314, 336, 364, 400, 430, 456, 480, 520, 560, 580, 610, 640, 680, and 710 nm, which are also present in the PA spectra of the white and green zones. For the identification of these absorption bands, the UV-VIS spectra of three zones of the sample were recorded, and these are shown in Figure 9. Further, for confirmation of the SiO2 molecule absorbance of pure SiO2 was also recorded, and this is shown in Figure 9d. The UV-Vis Spectra of the white part and pure SiO2 show nearly the same spectral signatures (bands), which are identified as the absorbance of SiO2 [43]. The PA signals at 330 nm, 460 nm, 620 nm, 650 nm, 700 nm, and 750 nm in the white zone corresponds to the bands of quartz as these are also observed in the UV-VIS absorption spectra of quartz [44]. The PA signals at the wavelengths 330 nm, 370 nm, 418 nm, 540 nm, 570 nm, and 610 nm in the green zone (Figure 9b) correspond to the absorption bands of the fluorite [45,46,47]. When the absorbance spectra of the diffusion zone are compared to the white and green zones, it is clear that it contains peaks corresponding to both quartz and fluorite. The PA spectrum of the diffusion zone contains peaks at 336 nm, 400 nm, 456 nm, 480 nm, 560 nm, 580 nm, 640 nm, and 680 nm, which correspond to the absorption bands of quartz and fluorite, which is shown in Figure 9. In comparison to the UV-VIS spectra, the PAS has a few more bands because the PA signal can be observed due to non-radiative transitions.
Thus, the molecular analysis of the quartz-fluorite composite using PAS and UV-VIS spectroscopy also confirms that the white part of the sample corresponds to the quartz mineral, while the green zone of the sample is composed of fluorite mineral. The diffusion zone may be formed by the composition of both quartz and fluorite.

2.5. Chemometric Methods

Principal Component Analysis of LIBS Data

Principal Component Analysis (PCA) is a simple but influential multivariate technique that can be employed together with other spectroscopic data to classify a large number of samples. In this work, PCA very proficiently divides the LIBS data of the sample into three clusters (groups), indicating that the sample has three regions/zones with different mineral compositions. Seventeen spectra of each zone were used to construct the data matrix of 51 × 24,859 for analysis purposes. The Unscrambler-X 10.1 software (CAMO Software India Pvt. Ltd.) solved the data matrix to generate the PCA score and the loading plot. The Non-linear Iterative Partial Least Squares (NIPALS) algorithm was applied for the PCA with standardizing processes as part of the pre-processing method. Figure 10a demonstrates the LIBS spectral data score for all of the sample zones in the 240–850 nm wavelength range. Three distinct groups are observed in the 3-D score plot. The similar spectra were clustered together in the different groups according to their spectral similarity. PC1 with 79% variance in the data matrix demonstrates that the spectra of the white zone are positively correlated, and the green and diffusion zones are negatively correlated. The loading plots of PC1 and PC2 demonstrate the contribution of the spectral lines of Si, Ca, and O, and Si, Mg, and Ca, respectively (Figure 10b,c).
A different wavelength range of 530–630 nm was selected to utilize the CaF molecular band for applying the PCA. The results show that the PC1 explains 79% of the variance (Figure 10). However, when the PCA is applied in the wavelength region (535.6–635 nm) of the CaF molecular band, the results improved from 79% to 97% for PC1 (Figure 11). This indicates that the molecular band of CaF and the spectral lines of Ca and F are mainly responsible for the separation of the three regions of the sample in the score plot.
It is well reported that quartz minerals can show different colors in a single sample due to there being some trace elements. The sample that was studied in this work can be confused with quartz mineral, but by using a PCA, we can easily divide this sample into three zones. Using a PCA, other composite samples can analyzed very quickly. The library that was created in this work can be used to investigate other quartz-fluorite composites.

3. Materials and Methods

3.1. Sample Collection and Description

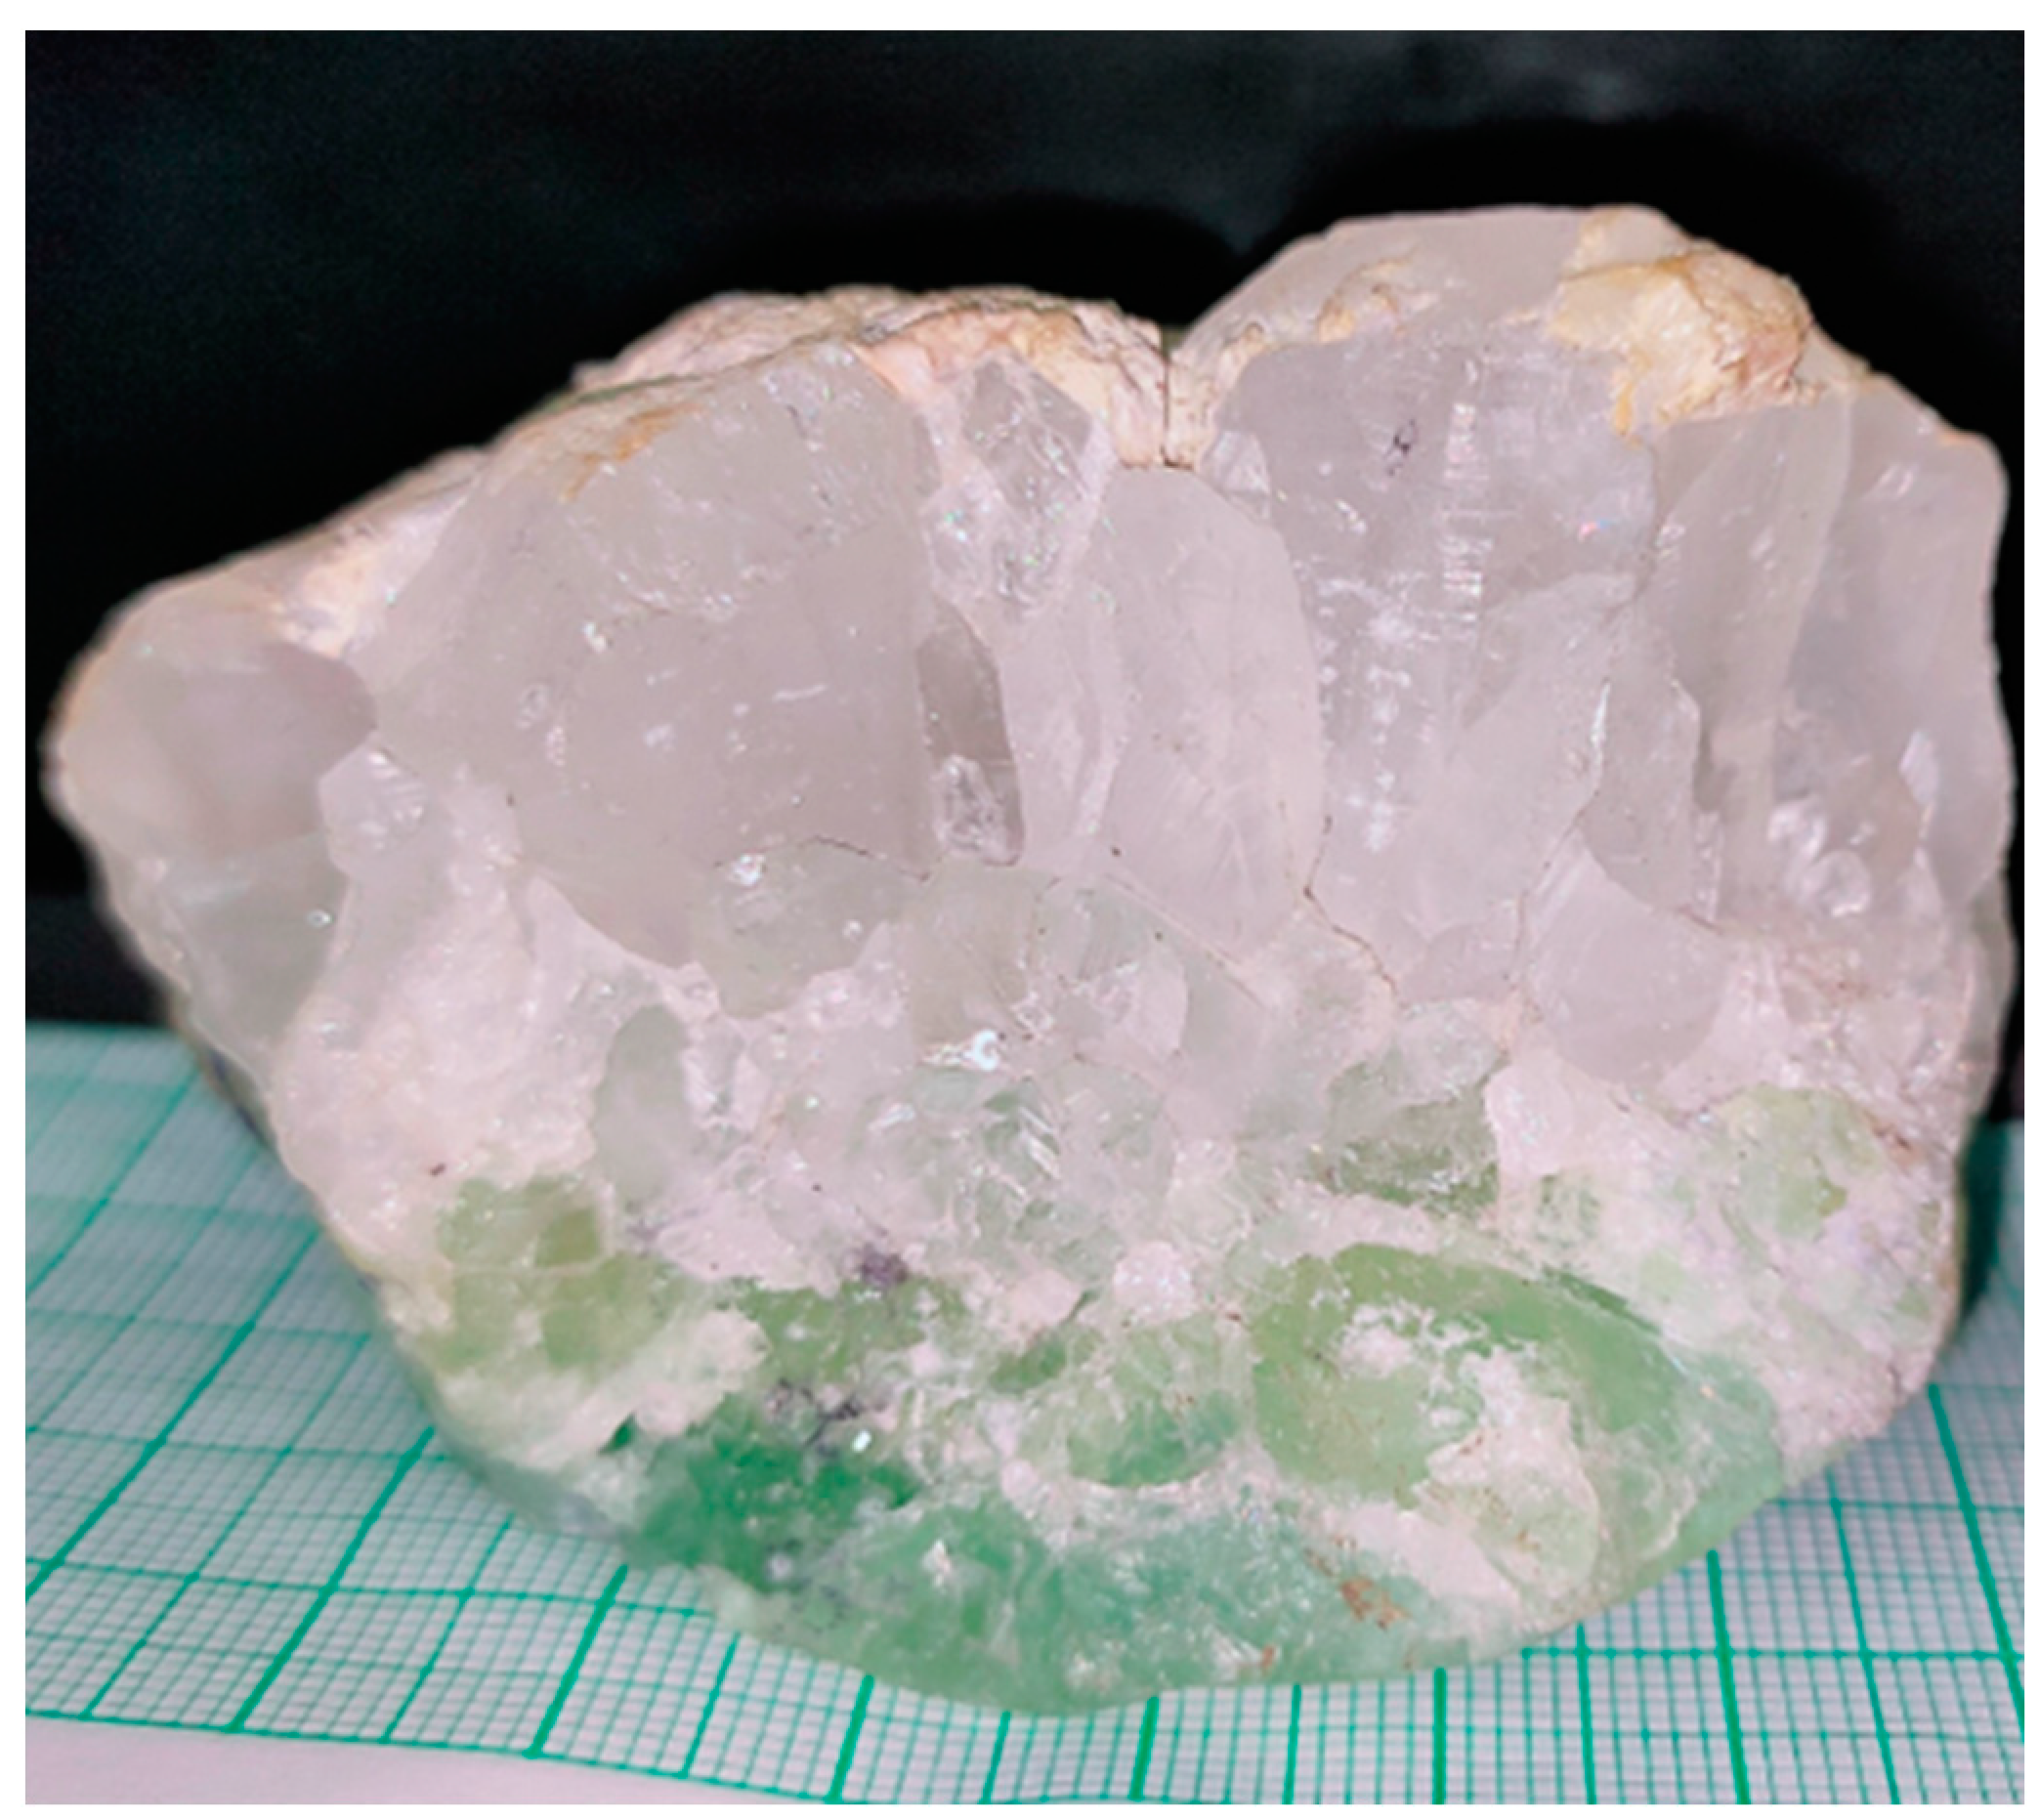
The sample quartz-fluorite aggregate (Figure 12) was obtained from amygdaloidal basalt, Deccan Traps, India. The sample dimensions were 6 cm × 5 cm × 4.5 cm and it weighed 315 g. This sample had three visibly distinct colored domains/zones. One zone was milky white (N8/0.5), and another one was green (10G Y/6 after Munsell® Colour Chart, Geological Society of America, Boulder, CO, USA) in color. There was another visible pale green (diffusion) zone which was observed between these two minerals (Figure 1).

3.2. X-ray Diffraction (XRD)

The white, green, and pale green portion of the sample were broken, and the fragments were handpicked under a binocular zoom microscope. The samples were crushed to make fine and homogenous powder samples using a planetary ball mill. The dried powder was used for the XRD measurement. The XRD pattern of the samples was recorded with the help of an XRD diffractometer (Philips Pan Analytical X-PERT PRO Germany;) using CuKα radiation (8.04 keV) and Ni filter at the National Centre of Experimental Mineralogy and Petrology (NCEMP), University of Allahabad. The samples were scanned in the range between 20° and 70° with a speed of 6° per minute and a step size of 0.02°.

3.3. Electron Microprobe Analyzer (EPMA)

Three thin polished sections were prepared from the sample. Then, the stubs were prepared with the help of epoxy. A sputter coat of carbon corresponding to a thickness of 20 ± 1 nm of graphite rod was applied. The back-scattered electron images were acquired using a scanning microscope (Model; JEOL JXA-8100 Superprobe) at the National Centre of Experimental Mineralogy and Petrology (NCEMP), University of Allahabad, Prayagraj, India. The elemental analyses were performed using both ED (Energy Dispersive) and WD (Wavelength Dispersive) spectrometers.

3.4. LIBS Analysis

The experimental setup that was used to record the Laser-induced Breakdown (LIB) spectra of the sample has already been explicitly described, elsewhere [22,23]. The different components of the experimental setup were: we used (i) a laser source (Continuum Surelite III-10), (ii) a translational stage (Sandvic Components, New Delhi, India) which was placed on a jack (Sandvic Components, India) for the continuous motion of sample, (iii) a collection optics (CC52 collimator, Andor Technology, Belfast, United Kingdom) attached with a fiber cable of 50-micron size, and (iv) a Mechelle spectrograph (ME5000, Andor Technology) equipped with a time-gated intensified charge-coupled device camera (iStar334, Andor Technology, Belfast, United Kingdom).
A frequency-doubled Nd-YAG laser source of wavelength 532 nm and pulse width of 4 ns were used. It had a variable repetition rate of 1–10 Hz, and the energy of the laser was optimized for the best signal-to-noise ratio at 15 mJ/pulse. A convex lens of 15 cm was used to focus the laser beam at the sample surface to create a plasma plume. The sample-to-lens distance was optimized to avoid atmospheric contamination/interference. The characteristic photons emitted from the plasma plume were collected by the collimator at an angle of 45° to the laser beam and fed to the spectrograph having a spectral resolution of (λ/Δλ) 6000 and a slit size of 50 × 50 µm using optical fiber. The Intensified Charged Couple Device (ICCD) which was used for the detection produced 1024 × 1024 active pixels, and the effective pixel size was 19.5 × 19.5 µm. The signal-to-noise ratio was improved by integrating one hundred successive laser shots to produce a single spectrum. After every shot, the sample was moved during the translational stage to avoid crater formation occurring at the sample surface.

3.5. Photoacoustic and UV-Vis Spectroscopy

The molecular identification was performed by PAS. The photoacoustic (PA) spectra of the white, green, and diffusion zones have been recorded in the wavelength range 260–900 nm using the experimental setup that is described, elsewhere [48]. To validate the results of the PAS, the absorption spectra were also recorded for the three zones of the same sample. To record the absorbance spectra, a D2-H source (RIDH2000, Research India, Bhopal, India) and fiber spectrometer (RIAFS-C, Research India, optical resolution 0.03 nm) were used. The UV-VIS spectrum of the quartz crystal was verified by recording the absorbance spectra of the SiO2 powder (CDH, New Delhi, India, 99.9% pure).

3.6. Chemometric Methods

Chemometric/multivariate methods can be used along with spectroscopic studies in various fields to explore various aspects [49,50]. In the present work, a chemometric method, the Principal Component Analysis (PCA), was used for maximizing the information that was extracted from the LIBS spectral data. A PCA is an unsupervised model which reduces the dimensionality/features of huge datasets by retaining its optimum information. A matrix of spectral features was formed in this method, and a mathematical transformation transformed it into a new matrix. This involved the decomposition of the covariance matrix eigenvectors, keeping most of the information in the first few dimensions.

4. Conclusions

The presence of quartz, fluorite, and a mixed zone (diffusion zone) was certified in a single geological sample using the LIBS technique. The results that were obtained by the LIBS were verified/validated using the XRD and EPMA techniques. Unlike the XRD and EPMA methods, the LIBS one combined with chemometric techniques provides the in situ (without removing the materials from the original sample), rapid investigation of critical mineral associations, such as quartz-fluorite, without any sample preparations or sample loss occurring. Constituents of quartz and fluorite are easily identified by the presence of the spectral lines of Si, Ca, and F. The molecular bands of CaF molecule that are present in the LIBS spectra of the green zone of the sample confirms the presence of the fluorite mineral. The quantification of F in any material is challenging due to the presence of weak spectral lines of fluorine in the UV-Visible region (the examined region). The experimental result of the present manuscript reveals that the barrier/hurdles of the quantification of fluorine can be removed by evaluating the intensity of the electronic bands of CaF that are present in the LIBS spectra of fluorite. Time-resolved spectra were recorded to obtain the moderate intensity of the electronic bands of the CaF molecules. The results illustrate that the formation of electronic bands of the CaF molecules started at an early stage of the plasma, but the bands of the CaF molecules which had a good intensity value were observed at a later stage of plasma formation. The temporal evolution of plasma temperature and plasma density demonstrate that a ≈6000 K temperature is appropriate for the CaF emission. PAS and UV-VIS spectroscopy were used to identify the molecular compounds, and the results of these techniques confirm that the white zone is made of quartz and the green zone is made of fluorite minerals, whereas the diffusion zone contains quartz as well as fluorite. The PCA divided the LIBS data in three clusters of different zones (white/quartz, pale/diffusion, and green/fluorite), making them completely distinguishable from each other. The loading plots of PC1 and PC2 provide the evidence that the presence of the spectral lines of Si, Ca, and F with different intensities is responsible for the separation. The PCA results also provide the information that the molecular band of the CaF is one of the factors that is responsible for forming these clusters.
Thus, the result of the present manuscript is helpful in identifying the variation of the minerals in the different zones, i.e., how the minerals gradually vary from the white zone (quartz) to the pale green zone (association/diffusion), and then, finally to the green zone (fluorite), continuously. The mineral profile at the diffused region of the mineral composite is difficult to analyze using conventional spectroscopic techniques. However, LIBS can be used to easily analyze different mineral composites (especially the diffusion part) which can further give an idea of appropriate formation conditions of the mineral composites. In conventional spectroscopic techniques, the sample preparation is a lengthy and time-consuming process, and the sample is destroyed in it. Thus, the results of this work are promising for the study of in situ profile sections (varies from a few microns to centimeters in size) without the sample destruction occurring, using the point detection capability of LIBS.
Th use of this technique is feasible for the detection of elements in geological samples. Crucial joints of rocks and minerals can be quickly investigated using LIBS when it is coupled with the chemometric approach.

Author Contributions

Conceptualization, S.D.; methodology, S.D. and M.M.D.; formal analysis, S.D.; investigation, S.D. and R.K., M.M.D.; resources, J.K.P., A.K.R. (Abhishek Kumar Rai); data curation, S.D.; writing—original draft preparation, S.D.; writing—review and editing, R.K., A.K.R. (Abhishek Kumar Rai), J.K.P. and A.K.R. (Awadhesh Kumar Rai);supervision, A.K.R. (Awadhesh Kumar Rai); All authors have read and agreed to the published version of the manuscript.

Funding

This research received no external funding.

Acknowledgments

Sonali Dubey is thankful to University Grants Commission, New Delhi for a Fellowship, and Rohit Kumar is thankful to University Grants Commission, New Delhi for the start-up Grant (F.30-461/2019BSR).

Conflicts of Interest

The authors declare no conflict of interest.

References

  1. Götze, J. Chemistry, Textures and Physical Properties of Quartz—Geological Interpretation and Technical Application. Mineral. Mag. 2009, 73, 645–671. [Google Scholar] [CrossRef]
  2. Rossman, G.R. Chapter 13. Colored Varieties of the Silica Minerals; De Gruyter: Berlin, Germany, 2018; pp. 433–468. ISBN 978-1-5015-0969-8. [Google Scholar]
  3. Yermakov, N.P. Research on the Nature of Mineral-Forming Solutions: With Special Reference to Data from Fluid Inclusions; Elsevier: Amsterdam, The Netherlands, 2013; ISBN 978-1-4831-6497-7. [Google Scholar]
  4. Roedder, E. Reviews in mineralogy. In Fluid Inclusions: An Introduction to Studies of All Types of Fluid Inclusions, Gas, Liquid, or Melt, Trapped in Materials from Earth and Space, and Their Application to the Understanding of Geologic Processes; Mineralogical Soc. of America: Blacksburg, VA, USA, 1984; ISBN 978-0-939950-16-4. [Google Scholar]
  5. Pattrick, R.A.D. TJ Shepherd, AH Rankin and DHM Alderton A Practical Guide to Fluid Inclusion Studies. Glasgow and London (Blackie), 1985. Xi + 239 Pp. Price £26. Mineral. Mag. 1986, 50, 352–353. [Google Scholar] [CrossRef]
  6. Leeder, O.; Thomas, R.; Klemm, W. Einschlüsse in Mineralen; Dt. Verl. f. Grundstoffind: Leipzig, Germany, 1987; ISBN 978-3-342-00088-4. [Google Scholar]
  7. Van den Kerkhof, A.M.; Kronz, A.; Simon, K.; Scherer, T. Fluid-Controlled Quartz Recovery in Granulite as Revealed by Cathodoluminescence and Trace Element Analysis (Bamble Sector, Norway). Contrib. Mineral. Petrol. 2004, 146, 637–652. [Google Scholar] [CrossRef]
  8. Van den Kerkhof, A.M.; Hein, U.F. Fluid Inclusion Petrography. Lithos 2001, 55, 27–47. [Google Scholar] [CrossRef]
  9. Thomas, R.; Blankenburg, H.-J. Thermometrische Untersuchungen an Silikatischen Glaseinschlüssen in Rhyolithquarzen. Freib. Forschungshefte. Reihe C 1986, 402, 69–103. [Google Scholar]
  10. Manley, C.R. Morphology and Maturation of Melt Inclusions in Quartz Phenocrysts from the Badlands Rhyolite Lava Flow, Southwestern Idaho. Am. Mineral. 1996, 81, 158–168. [Google Scholar] [CrossRef]
  11. Zhang, G.; Gao, Y.; Chen, W.; Liu, D. The Role of Water Glass in the Flotation Separation of Fine Fluorite from Fine Quartz. Minerals 2017, 7, 157. [Google Scholar] [CrossRef] [Green Version]
  12. Salazar, K. Mineral Commodity Summaries 2013; US Geological Survey (USGS): Reston, VA, USA, 2013. [Google Scholar]
  13. Forni, O.; Gaft, M.; Toplis, M.J.; Clegg, S.M.; Maurice, S.; Wiens, R.C.; Mangold, N.; Gasnault, O.; Sautter, V.; Le Mouélic, S.; et al. First Detection of Fluorine on Mars: Implications for Gale Crater’s Geochemistry. Geophys. Res. Lett. 2015, 42, 1020–1028. [Google Scholar] [CrossRef]
  14. Gaft, M.; Nagli, L.; Eliezer, N.; Groisman, Y.; Forni, O. Elemental Analysis of Halogens Using Molecular Emission by Laser-Induced Breakdown Spectroscopy in Air. Spectrochim. Acta Part B At. Spectrosc. 2014, 98, 39–47. [Google Scholar] [CrossRef]
  15. Alvarez-Llamas, C.; Pisonero, J.; Bordel, N. Quantification of Fluorine Traces in Solid Samples Using CaF Molecular Emission Bands in Atmospheric Air Laser-Induced Breakdown Spectroscopy. Spectrochim. Acta Part B At. Spectrosc. 2016, 123, 157–162. [Google Scholar] [CrossRef]
  16. Vogt, D.S.; Schröder, S.; Rammelkamp, K.; Hansen, P.B.; Kubitza, S.; Hübers, H.-W. CaCl and CaF Emission in LIBS under Simulated Martian Conditions. Icarus 2020, 335, 113393. [Google Scholar] [CrossRef]
  17. Klemme, S.; Berndt, J.; Mavrogonatos, C.; Flemetakis, S.; Baziotis, I.; Voudouris, P.; Xydous, S. On the Color and Genesis of Prase (Green Quartz) and Amethyst from the Island of Serifos, Cyclades, Greece. Minerals 2018, 8, 487. [Google Scholar] [CrossRef] [Green Version]
  18. Tailby, N.D.; Cherniak, D.J.; Watson, E.B. Al Diffusion in Quartz. Am. Mineral. 2018, 103, 839–847. [Google Scholar] [CrossRef]
  19. Rottier, B.; Rezeau, H.; Casanova, V.; Kouzmanov, K.; Moritz, R.; Schlöglova, K.; Wälle, M.; Fontboté, L. Trace Element Diffusion and Incorporation in Quartz during Heating Experiments. Contrib. Mineral. Petrol. 2017, 172, 23. [Google Scholar] [CrossRef]
  20. Graupner, T.; Mühlbach, C.; Schwarz-Schampera, U.; Henjes-Kunst, F.; Melcher, F.; Terblanche, H. Mineralogy of High-Field-Strength Elements (Y, Nb, REE) in the World-Class Vergenoeg Fluorite Deposit, South Africa. Ore Geol. Rev. 2015, 64, 583–601. [Google Scholar] [CrossRef]
  21. Rai, A.K.; Yueh, F.-Y.; Singh, J.P. Laser-Induced Breakdown Spectroscopy of Molten Aluminum Alloy. Appl. Opt. AO 2003, 42, 2078–2084. [Google Scholar] [CrossRef]
  22. Rai, A.K.; Pati, J.K.; Parigger, C.G.; Dubey, S.; Rai, A.K.; Bhagabaty, B.; Mazumdar, A.C.; Duorah, K. The Plasma Spectroscopic Study of Dergaon Meteorite, India. Molecules 2020, 25, 984. [Google Scholar] [CrossRef] [Green Version]
  23. Dubey, S.; Kumar, R.; Rai, A.K.; Pati, J.K.; Kiefer, J.; Rai, A.K. Rapid Analysis of Chemical Composition and Physical Properties of Gemstones Using LIBS and Chemometric Technique. Appl. Sci. 2021, 11, 6156. [Google Scholar] [CrossRef]
  24. Maurya, G.S.; Kumar, R.; Kumar, A.; Rai, A.K. Analysis of Impurities on Contaminated Surface of the Tokamak Limiter Using Laser Induced Breakdown Spectroscopy. Spectrochim. Acta Part B At. Spectrosc. 2016, 126, 17–22. [Google Scholar] [CrossRef]
  25. Fabre, C. Advances in Laser-Induced Breakdown Spectroscopy Analysis for Geology: A Critical Review. Spectrochim. Acta Part B At. Spectrosc. 2020, 166, 105799. [Google Scholar] [CrossRef]
  26. Pandhija, S.; Rai, N.K.; Rai, A.K.; Thakur, S.N. Contaminant Concentration in Environmental Samples Using LIBS and CF-LIBS. Appl. Phys. B 2010, 98, 231–241. [Google Scholar] [CrossRef]
  27. Du, C.; Ma, Z.; Zhou, J.; Goyne, K.W. Application of Mid-Infrared Photoacoustic Spectroscopy in Monitoring Carbonate Content in Soils. Sens. Actuators B Chem. 2013, 188, 1167–1175. [Google Scholar] [CrossRef]
  28. Volkov, D.S.; Rogova, O.B.; Proskurnin, M.A. Photoacoustic and Photothermal Methods in Spectroscopy and Characterization of Soils and Soil Organic Matter. Photoacoustics 2020, 17, 100151. [Google Scholar] [CrossRef] [PubMed]
  29. Nikolić, P.M.; Luković, D.T.; Nikolić, M.V.; Djurić, S.; Savić, S.M.; Milovanović, A.M.; Ukić, S.R.; Stamenović, B. Photoacoustic Characterization of Natural Mineral Pyrite (FeS2). Eur. Phys. J. Spec. Top. 2008, 153, 187–189. [Google Scholar] [CrossRef] [Green Version]
  30. Stucki, J.W.; Banwart, W.L. (Eds.) Advanced Chemical Methods for Soil and Clay Minerals Research; Springer: Dordrecht, The Netherlands, 1980; ISBN 978-94-009-9096-8. [Google Scholar]
  31. Alstadt, K.N.; Katti, D.R.; Katti, K.S. An in Situ FTIR Step-Scan Photoacoustic Investigation of Kerogen and Minerals in Oil Shale. Spectrochim. Acta Part A Mol. Biomol. Spectrosc. 2012, 89, 105–113. [Google Scholar] [CrossRef]
  32. NIST: Atomic Spectra Database Lines Form. Available online: https://physics.nist.gov/PhysRefData/ASD/lines_form.html (accessed on 27 July 2022).
  33. Balat-Pichelin, M.; Iacono, J.; Boubert, P. Recombination Coefficient of Atomic Oxygen on Ceramic Materials in a CO2 Plasma Flow for the Simulation of a Martian Entry. Ceram. Int. 2016, 42, 2761–2769. [Google Scholar] [CrossRef]
  34. Giacomo, A.D.; Hermann, J. Laser-Induced Plasma Emission: From Atomic to Molecular Spectra. J. Phys. D Appl. Phys. 2017, 50, 183002. [Google Scholar] [CrossRef]
  35. Álvarez, C.; Pisonero, J.; Bordel, N. Quantification of Fluorite Mass-Content in Powdered Ores Using a Laser-Induced Breakdown Spectroscopy Method Based on the Detection of Minor Elements and CaF Molecular Bands. Spectrochim. Acta Part B At. Spectrosc. 2014, 100, 123–128. [Google Scholar] [CrossRef]
  36. The Band Spectra of the Alkaline Earth Halides. I.—CaF, SrF | Proceedings of the Royal Society of London. Series A, Containing Papers of a Mathematical and Physical Character. Available online: https://royalsocietypublishing.org/doi/abs/10.1098/rspa.1929.0012 (accessed on 26 July 2022).
  37. Cremers, D.A.; Radziemski, L.J. Handbook of Laser-Induced Breakdown Spectroscopy, 2nd ed.; Wiley, A John Wiley & Sons, Ltd., Publication: Chichester, UK, 2013; ISBN 978-1-118-56736-4. [Google Scholar]
  38. Hahn, D.W.; Omenetto, N. Laser-Induced Breakdown Spectroscopy (LIBS), Part II: Review of Instrumental and Methodological Approaches to Material Analysis and Applications to Different Fields. Appl. Spectrosc. AS 2012, 66, 347–419. [Google Scholar] [CrossRef]
  39. Aguilera, J.A.; Aragón, C.; Madurga, V.; Manrique, J. Study of Matrix Effects in Laser Induced Breakdown Spectroscopy on Metallic Samples Using Plasma Characterization by Emission Spectroscopy. Spectrochim. Acta Part B At. Spectrosc. 2009, 64, 993–998. [Google Scholar] [CrossRef]
  40. Parigger, C.G.; Drake, K.A.; Helstern, C.M.; Gautam, G. Laboratory Hydrogen-Beta Emission Spectroscopy for Analysis of Astrophysical White Dwarf Spectra. Atoms 2018, 6, 36. [Google Scholar] [CrossRef]
  41. El Sherbini, A.M.; Hegazy, H.; El Sherbini, T.M. Measurement of Electron Density Utilizing the Hα-Line from Laser Produced Plasma in Air. Spectrochim. Acta Part B At. Spectrosc. 2006, 61, 532–539. [Google Scholar] [CrossRef]
  42. Griem, H.R. Cambridge monographs on plasma physics. In Principles of Plasma Spectroscopy, 1st ed.; Cambridge University Press: Cambridge, UK, 2005; ISBN 978-0-521-61941-7. [Google Scholar]
  43. Henn, U.; Schultz-Güttler, R. Review of Some Current Coloured Quartz Varieties. J. Gemmol. 2012, 33, 29–34. [Google Scholar] [CrossRef]
  44. Nunes, E.H.M.; Lameiras, F.S.; Houmard, M.; Vasconcelos, W.L. Spectroscopic Study of Natural Quartz Samples. Radiat. Phys. Chem. 2013, 90, 79–86. [Google Scholar] [CrossRef]
  45. Gu, H.; Ma, D.; Chen, W.; Zhu, R.; Li, Y.; Li, Y. Electrolytic Coloration and Spectral Properties of Natural Fluorite Crystals Containing Oxygen Impurities. Spectrochim. Acta Part A Mol. Biomol. Spectrosc. 2011, 82, 327–331. [Google Scholar] [CrossRef]
  46. Kempe, U.; Plötze, M.; Brachmann, A.; Böttcher, R. Stabilisation of Divalent Rare Earth Elements in Natural Fluorite. Mineral. Petrol. 2002, 76, 213–234. [Google Scholar] [CrossRef]
  47. Shcheulin, A.S.; Angervaks, A.E.; Semenova, T.S.; Koryakina, L.F.; Petrova, M.A.; Fedorov, P.P.; Reiterov, V.M.; Garibin, E.A.; Ryskin, A.I. Additive Colouring of CaF2:Yb Crystals: Determination of Yb2+ Concentration in CaF2:Yb Crystals and Ceramics. Appl. Phys. B 2013, 111, 551–557. [Google Scholar] [CrossRef]
  48. Gazali, Z.; Kumar, R.; Rai, P.K.; Rai, P.K.; Rai, A.K.; Thakur, S.N. Discrimination of Gallbladder Stone Employing Laser-Induced Breakdown Spectroscopy (LIBS) and Photoacoustic Spectroscopy (PAS). Spectrochim. Acta Part A Mol. Biomol. Spectrosc. 2021, 260, 119948. [Google Scholar] [CrossRef]
  49. Awasthi, S.; Kumar, R.; Rai, A.K. In Situ Analysis of Fireworks Using Laser-Induced Breakdown Spectroscopy and Chemometrics. J. Appl. Spectrosc. 2017, 84, 811–815. [Google Scholar] [CrossRef]
  50. Yang, N.; Eash, N.S.; Lee, J.; Martin, M.Z.; Zhang, Y.-S.; Walker, F.R.; Yang, J.E. Multivariate Analysis of Laser-Induced Breakdown Spectroscopy Spectra of Soil Samples. Soil Sci. 2010, 175, 447–452. [Google Scholar] [CrossRef]
Figure 1. X-ray diffraction (XRD) pattern of white, pale green, and green zone of the sample showing the presence of mineral quartz (d spacing = 4.18, 3.33, and 1.67 Å) in the white zone, quartz-fluorite in the pale green zone and fluorite (d spacing = 3.13, 1.92, and 1.64 Å) in the green zone.
Atoms 10 00133 g001
Figure 2. LIBS spectra of white, pale green (diffusion), and green regions of the sample in the wavelength range of 230–850 nm.
Atoms 10 00133 g002
Figure 3. LIBS spectra of white, pale green (diffusion), and green zones of the sample in the wavelength range of 685–720 nm, showing the presence of fluorine in the green and diffusion zones.
Atoms 10 00133 g003
Figure 4. LIBS spectra of the white, diffusion, and green zones of the sample in the wavelength range of 528–630 nm, depicting the molecular bands of CaF (orange and green systems).
Atoms 10 00133 g004
Figure 5. LIBS spectra of green zone recorded at different gate delays representing the evolution of molecular band of CaF over time.
Atoms 10 00133 g005
Figure 6. Temporal evolution of atomic, ionic lines of Ca and the CaF molecular band at 612.2 nm, 373.7 nm, and 535.1 nm, respectively.
Atoms 10 00133 g006
Figure 7. Temporal evolution of (a) plasma temperature and (b) electron density with varying gate delays. Data points are fitted with a power2 function in the MATLAB program. The constants are provided in the figure.
Atoms 10 00133 g007
Figure 8. Photoacoustic spectra of quartz-fluorite sample recorded for (a) white zone, (b) diffusion zone, and (c) green zone.
Atoms 10 00133 g008
Figure 9. UV-VIS spectra of quartz-fluorite sample recorded for (a) white zone, (b) diffusion zone, (c) green zone, (d) and pure SiO2 sample (CDH, New Delhi, 99.9% pure).
Atoms 10 00133 g009
Figure 10. The PCA plots of the LIBS data of quartz-fluorite sample representing (a) score plot for white (red circles), diffusion (yellow circles), and green zones (green circles) in the wavelength range of 240–800 nm, (b) loading plot of PC1, and (c) loading plot of PC2 that demonstrates which spectral lines describes variance.
Atoms 10 00133 g010
Figure 11. PCA score plot of the sample applied to the wavelength region of CaF molecular band (530–630 nm) demonstrating 99% of total variance.
Atoms 10 00133 g011
Figure 12. Photograph of the quartz fluorite composite procured from an amygdaloidal basalt from Deccan Traps, India.
Atoms 10 00133 g012
Table 1. EPMA results of the white and green zones of the sample.
SiO2 (wt.%)CaO (wt.%)F (wt.%)Total (wt.%)
White zone97.89 ± 8.90.01 ± 0.0030.39 ± 0.0198.29 ± 8.91
Green Zone0.16 ± 0.0155.41 ± 2.145.62 ± 1.882.10 ± 3.91
Table 2. Wavelength of persistence lines of atomic and ionic emission of elements found in the sample.
Sr. No.ElementsWavelength (nm) Corresponding to the Persistent Atomic/Ionic Emissions Found in the Sample
1H656.2
2C247.8
3N744.2, 746.8, 867.9, 868.2
4O777.1, 777.3, 844.5
5F685.6, 690.2, 690.9, 703.7, 712.8
6Na588.9, 589.5
7Mg285.2, 516.7, 517.2, 518.3, 279.0, 279.5, 279.8, 280.2
8Al308.2, 309.2, 394.3, 396.1
9Si250.6, 251.4, 251.6, 251.9, 252.4, 252.8, 288.1, 504.0, 505.6, 636.6, 637.0
10 K766.4, 769.8
11Ca315.9, 317.9, 370.6, 373.7, 393.5, 396.7, 422.6, 442.5, 443.4, 445.4, 558.8, 610.2, 612.1, 616.2, 616.9
12Fe238.2, 239.5, 240.5, 248.3, 271.9, 374.9, 375.8
Table 3. Most intense CaF headbands in the “orange and green systems” observed in the LIBS spectra of the green and pale green regions.
Orange System A2Π–X2ΣGreen System B2Σ–X2Σ
λ (nm)Relative IntensityTransitionλ (nm)Relative IntensityTransition
606.4410(0,0)529.1010(0,0)
606.239(1,1)529.299(0,0)
606.048(2,2)529.688(1,1)
605.867(3,3)529.868(1,1)
Publisher’s Note: MDPI stays neutral with regard to jurisdictional claims in published maps and institutional affiliations.